TRANSIENT THERMAL SIMULATION OF HIGH POWER · PDF fileTRANSIENT THERMAL SIMULATION OF HIGH...
4
Electrical Engineering TRANSIENT THERMAL SIMULATION OF HIGH POWER LED AND ITS CHALLENGES Target, Benefit and Application The goal of the project is to create and optimize an FE model for a family of high power LED. Signal Processing The time-dependent temperature data are read by Extraction Tool Kit. The measured Zth(t) is also imported as a reference input. Sensitivity analysis and optimization Based on DoE the design points are generated and the parame- ters are optimized for one LED module of the family (see Fig. 3). Results and conclusion • The calibrated parameters are used to simulate the other LED modules of the LED family. • The simulation results fit well to the measured Zth curve. • The validation range of the optimized parameters is therefore confirmed for the whole LED module family. Fig. 1: 2-chip LED Model Fig. 2: Schematic Diagram of factors influencing tran- sient thermal simulation Fig. 3: Schematic explanation of Calibration process Fig. 4: Calibrated results for 2-chip LED module Contact | Technische Hochschule Ingolstadt | Institut für Innovative Mobilität und ressourcenschonende Antriebstechnologien | Team Aufbau- und Verbindungs-technik (AVT) und Optoelektronik | M.Sc. E Liu | [email protected] In cooperation with OSRAM Opto Semiconductors
Transcript of TRANSIENT THERMAL SIMULATION OF HIGH POWER · PDF fileTRANSIENT THERMAL SIMULATION OF HIGH...

Electrical Engineering
TRANSIENT THERMAL SIMULATION OFHIGH POWER LED AND ITS CHALLENGES
Target, Benefi t and ApplicationThe goal of the project is to create and optimize an FE model for a family of high power LED.
Signal ProcessingThe time-dependent temperature data are read by Extraction Tool Kit. The measured Zth(t) is also imported as a reference input.
Sensitivity analysis and optimizationBased on DoE the design points are generated and the parame-ters are optimized for one LED module of the family (see Fig. 3).
Results and conclusion• The calibrated parameters are used to simulate the other
LED modules of the LED family.• The simulation results fi t well to the measured Zth curve.• The validation range of the optimized parameters is
therefore confi rmed for the whole LED module family.
Fig. 1: 2-chip LED Model
Fig. 2: Schematic Diagram of factors infl uencing tran-sient thermal simulation
Fig. 3: Schematic explanation of Calibration process Fig. 4: Calibrated results for 2-chip LED module
Contact | Technische Hochschule Ingolstadt |
Institut für Innovative Mobilität und ressourcenschonende Antriebstechnologien |
Team Aufbau- und Verbindungs-technik (AVT) und Optoelektronik | M.Sc. E Liu | [email protected]
In cooperation with
OSRAM Opto Semiconductors

Civil Engineering
ENGINEERING FRAMEWORK FOR OPTIMIZING GLUED LAMINATED TIMBER
MotivationDue to the natural growth process of trees, wooden boards, ty-pically used for structural load bearing elements, show a high amount of random fl uctuation in their mechanical properties. To improve the competitiveness of wooden structural elements against other building materials, a numerical tool, able to con-sider the impact of random stiffness fl uctuations of wooden boards on the performance of glued laminated timber (GLT), is developed.
MethodologyThe mechanical properties of each board are obtained on basis of measurements collected during the grading process and are condensed into so-called stiffness profi les (cf. Fig. 1). Based the-reon, a probabilistic material model is developed for the random generation of an arbitrary number of stiffness profi les.
Then, on basis of the probabilistic material model and a 2D fi -nite element analysis (see Fig. 2), the displacement fi eld and stresses can be computed. This procedure is tightly integrated into the optiSLang workfl ow to determine the relevant para-meters (Fig. 3). For this, the governing random displacement fi eld is identifi ed by employing the SoS library. Subsequently, application of ARSM leads to the optimal design parameters of the user-defi ned structure.
ConclusionThrough the knot morphology, mechanical models for wood on the microscale are linked to the mechanical behaviour of wooden boards at the macroscale. By incorporating these re-sults into the design workfl ow, a fully probabilistic assessment of glued laminated timber beam systems and their sensitivity to material variability is possible.
Fig. 2: (a) Random spatial distribution of stiffness values generated from random process model and (b) result-ing stress distribution. Regions with abnormal stress peaks due to the heterogeneous material model are marked in red.
Fig. 3: Results of sensitivity analysis and MOP can be assessed, since the tool is tightly implemented into the optiSLang and SoS workfl ow.
Fig. 1: (a) For a regular board, (b) a knot fi tting algorithm automatically reconstructs the 3D knot geometry.(c) After grouping, only the most important knot groups are retained in the model. In (d), stiffness profi le results computed by two distinct approaches are displayed.
Contact Dipl.-Ing. Dr. techn. Georg Kandler | Institute for Mechanics of Materials and Structures
TU Wien | Karlsplatz 13/202 | 1040 Vienna | Austria
Promoted out of funds of the City Council
of Vienna by Vienna Business Agency.
A trust of Vienna City council.

Medical Science
PATIENT SPECIFIC 3D MODELS FOR VIRTUAL OPERATION PLANNING IN PLASTIC SURGERY
Objective, benefi t and practical useThe objective is to develop a workfl ow which generates para-meterized patient specifi c 3D body surface models of different anatomical regions using the example of the female breast. In plastic surgery, the evaluation of changes of the body surface is based mostly on simple 2D images. Thus, it is diffi cult for sur-geons to gain any objective evaluations of the changes after a surgery. However, an objective and quantifi able evaluation is necessary for individual surgery planning. For the evaluati-on, it is also important to conduct a long time investigation of the healing process after a surgery. By using parameterized 3D surface models, it is possible to make quantitative predictions of these changes.
Surface fi tting and template modelsNowadays, the 3D surface scans often show holes and other artefacts. To improve the quality, a standard template model was developed which can be fi tted to the scan. Thus, patient specifi c and artefact free parameterizable surface models can be generated. On the fi tted models, one can measure anato-mical parameters like special distances and the volume of the breast (Fig. 1). This allows a quantitative evaluation of the sur-face scan. An enhancement is the fi tting of a volumetric mo-del to a surface. Such a model can be used for patient specifi c simulation and the selection of different implant layouts in ANSYS Workbench (Fig. 2).
ParametrizationThe standardized structure of the fi tted patient specifi c templa-te models enables the development of a parameterized model using medical and anatomical parameters. Here, the software “Statistics on Structure” identifi es characteristic parameters and generates fi eld meta models (Fig. 3). Through variation of the pa-rameters, the changes of the body surface can be predicted.
Fig. 1: Anatomical measurements on template model
Fig. 2: Results of simulation
Fig. 3: A shape function in Statistics on Structures (SoS)
ContactCADFEM GmbH | M. Sc. Eric Quadrat | [email protected] | Tel: +49 8092-700537
Geomethermie
STUDIE ÜBER DIE EINBINDUNG EINER HYDROTHERMALEN WÄRMEQUELLE
MotivationDie Stadtwerke Energie Jena-Pößneck GmbH plant, den Anteil erneuerbarer Energien an der Fernwärmeerzeugung weiter zu erhöhen und prüft dafür die Integration von Geothermie ins Je-naer Fernwärmenetz. Im Rahmen des GREEN-Invest Förderpro-gramms der Thüringer Aufbaubank erfolgt eine Untersuchung zur technischen und wirtschaftlichen Machbarkeit im Stadtge-biet von Jena.
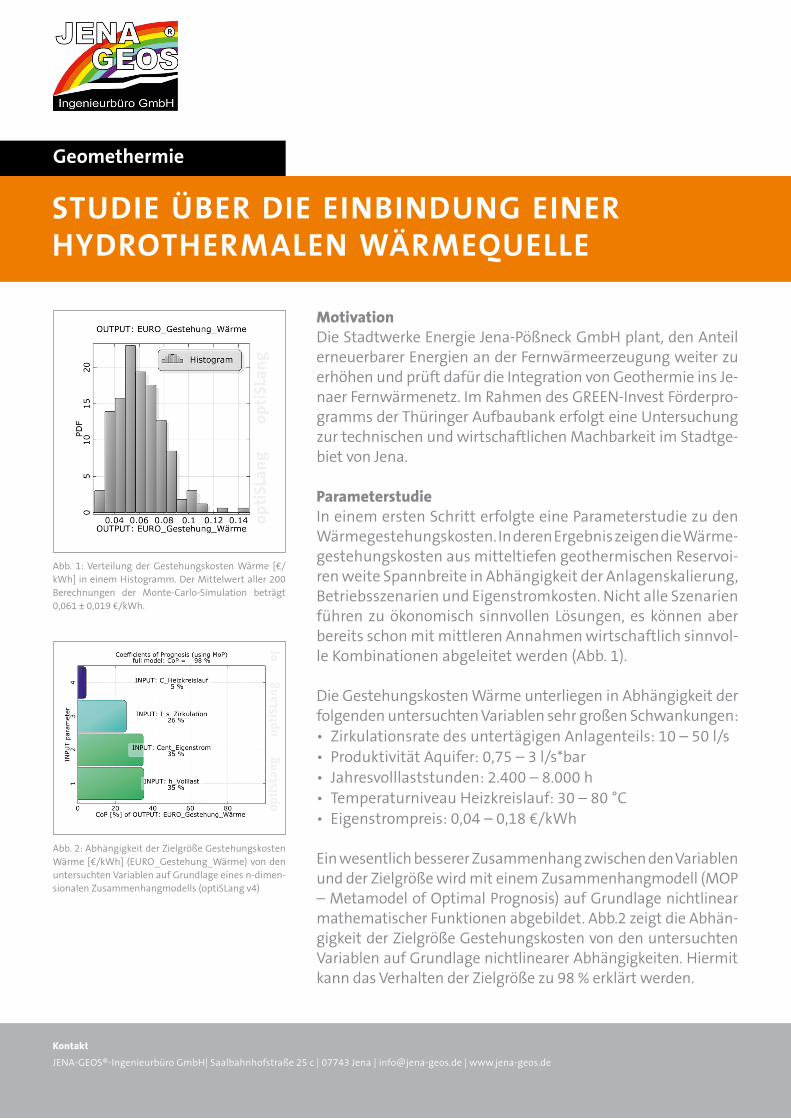
ParameterstudieIn einem ersten Schritt erfolgte eine Parameterstudie zu den Wärmegestehungskosten. In deren Ergebnis zeigen die Wärme-gestehungskosten aus mitteltiefen geothermischen Reservoi-ren weite Spannbreite in Abhängigkeit der Anlagenskalierung, Betriebsszenarien und Eigenstromkosten. Nicht alle Szenarien führen zu ökonomisch sinnvollen Lösungen, es können aber bereits schon mit mittleren Annahmen wirtschaftlich sinnvol-le Kombinationen abgeleitet werden (Abb. 1).
Die Gestehungskosten Wärme unterliegen in Abhängigkeit der folgenden untersuchten Variablen sehr großen Schwankungen: • Zirkulationsrate des untertägigen Anlagenteils: 10 – 50 l/s • Produktivität Aquifer: 0,75 – 3 l/s*bar• Jahresvolllaststunden: 2.400 – 8.000 h• Temperaturniveau Heizkreislauf: 30 – 80 °C• Eigenstrompreis: 0,04 – 0,18 €/kWh
Ein wesentlich besserer Zusammenhang zwischen den Variablen und der Zielgröße wird mit einem Zusammenhangmodell (MOP – Metamodel of Optimal Prognosis) auf Grundlage nichtlinear mathematischer Funktionen abgebildet. Abb.2 zeigt die Abhän-gigkeit der Zielgröße Gestehungskosten von den untersuchten Variablen auf Grundlage nichtlinearer Abhängigkeiten. Hiermit kann das Verhalten der Zielgröße zu 98 % erklärt werden.
Abb. 1: Verteilung der Gestehungskosten Wärme [€/kWh] in einem Histogramm. Der Mittelwert aller 200 Berechnungen der Monte-Carlo-Simulation beträgt 0,061 ± 0,019 €/kWh.
Abb. 2: Abhängigkeit der Zielgröße Gestehungskosten Wärme [€/kWh] (EURO_Gestehung_Wärme) von den untersuchten Variablen auf Grundlage eines n-dimen-sionalen Zusammenhangmodells (optiSLang v4)
KontaktJENA-GEOS®-Ingenieurbüro GmbH| Saalbahnhofstraße 25 c | 07743 Jena | [email protected] | www.jena-geos.de