Transient Evolution of Rheological Properties of Dense ...
33
Transient Evolution of Rheological Properties of Dense Granular Inertial Flow Under Plane Shear Xuejie Zhang Hefei University of Technology https://orcid.org/0000-0001-6750-843X Wei Wang Hefei University of Technology Xiaojun Liu Hefei University of Technology Kun Liu ( [email protected] ) Hefei University of Technology Research Article Keywords: Rheology, Dense granular inertial ァow, Transient, Internal friction coeィcient, Shear strength Posted Date: August 2nd, 2021 DOI: https://doi.org/10.21203/rs.3.rs-735864/v1 License: This work is licensed under a Creative Commons Attribution 4.0 International License. Read Full License
Transcript of Transient Evolution of Rheological Properties of Dense ...

Transient Evolution of Rheological Properties ofDense Granular Inertial Flow Under Plane ShearXuejie Zhang
Hefei University of Technology https://orcid.org/0000-0001-6750-843XWei Wang
Hefei University of TechnologyXiaojun Liu
Hefei University of TechnologyKun Liu ( [email protected] )
Hefei University of Technology
Research Article
Keywords: Rheology, Dense granular inertial �ow, Transient, Internal friction coe�cient, Shear strength
Posted Date: August 2nd, 2021
DOI: https://doi.org/10.21203/rs.3.rs-735864/v1
License: This work is licensed under a Creative Commons Attribution 4.0 International License. Read Full License

1
Transient evolution of rheological properties of dense
granular inertial flow under plane shear
Xuejie Zhang, Wei Wang, Xiaojun Liu, Kun Liu*
Institute of Tribology, School of Mechanical Engineering, Hefei University of
Technology, Hefei, Anhui, 230009, China
*Corresponding author: Kun Liu, [email protected]
Abstract: Exploration on the transient evolution of the rheological properties of dense
granular inertial flow is essential for revealing how the balance is established between
the boundary drive strength and the internal shear strength. In this paper, discrete
element method simulations are performed to study the transient flow characteristics of
a dense granular system under plane shear in the inertial regime. To this end, we
quantitatively analyze the changes in the system’s flow state, interfacial friction
coefficient, internal friction coefficient, and microstructure. Simulation results show
that the evolution of the horizontal flow experiences three typical stages, namely
transmission, adjustment, and stabilization. Meanwhile, the shear dilatancy caused by
the vertical movement of particles, gradually loosens the filling state, weakens the
spatial geometric constraint and the system’s tangential load-bearing capacity, thereby
decreasing the interfacial friction coefficient and reducing the boundary drive strength.
On the other hand, the variations in the anisotropies of both contact orientation and
contact forces, increase the internal friction coefficient and improve the internal shear
strength. Therefore, the evolution of flow state from initially static to finally stable
reduces the boundary drive strength while enhances the internal shear strength, and
eventually a balance between them is achieved. Distinguished from the
micromechanical behaviors, under different shear velocities the internal shear strength
always mainly originates from the anisotropies in contact orientation and in normal
contact force. Moreover, the contribution of the anisotropy in contact orientation
becomes more predominant with the increase of shear velocity.
Keywords: Rheology; Dense granular inertial flow; Transient; Internal friction
coefficient; Shear strength

2
1. Introduction
Under shear, granular materials exhibit fascinating properties capable of sustaining
stress as a solid, or flowing as a fluid [1-3]. The granular flow has motivated many
studies over the past decades, since the rheological properties of dense granular
materials play an important role in various natural phenomena and industrial
applications such as geographical faults, powder metallurgy, three-body friction, and
particle flow lubrication [4-10]. Generally, three different granular flow regimes are
categorized according to the flow state, including quasi-static regime, inertial regime,
and collisional regime [11-14]. In the inertial regime, when a dense granular system is
subjected to continuous shear, a local flow near the boundary is first generated after the
initial static equilibrium is broken, and gradually a global flow will be achieved and
maintained stable finally. Meanwhile, the shear flow is accompanied with dilatancy,
which represents the volume expansion of the granular system [15-18]. Two
representative quantities, i.e., the interfacial friction coefficient and the shear strength,
are most commonly employed to characterize the rheological properties of dense
granular flow [19-23]. The interfacial friction coefficient μ can be understood as the
drive strength provided by the boundary for maintaining the particle flow, defined as
the ratio of the shear stress 𝜏 on the shear boundary to the confining pressure 𝑃 [21-
26]. On the other hand, the shear strength of a granular material with respect to a
specific plane inside the material and a given normal stress 𝜎𝑛 acting on it, is the
maximum shear stress 𝜏𝑝 on that plane that the material can withstand before failure
happens by shear deformation [27-29]. According to the Mohr-Coulomb yield criterion, 𝜏𝑝 is proportional to the normal stress 𝜎𝑛 for cohesionless materials, and the shear
strength is typically characterized by the friction angle 𝜙, defined as 𝜇∗ = 𝑡𝑎𝑛ϕ =𝜏𝑝/𝜎𝑛 which is also referred to as the internal friction coefficient. Alternatively, the
internal friction angle 𝜙 can be expressed in terms of stress invariants, given as 𝑠𝑖𝑛𝜙 = 𝑞/𝑝, where 𝑞 is the average stress and 𝑝 is the stress deviator [13, 19, 30].
In the steady state, these two coefficients are approximately equal, and can be unified
as the effective friction coefficient 𝜇𝑒.

3
The interfacial friction characteristics could be influenced by several geometry factors,
including the boundary surface structure, the thickness of particle layers, the shape and
the constrained extent of particles [29-34]. Moreover, the interfacial friction coefficient
μ has a significant dependence on the shear velocity and the applied load [35-37]. Most
experimental studies on the interfacial friction characteristics deal with local shear
deformation, where stick-slip or particle flow only occurs near the boundary due to
either the small shear velocity or the short shear duration. However, when the boundary
shear velocity is large and the shear time is long enough, the system will reach a stable
flow state eventually. In the steady inertial flow state, the interfacial friction coefficient
μ is a constant value and independent on the initial filling state of the dense granular
system. For rigid dry granular materials, the flow state can be measured by the
dimensionless inertial number I, which represents the ratio of the inertia force to the
confining pressure [11, 38, 39]. Numerous experimental and simulation results have
confirmed that, in the inertia regime, the interfacial friction coefficient μ monotonically
increases as a function of the inertia number I [21-23, 39-41]. It is a familiar feature of
granular rheology that the interfacial friction coefficient μ is closely related to the
system’s flow state during the shear process.
On the other hand, the interparticle contact and contact forces exhibit fabric
anisotropies, which are the microscopic origins of the internal shear strength [13, 19,
42-44]. At the microscopic scale, particles transfer forces through interparticle contacts.
The variation of flow state changes the contact status and the force transmission paths
between particles, thereby altering the topology of the microscopic contact network and
the characteristics of force chains [43-46]. As a result, the shear strength significantly
changes during the inertial flow due to the temporal and spatial variations in the
topology of the force chains. Currently, much attention has been paid to analyzing the
granular shear strength under the static filling or the stable inertial flow situations. For
the stationary granular system, the internal shear strength is independent on the size
polydispersity of the filled particles [47-49]. In addition, the influences of the different
particle shapes on the internal shear strength were also investigated [13, 29-31, 50-54].

4
As for the stable inertial flow state, Azéma et al. [13] compared the rheological
properties of a frictionless granular system between pentagonal particles and circular
discs. Binaree et al. [29] further explored the integrated effects of inter-particle friction
and particle shape on the internal shear strength. Besides, the rheological properties and
microstructure characteristics of some cohesive granular systems were investigated [41,
55-57], where the effect of viscosity on the internal shear strength was discussed.
By virtue of the above-mentioned studies, the steady rheological properties of dense
granular materials have been well studied under the equilibrium condition, where the
boundary drive strength is balanced with the internal shear strength. However, it is still
not clear regarding how the balance between the two strength quantities is gradually
established in the continuous shear process, which requires a dedicate investigation on
the transient evolution of the rheological properties. The plane shear system is the most
commonly used model for exploring the particle flow behaviors, owing to its simplicity
in the composing structure and the motion manner. Additionally, under steady flow state,
the flow velocity linearly increases along the height, which can be used as a criterion
for judging whether the system reaches stable [58]. Discrete element method (DEM)
serves as a powerful tool for studying the mechanical properties of granular materials,
because it can extract the microscopic information of individual particles but also
analyze the macroscopic behaviors of the whole granular system [59, 60]. Therefore,
this paper employs DEM to analyze the transient flow process of a plane shear system,
by carefully characterizing the evolution principles of the flow state, the mechanical
behaviors, as well as the microstructure characteristics at different moments. Moreover,
we clarify the influences of flow state on both the interfacial and internal friction
coefficients, and finally reveal the relationship between the boundary drive strength and
the internal shear strength. In addition, the influences of the shear velocity are explored.

5
2. DEM Model and theory
2.1 DEM method of plane shear
In the two-dimensional DEM model, the granular material is described as a collection
of discrete discs. The contact force dependent on the force-displacement relationship
between particles is defined by the soft contact method. The motion information of each
particle is derived from its own unbalanced force using the Newton's second law. As
shown in Fig. 1(a), the dense granular material is consisted by 𝑁𝑝 = 2 × 10⁴
cohesionless rigid disc particles with an average diameter of 𝑑 = 1 mm. The system’s
solid fraction is 𝜀 = 0.84. Initially, the system’s length along x-axis is 𝐿 = 200𝑑, and
the height along y-axis is 𝐻 = 96𝑑 . Compared with similar studies, the number of
particles consisted in this simulation model is large enough to ensure the statistical
confidence of the analysis results. The particle size distribution polydispersity is set 20%
to avoid crystallization. The top and bottom plates are rough boundaries formed by the
bonding monodisperse particles with diameter 𝑑 , while the side walls are periodic
boundaries. During shear, the bottom plate is fixed, and the top plate slides tangentially
at a constant velocity 𝑉𝑥 and applies a constant normal stress 𝑃 to the granular system.
Fig. 1 (a) Two-dimensional DEM model of dense granular system under plane shear, (b)
linear contact model between particles
For the cohesionless rigid particles, a linear contact model (spring-dashpot model) is

6
used to define the contact force between particles, as shown in Fig. 1(b). The linear
model consists of two parts, namely a stiffness model and a slip model. The stiffness
model provides a linear elastic relationship between contact force and relative
displacement. The normal contact force 𝐹𝑐𝑛 is composed by the normal linear force
and the normal damping force, written as 𝐹𝑐𝑛 = 𝐹𝑐𝑙𝑛 + 𝐹𝑐𝑑𝑛 = 𝑘𝑛𝑔𝑠 + 𝑑𝑛𝑔�̇�, where 𝑘𝑛
is the normal contact stiffness, 𝑑𝑛 is the normal damping coefficient, 𝑔𝑠 is the
surface gap between particles, and 𝑔�̇� is the relative normal translation velocity. For
dry granular materials, the normal contact force between particles is always
compressive, so the equation 𝐹𝑐𝑙𝑛 + 𝐹𝑐𝑑𝑛 ≤ 0 satisfies. The tangential contact force 𝐹𝑐𝑠
is incrementally updated using 𝐹𝑐𝑠 = 𝐹𝑐𝑜𝑠 + ∆𝐹𝑐𝑠, ∆𝐹𝑐𝑠 = 𝑘𝑡∆𝛿𝑠 + 𝑑𝑡∆𝛿𝑠̇ , where 𝑘𝑡 is
the tangential stiffness, ∆𝛿𝑠 is the relative tangential displacement increment, 𝑑𝑡 is
the tangential damping coefficient, and ∆𝛿𝑠 is the relative tangential translation
velocity. The relative motion between particles follows the Coulomb relationship |𝐹𝑐𝑠| ≤ 𝜇𝑐𝐹𝑐𝑛, where 𝜇𝑐 is the sliding friction coefficient between particles, dictating
that only when the equal sign is satisfied, relative sliding between particles is allowed.
2.2 Parameters setup
A series of dimensionless parameters related to the particle material properties and the
shear conditions are set according to the references [38, 43], which mainly include the
contact stiffness coefficient 𝑘, the stiffness ratio 𝑠, and the restitution coefficient 𝑒.
The dimensionless contact stiffness coefficient 𝑘 = 𝑘𝑛 𝑃⁄ measures the rigidity of
particle and limits the maximum deformation of particle under external load, where 𝑃
is the applied normal stress, and 𝑘𝑛 is the normal contact stiffness. In detail, a large
value of k represents rigid particles and a small value represents soft ones. Relevant
studies have shown that once 𝑘 exceeds 104, it will no longer influence the results
because rigid particles are ensured [21, 61]. Therefore, 𝑘 is set to 104 herein. The
stiffness ratio 𝑠 = 𝑘𝑡 𝑘𝑛⁄ takes an empirical value of 0.5. The normal and tangential
damping coefficient 𝑑𝑛 and 𝑑𝑡 are only related to the restitution coefficient 𝑒 once
the stiffness coefficient 𝑘𝑛 and the stiffness ratio 𝑠 are determined, that is, 𝑑𝑛 =

7
2𝛽𝑛√𝑚𝑘𝑛,and 𝑑𝑡 = 2𝛽𝑠√𝑚𝑠𝑘𝑛, where 𝛽𝑠 and 𝛽𝑛 are normal and shear critical-
damping ratios, and 𝛽𝑠 = 𝛽𝑛 = − ln(𝑒) /(𝜋2 + (ln(𝑒))2). The restitution coefficient 𝑒 determines the threshold value for granular system transforming from dense flow to
dilution collision [11]. In order to broaden the range of inertial flow, e is set as a fixed
value of 0.1. The particle-particle and particle-wall friction coefficients are both set to
0.4 and notated as 𝜇𝑐. A combined set of e = 0.1 and 𝜇𝑐 = 0.4 is frequently used in
simulations, because it results in a strong dissipative granular system which well
matches the real situation. The detailed parameters of granular system are listed in Tab.1.
Tab.1 The detailed parameters of granular system
Parameter Symbol Value
Number of particles 𝑁𝑝 20000
Average particle diameter (m) 𝑑 1 × 10⁻³
Polydispersity ±0.2
Particle density (Kg/𝐦𝟑) 𝜌 2210
System width (m) W 0.2
Initial system height (m) H 0.096
Coefficient of friction μ 0.4
Coefficient of restitution e 0.1
Stiffness ratio s 0.5
Contact stiffness number 𝑘 104
Normal stiffness (N/m) 𝑘𝑛 5 × 10⁵
Tangential stiffness (N/m) 𝑘𝑡 2.5 × 10⁵
Based on the range of the inertial number 𝐼 = �̇� 𝑑√𝑃 𝜌⁄ , the flow state of granular
materials can be categorized into three regimes, namely quasi-static regime (𝐼 < 10−4),
inertial regime (10−4 < 𝐼 < 10−1), and collisional regime (𝐼 > 10−1) [23], where �̇�
is the shear rate, 𝑑 is the mean particle diameter, 𝑃 is the normal stress, and 𝜌 is the
particle density. In this study, P is a fixed value of 50 Pa, and the shear velocity of the
top plate is selected within the range of 0.01 m/s ~ 1.5 m/s, resulting in an inertial flow
with I in the range of 6× 10⁻⁴ ~ 0.1. DEM adopts an explicit numerical scheme in
the calculation process, where the Newton's second law needs to be repeatedly called
to update the particle’s position and inter-particle contact information. During the

8
simulation process, the instantaneous micromechanical information is obtained by an
interval of every 1000 steps, including particle’s position and velocity, contact position
and contact force, in order to monitor the evolution of flow state and multi-scale
mechanical behaviors.
2.3 Calculation methods of friction coefficients
Here we clarify the calculation methods of the interfacial friction coefficient μ and the
internal friction coefficient 𝜇∗ . For the plane shear system, the interfacial friction
coefficient μ is the ratio of the total tangential force 𝐹𝑇 to the total normal force 𝐹𝑁
at all contact points between the top plate and the top layer particles,
𝜇 = 𝐹𝑇𝐹𝑁 = ∑ 𝑓𝑐𝑡𝑐∈𝐵∑ 𝑓𝑐𝑛𝑐∈𝐵 (1)
where 𝑓𝑐𝑡 and 𝑓𝑐𝑛 are the tangential force and the normal force on a single contact
point, and 𝑐 ∈ 𝐵 represents the collection of contacts between particles and the top
plate.
Based on the stress-force-fabric relationship proposed by Rothenburg [62], we conduct
a statistical analysis on the distribution functions of contact orientation, normal contact
force, and tangential contact force in polar coordinates, denoted as P(θ), 𝑓𝑛(𝜃), and 𝑓𝑡(𝜃), respectively, where 𝜃 is the angle of unit vector 𝒏 along the contact direction.
These distribution functions provide abundant micromechanical information for
accurately evaluating the anisotropy extent of granular system. Commonly, the first-
order Fourier approximations are employed to describe them: 𝑃(𝜃) ≅ 1 2𝜋⁄ {1 + 𝑎𝑐 cos 2(𝜃 − 𝜃𝑐)} (2a) 𝑓𝑛(𝜃) ≅ 𝑓�̅�{1 + 𝑎𝑛 cos 2(𝜃 − 𝜃𝑛)} (2b) 𝑓𝑡(𝜃) ≅ −𝑓�̅�𝑎𝑡 sin 2(𝜃 − 𝜃𝑡) (2c)
where 𝑎𝑐 represents the anisotropy in contact orientation which is proportional to the
difference in the number of directional contacts between along the maximum and along
the minimum principal stress, 𝑎𝑛 and 𝑎𝑡 describe the directional variation of contact
forces and reflect the load-bearing capacity of granular system, and 𝜃𝑐, 𝜃𝑛, and 𝜃𝑡

9
are the corresponding privileged directions. These parameters give an approximate
expression for the internal friction coefficient 𝜇∗: 𝜇∗ ≅ 12 (𝑎𝑐 + 𝑎𝑛 + 𝑎𝑡) (3)
This equation explains the source of the internal shear strength of granular system
under plane shear.
3. Evolution of the flow state
In this part, we employ the simulation results of 𝑃 = 50 Pa and 𝑉𝑥 = 0.5 m/s as
demo to quantitatively analyze the change of flow state and shear deformation. The
flow state is characterized by the distribution profiles of both the horizontal and the
vertical velocities of particles in the same layer along the system’s height. Specifically,
the horizontal velocity reflecting the rate of shear deformation is the main movement
characteristic of particles, and the vertical velocity is used to analyze the dilatancy
phenomenon.
3.1 Horizontal flow velocity
Fig. 2(a) shows the horizontal velocity distribution contours of all the particles within
the system at six different moments in the evolution process. Overall, under continuous
shear the local flow near the top plate is transferred downward layer by layer, then
gradually expands into the whole system, and finally a global steady flow is formed.
The horizontal velocity decreases from top layer to bottom layer, which is the result of
energy dissipation caused by inter-particle friction and inelastic collisions. Here, the
system’s height is represented by the particle layer number 𝐿𝑝, 𝐿𝑝=𝐻𝑡 𝑑⁄ , where 𝐻𝑡
is the instantaneous height measuring from the bottom plate to the top plate, and 𝑑 is
the average particle diameter. In Fig. 2(b), the average horizontal velocity of particles
in the same layer is plotted in solid line as a function of the layer number, meanwhile
the original data of the horizontal velocities of all the particles are scattered in gray
shadow. The fluctuation represented by the width of the gray shadow is inevitable in
the horizontal velocity, because of the inherent discrete nature of granular materials.

10
Nevertheless, it is observed that the fluctuation is relatively small and uniform
throughout layers except for the area near the top plate. The evolution of horizontal
velocity profile can directly reflect the change of flow status. During the time interval
from 0.1 s to 6.5 s, the flow region expands from the local area near the top plate to the
global system, besides, the horizontal velocity of the already flowing region gradually
increases. Subsequently, the system at 6.5 s displays a global flow but still requires an
adjustment process before reaching a steady flow at 27 s. Therefore, according to the
shape change of the horizontal velocity profiles in Fig. 2(b), the evolution process of
flow status experiences three stages, namely transmission (T), adjustment (A), and
stabilization (S).
On the other hand, the whole system can be simply divided into two sections, i.e., flow
region and non-flow region, written as 𝐻𝑡 = 𝐻𝑡𝐹 + 𝐻𝑡𝑆, where 𝐻𝑡𝐹 is the height of
the flow region, and 𝐻𝑡𝑆 is the height of the non-flow region. Notably, 𝐻𝑡 is a
variable related to the flow state. We further normalize the heights by using 𝐷𝐻𝐹 =𝐻𝑡𝐹 𝐻𝑡⁄ ,and 𝐷𝐻𝑆 = 𝐻𝑡𝑆 𝐻𝑡⁄ . As shown in Fig. 2(c), during the transmission stage 𝐷𝐻𝐹 rapidly increases from 0 to 1, and correspondingly 𝐷𝐻𝑆 decreases from 1 to 0.
During the adjustment and stabilization stages, the granular system always maintains a
global flow state, so 𝐷𝐻𝐹 = 1,and 𝐷𝐻𝑆 = 0.
11
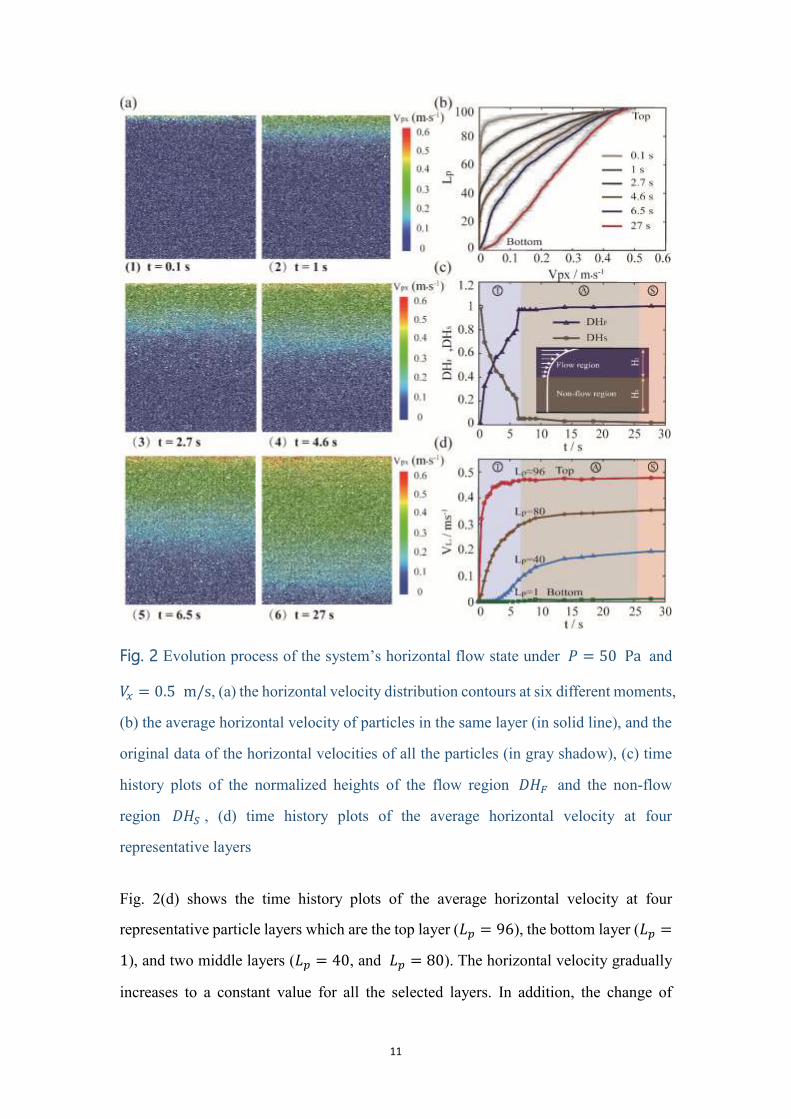
Fig. 2 Evolution process of the system’s horizontal flow state under 𝑃 = 50 Pa and 𝑉𝑥 = 0.5 m/s, (a) the horizontal velocity distribution contours at six different moments,
(b) the average horizontal velocity of particles in the same layer (in solid line), and the
original data of the horizontal velocities of all the particles (in gray shadow), (c) time
history plots of the normalized heights of the flow region 𝐷𝐻𝐹 and the non-flow
region 𝐷𝐻𝑆 , (d) time history plots of the average horizontal velocity at four
representative layers
Fig. 2(d) shows the time history plots of the average horizontal velocity at four
representative particle layers which are the top layer (𝐿𝑝 = 96), the bottom layer (𝐿𝑝 =1), and two middle layers (𝐿𝑝 = 40, and 𝐿𝑝 = 80). The horizontal velocity gradually
increases to a constant value for all the selected layers. In addition, the change of

12
velocity can reflect the evolution process of the system’s flow state. When 𝑉96 ≠ 0
and 𝑉1 = 0, the system is in the flow transmission stage. Once 𝑉1 ≠ 0, transmission
ends and then adjustment begins. When the velocities of the four particle layers reach
constant, the granular system enters into the steady flow stage. Comparing the evolution
characteristics, it is found that the closer to the top plate, the shorter time is required for
the particle layer to reach a stable state. In other words, the growth rate of the horizontal
velocity decreases from top to bottom, which is caused by the layer-by-layer attenuation
of shear momentum.
3.2 Vertical velocity and dilatancy
Dilatancy is the volume expansion observed in granular materials when they are
subjected to shear deformation. Fig. 3 illustrates the shear dilatancy mechanism of
dense granular flow. Initially, the particles are related to each other through contacts
and form a dense packing with the maximum solid fraction, as shown in Fig. 3(a). When
the solid fraction is larger than a critical value, namely the jamming point, a preliminary
dilation is necessary for shear deformation to occur. In other words, if the system’s
height undergoing shear remained fixed, the granular system would be blocked. In order
to avoid blockage, the volume has to be expanded. As shown in Fig. 3(b), when sheared
by the top plate, particles in the flow region cross over the peaks and valleys formed by
the neighboring particles, causing the microscopic arrangement of particles. Whether a
particle is crossing over peak or valley is indicated by the sign of the particle’s vertical
velocity. It is noteworthy that a particle could repeatedly cross over peaks or fall into
valleys during the evolution process. Moreover, as the horizontal velocity increases, the
duration for a particle horizontally moving over a valley is shortened, hence the vertical
distance falling into the valley is reduced, leading to an increase in dilatancy.

13
Fig. 3 Illustration of shear dilatancy in a dense granular system: (a) the initial dense
packing state, (b) the movement of particles under shear
Fig. 4 shows the vertical velocity distribution contours of all the particles at six different
moments in the evolution process. Additionally, the arithmetic average vertical velocity
of particles in the same layer along the height direction is plotted on the right side for
each moment, in order to quantify the dilatancy characteristics. First, it is observed that
the upward and downward moving particles randomly coexist within the system, and
the vertical movement gradually propagates from top to bottom. At 𝑡 = 0.0001 s, the
average vertical velocity is positive over the entire height, suggesting that the granular
system dilates globally. In particular, the particles near the top plate expand rapidly
under shear. Soon after that, the global dilatation is locally replaced as shown at 𝑡 =0.1 s. At 𝑡 = 1 s and 𝑡 = 2.7 s, the dilating region mainly resides near the top plate
(𝐿𝑝 > 80), as the current dilatancy mainly comes from the local shear flow of particles.
At 𝑡 = 4.6 s, the maximum velocity has been transferred from near the top plate (𝐿𝑝 >80) to the middle part (𝐿𝑝 = 50~80), which implies that the dilating region is moving
down due to the propagation of local flow. Moreover, the sign of the average vertical
velocity near the top plate changes from positive to negative. After the system reaches
a stable state (𝑡 = 27 s), the shear dilatancy phenomenon totally disappears, because
the average vertical velocity approaches to almost zero over the entire height.

14
Fig. 4 The vertical velocity distribution contours of all the particles at six different
moments, and the arithmetic average vertical velocity of particles in the same layer
along the height direction under P = 50 Pa and 𝑉𝑥 = 0.5 m/s
4. Evolution of interfacial friction coefficient and shear strength
4.1 Interfacial friction coefficient
This part still uses the simulation results under the conditions of P=50 Pa and 𝑉𝑥 =0.5 m/s to analyze the evolution of the boundary drive strength. Fig. 5 shows the time
history plots of the tangential force 𝐹𝑇, the normal force 𝐹𝑁, and the interfacial friction
coefficient μ, all of which act upon the top plate. In order to maintain the applied
external load constant throughout the evolution process, the position of the top plate

15
must be dynamically adjusted. In detail, once the normal force 𝐹𝑁 on the top plate
exceeds 10 N, the top plate slightly moves upward to reduce the normal force, and vice
versa. Therefore, as shown in Fig. 5(a), the normal force 𝐹𝑁 always fluctuates around
10 N. Additionally, the fluctuation extent is closely related to the flow state, in the way
that the fluctuation is intensive in the transmission stage (T) but mild in the adjustment
(A) and stabilization (S) stages. As previously discussed, the particle flow state near the
top plate changes dramatically at the beginning of the shear, and the horizontal and
vertical velocity increases rapidly. Under this state, the particles collide violently with
the top plate, resulting in large fluctuations in the normal and tangential forces. After
that, the particle flow state changes smoothly, so the fluctuations gradually stabilize.
Fig. 5 The time history plots of the tangential force 𝐹𝑇 (a), the normal force 𝐹𝑁 (b),
and the interfacial friction coefficient μ on the top plate (c), respectively, where P = 50
Pa and 𝑉𝑥 = 0.5 m/s
In Fig. 5(c), the interfacial friction coefficient μ is calculated based on the results of 𝐹𝑁
and 𝐹𝑇 in Figs. 5(a) and 5(b). The dilatancy extent is also plotted on the right axis to
investigate its influence on the interfacial friction. The dilatancy extent is measured by
the expansion of the top plate’s height, 𝜑(𝑡) = 𝐻𝑡−𝐻0𝐻0 × 100%,where 𝐻0 is the initial
height, and 𝐻𝑡 is the height at time 𝑡 . First, it is found that the interfacial friction
coefficient μ gradually decreases to a constant value during evolution. By contrast, 𝜑(𝑡) mainly increases in the transmission stage (T), and remains the maximum value
afterwards. In the transmission (T) stage, dilatancy loosens the system’s spatial

16
geometric constraint thus weakens the tangential load-bearing capacity, making the
interfacial friction coefficient μ drop rapidly, which can be understood as the strain
softening of granular material. However, in the adjustment (A) and stabilization (S)
stages, the flow velocities within the particle layers change very slightly, so the shear
dilatancy rate is close to zero, and the interfacial friction coefficient μ also tends to be
a constant value.
4.2 Spatial distribution of the contact force network
Since the internal shear strength of granular system mainly comes from the anisotropies
in the contact orientation and in the contact forces, it is necessary to get a picture of
their spatial distributions first. Fig. 6(a) clearly presents the contact force network
graphs at six different moments under the conditions of 𝑃 = 50 Pa and 𝑉𝑥 =0.5 m/s . Here, the existence of an inter-particle contact is represented by a line
segment connecting the center of the two contact particles, and the force magnitude 𝑓𝑐
is proportional the line thickness. Furthermore, these contacts can be grouped into
strong contact and weak contact by using the following rule: if the force magnitude 𝑓𝑐
of a given contact is greater than the average value of all the contact force magnitudes ⟨𝑓𝑐⟩, this contact is defined as a strong one; otherwise, it is defined as a weak contact.
In the beginning of the evolution process (𝑡 = 0.1 s), the contact forces are small in
most region except the local area near the top plate. Moreover, most of the strong
contacts are sparsely scattered, thus cannot constitute a strong force chain structure.
The strong force chains are the load-bearing carriers of granular system and are very
sensitive to the change of flow state. In the subsequent transmission (T) stage (0.1 s ~
6.5 s), more strong contacts appear and develop from near the top plate to the entire
granular system, meanwhile they gradually connect with each other and constitute more
strong force chains. In the stable state (𝑡 = 27 s), strong and right-tilted force chains
are distributed within the system to carry the applied load and resist the shear
deformation.

17
Fig. 6 (a) The contact force network graphs at six different moments under the
conditions of P = 50 Pa and 𝑉𝑥 = 0.5 m/s, (b) the time history plots of the strong
contact number 𝑁𝑐𝑠, the weak contact number 𝑁𝑐𝑤, the bearing ratio of strong contacts 𝑅𝑠, and the bearing ratio of weak contacts 𝑅𝑤
Additionally, in order to compare the load-bearing capacities, the bearing ratios of
strong contacts and weak contacts, 𝑅𝑠 and 𝑅𝑤, respectively, are incorporated. 𝑅𝑠 is
calculated by using the sum of the strong contact forces divided by the sum of all contact
forces, given as 𝑅𝑠 = ∑ 𝑓𝑐𝑐∈𝑠∑ 𝑓𝑐 , where 𝑐 ∈ 𝑠 represents the collection of the strong
contacts, and 𝑅𝑠 = 1.0 − 𝑅𝑤. As shown in Fig. 6(b), the changes in the strong contact
number 𝑁𝑐𝑠, the weak contact number 𝑁𝑐𝑤, 𝑅𝑠, and 𝑅𝑤 are quantitatively analyzed.
In the evolution process, though the number of weak contacts 𝑁𝑐𝑤 is always greater
than that of strong contacts 𝑁𝑐𝑠, the bearing ratio of strong contacts 𝑅𝑠 is much greater
than that of weak contacts 𝑅𝑤. Moreover, both the number and the bearing ratio of

18
weak contacts decreases, by contrast, the number of strong contacts also gradually
decreases, but the responsible bearing ratio increases.
4.3 Anisotropies in contact and shear strength
Based on the contact force networks in section 4.2, it is ready to deduce the internal
shear strength by using the stress-force-fabric relationship. First, the three distribution
functions 𝑃(𝜃), 𝑓𝑛(𝜃), and 𝑓𝑡(𝜃) are compared between the initial filling state and
the steady flow state (𝑡 = 27 s), as shown in Fig. 7(a). In the initial filling state, 𝑃(𝜃)
is approximately circular as 𝑎𝑐 ≅ 0 , indicating that the contact orientations are
distributed isotropically. However, the distributions of both the normal and tangential
contact forces are anisotropic with 𝑎𝑛 = 0.237 and 𝑎𝑡 = 0.075 ; particularly, the
anisotropy in the normal contact force is very strong. At this moment, the force chains
are mainly used to carry the applied normal force, but the internal shear strength is
relatively weak so that it is easy for the system to flow. As for the steady flow state,
both the contact orientations and the contact forces exhibit strong anisotropy. The
privileged angles of anisotropy all shift from 0 to 𝜃1. Further, as shown in Fig. 7(b),
during the continuous shear process, both 𝑎𝑐 and 𝑎𝑡 increases sharply and then
gradually approaches a constant value, but the magnitude of 𝑎𝑡 is much smaller than
that of 𝑎𝑐. By constrast, 𝑎𝑛 increases sharply to a peak but then gradually decreases
to a constant value. In the steady state, the ratio of 𝑎𝑐, 𝑎𝑛, and 𝑎𝑡 is 15:19:5, implying
that the anisotropies in contact orientation and in normal contact force are the main
sources of the internal shear strength.

19
Fig. 7 (a) Three distribution functions 𝑃(𝜃) , 𝑓𝑛(𝜃) , and 𝑓𝑡(𝜃) in polar
coordinate system for the initial static and steady flow respectively, (b) time history
plots of the anisotropy parameters 𝑎𝑐, 𝑎𝑛, and 𝑎𝑡, (c) the time history plots of the
interfacial friction coefficient μ and the internal friction coefficient 𝜇∗
Next, the reasons for the changes in the anisotropy parameters are explained in
combination with the system’s internal micromechanical behaviors. In the beginning of
shear, the increase in 𝑎𝑐 and 𝑎𝑛 could be attributed to the potential shear resistance
caused by the spatial geometric constraints. Nevertheless, most particles except a few
ones near the top plate have not undergone shear flow, so the tangential contact force
anisotropy parameter 𝑎𝑡 changes slightly. Since the horizontal flow is the predominant
deformation pattern, the differences in the tangential contact forces are slight, thus 𝑎𝑡
is low and has a small contribution to the internal shear strength. Subsequently, because
the occurance of dilantacy reduces the spatial geometric constraints among particles,
the original particles which bear large normal contact forces lose lateral support and
cannot maintain stability. Once these particles are out of balance, the breakage of the
established contacts causes the decrease in 𝑎𝑛. On the other hand, particle flow reduces

20
the number of contacts especially in the direction of the minimum principal stress,
which leads to a gradual increase in the contact number difference between along the
direction of the maximum principal stress and along the direction of the minimum
principal stress, thus 𝑎𝑐 gradually increases. In short, the increase in 𝑎𝑐 costs the
reduction of 𝑎𝑛, which damages the system’s stability.
The internal friction coefficient 𝜇∗ is obtained according to Equation 3, as shown in
Fig. 7(c). It is found that 𝜇∗ first rapidly increases to the peak, and then gradually drops
to a fixed value. By comparison, it is evident that the evolution trends are opposite
between the internal friction coefficient 𝜇∗ and the interfacial friction coefficient μ.
Moreover, μ is greater than 𝜇∗ until approximately equal in the steady flow state.
Therefore, the flow evolution from static to stable flow under continous shear, is
essentially realized by achieving the final dynamic balance between the boundary drive
strength and the internal shear strength.
5. Effects of shear velocity on rheological properties
5.1 Effects of shear velocity on the transient flow state
Fig. 8 shows the changes of the dimensionless flow region 𝐷𝐻𝐹 and the expansion of
the top plate’s height 𝜑 with time under four different velocities. The evolution
profiles of the horizontal velocity at other velocities are similar to that of 𝑉𝑥 = 0.5 m/s.
Besides, three distinct stages, i.e., transmission (T), adjustment (A), and stabilization
(S) are identified for all the velocities. However, an increase in the shear velocity
strengthens the inertial effect and weakens the microscopic particle rearrangement, thus
reduces the time required for the system achieving a global flow. For example, as shown
in Figs. 8(a), because the microscopic rearrangement is very significant at 𝑉𝑥 =0.1 m/s, the time required for 𝐷𝐻𝐹 increasing from 0 to 1 is about 20 s, which is
much longer compared with the other velocities. On the other hand, as shown in Fig.
8(b), the maximum expansion in height, i.e., the dilantacy extent, increases with shear
velocity. Similarly, at higher velocity, the system requires less time to reach the
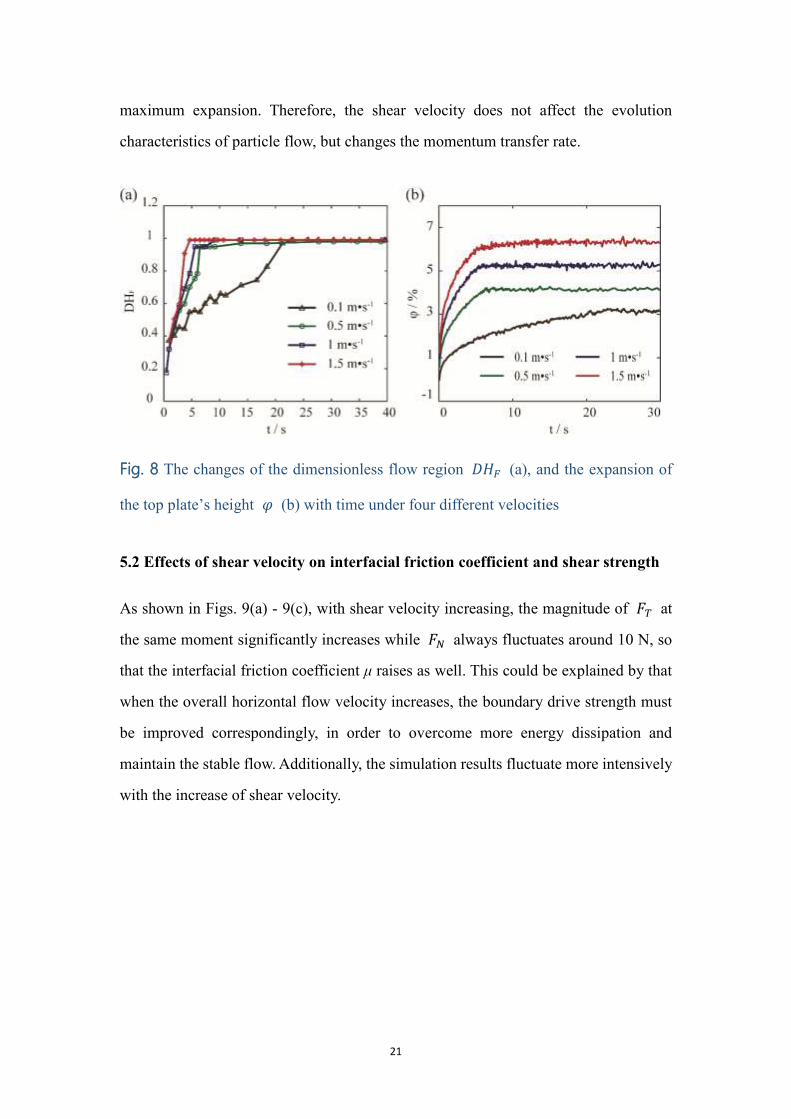
21
maximum expansion. Therefore, the shear velocity does not affect the evolution
characteristics of particle flow, but changes the momentum transfer rate.
Fig. 8 The changes of the dimensionless flow region 𝐷𝐻𝐹 (a), and the expansion of
the top plate’s height 𝜑 (b) with time under four different velocities
5.2 Effects of shear velocity on interfacial friction coefficient and shear strength
As shown in Figs. 9(a) - 9(c), with shear velocity increasing, the magnitude of 𝐹𝑇 at
the same moment significantly increases while 𝐹𝑁 always fluctuates around 10 N, so
that the interfacial friction coefficient μ raises as well. This could be explained by that
when the overall horizontal flow velocity increases, the boundary drive strength must
be improved correspondingly, in order to overcome more energy dissipation and
maintain the stable flow. Additionally, the simulation results fluctuate more intensively
with the increase of shear velocity.

22
Fig. 9 The changes of 𝐹𝑁 (a), 𝐹𝑇 (b), and μ (c) with time under four different
velocities
The anisotropy parameters 𝑎𝑐, 𝑎𝑛, and 𝑎𝑡 all increase with shear velocity as shown
in Figs. 10(a)-10(c). According to Equation (3), the system’s internal shear strength
characterized by 𝜇∗ is improved correspondingly in Fig. 10(d). The changes in these
anisotropy parameters could be explained by comparing the contact force network
graphs in the steady state. As shown in Fig. 11(a), at 𝑉𝑥 = 0.1 m/s , a dense and
continuous force chain network is formed as the particles remain in contact and interact
frictionally with neighbors over long durations. By contrast, at 𝑉𝑥 = 1.5 m/s , the
distribution of contact forces is so dispersed that only some local force chain segments
exist. As a result, the contact number difference increases between along the maximum
principal stress and along the minimum principal stress, leading to an increase in the
contact orientation anisotropy parameter 𝑎𝑐. As shown in Fig. 11(b), in the steady state,
both the strong contact number 𝑁𝑐𝑠 and the weak contact number 𝑁𝑐𝑤 decrease with
shear velocity. Additionally, with shear velocity increasing, the bearing ratio of weak
contacts 𝑅𝑤 decreases while the bearing ratio of strong contacts 𝑅𝑠 increases, so the
differences in the force magnitudes become more distinct, which explains the increase
in the anisotropy parameters of contact forces 𝑎𝑛 and 𝑎𝑡.

23
Fig. 10 The changes of 𝑎𝑐 (a), 𝑎𝑛 (b), 𝑎𝑡 (c), and 𝜇∗ (d) with time under four
different velocities
Fig. 11 (a) In the steady state, the contact force network graphs under different shear
velocities, (b) the strong contact number 𝑁𝑐𝑠 , the weak contact number 𝑁𝑐𝑤 , the
bearing ratio of strong contacts 𝑅𝑠, and the bearing ratio of weak contacts 𝑅𝑤 as a
function of the shear velocity

24
In the steady flow state, the stable interfacial friction coefficient μ is equal with the
internal friction coefficient 𝜇∗ , unified as the effective friction coefficient 𝜇𝑒 .
Numerous experimental and simulation results have confirmed that, in the inertia
regime, the effective friction coefficient 𝜇𝑒 monotonically increases while the solid
fraction ε monotonically decreases, as a function of the inertia number I, given as:
𝜇𝑒(𝐼) = 𝜇𝑖 + 𝑎𝜇𝐼𝑏𝜇 (4)
𝜀(𝐼) = 𝜀𝑖 − 𝑎𝜀𝐼𝑏𝜀 (5)
where 𝜇𝑖, 𝑎𝜇, 𝑏𝜇 , ε𝑖, 𝑎ε, and 𝑏ε are constants. In Fig. 12(a), our simulation results
can be well fitted using 𝜇𝑒(𝐼) = 0.26 + 0.61𝐼0.74 and 𝜀(𝐼) = 0.81 − 0.19𝐼0.84 ,
which form the constitutive laws for the dense granular material under plane shear in
this study.
Fig. 12 (a) The interfacial friction coefficient μ, the internal friction coefficient 𝜇∗ and
the solid fraction 𝜀 in the steady state, and (b) the variations of the anisotropy
parameter 𝑎𝑐, 𝑎𝑛, and 𝑎𝑡 as a function of the inertial number I
Furthermore, Fig. 12(b) shows the variations of the anisotropy parameters with the
inertial number I. To be specific, the contact orientation anisotropy parameter 𝑎𝑐
increases significantly from 0.25 to 0.50, and the normal contact force anisotropy
parameter 𝑎𝑛 first slightly decreases but then gradually increases to 0.30, while the

25
tangential contact force anisotropy parameter 𝑎𝑡 only slightly increases from 0.05 to
0.10. By comparing their increasing extents, it can be concluded that 𝑎𝑐 and 𝑎𝑛 are
the main sources of the system’s shear strength. Moreover, the contribution of 𝑎𝑐
becomes more predominant with the increase of the inertia number I.
6. Conclusions
DEM simulations are employed to investigate the transient rheological properties of a
dense granular system under plane shear in the inertial regime. Simulation results show
that there are three typical stages in the evolution process of the system’s horizontal
flow state, namely, transmission, adjustment, and stabilization. The shear dilatancy
which is caused by the vertical movement of particles, weakens the system’s tangential
load-bearing capacity, decreases the interfacial friction coefficient μ and reduces the
boundary drive strength. On the other hand, the variations in the anisotropies of contact
orientation and contact forces, increase the internal friction coefficient 𝜇∗ and improve
the system’s shear strength. As a result, the evolution trends are opposite between μ and 𝜇∗. Therefore, the flow evolution from static to stable flow is essentially realized by
achieving the final dynamic balance between the boundary drive strength and the
internal shear strength. An increase in the shear velocity enhances the rheological
evolution rate, but the evolution pattern is not changed. Distinguished from the
micromechanical behaviors, under different shear velocities the system’s shear strength
always mainly stems from the anisotropies in contact orientation and in normal contact
force. Moreover, the anisotropy in contact orientation contributes more with the
increase of shear velocity.
Our work would help elucidate the shear equilibrium mechanism for dense granular
flow and explain the dependences of rheological constitutive laws on the flow state. In
the future, we would conduct a systematic analysis on the evolution of contact and
contact forces for exploring the internal microscopic mechanical properties.

26
Declarations
Funding This work was financially supported by the National Natural Science
Foundation of China Grant Nos. 51975174 and 51875154.
Conflict of interest The authors declare that they have no conflict of interests.
Availability of data and material The data presented in this study are available on
request from the corresponding author.
Code availability The DEM codes are available on request from the corresponding
author.

27
References
[1] Forterre, Y., Pouliquen, O.: Flows of dense granular media. Annu Rev Fluid Mech.
40,1-24 (2008)
[2] Andreotti, B., Forterre, Y., Pouliquen, O.: Granular media: between fluid and solid.
Cambridge University Press (2013)
[3] Zhang, Y., Campbell, C. S.: The interface between fluid-like and solid-like
behaviour in two-dimensional granular flows. J Fluid Mech. 237,541-568 (1992)
[4] Lherminier, S., Planet, R., dit Vehel, V. L., Simon, G., Vanel, L., Måløy, K. J., Ramos,
O.: Continuously sheared granular matter reproduces in detail seismicity laws. Phys
Rev Lett. 122,218501 (2019)
[5] Zhang, H., Liu, S., Xiao, H.: Sliding friction of shale rock on dry quartz sand
particles. Friction. 7,307-315 (2019)
[6] Scholz, C. H.: Earthquakes and friction laws. Nature. 391,37 (1998)
[7] Iordanoff, I., Khonsari, M.: Granular lubrication: toward an understanding of the
transition between kinetic and quasi-fluid regime. J Tribol. 126,137-145 (2004)
[8] Ciamarra, M. P., Dalton, F., de Arcangelis, L., Godano, C., Lippiello, E., Petri, A.:
The role of interstitial impurities in the frictional instability of seismic fault models.
Tribology Letters. 48,89-94 (2012)
[9] Wang, W., Liu, X., Xie, T., Liu, K.: Effects of sliding velocity and normal load on
tribological characteristics in powder lubrication. Tribology Letters. 43,213-219 (2011)
[10] Singla, N., Brunel, J.-F., Mège-Revil, A., Kasem, H., Desplanques, Y.: Experiment
to investigate the relationship between the third-body layer and the occurrence of
squeals in dry sliding contact. Tribology Letters. 68,1-11 (2020)
[11] MiDi, G.: On dense granular flows. Euro Phys J E. 14,341-365 (2004)
[12] Fannon, J. S., Moyles, I. R., Fowler, A. C.: Application of the compressible $ I $-
dependent rheology to chute and shear flow instabilities. J Fluid Mech. 864,1026-1057
(2019)
[13] Azéma, E., Radjai, F., Roux, J.-N.: Inertial shear flow of assemblies of frictionless
polygons: Rheology and microstructure. Euro Phys J E. 41,2 (2018)

28
[14] Chialvo, S., Sun, J., Sundaresan, S.: Bridging the rheology of granular flows in
three regimes. Phys Rev E. 85,021305 (2012)
[15] Bagnold, R. A.: The shearing and dilatation of dry sand and the'singing’mechanism.
Proceedings of the Royal Society of London Series A Mathematical and Physical
Sciences. 295,219-232 (1966)
[16] Lemaître, A.: Rearrangements and dilatancy for sheared dense materials. Phys Rev
Lett. 89,195503 (2002)
[17] Bandi, M. M., Das, P., Gendelman, O., Hentschel, H. G. E., Procaccia, I.: Universal
scaling laws for shear induced dilation in frictional granular media. Granular Matter.
21,40 (2019)
[18] Thompson, P. A., Grest, G. S.: Granular flow: friction and the dilatancy transition.
Phys Rev Lett. 67,1751 (1991)
[19] Azéma, E., Radjai, F.: Internal structure of inertial granular flows. Phys Rev Lett.
112,078001 (2014)
[20] Jop, P.: Rheological properties of dense granular flows. CR Phys. 16,62-72 (2015)
[21] Da Cruz, F., Emam, S., Prochnow, M., Roux, J.-N., Chevoir, F.: Rheophysics of
dense granular materials: Discrete simulation of plane shear flows. Phys Rev E.
72,021309 (2005)
[22] Fall, A., Ovarlez, G., Hautemayou, D., Mézière, C., Roux, J.-N., Chevoir, F.: Dry
granular flows: Rheological measurements of the μ (I)-rheology. Journal of rheology.
59,1065-1080 (2015)
[23] Schaeffer, D., Barker, T., Tsuji, D., Gremaud, P., Shearer, M., Gray, J.: Constitutive
relations for compressible granular flow in the inertial regime. J Fluid Mech. 874,926-
951 (2019)
[24] Divoux, T., Géminard, J.-C.: Friction and dilatancy in immersed granular matter.
Phys Rev Lett. 99,258301 (2007)
[25] Chevoir, F., Roux, J.-N., da Cruz, F., Rognon, P. G., Koval Jr, G.: Friction law in
dense granular flows. Powder Technology. 190,264-268 (2009)
[26] Tang, Z., Brzinski, T. A., Shearer, M., Daniels, K. E.: Nonlocal rheology of dense
granular flow in annular shear experiments. Soft matter. 14,3040-3048 (2018)

29
[27] Mitchell, J. K., Soga, K.: Fundamentals of soil behavior. John W., Sons, Canada
(2005)
[28] Koval, G., Roux, J.-N., Corfdir, A., Chevoir, F.: Annular shear of cohesionless
granular materials: From the inertial to quasistatic regime. Phys Rev E. 79,021306
(2009)
[29] Binaree, T., Azéma, E., Estrada, N., Renouf, M., Preechawuttipong, I.: Combined
effects of contact friction and particle shape on strength properties and microstructure
of sheared granular media. Phys Rev E. 102,022901 (2020)
[30] Azéma, É., Radjai, F., Roux, J.-N.: Internal friction and absence of dilatancy of
packings of frictionless polygons. Phys Rev E. 91,010202 (2015)
[31] Estrada, N., Azéma, E., Radjai, F., Taboada, A.: Identification of rolling resistance
as a shape parameter in sheared granular media. Phys Rev E. 84,011306 (2011)
[32] Koval, G., Chevoir, F., Roux, J.-N., Sulem, J., Corfdir, A.: Interface roughness
effect on slow cyclic annular shear of granular materials. Granular Matter. 13,525-540
(2011)
[33] Siavoshi, S., Orpe, A. V., Kudrolli, A.: Friction of a slider on a granular layer:
Nonmonotonic thickness dependence and effect of boundary conditions. Phys Rev E.
73,010301 (2006)
[34] Trulsson, M., DeGiuli, E., Wyart, M.: Effect of friction on dense suspension flows
of hard particles. Phys Rev E. 95,012605 (2017)
[35] Meng, F., Liu, H., Hua, S., Pang, M.: Experimental Research on Sliding Friction
of Dense Dry Particles Lubricated Between Parallel Plates. Tribology Letters. 69,1-14
(2021)
[36] Zhang, X., Sun, W., Wang, W., Liu, K.: Experimental investigation of granular
friction behaviors during reciprocating sliding. Friction.1-16
(2021).https://doi.org/10.1007/s40544-021-0488-2
[37] Kuwano, O., Ando, R., Hatano, T.: Crossover from negative to positive shear rate
dependence in granular friction. Geophys Res Lett. 40,1295-1299 (2013)
[38] Degiuli, E., Mcelwaine, J. N., Wyart, M.: Phase diagram for inertial granular flows.
Phys Rev E. 94,012904 (2016)

30
[39] Hatano, T.: Power-law friction in closely packed granular materials. Phys Rev E.
75,060301 (2007)
[40] Boyer, F., Guazzelli, É., Pouliquen, O.: Unifying suspension and granular rheology.
Phys Rev Lett. 107,188301 (2011)
[41] Berger, N., Azéma, E., Douce, J.-F., Radjai, F.: Scaling behaviour of cohesive
granular flows. EPL (Europhysics Letters). 112,64004 (2016)
[42] Wu, W., Ma, G., Zhou, W., Wang, D., Chang, X.: Force transmission and
anisotropic characteristics of sheared granular materials with rolling resistance.
Granular Matter. 21,88 (2019)
[43] Majmudar, T. S., Behringer, R. P.: Contact force measurements and stress-induced
anisotropy in granular materials. Nature. 435,1079-1082 (2005)
[44] Sufian, A., Russell, A., Whittle, A.: Anisotropy of contact networks in granular
media and its influence on mobilised internal friction. Géotechnique. 67,1067-1080
(2017)
[45] Zhang, J., Majmudar, T., Tordesillas, A., Behringer, R.: Statistical properties of a
2D granular material subjected to cyclic shear. Granular Matter. 12,159-172 (2010)
[46] Mollon, G.: Solid flow regimes within dry sliding contacts. Tribology Letters.
67,1-20 (2019)
[47] Voivret, C., Radjai, F., Delenne, J.-Y., El Youssoufi, M. S.: Multiscale force
networks in highly polydisperse granular media. Phys Rev Lett. 102,178001 (2009)
[48] Azéma, E., Linero, S., Estrada, N., Lizcano, A.: Shear strength and microstructure
of polydisperse packings: The effect of size span and shape of particle size distribution.
Phys Rev E. 96,022902 (2017)
[49] Cantor, D., Azéma, E., Sornay, P., Radjai, F.: Rheology and structure of
polydisperse three-dimensional packings of spheres. Phys Rev E. 98,052910 (2018)
[50] Pena, A., Garcia-Rojo, R., Herrmann, H. J.: Influence of particle shape on sheared
dense granular media. Granular Matter. 9,279-291 (2007)
[51] Azéma, E., Estrada, N., Radjai, F.: Nonlinear effects of particle shape angularity
in sheared granular media. Phys Rev E. 86,041301 (2012)
[52] Azéma, E., Radjai, F., Dubois, F.: Packings of irregular polyhedral particles:

31
strength, structure, and effects of angularity. Phys Rev E. 87,062203 (2013)
[53] Boton, M., Azéma, E., Estrada, N., Radjai, F., Lizcano, A.: Quasistatic rheology
and microstructural description of sheared granular materials composed of platy
particles. Phys Rev E. 87,032206 (2013)
[54] Boton, M., Estrada, N., Azéma, E., Radjai, F.: Particle alignment and clustering in
sheared granular materials composed of platy particles. Euro Phys J E. 37,116 (2014)
[55] Vo, T.-T.: Rheology and granular texture of viscoinertial simple shear flows.
Journal of Rheology. 64,1133-1145 (2020)
[56] Chèvremont, W., Chareyre, B., Bodiguel, H.: Quantitative study of the rheology
of frictional suspensions: Influence of friction coefficient in a large range of viscous
numbers. Physical Review Fluids. 4,064302 (2019)
[57] Macaulay, M., Rognon, P.: Viscosity of cohesive granular flows. Soft matter.
17,165-173 (2021)
[58] Shojaaee, Z., Roux, J.-N., Chevoir, F., Wolf, D. E.: Shear flow of dense granular
materials near smooth walls. I. Shear localization and constitutive laws in the boundary
region. Phys Rev E. 86,011301 (2012)
[59] Cundall, P. A., Strack, O. D.: A discrete numerical model for granular assemblies.
geotechnique. 29,47-65 (1979)
[60] Fillot, N., Iordanoff, I., Berthier, Y.: Modelling third body flows with a discrete
element method—a tool for understanding wear with adhesive particles. Tribology
International. 40,973-981 (2007)
[61] Roux, J.-N., Combe, G.: Quasistatic rheology and the origins of strain. CR Phys.
3,131-140 (2002)
[62] Rothenburg, L., Bathurst, R.: Analytical study of induced anisotropy in idealized
granular materials. Geotechnique. 39,601-614 (1989)

Supplementary Files
This is a list of supplementary �les associated with this preprint. Click to download.
GraphicalAbstract.tif