
Transforming the Payment Landscape in Malaysia - FST...
18
1 Transforming the Payment Landscape in Malaysia 4th Annual Technology and Innovation – the Future of Banking and Financial Services Tan Nyat Chuan Bank Negara Malaysia 10 May 2016
Transcript of Transforming the Payment Landscape in Malaysia - FST...

1
Transforming the Payment Landscape in Malaysia
4th Annual Technology and Innovation – the Future of Banking and
Financial Services
Tan Nyat Chuan
Bank Negara Malaysia
10 May 2016
2
Presentation Outline
1
2
3
Role of Bank Negara Malaysia (BNM) in payment systems
Roadmap to transform Malaysia’s payment landscape in the Financial Sector
Blueprint (2011-2020)
Strategy to accelerate migration to e-payments
• Electronic fund transfer to displace cheque
• Debit card to displace cash

3
To ensure safety, reliability and
efficiency of payment systems and
payment instruments
1 Operator
of large-value
payment system
(LVPS)*
*through BNM’s wholly
owned subsidiary, MyClear
To exercise oversight over payment
system Central Bank Act of Malaysia 2009
Financial Services Act 2013
Islamic Financial Services Act 2013
To promote monetary and financial stability by assuming the following roles:
BNM’s role as overseer of payment systems
2 Overseer
• Ensure payment
system is safe,
efficient and reliable
• Identify and manage
potential risks
3 Facilitator
• Accelerate migration
to e-payments
• Initiate
improvements in
payment services

4
Proportionate regulatory approach to foster innovation whilst
managing risk in payment systems
Evolution of payment system legal framework
• Existing legal framework supported the involvement of banks and non-banks in providing
value-adding payment services.
• Proportionate risk management measures to commensurate with the risk posed by the
players to users and the financial system.
• Promoting standardization and collaboration to foster interoperability and innovation.
1989
Banking and Financial
Institution Act (BAFIA)
Payment system provision in
the banking law
2003
Payment System Act (PSA)
Single dedicated law to
govern payment systems
and instruments
2013
Financial Services Act (FSA)
Islamic Financial Services
Act (IFSA)
)
Omnibus legislation on
financial services regulation
including the area of payment
system

5
Unit cost to the banking industry
Cash withdrawal
• ATM: RM1.20
(up to RM2.50)
• OTC: RM5.30
(up to RM6.80)
Cash deposit
• CDM: RM1.60
(up to RM3.77)
• OTC: RM5.50
(up to RM8.80)
Wholesale cash
handling1
• RM5.60
(up to RM7.60)
Cheque
processing
• RM3.10
(up to RM6.00)
1 Cost of wholesale cash handling comprises the cost of armoured truck services (excluding ATMs), cash storage and rental, float, cash
processing and sorting, insurance and fraud, theft and counterfeit losses. 2 Management Information System
• Focusing on ROI and fee income in the short-term may stifle the growth of e-payments,
while banks continue to incur substantial cost in handling cash and cheques.
• Instead of focusing on short-term ROI, banks should have better MIS and coordinated
revenue and expenditure strategies to achieve optimal financial performance.
Substantial potential for cost savings through displacement of cash
and cheques

6
2011 2012 2013 2014 2015 2016 2017 2018 2019 2020
2016 to 2020
• Strengthening coordination and alignment to
drive achievement of e-payment targets
• Continuous infrastructure enhancement to
keep pace with innovation and meet user
needs
2011 to 2015
• Strengthening regulatory frameworks,
addressing market distortions and establishing
incentive structures
• Expanding and enhancing market infrastructure
• Promoting awareness and instilling confidence
Fostering an enabling environment for accelerated migration
Measurable targets to be achieved by 2020
Indicators E-payments per
capita
Cheques cleared
(mil)
Card terminals per
1,000 inhabitants
Debit card trxn
per capita
2011 49 205 7 1
2015 82 148 9 3
2020 target 200 100 25 30
Financial Sector Blueprint 2011-2020 sets the direction for Malaysia’s
payment landscape

7
Key instruments
Electronic fund transfer
(to displace cheques)
Price signal
Debit card
(to displace cash)
IBG (30 banks with 99% CASA1 base)
IBFT (20 banks with 98% CASA base)
43 million debit cards
(for 19 mil bankable population2)
5 focus areas
Industry
incentive
structure
Access points
Quality and
value
proposition
Awareness
and
confidence
• The strategy is to leverage on and strengthen existing payment infrastructures which are
cost-effective and widely available to minimise duplicative investment cost.
1 Total number of current and savings accounts 2 Estimated based on the findings of the Financial Inclusion Demand-Side Survey which
found that about 92% of individuals aged 15 and above have a deposit account
Key instruments and focus areas

8
Cheques
IBG
0
2
4
6
8
10
12
14
16
18
20
J M M J S N J M M J S N J M M J S N J M M J S N J M M J S N
Million
2015 2014 2013 2012 2011
IBFT
Pricing Reform Framework
2 May 2013
Reduction of IBG fee and
introduction of cheque processing
fee.
IBG: 10 sen
Cheque: 50 sen (2 Jan 2015)
E-payment Incentive Fund
Framework
2 Jan 2015
Framework that allows fund to be
channeled to e-payment user
Tiered pricing structure and
disclosure requirement
1 Oct 2014
E-payment services priced based
on channels; and
Disclosure of e-payment fee
IBFT fee reduction
1 June 2015
IBFT fee is reduced from
between RM1 – RM4 to
50 sen
Cheques, IBG and IBFT
Transaction Volume
Strengthening regulatory framework and improving price signal

9
1. Banks to fulfil a
set of e-payment
prerequisites
100% of cheque fee collected
50% of cheque fee collected
ePIF account
2. Banks to utilise ePIF
funds to incentivise e-
payment adoption
Eligible incentives Individual banks’
customers
Funds collected will be used to provide the following incentives:
Waiver of security token and monthly maintenance fees
Waiver/discounts on e-payment transaction fee
Incentives for government payments using debit card
Other eligible expenses
ePIF account
Pre-requisites
NOT fully met
Pre-requisites
fully met
E-Payment Incentive Fund (ePIF) Framework:
A market driven framework to sustain the improvements in the
e-payment infrastructure and services
Market incentives structure to sustain improvement in infrastructure
and services

10
Internet banking
• IBG offered by 30 banks
(99% of CASA base)
• IBFT offered by 20 banks
(98% of CASA base)
Increased
access
points
Value
added
features
Safety and
security
Faster crediting time
• IBG payments before 5pm
credited on same business day
• IBFT payments credited
instantaneously
Safeguard against mistaken
payment
• IBG (online): I/C and
company no. verification
• IBFT: Beneficiary name
displayed before payment
confirmation
ATMs
• IBG offered at 11,356 ATMs
• IBFT offered at 12,287 ATMs
Payment details to facilitate
reconciliation
• Payer and beneficiary account
statement
BNM holds banks
responsible for-
• Ensuring security of
e-payment services
• Educate customers on
safety measures
Future-dated IBG services
• Offered by 24 out of 30 banks
(99% of cheque volume)
Enhancing access, quality and confidence

11
Policy objectives
• Curb indiscriminate increases in interchange fees
• Address market distortions to enhance payment efficiency and competition
1
2 Key measures
• Interchange fee ceilings
• Greater transparency in card acceptance cost
Unbundling of MDR for different payment card transactions
Disclosure of MDR and IF rates in merchant statements
• Empowering merchants to manage their card acceptance cost
Empowering merchants to steer customers to use cost-effective payment
cards (including setting priority routing for co-badged debit cards)
Facilitate identification of debit and prepaid cards
Payment Card Reform Framework (PCRF) to drive greater usage and
acceptance of debit cards

12
Risk of retail price increase due to interchange fee (IF) hikes
Payment
Network A
increased IF
Issuers lowered
income eligibility for
premium cards
May 2013 Feb 2014 June 2013 onwards
Acquirers
increased
MDRs
Card Type
Payment Network A Payment Network B
Before
1 May 13
Effective
1 May 13
Effective
14 Jun 14*
Before
1 Mar 14
Effective
1 Mar 14
Credit Card 1.1% 1.32% - 1.80% 1.32% - 1.85% 1.2% 1.2% - 1.8%
Debit Card 1.1% 1.1% 0.99% - 1.45% 1.15% 0.9% - 1.1%
April 2014
Payment Network A
announced further
IF hikes*
(unwound after
BNM’s engagement)
March 2014
Payment
Network B
increased IF
• Cost of higher IF is passed to merchants in the form of higher MDR.
• Merchants are pressured to pass on the higher cost to consumers by raising retail prices.
13
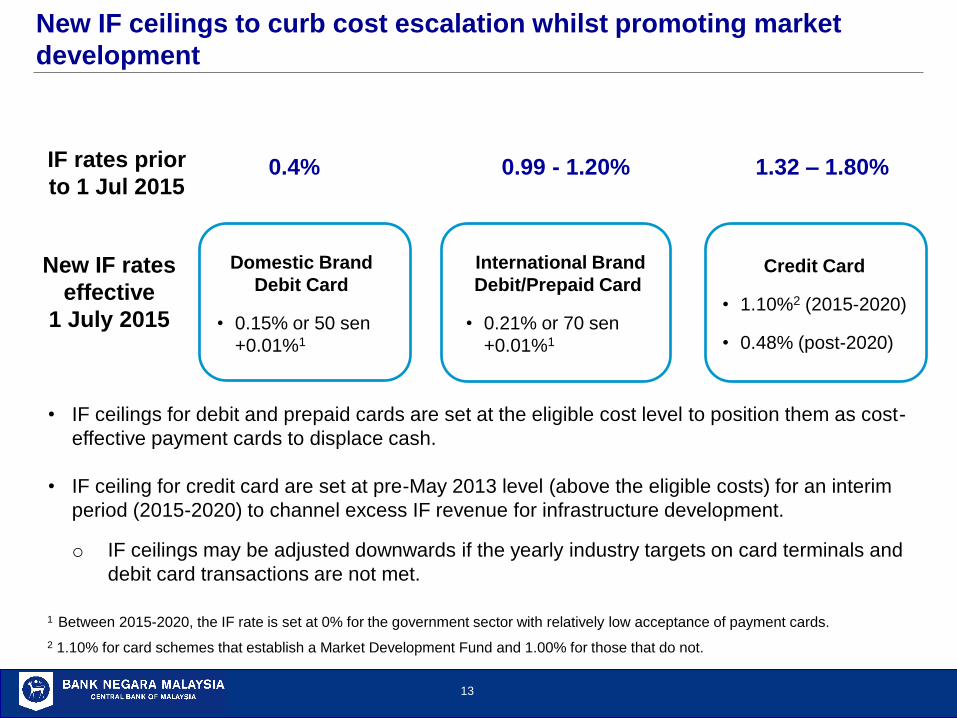
0.4% 0.99 - 1.20% 1.32 – 1.80% IF rates prior
to 1 Jul 2015
New IF rates
effective
1 July 2015
1 Between 2015-2020, the IF rate is set at 0% for the government sector with relatively low acceptance of payment cards.
2 1.10% for card schemes that establish a Market Development Fund and 1.00% for those that do not.
Domestic Brand
Debit Card
• 0.15% or 50 sen
+0.01%1
International Brand
Debit/Prepaid Card
• 0.21% or 70 sen
+0.01%1
Credit Card
• 1.10%2 (2015-2020)
• 0.48% (post-2020)
• IF ceilings for debit and prepaid cards are set at the eligible cost level to position them as cost-
effective payment cards to displace cash.
• IF ceiling for credit card are set at pre-May 2013 level (above the eligible costs) for an interim
period (2015-2020) to channel excess IF revenue for infrastructure development.
o IF ceilings may be adjusted downwards if the yearly industry targets on card terminals and
debit card transactions are not met.
New IF ceilings to curb cost escalation whilst promoting market
development

14
PCRF facilitates greater transparency and merchant empowerment in
card acceptance
Greater
transparency in
card acceptance
cost
Empowerment of
merchants to
accept the lower
cost card or
network
• Separate MDR for different
payment card and network
• Disclosure of MDR and IF in
merchant statement
• Notification on IF and MDR
reduction or reason for lack
thereof
• Merchants empowered to set priority routing to the preferred
debit card network
• Merchants empowered to steer cardholder to use lower cost
card or network
• Enhancement of debit and prepaid card design to facilitate
identification

15
Existing Debit / ATM cards New Debit / ATM cards
Domestic brand logo is displayed at the
back of the card due to restrictive rules
by international card schemes
1. Contactless function
2. Debit card brands displayed on the
front of the card.
• MyDebit will replace MEPS &
Bankard logo
3. ‘Debit’ imprinted on the front of the
card
1
2
3
Standalone Co-badged
with 2 debit brands Co-badged with 2 debit brands
Note: The display of payment card is for illustration purpose only and does
not represent an endorsement of any particular bank or payment card brand.
Facilitating identification of debit cards

16
Contactless debit card initiative (MCCS1)
Chip & PIN initiative
July 2015 2016 2017 2018 2019 2020
Deployment of 560,000 POS terminals (min. 30% contactless)
Increase debit card transactions to 1 billion per year
1 Under the Malaysian Chip Card Initiative, the domestic debit card (MyDebit) will migrate from its existing proprietary standard (PMPC) to adopt the
EMV standard and the contactless functionality.
+
EMV +
RM1.1 billion to be invested by the industry for infrastructure
development

17
Market Development Fund (MDF) to support expansion of card
terminals
• PCRF provides payment card schemes with the option of establishing a MDF to support
the deployment of new card terminals.
• Two major payment card schemes have established the MDF, which is expected to
channel approximately RM 455 million towards expanding the card network until 2020.
Interchange fee
Issuer A
Issuer A’s MDF funds
for terminal
deployment
0.1% of the value of
credit card transaction
Under-achievement of
Issuer A’s individual
target for terminal
deployment
Disburse pro-rated
MDF funds into a
pooled account
Pooled MDF
account
Funds available to
issuers who are able
to cover the shortfall
in POS terminal
deployment
1 2 3

18
Thank you