Transforming Subsurface - High Performance Geoscience · PDF file · 2015-08-06we...
11
Event sponsored by: Why investors don’t believe our story Which data acquisition technology to use where Seabed seismic and James Bond How to use gravity with seismic Managing gravity and magnetic data at Statoil What you can do with fast computers Maintaining high resolution through to simulation Event Report, Transforming Subsurface Interpetation, June 10, 2015, Stavanger Official publication of Finding Petroleum Special report Transforming Subsurface Interpretation June 10, 2015, Stavanger
Transcript of Transforming Subsurface - High Performance Geoscience · PDF file · 2015-08-06we...

Event sponsored by:
Why investors don’t believe our story
Which data acquisition technology to use where
Seabed seismic and James Bond
How to use gravity with seismic
Managing gravity and magnetic data at Statoil
What you can do with fast computers
Maintaining high resolution through to simulation
Event Report, Transforming Subsurface Interpetation, June 10, 2015, Stavanger
Official publication of Finding Petroleum
Special report
Transforming SubsurfaceInterpretationJune 10, 2015, Stavanger
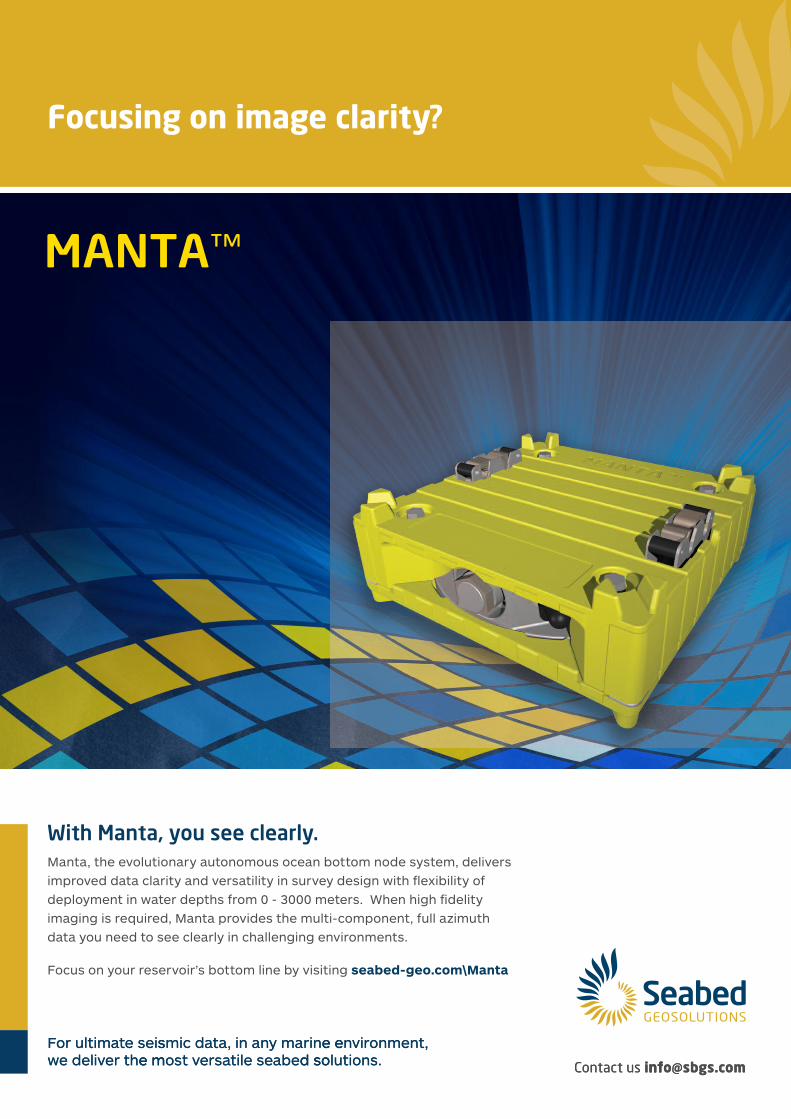
Contact us [email protected]
For ultimate seismic data, in any marine environment, we deliver the most versatile seabed solutions.
se seitamitlor uFe mhr teivle dew
e eniray mnn a, iataic dmsd soebae selitarset vsoe m
, tnemonrivne e.siontuld so
s utactonC nfi onf @ mco.sgbs

This special edition of Digital Energy Journal is an Event Report from our forum in Stavanger on June 10, 2015, "Transforming Subsurface Interpretation".
Transforming Subsurface Interpretation
3
Event websitehttp://www.findingpetroleum.com/event/8ea4d.aspx
Report written by Karl Jeffery, editor of Digital Energy [email protected] Tel 44 208 150 5292
Sales manager Richard [email protected] Tel 44 208 150 5291
Conference produced by Davud Bamford
Layout by Laura Jones, Very Vermilion Ltd
Cover art by Alexandra Mckenzie
Digital Energy Journalwww.d-e-j.com
Future Energy Publishing, 39-41 North Road, London, N7 9DP, UK www.fuenp.com
Many oil and gas investors are starting to losefaith in the oil and gas industry’s ability to de-liver with exploration, said conference chair-man David Bamford, also a non-executivedirector of Premier Oil.
“The viewpoint of all these investors is, wedon’t believe a word that you say.”
“There’s a big issue of actual failure to deliverexploration results and reserves additions, tothe point at which investors don’t believe ourstory. That’s a serious problem.”
This is in addition to concerns from low oilprices and high operating costs.
This means that the oil and gas industry doesnot look very attractive compared to other in-dustries investors could put money into, hesaid.
That leads to the question of whether therecan be better ways to understand the subsur-face with the help of new technologies, togather, integrate and manage data.
Mr Bamford suggests seabed seismic record-ing, fibre optics in wells, gravity and gravime-try, as technologies worth looking harder at.You have to choose the right technology foryour project, and then, perhaps hardest of all,integrate all the data together at the end.
Seabed seismic
Seabed seismic is about recording seismicdata on the seabed, rather than with recordingdevices towed behind a vessel on the surfaceof the water. You can get a much more highresolution recording if you make it on theseabed.
“The idea that you would replace towedstreamer seismic with seabed based acquisi-tion has been around for quite a while in theform of [seabed] cables,” he said.
“Universities in the UK and Norway havebeen using seabed acquisition for years andyears and don’t understand why our industrydoesn’t.”
But “the operational difficulties has drivenseveral companies out of business,” Mr Bam-ford said.
One seabed acquisition company “had suchoperational difficulties, it was having to repeatsurveys at its own costs. It eventually disap-peared in smoke.”
Companies are moving towards ‘nodes’ - in-dividual devices placed temporarily on theseabed - which can prove cheaper to deploythan permanent cables.With seabed recording, you can acquire fourcomponent data (compressional waves and
three directions of shear waves). You can usethis additional data to more sophisticated pro-cessing, including monitoring and mappingfractures.
“The whole thing improves the chance of pre-diction [of oil],” he said. “This is a technol-ogy which has arrived and is findingwidespread use.”
Almost all of the seabed surveys done so farhave been done in the Gulf of Mexico, andhave been “proprietary” surveys (where oneoil company contracts the seismic contractor,rather than “multiclient” work, where the seis-mic contractor doing work which is then soldto many different companies). They are alsomainly with nodes, rather than cables.
Fibre in wells
Meanwhile, the use of fibre optics in wells ismaking big steps forward, particularly theway that they can be used as listening devices,using technology mainly developed for thedefence industry.
The cable is “so robust, usable and inexpen-sive you can deploy it in any well,” he said.
“It doesn’t interfere with production,” he said.As you can imagine, production engineers re-ally hate any technology in wells which inter-rupts flow.
Investors don’t believe our storyInvestors are getting very sceptical about the oil and gas industry’s ability to find oil and gas, said conferencechairman David Bamford. Can better use of technology lead to more exploration success – and make us moreinvestable?
Finding Petroleum’s “Transforming Subsurface Interpretation” conference in Stavanger on June 10, 2015, looked at new ways technologycan get a better understanding of the subsurface, including seabed seismic, gravity data, faster computers and high resolution modelling,and how to integrate all the data and manage it.
Conference chairman David Bamford, a non-executive director of Premier Oil, explained that the oil and gas industry is losing credibilityfrom investors due to poor financial performance – not only because of the low oil price and high operations costs, but because of poorsuccess rates in exploration in recent years.
There are many technologies which can help gather and integrate information, but working out how to get the best out of multiple sub-surface technologies at once is very hard!
This event was part of a series of 3 events, with events on the same topic also held in Aberdeen on March 12 and London on April 13.
Digital Energy Journal - Special report, Transforming Subsurface Interpretation, June 10 2015
Transforming subsurface interpretation, Stavanger, June 10, 2015

Transforming Subsurface Interpretation
4
“It delivers [continuous] recording of thenoise the production is making, [plus] valvesclosing and shutting, anything going on in thewell. So you can pinpoint where petroleum orwater is flying into a well very accurately.
“You can use it for downhole seismic profiles[recording seismic data in the well] and recordthem any time you want. There is a possibilityof permanent reservoir monitoring facilitywith some fibre optics downhole.”
“So quite powerful stuff.”
The technology has been used to record seis-mic data in the well by one Middle East client,to monitor a multiwall steam injection in en-hanced oil recovery, and recording Vibroseisshot data.
“There are obvious applications, but now re-ally operationally sensible, because this stuffis so robust and works so well,” he said.
Gravity
Meanwhile gravity recording, or more specif-ically ‘Full Tensor Gravimetry’ (FTG), is“very effective,” he said. “Of all advances intechnology, that one had the most impact onfinding oil and gas.”
With FTG the gravity is recorded by two de-vices a short distance apart on the same aero-plane or ship, and then you make acomparison between their recorded signals.
The same noise (for example from aircraftmovements up and down) can be recorded bytwo sensors, and by putting their signals to-gether, the noise can be cancelled out. Thismeans you end up with a much better signal
to noise ratio.
Mr Bamford got familiar with FTG in his pre-vious role as a non-executive director of Tul-low Oil, which was using the technology inUganda and Kenya.
“In Uganda, we shot about 10,000 km2 of thisFull Tensor Gravimetry. You could integrateit pretty well with 2D seismic, and you’d havea real exploration database you could explorewith.”
“In Kenya we acquired 60,000km2 of thisgravity data. In somewhere like Kenya youcan acquire tens of thousands of square kilo-metres relatively inexpensively, such as $2-3m dollars for the 60,000km2.”
“It really is good at demonstrating the basinshape and showing you the structural pattern.”
Offshore, FTG is being used to help solvesubsalt problems, which are proving hard toimage using seismic only.
Another interesting non-seismic geophysicstechnology is Controlled Source Electromag-netics (CSEM). “Particularly in Norway,there’s been a lot of talk of the help thatCSEM can provide to the exploration map-ping process,” he said.
The challenge is working out how to fitEMGS data into your 3D seismic. “If you look at the equations involved and therock parameters involved, it is not obvioushow you join these things together,” he said.
Choosing a technology
So which technologies should you use where?
For example, in a survey in North WestAfrica, with complex carbonate rock, “thecritical technology to deploy is going to beocean bottom nodes,” he said.
For North West Europe, typically with sand-stones and shale, “a combination of nodes andelectromagnetics might be helpful to you.”
“There’s been a reportedly quite large frac-tured basement discovery in the UK West ofShetland called Lancaster,” he said. “Al-legedly this is part of a new play that couldopen up all the way from Ireland to Norwe-gian Sea.”
“The key is first of all mapping where theedge of the basin is and what’s its history.[Here] Full Tensor Gravimetry (FTG) wouldbe the important technology.”
The value of the reservoir depends on the dis-tribution of the fractures, so these would needto be understood. “You can envisage somecombination of the technologies I talked aboutearlier helping you,” he said.
Integration
The critical question which is not well an-swered is how to integrate all the data to-gether.
The science and equations behind the tech-nologies has been understood for over 100years.
“But these sciences do not talk about the samething. Some have first order differential equa-tions, some have second order. That’s a com-plicated answer.”
Most geophysicists’ IT set-ups are designedfor interpreting 3D seismic. “The work processes that are built aroundthem don’t easily allow the integration ofother data,” he said.
“If you accept that these things will changeand transform what we do, and therefore in-crease success rates, reserves extensions, ap-praising discoveries, making new discoveries,then somehow we need to figure out how tointegrate these things,” he said.
Watch a video of David’s talk and downloadslides atwww.findingpetroleum.com/video/1280.aspx
Digital Energy Journal - Special report, Transforming Subsurface Interpretation, June 10 2015

5
Transforming Subsurface Interpretation
Digital Energy Journal - Special report, Transforming Subsurface Interpretation, June 10 2015
Imagine James Bond trying to find an objectat the bottom of a dark swimming pool.
He has an idea that something is there, and hasa powerful torch to see it more clearly.
But he can’t work out exactly where it usingthe torchlight, because the torchlight bends asit goes through the water, and you don’t knowthe water depth or the amount the light isbending.
You can get a better idea by walking allaround the swimming pool with your torch,and making calculations.
This analogy starts to indicate why recordingseismic data on the seabed gives you a muchclearer understanding of what is in the subsur-face, said John Moses, regional sales directorwith Seabed Geosolutions, speaking at theFinding Petroleum forum in Stavanger onJune 10, “Transforming Subsurface Interpre-tation”.
Seabed seismic recording can pick up morecomponents of seismic data. Shear wavescan’t travel through water, so recording on thewater surface (as with towed streamer) youcan only record compressional (P) waves. Buton the seabed you can record both shearwaves and P-waves. This multi componentseismic data is analogous to having a morepowerful torch to look in the swimming poolwith.
Recording in different directions (azimuths)is expensive when recording with towedstreamer, because it means making multipletrips with your source vessels and streamers.But when recording on the seabed, the record-ing device (node) can pick up seismic comingfrom many different directions at once. Themultiazimuth is equivalent to walking aroundthe swimming pool.
You may need to spend some more money onseabed seismic than towed streamer, equiva-lent to making more effort to understand theobject in the swimming pool before you jumpin. But drilling, like James Bond ruining hisTuxedo by jumping in the swimming pool,can only be done once.
There might be a sunbed floating on theswimming pool, which makes it hard to seethe object. But recording seismic on theseabed means that the obstructions on thewater surface don’t matter.
Towed streamer seismic recording is not ableto record near any obstructions on the water,such as offshore platforms (which are oftenbuilt above reservoirs), as well as shallowwater, rocks and ice.
Technology
Seabed Geosolutions’ technology can dorecording at very shallow depths and depthsof up to 3000m, with nodes deployed in deep-water using Remote Operated Vehicles(ROVs).
The limit in the number of nodes in one sur-vey is basically linked to the number of nodesyou can physically deploy, and surveys aregetting larger and larger. A typical offshorevessel in the North Sea can carry 10,000nodes in containers, he said.
You can record with one node until the batteryruns out. Battery capacity in nodes is increas-ing around 10 per cent a year, he said, andmeanwhile the power consumption of theelectronics is going down.
Seabed Geosolutions is a joint venture ofCGG and Fugro.
Comparing the results
In one example from the Dan Field in theDanish sector of the North Sea, a seismicstreamer survey from 2012 was comparedwith a seabed survey conducted later.
The streamer survey seismic image shows abig gap in image resolution, from the area be-neath an offshore platform where the vesselwas not able to survey. When ocean bottomnode data was recorded, there was no obstruc-tion.
The subsurface has a chalk reservoir with abig fracture going through it. It has 108 wells,half producing and half injecting, with thewells producing and injecting changing all thetime.
In another example, data was recorded byChevron, offshore West Africa in 400m waterdepth.
The company was using a streamer survey inan oilfield with a massive platform in the cen-tre, and large water currents. “It’s a horrorshow for a streamer company,” he said.
Seabed Geosolutions flew 3 containers ofnodes to the city of Pointe-Noire, and fromthere they were trucked to the town of Mal-ongo, where they were loaded on the client’sROV vessel. They were placed onto theseabed by ROV. “It takes 3-4 days to deployand 3-4 days to pick them up,” he said.
In another example from an Australian fieldApache used seabed data to provide a betterinterpretation of the oil water contact, whichwas very useful in the drilling program, MrMoses said.
Drillers could get much more useful informa-tion from seismic data than they currently do,he said.
Another issue seabed seismic can help with iswhen there is gas in the overburden (the rockabove the reservoir), which can block the pas-sage of compressional (P) waves, which arethe only waves towed streamer seismic canrecord. But with seabed recording, you canalso record shear (S) waves, which can passthrough the gas.
This was a particular problem for a field inMalaysia operated by PETRONAS.
Seabed seismic and James BondJohn Moses of Seabed Geosolutions explains seabed seismic using the analogy of James Bond trying tounderstand an object at the bottom of a murky swimming pool.
6
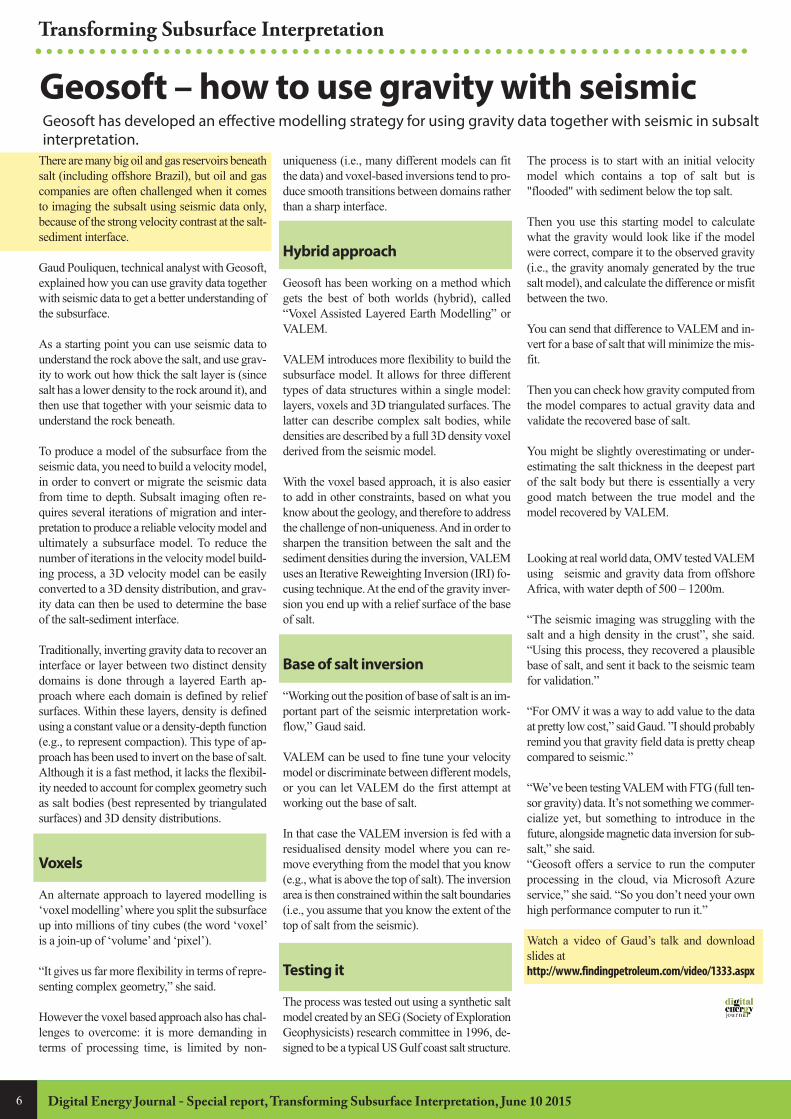
Geosoft – how to use gravity with seismicGeosoft has developed an effective modelling strategy for using gravity data together with seismic in subsaltinterpretation.
Digital Energy Journal - Special report, Transforming Subsurface Interpretation, June 10 2015
Transforming Subsurface Interpretation
There are many big oil and gas reservoirs beneathsalt (including offshore Brazil), but oil and gascompanies are often challenged when it comesto imaging the subsalt using seismic data only,because of the strong velocity contrast at the salt-sediment interface.
Gaud Pouliquen, technical analyst with Geosoft,explained how you can use gravity data togetherwith seismic data to get a better understanding ofthe subsurface.
As a starting point you can use seismic data tounderstand the rock above the salt, and use grav-ity to work out how thick the salt layer is (sincesalt has a lower density to the rock around it), andthen use that together with your seismic data tounderstand the rock beneath.
To produce a model of the subsurface from theseismic data, you need to build a velocity model,in order to convert or migrate the seismic datafrom time to depth. Subsalt imaging often re-quires several iterations of migration and inter-pretation to produce a reliable velocity model andultimately a subsurface model. To reduce thenumber of iterations in the velocity model build-ing process, a 3D velocity model can be easilyconverted to a 3D density distribution, and grav-ity data can then be used to determine the baseof the salt-sediment interface.
Traditionally, inverting gravity data to recover aninterface or layer between two distinct densitydomains is done through a layered Earth ap-proach where each domain is defined by reliefsurfaces. Within these layers, density is definedusing a constant value or a density-depth function(e.g., to represent compaction). This type of ap-proach has been used to invert on the base of salt.Although it is a fast method, it lacks the flexibil-ity needed to account for complex geometry suchas salt bodies (best represented by triangulatedsurfaces) and 3D density distributions.
Voxels
An alternate approach to layered modelling is‘voxel modelling’ where you split the subsurfaceup into millions of tiny cubes (the word ‘voxel’is a join-up of ‘volume’ and ‘pixel’).
“It gives us far more flexibility in terms of repre-senting complex geometry,” she said.
However the voxel based approach also has chal-lenges to overcome: it is more demanding interms of processing time, is limited by non-
uniqueness (i.e., many different models can fitthe data) and voxel-based inversions tend to pro-duce smooth transitions between domains ratherthan a sharp interface.
Hybrid approach
Geosoft has been working on a method whichgets the best of both worlds (hybrid), called“Voxel Assisted Layered Earth Modelling” orVALEM.
VALEM introduces more flexibility to build thesubsurface model. It allows for three differenttypes of data structures within a single model:layers, voxels and 3D triangulated surfaces. Thelatter can describe complex salt bodies, whiledensities are described by a full 3D density voxelderived from the seismic model.
With the voxel based approach, it is also easierto add in other constraints, based on what youknow about the geology, and therefore to addressthe challenge of non-uniqueness. And in order tosharpen the transition between the salt and thesediment densities during the inversion, VALEMuses an Iterative Reweighting Inversion (IRI) fo-cusing technique. At the end of the gravity inver-sion you end up with a relief surface of the baseof salt.
Base of salt inversion
“Working out the position of base of salt is an im-portant part of the seismic interpretation work-flow,” Gaud said.
VALEM can be used to fine tune your velocitymodel or discriminate between different models,or you can let VALEM do the first attempt atworking out the base of salt.
In that case the VALEM inversion is fed with aresidualised density model where you can re-move everything from the model that you know(e.g., what is above the top of salt). The inversionarea is then constrained within the salt boundaries(i.e., you assume that you know the extent of thetop of salt from the seismic).
Testing it
The process was tested out using a synthetic saltmodel created by an SEG (Society of ExplorationGeophysicists) research committee in 1996, de-signed to be a typical US Gulf coast salt structure.
The process is to start with an initial velocitymodel which contains a top of salt but is"flooded" with sediment below the top salt.
Then you use this starting model to calculatewhat the gravity would look like if the modelwere correct, compare it to the observed gravity(i.e., the gravity anomaly generated by the truesalt model), and calculate the difference or misfitbetween the two.
You can send that difference to VALEM and in-vert for a base of salt that will minimize the mis-fit.
Then you can check how gravity computed fromthe model compares to actual gravity data andvalidate the recovered base of salt.
You might be slightly overestimating or under-estimating the salt thickness in the deepest partof the salt body but there is essentially a verygood match between the true model and themodel recovered by VALEM.
Looking at real world data, OMV tested VALEMusing seismic and gravity data from offshoreAfrica, with water depth of 500 – 1200m.
“The seismic imaging was struggling with thesalt and a high density in the crust”, she said.“Using this process, they recovered a plausiblebase of salt, and sent it back to the seismic teamfor validation.”
“For OMV it was a way to add value to the dataat pretty low cost,” said Gaud. ”I should probablyremind you that gravity field data is pretty cheapcompared to seismic.”
“We’ve been testing VALEM with FTG (full ten-sor gravity) data. It’s not something we commer-cialize yet, but something to introduce in thefuture, alongside magnetic data inversion for sub-salt,” she said. “Geosoft offers a service to run the computerprocessing in the cloud, via Microsoft Azureservice,” she said. “So you don’t need your ownhigh performance computer to run it.”
Watch a video of Gaud’s talk and downloadslides athttp://www.findingpetroleum.com/video/1333.aspx

7Digital Energy Journal - Special report, Transforming Subsurface Interpretation, June 10 2015
Transforming Subsurface Interpretation
Managing gravity and magnetic data at StatoilStatoil has developed a centralised system for managing its gravity and magnetic data, which both specialistsand generalists can use. Statoil geophysicist Christian Gram explained how it works.
Statoil implementedGeosoft’s DAPserver solution for acentralised and or-ganised system forgravity and magneticdata management,which both special-ists and generalistscan use. We want to“use all the data wehave,” said Christian
Gram, geophysicist with Statoil, speaking at theFinding Petroleum forum in Stavanger on June 10,“Transforming Subsurface Interpretation”.
“You have to be able to find [the data], know thevalue of it and know how to handle it.”
There are 200 potential users of the data, basedaround the world. The data is also used by GIS (ge-ographical information system) users.
The company has about 3200 gravity and magneticdata sets, about 60 gigabytes of data. It also hasmany pdf reports, and data showing which areashave been surveyed.
The company uses satellite gravity data, which canprovide structural information below the deepestinterpreted seismic horizon, including calculatingcrustal thickness.
Statoil would like to use all available high resolu-tion data for 3D forward modelling of complex saltstructures. Another application of these high reso-lution data is the quality checking of velocitycubes/models. By forward calculating the gravityeffect of a density cube (derived from a velocitycube) it can be compared with the observed highresolution gravity data.
Project background
Before the project was implemented, the companybasically relied on people’s memory to rememberwhich areas were covered by data, Mr Gram said.
The Norwegian Geological Survey (NGU) had asystem which enabled data sets to be downloaded,but “it never worked,” he said.
Statoil could use NGU system to find out file num-bers, and then copy the data from its own system.
It was difficult to find metadata information, suchas which projection system was used, Mr Gramsaid. The data was stored on a number of differentdrives. It was basically only available to special-ists.
People were always asking if the gravity data ex-isted, and then staff members had to search for it,which took up a lot of time.
With the growth in increase in gravity and magnet-ics, “the number of requests for data increased, andstarted to entrench on our specialist interpretationwork,” he said.
People would discover data but not know if it wassomething new or a duplicate of something alreadyknown about, he said.
The data management project started in 2005 witha project to develop a clear system for publishingand archiving data, led by Mr Gramm and a col-league.
Using the system
The data is available to all Geosoft or ArcGISusers, and available in a standard industry formatfor gravity and magnetic data.
You can search for the data by geographical co-or-dinates, or by country, or both at once. You can alsosearch using Geosoft’s “Oasis montaj” mappingsystem or ESRI ArcMap.
You can download the data directly into your proj-ects. “You basically overlay it, in 2D view on yourseismic as a pseudo horizon, at the right depths andthe right scale,” he said.
All relevant information is entered via the MetaData Editor when submitting files, such as datasource, format, resolution, and projection. Further,if it is confidential, country, a short abstract, anddata purpose. “If you leave
out data from the projection system the data setcannot be published, it forces you to do it properly,”he said.
The administrator can check the file properties andcell size. The administrator can also preview thedata. The data is only ‘published’ once it has beenchecked by an administrator.
There is a server administration tool which makesit easier to archive and publish the data.
The system uses Geosoft’s “DAP” server solution.The datasets are managed using Microsoft’s SQLServer Management Studio Express. Statoil is alsolooking at integrating Geosoft’s “DAP” server fur-ther with ESRI data sets.
In future, the company might add electromagneticdata.
Statoil expects that its future explorationists shouldhave a ‘minimum awareness’ of how to use andutilise gravity magnetics data, he said.
Watch a pdf of Christian’s talk athttp://www.findingpetroleum.com/event/8ea4d.aspx
Christian Gram
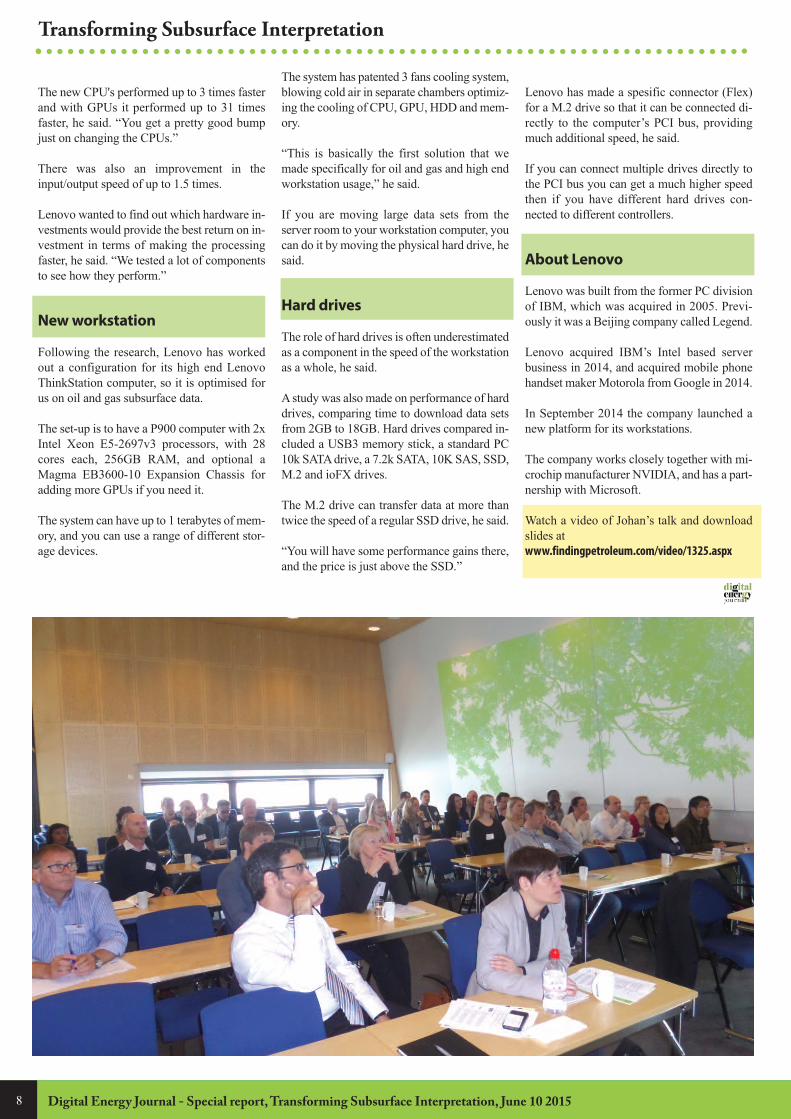
Lenovo – what you can do with fast computersBy changing microchips from CPUs to fast GPUs, in tests computers could run a standard subsurfaceworkflow up to 31 times faster, Lenovo says.
Computing hardware com-pany Lenovo recently ran atest together with CGG tosee how fast its computerscould complete a standardtask from the seismic inter-pretation workflow, and sawan improvement of up to 31times, by using GPUs.
The computing challenge was “footprint re-moval”, removing a grid pattern which is oftenseen on seismic recording. The task required12 iterations, and ran on a 610 MB data set.
It was explained by Johan Steffensen, Nordicworkstation Business Leader with Lenovo,speaking at the Finding Petroleum forum in
Stavanger on June 10, “Transforming Subsur-face Interpretation.”
Different generations of workstations werecompared doing the same computing task, tosee how fast they were with previous 4 coreCPUs inside vs the new 28 core CPU and technplogy and then comparing those towardsdifferent GPU's.
Johan Steffenson,Workstation Busi-ness Leader, Lenovo
8 Digital Energy Journal - Special report, Transforming Subsurface Interpretation, June 10 2015
Transforming Subsurface Interpretation
The new CPU's performed up to 3 times fasterand with GPUs it performed up to 31 timesfaster, he said. “You get a pretty good bumpjust on changing the CPUs.”
There was also an improvement in theinput/output speed of up to 1.5 times.
Lenovo wanted to find out which hardware in-vestments would provide the best return on in-vestment in terms of making the processingfaster, he said. “We tested a lot of componentsto see how they perform.”
New workstation
Following the research, Lenovo has workedout a configuration for its high end LenovoThinkStation computer, so it is optimised forus on oil and gas subsurface data.
The set-up is to have a P900 computer with 2xIntel Xeon E5-2697v3 processors, with 28cores each, 256GB RAM, and optional aMagma EB3600-10 Expansion Chassis foradding more GPUs if you need it.
The system can have up to 1 terabytes of mem-ory, and you can use a range of different stor-age devices.
The system has patented 3 fans cooling system,blowing cold air in separate chambers optimiz-ing the cooling of CPU, GPU, HDD and mem-ory.
“This is basically the first solution that wemade specifically for oil and gas and high endworkstation usage,” he said.
If you are moving large data sets from theserver room to your workstation computer, youcan do it by moving the physical hard drive, hesaid.
Hard drives
The role of hard drives is often underestimatedas a component in the speed of the workstationas a whole, he said.
A study was also made on performance of harddrives, comparing time to download data setsfrom 2GB to 18GB. Hard drives compared in-cluded a USB3 memory stick, a standard PC10k SATA drive, a 7.2k SATA, 10K SAS, SSD,M.2 and ioFX drives.
The M.2 drive can transfer data at more thantwice the speed of a regular SSD drive, he said.
“You will have some performance gains there,and the price is just above the SSD.”
Lenovo has made a spesific connector (Flex)for a M.2 drive so that it can be connected di-rectly to the computer’s PCI bus, providingmuch additional speed, he said.
If you can connect multiple drives directly tothe PCI bus you can get a much higher speedthen if you have different hard drives con-nected to different controllers.
About Lenovo
Lenovo was built from the former PC divisionof IBM, which was acquired in 2005. Previ-ously it was a Beijing company called Legend.
Lenovo acquired IBM’s Intel based serverbusiness in 2014, and acquired mobile phonehandset maker Motorola from Google in 2014.
In September 2014 the company launched anew platform for its workstations.
The company works closely together with mi-crochip manufacturer NVIDIA, and has a part-nership with Microsoft.
Watch a video of Johan’s talk and downloadslides atwww.findingpetroleum.com/video/1325.aspx
9
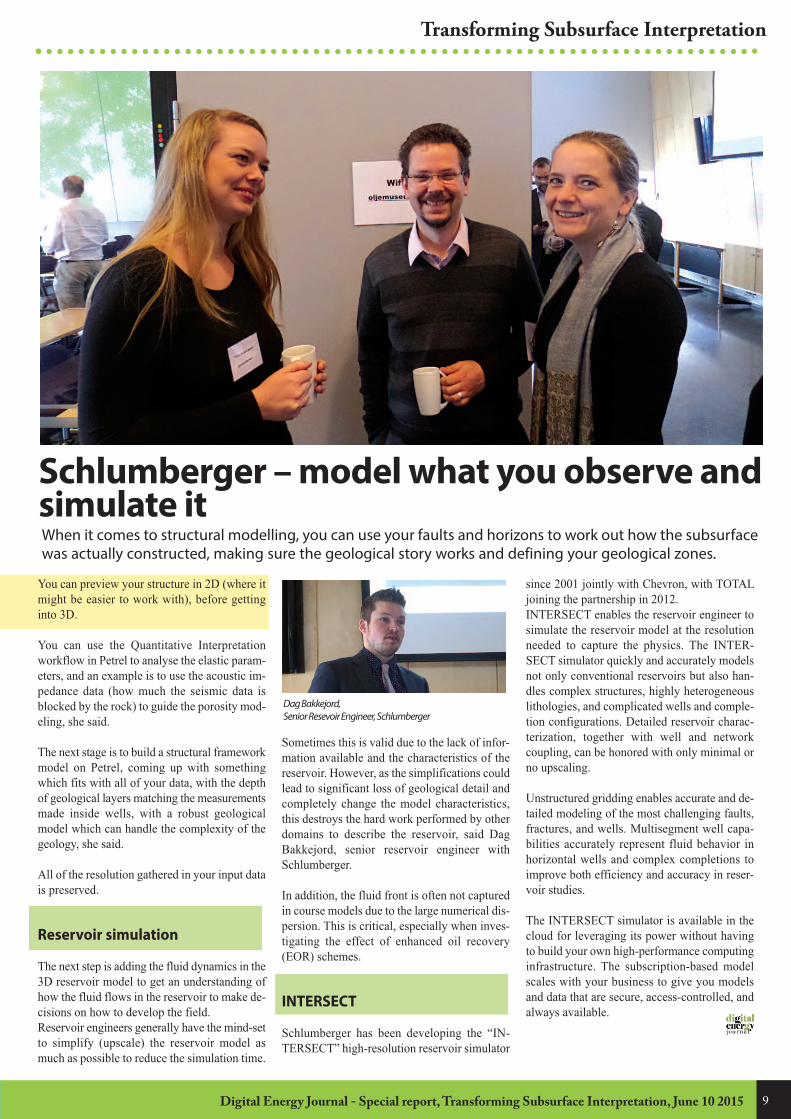
Schlumberger – model what you observe andsimulate itWhen it comes to structural modelling, you can use your faults and horizons to work out how the subsurfacewas actually constructed, making sure the geological story works and defining your geological zones.
Digital Energy Journal - Special report, Transforming Subsurface Interpretation, June 10 2015
Transforming Subsurface Interpretation
You can preview your structure in 2D (where itmight be easier to work with), before gettinginto 3D.
You can use the Quantitative Interpretationworkflow in Petrel to analyse the elastic param-eters, and an example is to use the acoustic im-pedance data (how much the seismic data isblocked by the rock) to guide the porosity mod-eling, she said.
The next stage is to build a structural frameworkmodel on Petrel, coming up with somethingwhich fits with all of your data, with the depthof geological layers matching the measurementsmade inside wells, with a robust geologicalmodel which can handle the complexity of thegeology, she said.
All of the resolution gathered in your input datais preserved.
Reservoir simulation
The next step is adding the fluid dynamics in the3D reservoir model to get an understanding ofhow the fluid flows in the reservoir to make de-cisions on how to develop the field.Reservoir engineers generally have the mind-setto simplify (upscale) the reservoir model asmuch as possible to reduce the simulation time.
Sometimes this is valid due to the lack of infor-mation available and the characteristics of thereservoir. However, as the simplifications couldlead to significant loss of geological detail andcompletely change the model characteristics,this destroys the hard work performed by otherdomains to describe the reservoir, said DagBakkejord, senior reservoir engineer withSchlumberger.
In addition, the fluid front is often not capturedin course models due to the large numerical dis-persion. This is critical, especially when inves-tigating the effect of enhanced oil recovery(EOR) schemes.
INTERSECT
Schlumberger has been developing the “IN-TERSECT” high-resolution reservoir simulator
since 2001 jointly with Chevron, with TOTALjoining the partnership in 2012. INTERSECT enables the reservoir engineer tosimulate the reservoir model at the resolutionneeded to capture the physics. The INTER-SECT simulator quickly and accurately modelsnot only conventional reservoirs but also han-dles complex structures, highly heterogeneouslithologies, and complicated wells and comple-tion configurations. Detailed reservoir charac-terization, together with well and networkcoupling, can be honored with only minimal orno upscaling.
Unstructured gridding enables accurate and de-tailed modeling of the most challenging faults,fractures, and wells. Multisegment well capa-bilities accurately represent fluid behavior inhorizontal wells and complex completions toimprove both efficiency and accuracy in reser-voir studies.
The INTERSECT simulator is available in thecloud for leveraging its power without havingto build your own high-performance computinginfrastructure. The subscription-based modelscales with your business to give you modelsand data that are secure, access-controlled, andalways available.
Dag Bakkejord, Senior Resevoir Engineer, Schlumberger

List of attendees 'Transforming Sub-Surface Interpretation' at Norwegian Petroleum Stavanger Museum, Wednesday, June 10, 2015
What did you enjoy most about the event?
“ “ “The introduction presentation that gavea little more than justthe brief descriptionon what's going on inthe business.
Everythingworked well.Øystein Haaland IBM
The presentation onsea bed nodes with theJames Bond analogywas excellent presented to a wide audience and kept the interest high.
“The opportunity tosee what the indus-try is working on.Ricardo Colmenares -Schlumberger
10
”” ”
Digital Energy Journal - Special report, Transforming Subsurface Interpretation, June 10 2015
Transforming Subsurface Interpretation
Ildiko Langaker, Survey Management, Baker HughesMille Nielsen, Survey Management, Baker HughesKieran Parrett,Survey Management, Baker HughesFloris Doorenbos, Graduate Geologist, BG-GroupPaul Mathias Fiskaaen, Director O&G, CGI Norway ASTrond Bergoe, Chief Geologist, Envision asPer-Ingar Auberg, Geoscience Advisor, First GeoErik Havarstein, Manager Geophysical Opera-tions, GeografGaud Pouliquen, Technical analyst, GeosoftOystein Haaland, "WW Business Development Executive, C & P", IBMCarl Ruben Ericson, IBMOle Evensen, Global Upostream BDE, IBMTyson Bridger, Commercial Strategy, IHS
Stephen Suttie, Senior Sales Executive, IHSJohan Steffensen, Business Leader Workstation, LenovoGediminas Valantinas, Senior production engineer, Lotos UpstreamBarbara Zarebska, Senior Reservoir Engineer, Lotos UpstreamEwa Pawlus, Geophysicist, PGNiGErik Monsen, Project Manager Innovation andBusiness Development, Prekubator TTOCedric Nicou, Wireline Geophysics DomainChampion, SchlumbergerLinda Stuberg, Geophysicist, SchlumbergerRicardo Colmenares, Technical Sales Manager, SchlumbergerRania Carballares, Senior Geologist, SchlumbergerDag Bakkejord, Senior Reservoir Engineer, SchlumbergerTrine Kvist-Lassen, Geophysicist, Schlumberger
Miriam Hohner, Petrophysicist, SchlumbergerAnne Oevreeide, Technical Manager, SchlumbergerJorn Tore Paulsen, Account Manager, SchlumbergerRobyn Shaw, Geosolutions DP Supervisor, SchlumbergerJohn Moses, Seabed GeosolutionsChristian Gramm, Geophysicist, StatoilRemi-Erempagamo Meindinyo, PhD Candidate, UiSYichen Yang, UiSThanusha Naidoo, PhD research fellow, University of StavangerCharlotte Botter, PhD candidate in Geosciences, University of StavangerThanh Nguyen, University of StavangerBaard Elvik, Senior Drilling Engineer, Weatherford
”