
Transforming Infrastructure€¦ · Cables & FOCs Permission for Road cutting Road DLPs, Multiple...
58
Minimizing risk and cost in cities, buildings, transportation, and water Transforming Infrastructure Hosted by: Pet le Kua, Field Marketing Leader, Asia Pacific, AVEVA 18 September 2019 | AVEA World Summit Singapore © 2019 AVEVA Group plc and its subsidiaries. All rights reserved.
Transcript of Transforming Infrastructure€¦ · Cables & FOCs Permission for Road cutting Road DLPs, Multiple...

Minimizing risk and cost in cities, buildings, transportation, and water
TransformingInfrastructure
Hosted by: Pet le Kua, Field Marketing Leader, Asia Pacific, AVEVA
18 September 2019 | AVEA World Summit Singapore
© 2019 AVEVA Group plc and its subsidiaries. All rights reserved.

Infrastructure industry: a world of constant change
MARKET ENVIRONMENT IMPERATIVES TECHNOLOGY TRENDS
Efficient Use of CapitalCloud
Effective asset investmentplanning and maintenance Industrial
IoT/EdgeIntegration: Improve efficiency and effectivenessof infrastructure
Big Data
Digital TwinEnergy Management: Sustainability plan to enhance brand and reduce cost
Artificial Intelligence/ML
Improve workforceefficiency and capability
AR/VR
Rising Urbanization/Competition for Tax Base
Ageing Infrastructure
Shifting transportationmodes and preferences
Focus on Stewardshipand sustainability
Growing safety, security, and privacy concerns
Shifting workforceexpectations
Deploy and manage safetyand surveillance systems

AVEVA enables infrastructure operators to lead with innovation
Collaborate Create Pioneer
We harness the power of our ecosystem by working together to bring bold ideas
to life.
We discover new ways to empower people and industries, enabling the success of our
customers.
We build leading solutions across the asset and operations lifecycles that turn opportunity into business value.
4,200partners
globally on 6 continents
50+ documented testimonials
5focused
subsegments
4,600+infrastructure
customers
#1SCADA market
share leader for water and
wastewater
50%Increase in IT
Efficiency
40%Improvement in
operational efficiency
80%increase in
engineering efficiency
AssetPerformance
EngineerProcure
Construct
Operate andOptimize
Plan andSchedule
Monitor andControl
© 2019 AVEVA Group plc and its subsidiaries. All rights reserved.

Our Infrastructure Mission
© 2019 AVEVA Group plc and its subsidiaries. All rights reserved.
We empower operators to deliver safer, more reliable, and more efficient servicesby digitally connecting assets, operations, and people.
Minimize Risk to People, Assets, and Operations
Reduce Energy and Operational Costs
Optimise Performance of Employees, Assets,
and Operations
Make faster, more informed decisions and speed crisis response
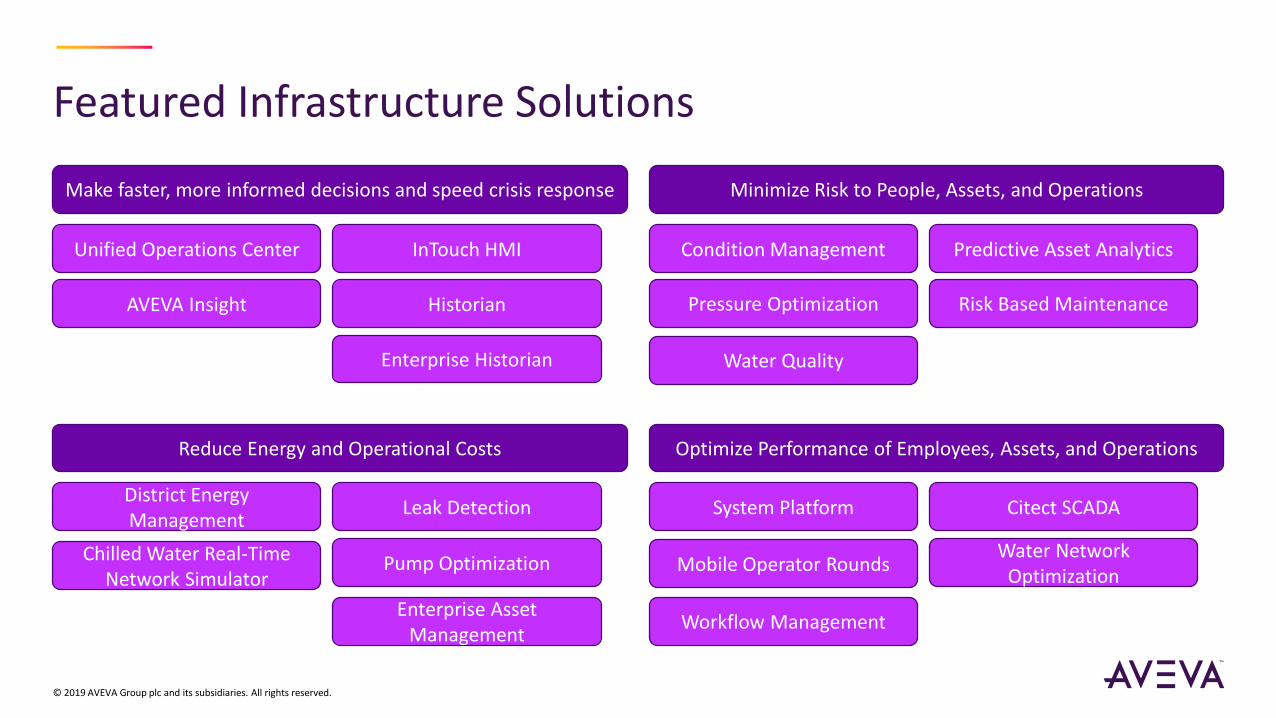
Featured Infrastructure Solutions
© 2019 AVEVA Group plc and its subsidiaries. All rights reserved.
Minimize Risk to People, Assets, and Operations
Reduce Energy and Operational Costs Optimize Performance of Employees, Assets, and Operations
Make faster, more informed decisions and speed crisis response
Unified Operations Center InTouch HMI
District Energy Management
Leak Detection
Condition Management Predictive Asset Analytics
Risk Based MaintenancePressure Optimization
System Platform Citect SCADA
AVEVA Insight Historian
Water QualityEnterprise Historian
Enterprise Asset Management
Pump Optimization Mobile Operator RoundsChilled Water Real-Time
Network Simulator
Water Network Optimization
Workflow Management

Common, Integrated, Visionary UtilitiesHOFOR Copenhagen, Denmark
6
Source: hofor.dk

District Energy Challenges
• Utilities must reduce energy consumption
and CO2 emissions
• Constant supply temperature often used
despite changing weather conditions and
consumer demand
• Typical SCADA system only has partial
view of network behavior
• 80% of capital investment is in network
outside the plant, but mostly unmonitored
© 2019 AVEVA Group plc and its subsidiaries. All rights reserved.
Existing Control Practices Not Good Enough
LimitedTemperatureSensing

AVEVA’s District Energy Management solution is the preferred planning, design, and optimization tool for the City of Copenhagen utilized to reduce costs and emissions while ensuring seamless network expansion to new customers.
District Energy ManagementCopenhagen, Denmark
8
< 1 Yearto Realize ROI
1320 KM of piping distributing1500 MW production
1M€ Per Year Cost SavingsDue to Reduced Heat Loss

Session Speakers
© 2019 AVEVA Group plc and its subsidiaries. All rights reserved.
1
2
3
4
Jayaraman Venkatesh, Larsen & Toubro
Vinod Singh, Jacobs Engineering
Poyan Rajamand, Barghest Building Performance
Sherie Ng, Microsoft

L&T’s experience in the Indian Water Sector
Reducing urban water loss
© 2019 AVEVA Group plc and its subsidiaries. All rights reserved.
Jayaraman Venkatesh, Head of Water Management, Larsen & Toubro

Sensitivity: LNT Construction Internal UseSensitivity: LNT Construction Internal Use
L&T Construction
Sensitivity: LNT Construction Internal UseSensitivity: LNT Construction Internal Use
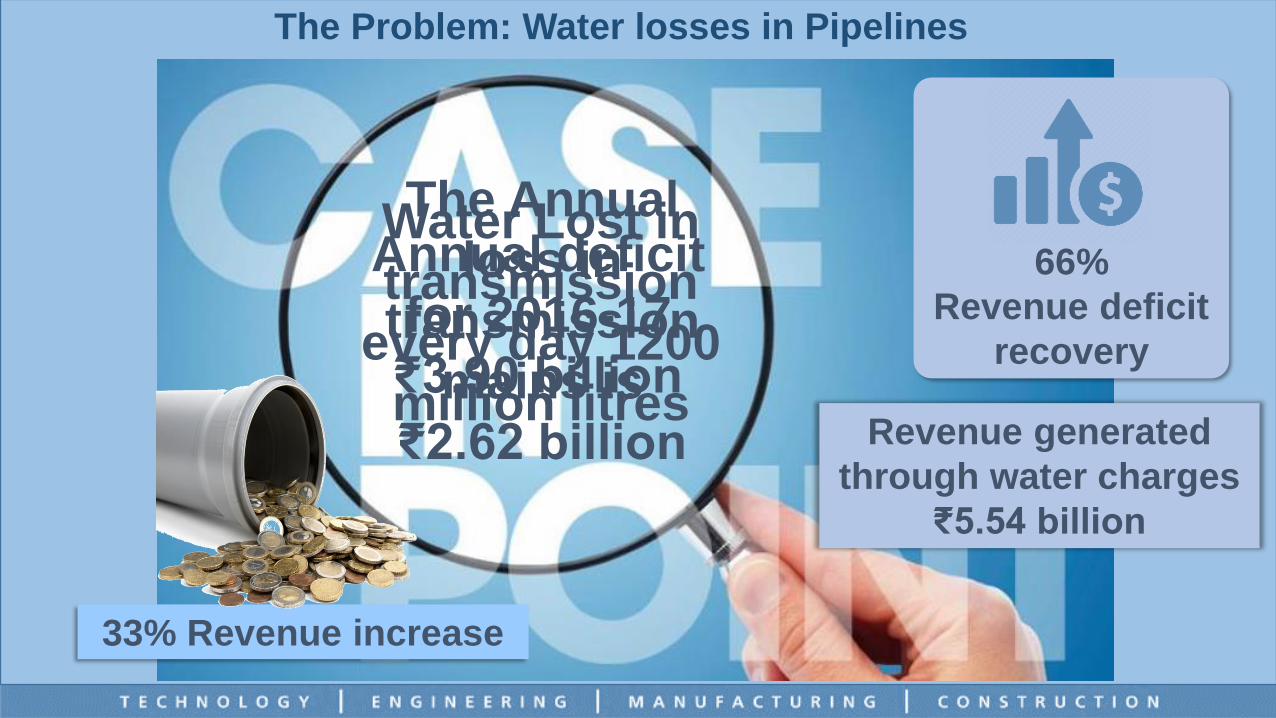
The Annual
loss in
transmission
mains is
₹2.62 billion
Water Lost in
transmission
every day 1200
million litres
Annual deficit
for 2016-17
₹3.90 billion
33% Revenue increase
Revenue generated
through water charges
₹5.54 billion
66%
Revenue deficit
recovery
The Problem: Water losses in Pipelines

Sensitivity: LNT Construction Internal UseSensitivity: LNT Construction Internal Use
Bangalore Water Supply & Sewerage Board
Project Showcase
Unaccounted for Water (UFW) Reduction in Bangalore city

Sensitivity: LNT Construction Internal UseSensitivity: LNT Construction Internal Use
System Input
Volume
Authorized
Consumption
Billed
Authorized
Consumption
Billed Metered Consumption
(including exported) Billed
Consumption
Revenue
Water
Billed Unmetered Consumption
Unbilled
Authorized
Consumption
Unbilled Metered ConsumptionUnbilled
Consumption
Non-Revenue
Water (NRW)
Unbilled Unmetered Consumption
Water Losses
Apparent Losses
Unauthorized Consumption
Unaccounted For
Water (UFW)
Customer Metering Inaccuracy
Data Handling Error
Real Losses
Leakage on Transmission & Distribution Mains
Leakage & Over Flow at Water Storage Tanks
Leakage on Service Connections up to the
Point of Metering
UFW vs NRW

Sensitivity: LNT Construction Internal UseSensitivity: LNT Construction Internal Use
MultiJet Meters
• Manual Reading
• Time consuming
• Meter Inaccuracies
• Human error
• Can be tampered
Unmetered
• Flat rate tariffs
• Consumption not
quantified
• Billing not justified
• Funding constraints
AMR Meters
• Wireless
transmission
• Handheld
receiver
• Walk-by /
Drive-by data
collection
Challenges in measurement
AMI Meters
• Real time data
(daily/hourly)
• Two way
communication,
Fixed Network
• Customer friendly
• Quick response

Sensitivity: LNT Construction Internal UseSensitivity: LNT Construction Internal Use
16
Challenges in execution
Condition Assessment
Multiple pipes, Inadequate data,
Cables & FOCs
Permission for Road cutting
Road DLPs, Multiple line
agencies
Intermittent supply
3-5 hours daily supply at different
hours at low pressure
Illegal Connections
Socio-Political issues,
Inertia to Pay

Sensitivity: LNT Construction Internal UseSensitivity: LNT Construction Internal Use
GNSS & Topo
Survey
Flow & Pressure
measurement
GIS &Hydraulic Modeling
Pipe Condition
Assessment
Water Balance
Installation of DM
Pressure Zero Test
Determine Baseline
LevelAssessment
for Asset Replacement
Leak Detection
Replacement of Assets
Leak RepairFinal UFW
Assessment
Activity flow

Sensitivity: LNT Construction Internal UseSensitivity: LNT Construction Internal Use
UFW Reduction
0.0%
10.0%
20.0%
30.0%
40.0%
50.0%
60.0%
70.0%
Jaimaruthi nagar CPT Layout KS town Sanjaynagar south Bapuji nagar Goraguntepalya
42.8%46.0% 48.2%
54.1%
62.1%66.0%
25.4%
15.5% 15.2%
9.2%
20.9%
6.6%
InitialUFW
FinalUFW

Sensitivity: LNT Construction Internal UseSensitivity: LNT Construction Internal Use
Pressure Improvement
0.0
5.0
10.0
15.0
20.0
25.0
Magadi road Agraharadasarahalli
Suvarana layout Panthrapalya ITI layout Roshan nagar
0.6
2.4
5.2 5.46.2
7.8
3.6
7.6
10.6
13.5
20.9
12.0
InitialPressure (m)
FinalPressure (m)

Sensitivity: LNT Construction Internal UseSensitivity: LNT Construction Internal Use
01
03
05
07
02
04
06
08
Enhanced consumer satisfaction through better service delivery
Improved revenue and bill generation for BWSSB
Improved customer service through adequate pressure & better water quality
Diligent investment planning by BWSSB on asset management
Reduced operational cost for BWSSB through network
management & UFW reduction
Eliminated illegal connections & streamlined metering
Better accountability of water by consumers (pay for water consumed)
Deployment of customised technology and O&M practices
Key takeaways

Sensitivity: LNT Construction Internal UseSensitivity: LNT Construction Internal Use
Pressure, Flow & Noise Sensors
21
Pressure Transient Analysis
Digital trends & solutions
2012 2013 2014 2015 2016 2017 2018 2019
Model CalibratorPipe Renewal Planner Synthetic Aperture Radar
Satellite Image Acquisition
In-line Crawlers: Imaging,IR & Sonar SensorsOnline leak detection
Aquis Water Network Management

Session Speakers
© 2019 AVEVA Group plc and its subsidiaries. All rights reserved.
1
2
3
4
Jayaraman Venkatesh, Larsen & Toubro
Vinod Singh, Jacobs Engineering
Poyan Rajamand, Barghest Building Performance
Sherie Ng, Microsoft

A New Digital Augmented Approach
Optimized and reliable operations for Water and Wastewater
© 2019 AVEVA Group plc and its subsidiaries. All rights reserved.
Vinod Singh, Director, Asia Region, Jacobs Engineering

Jacobs EngineeringWe provide Digital Solutions for a more connected sustainable world

Challenges Facing Water Utilities
• Increasing water demand due to population growth, migration and industrial activities
• Climate variabilities and its impact
• Fragmented industries and hence supply chain is not integrated
• Lack of trust by people it serves (Primarily in developing countries)
• Uncertainty and inefficiencies in operations
• Water is a highly undervalue commodities in Asia
• Data asymmetry
• High level of leakage and Non-Revenue Water (NRW)
• Under pressure to modernize and its service level as demanded by millennials
• Under funded, long gestation period, projects are not delivered in time
• Assets are not well or rightly maintained .. High UFW/ NRW, WWTP does not comply with the
discharge standards ..

A new Digital Augmented Approach
With this background, digital tech can augment deep domain expertise to
bring optimization and reliability in water sector
Water systems have an opportunity to create a new paradigm –
disruptive change

Digital Twin for Wastewater Treatment Plant
Simulation Model with Predictive Capabilities
• Develop a dynamic simulation model for
WWTP that integrates the individual
hydraulic, process and control system with
predictive capabilities to forewarn
operators of potential process
deviations and poor effluent
quality.
• Simulation model will cover the Liquids
and Solids streams
• “Flight Simulator” for Operator Training
and Scenario Analysis
Source: Innovation in Water Singapore Volume 11/ June 2019

ResultsPredictive Maintenance

Project Overview – Functionality and Benefits
Digital Twin Benefits
• Replicates all significant aspects of a facility on a digital
platform, hydraulics, I&C, process.
• Increasing Productivity by... Providing operators with
real-time operation insights. Speed up process trouble-
shooting.
• Enhancing Resilience of Operations by... Building
predictive capabilities to make plant performance more
resilient. Enable "flight simulator" for operator training.
• Optimize critical operation scenarios by allowing safe
evaluation of operating strategies
• Potentially allow online, model-based operations using a
calibrated dynamic model for hydraulics, controls and
process (water quality)
Digital Twin Functionality
• Operations / Engineering Scenario Evaluation (what
if?)
The digital twin will keep an updated/calibrated model
that can be used by staff to evaluate various scenarios
• Process Monitoring (looking back)
On a daily basis the system will compare predicted
versus observed performance and flag unusual items
for operations attention
• Performance Prediction (looking forward)
On a daily basis the digital twin will look up to 5 days
into the future and estimate likelihood of defined
events.
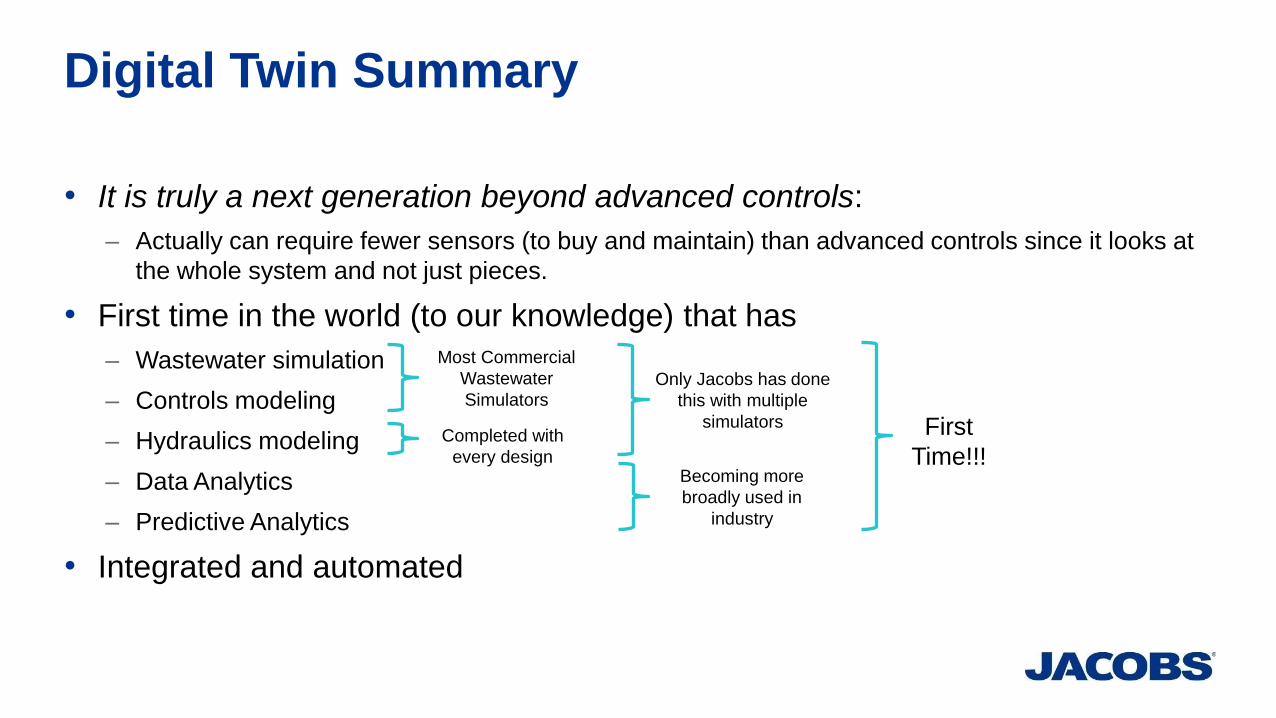
Digital Twin Summary
• It is truly a next generation beyond advanced controls:
– Actually can require fewer sensors (to buy and maintain) than advanced controls since it looks at
the whole system and not just pieces.
• First time in the world (to our knowledge) that has
– Wastewater simulation
– Controls modeling
– Hydraulics modeling
– Data Analytics
– Predictive Analytics
• Integrated and automated
Most Commercial
Wastewater
SimulatorsOnly Jacobs has done
this with multiple
simulators First
Time!!!Completed with
every designBecoming more
broadly used in
industry

• Challenge: minimize wet weather overflows from decentralized facilities and
efficiently manage watersheds
• Sensors, flow meters, and gauges were designed to transmit data with
Internet of Things (IoT) devices and cloud technology
• Enabled MSD timely visualization of flow conditions and maintenance of
coordinated wet weather control
• Mobile access to GIS dashboard enabled immediate access performance
monitoring and reporting data
• Timely data transmission enhances service reliability and provides
actionable information for rapid response
• Staff now have the ability to access conditions and make decisions anytime,
anywhere
• The data-driven system enables MSD to adequately prepare for storms
through predictive analytics and alerting algorithms
Smart Sewer Solutions for Wet Weather ManagementDATA ANALYTICS
C U S T O M E R : M E T R O P O L I T AN S E W E R D I S T R I C T
O F G R E AT E R C I N C I N N AT I
L O C A T I O N : C I N C I N N AT I , O H I O
The utility saved over $300 million by utilizing
their assets more intelligently. Annual overflow
volumes were reduced by over half a billion
gallons without additional infrastructure

Important
The material in this presentation has been prepared by Jacobs®.
Copyright and other intellectual property rights in this presentation vest exclusively with
Jacobs. Apart from any use permitted under applicable copyright legislation, no part of this
work may in any form or by any means (electronic, graphic, mechanical, photocopying,
recording or otherwise) be reproduced, copied, stored in a retrieval system or transmitted
without prior written permission.
Jacobs is a trademark of Jacobs Engineering Group Inc.
Copyright
September 20, 2019
Jacobs Engineering Group Inc. All rights reserved.
Disclaimer
©

Session Speakers
© 2019 AVEVA Group plc and its subsidiaries. All rights reserved.
1
2
3
4
Jayaraman Venkatesh, Larsen & Toubro
Vinod Singh, Jacobs Engineering
Poyan Rajamand, Barghest Building Performance
Sherie Ng, Microsoft

Performance-based Analytics Service
Reduced energy costs with no upfront investment by facility operators
© 2019 AVEVA Group plc and its subsidiaries. All rights reserved.
Poyan Rajamand, CEO and Co-Founder, Barghest Building Performance

BPP’s Techno commercial package has allowed for fast regional growth
Barghest Building Performance | AVEVA World Summit 2019
Retail Office Industry Hospitality
Our Clients Our Presence
India
Xian
South Korea
Taipei
Philippines
Indonesia
Thailand
Malaysia
Singapore
Head quarterPresence

Significant costs savings are available to a wide variety
of facility operators
Climate control systems are major user of
energy in all buildings
Cooling Lighting Ventilation
Lift & Escalator Others
Process specific
systems
Cooling & Refrigeration
systems
Others
Gas
CompressorsPumpsCompressed air
systems
49% 51%37%
12%
IT Systems Cooling Electrical Distribution
Office
10 years old
S$100,000annual savings
Malls
8 years old
S$400,000annual savings
Hotels
11 years old
S$100,000annual savings
Industry
19 years old
S$1,000,000annual savings
District Cooling
5 years old
S$1,000,000annual savings
Source: NEA – Energy Use Reports and Energy Efficiency Improvement Plans 2014, National Climate Change Council - Building Energy Efficiency R&D Road map Singapore NCCS 2014 report, The Green Data Center Technology Roadmap – NCCS report 2014
Data and advanced control improves operation of climate control systems
Barghest Building Performance | AVEVA World Summit 2019

37
Existing Climate Control Systems require an additional layer of automation
Barghest Building Performance | AVEVA World Summit 2019

Performance-based Services Contracting allows savings with no up-front costs to client
Savings calculated by independent third partyPortion of savings to
service provider
Net savings to client
Barghest Building Performance | AVEVA World Summit 2019
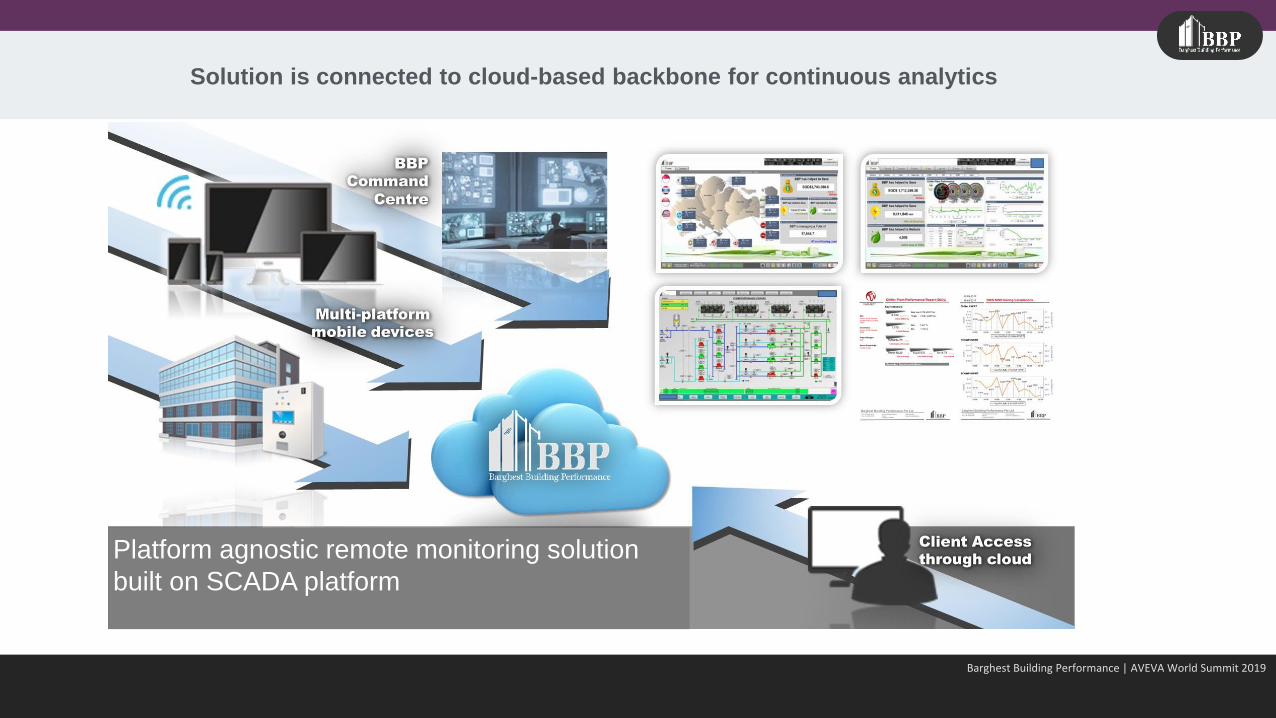
Solution is connected to cloud-based backbone for continuous analytics
Barghest Building Performance | AVEVA World Summit 2019
Platform agnostic remote monitoring solution
built on SCADA platform

Dedicated analytics team continuously implements insights created
Barghest Building Performance | AVEVA World Summit 2019

Office Building Case Study – Bank Singapore
Results ▪ 36 % improvement from baseline ▪ Contributing to ~800,000 kWh annual energy savings▪ Meeting Green Mark Plant Efficiency Requirements
36% improvement
Barghest Building Performance | AVEVA World Summit 2019

Session Speakers
© 2019 AVEVA Group plc and its subsidiaries. All rights reserved.
1
2
3
4
Jayaraman Venkatesh, Larsen & Toubro
Vinod Singh, Jacobs Engineering
Poyan Rajamand, Barghest Building Performance
Sherie Ng, Microsoft

Enabling a Sustainable Future
CityNext
© 2019 AVEVA Group plc and its subsidiaries. All rights reserved.
Sherie Ng, General Manager, Public Sector, Asia-Pacific, Microsoft

of the world’s energy is consumed in cities
0 0 1 0 1 0 1 0 0 0 0 1 0 1 0 1 0 0 1 1 0 1 1 1 1 0 1 0 1 0 1 1 1 1 0 1 0 1 0 1 1 0 1 1 1 0 1 1 1 0 0 0 1 1 1 1 0 0 1 0 0 0 1 0 0 0 0 1 0 0 0 1 0 0 1 0 1 0 1 1 0 1 0 0 0 1 1 0 0 1 0 0 0 1 1 1 0 0 1 1 1 0 0 0 1 1 1 1 0 0 1 0 0 0 1 0 0 0 0 1 0 0 0 1 0 0 1 01 0 1 0 1 1 1 0 0 0 1 1 1 1 0 0 1 0 0 0 1 0 0 0 0 1 0 0 0 1 0 0 1 0 1 0 1 0 1 1 1 0 0 0 1 1 1 1 0 0 1 0 0 0 1 0 0 0 0 1 0 0 0 1 0 0 1 0 1 0 1 0 1 1 1 0 0 0 1 1 1 1 0 0 1 0 0 0 1 0 0 0 0 1 0 0 0 1 0 0 1 0 1 0 1 0 1 1 1 0 0 0 1 1 1 1 0 0 1 0 0 0 1 0 0 0 0 10 0 0 1 0 0 1 0 1 0 1 0 1 1 1 0 0 0 1 1 1 1 0 0 1 0 0 0 1 0 0 0 0 1 0 0 0 1 0 0 1 0 1 0 1 0 1 1 1 0 0 0 1 1 1 1 0 0 1 0 0 0 1 0 0 0 0 1 0 0 0 1 0 0 1 0 1 0 1 0 1 1 1 0 0 0 1 1 1 1 0 0 1 0 0 0 1 0 0 0 0 1 0 0 0 0 1 0 1 0 1 0 0 1 1 0 1 1 1 1 0 1 0 1 0 1 1 11 0 1 0 1 0 1 1 0 1 1 1 0 1 1 1 0 0 0 1 1 1 1 0 0 1 0 0 0 1 0 0 0 0 1 0 0 0 1 0 0 1 0 1 0 1 1 0 1 0 0 0 1 1 0 0 1 0 0 0 1 1 1 0 0 1 1 1 0 0 0 1 1 1 1 0 0 1 0 0 0 1 0 0 0 0 1 0 0 0 1 0 0 1 0 1 0 1 0 1 1 1 0 0 0 1 1 1 1 0 0 1 0 0 0 1 0 0 0 0 1 0 0 0 1 0 0 10 1 0 1 0 1 1 1 0 0 0 1 1 1 1 0 0 1 0 0 0 1 0 0 0 0 1 0 0 0 1 0 0 1 0 1 0 1 0 1 1 1 0 0 0 1 1 1 1 0 0 1 0 0 0 1 0 0 0 0 1 0 0 0 1 0 0 1 0 1 0 1 0 1 1 1 0 0 0 1 1 1 1 0 0 1 0 0 0 1 0 0 0 0 1 0 0 0 1 0 0 1 0 1 0 1 0 1 1 1 0 0 0 1 1 1 1 0 0 1 0 0 0 1 0 0 0 01 0 0 0 1 0 0 1 0 1 0 1 0 1 1 1 0 0 0 1 1 1 1 0 0 1 0 0 0 1 0 0 0 0 1 0 0 0 1 0 0 1 0 1 0 1 0 1 1 1 0 0 0 1 1 1 1 0 0 1 0 0 0 1 0 0 0 0 1 0 0 0 0 1 0 1 0 1 0 0 1 1 0 1 1 1 1 0 1 0 1 0 1 1 1 1 0 1 0 1 0 1 1 0 1 1 1 0 1 1 1 0 0 0 1 1 1 1 0 0 1 0 0 0 1 0 0 00 1 0 0 0 1 0 0 1 0 1 0 1 1 0 1 0 0 0 1 1 0 0 1 0 0 0 1 1 1 0 0 1 1 1 0 0 0 1 1 1 1 0 0 1 0 0 0 1 0 0 0 0 1 0 0 0 1 0 0 1 0 1 0 1 0 1 1 1 0 0 0 1 1 1 1 0 0 1 0 0 0 1 0 0 0 0 1 0 0 0 1 0 0 1 0 1 0 1 0 1 1 1 0 0 0 1 1 1 1 0 0 1 0 0 0 1 0 0 0 0 1 0 0 0 1 0 01 0 1 0 1 0 1 1 1 0 0 0 1 1 1 1 0 0 1 0 0 0 1 0 0 0 0 1 0 0 0 1 0 0 1 0 1 0 1 0 1 1 1 0 0 0 1 1 1 1 0 0 1 0 0 0 1 0 0 0 0 1 0 0 0 1 0 0 1 0 1 0 1 0 1 1 1 0 0 0 1 1 1 1 0 0 1 0 0 0 1 0 0 0 0 1 0 0 0 1 0
Cities are where the action is…
80%
68% Global population will live in cities by 2050
180 zettabytesof data available by 2025
of GDP is created in cities
80%75%of the countries carbon emissions

What if we could create the most
liveable city on the planet?

Total Waste
Sewage levelFleet data
Energy consumed
Parking spaces
Air Quality
Water Impurity
Traffic
Carbon emission
Aging Infra

Total Waste
Sewage levelFleet data
Energy consumed
Parking spaces
Air Quality
Water Impurity
Traffic
Carbon emission
Aging Infra
What does this mean for you?
Save Time
Make city
greener
New
policies
Safety
&
Health

Technology Enabling Cities & Metrostoday
Artificial Intelligence
3D Printers1% of 2007 Cost
Smartphones
IoT Sensors.
Internet/5G
Blockchain
Industrial Robots
Mixed Reality
Drones
Cloud
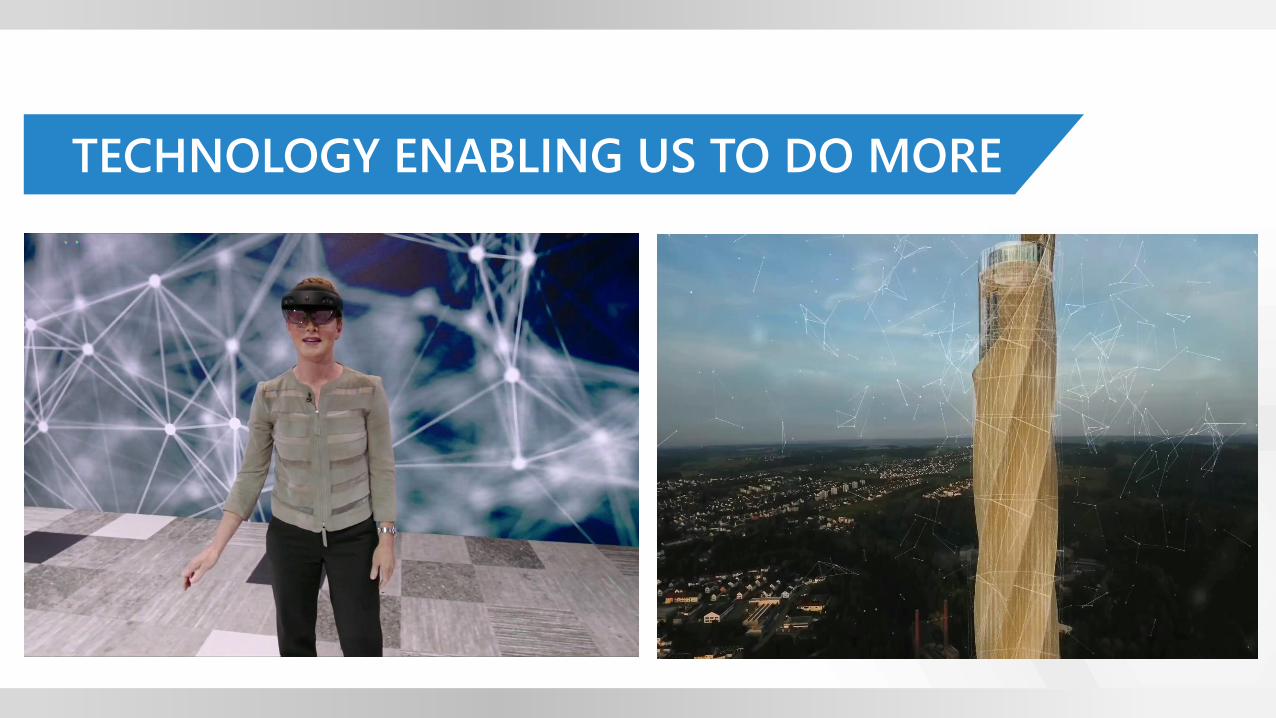
TECHNOLOGY ENABLING US TO DO MORE

Connected
Urban Mobility
Public Safety
and Security
Smart
Education
Smart
Hospital

Connected
Urban Mobility
Public Safety
and Security
Smart
Education
Smart
Hospital

Connected
Urban Mobility
Public Safety
and Security
Smart
Education
Smart
Hospital

Connected
Urban Mobility
Public Safety
and Security
Smart
Education
Smart
Hospital
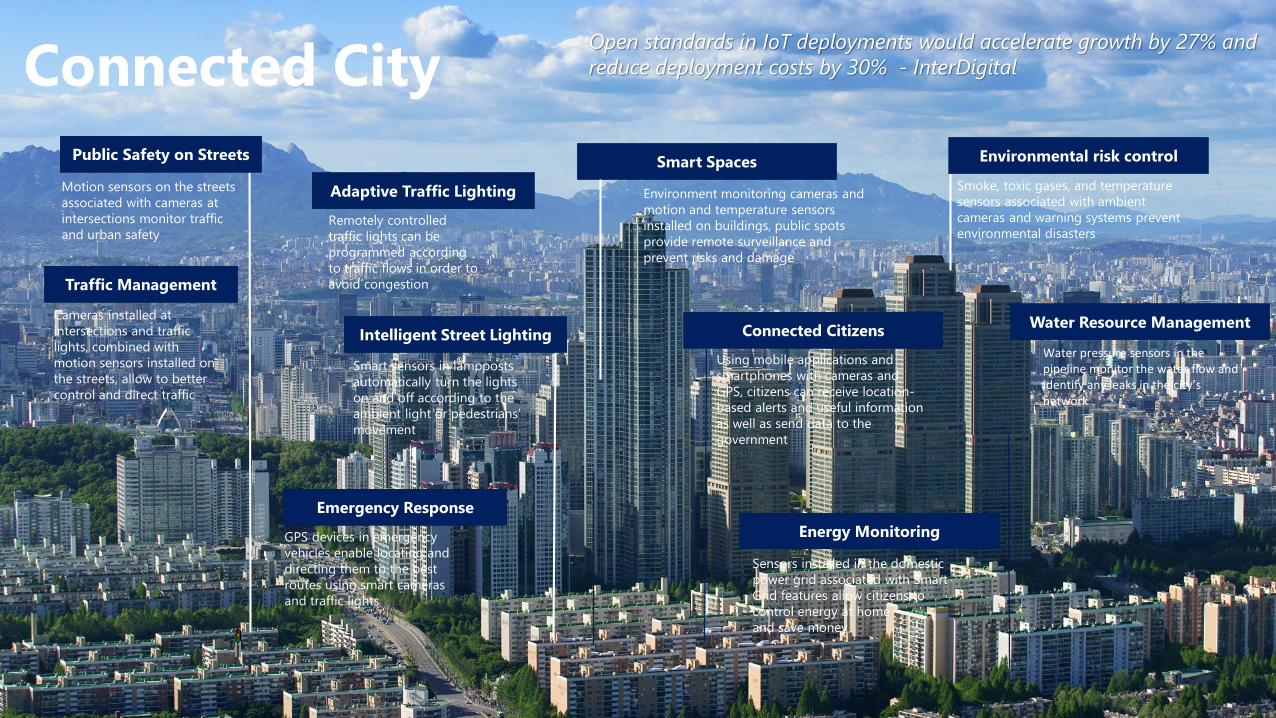
Connected City
Smart Spaces
Environment monitoring cameras and
motion and temperature sensors
installed on buildings, public spots
provide remote surveillance and
prevent risks and damage
Connected Citizens
Using mobile applications and
smartphones with cameras and
GPS, citizens can receive location-
based alerts and useful information
as well as send data to the
government
Energy Monitoring
Sensors installed in the domestic
power grid associated with Smart
Grid features allow citizens to
control energy at home
and save money
Intelligent Street Lighting
Smart sensors in lampposts
automatically turn the lights
on and off according to the
ambient light or pedestrians’
movement
Water Resource Management
Water pressure sensors in the pipeline monitor the water flow and identify any leaks in the city’s network
Emergency Response
GPS devices in emergency
vehicles enable locating and
directing them to the best
routes using smart cameras
and traffic lights
Traffic Management
Public Safety on Streets
Adaptive Traffic LightingMotion sensors on the streets
associated with cameras at
intersections monitor traffic
and urban safety
Cameras installed at
intersections and traffic
lights, combined with
motion sensors installed on
the streets, allow to better
control and direct traffic
Remotely controlled
traffic lights can be
programmed according
to traffic flows in order to
avoid congestion
Environmental risk control
Smoke, toxic gases, and temperature
sensors associated with ambient
cameras and warning systems prevent
environmental disasters
Open standards in IoT deployments would accelerate growth by 27% and
reduce deployment costs by 30% - InterDigital

Panel Discussion
1
2
3
Jayaraman Venkatesh, Larsen & Toubro
Vinod Singh, Jacobs Engineering
Poyan Rajamand, Barghest Building Performance
4 Sherie Ng, Microsoft

© 2019 AVEVA Group plc and its subsidiaries. All rights reserved.56

This presentation may include predictions, estimates, intentions, beliefs and other statements
that are or may be construed as being forward-looking. While these forward-looking statements
represent our current judgment on what the future holds, they are subject to risks and
uncertainties that could result in actual outcomes differing materially from those projected in
these statements. No statement contained herein constitutes a commitment by AVEVA to
perform any particular action or to deliver any particular product or product features. Readers
are cautioned not to place undue reliance on these forward-looking statements, which reflect our
opinions only as of the date of this presentation.
The Company shall not be obliged to disclose any revision to these forward-looking statements to
reflect events or circumstances occurring after the date on which they are made or to reflect the
occurrence of future events.
© 2019 AVEVA Group plc and its subsidiaries. All rights reserved.57

linkedin.com/company/aveva
@avevagroup
ABOUT AVEVA
AVEVA is a global leader in engineering and industrial software driving digital transformation across the entire asset and operational life cycle of capital-intensive industries.
The company’s engineering, planning and operations, asset performance, and monitoring and control solutions deliver proven results to over 16,000 customers across the globe. Its customers are supported by the largest industrial software ecosystem, including 4,200 partners and 5,700 certified developers. AVEVA is headquartered in Cambridge, UK, with over 4,400 employees at 80 locations in over 40 countries.
aveva.com
© 2019 AVEVA Group plc and its subsidiaries. All rights reserved.58