Transforming Dryland Sheep and Beef Farms4_3 size).pdf · Transforming Dryland Sheep and Beef Farms...
77
Transforming Dryland Sheep and Beef Farms Professor Derrick Moot Ararat 14 September 2016 This work by Prof. Derrick Moot and the Lincoln University Dryland Pastures Research Team is licensed under a Creative Commons Attribution-NonCommercial-NoDerivatives 4.0 International License.
Transcript of Transforming Dryland Sheep and Beef Farms4_3 size).pdf · Transforming Dryland Sheep and Beef Farms...

Transforming Dryland Sheep and Beef Farms
Professor Derrick Moot
Ararat 14 September 2016This work by Prof. Derrick Moot and the Lincoln University Dryland Pastures Research Team is licensed under a Creative Commons Attribution-NonCommercial-NoDerivatives 4.0 International License.


Value of support

Source: Dr. Pieter Tans, NOAA/ESRL (www.esrl.noaa.gov/gmd/ccgg/trends/) and Dr. Ralph Keeling, Scripps Institution of Institution of Oceanography (scrippsco2.ucsd.edu/)

NIWA 2013
Strong rainfall gradient West ⇒ East

What is sustainable farming?
A Farm practice that achieves;• Production – a desired goal e.g. MS/ha • Risk – reduces the risk of not achieving the production
goal e.g. maize silage• Economic – medium term profitability• Environment – sustainable for soil, water, air and
other resources e.g. erosion• Social – socially acceptable – “dirty dairying”
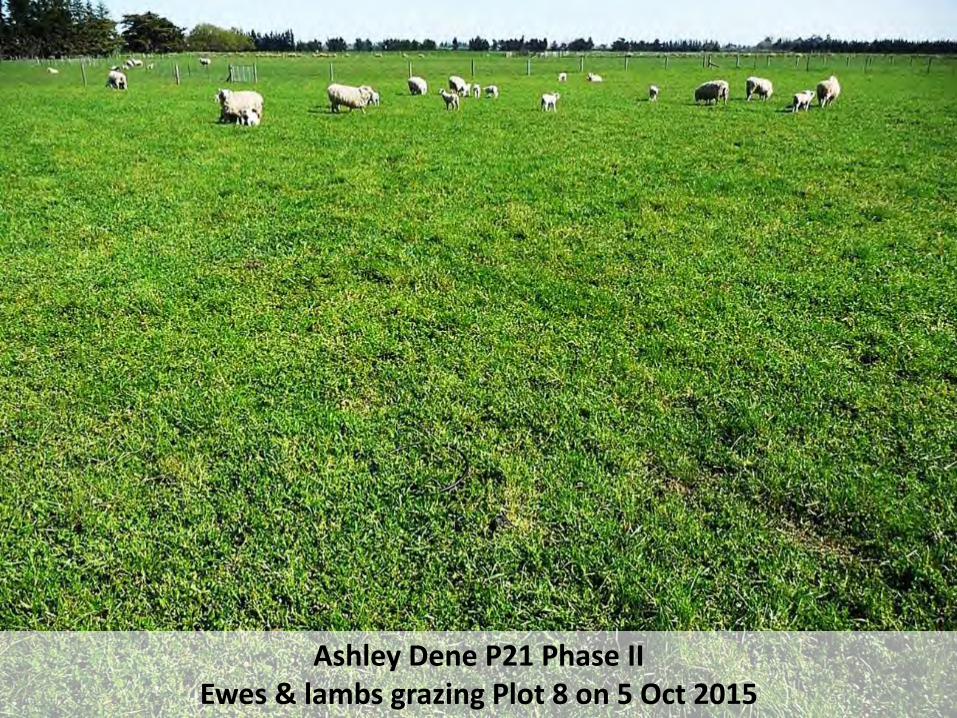
Ashley Dene P21 Phase IIEwes & lambs grazing Plot 8 on 5 Oct 2015

Ashley Dene 9 Jan 2015
Required lamb growth = 5 to 35 kg
in ~100 days
Phot
o: A
Mills
Linc
oln
Uni
vers
ity

Experiment site – Quantify growth

15.7 t/ha
Just add Nitrogen
6.3 t/ha
Dryland
Water + Nitrogen21.9 t/ha
MonthJ A S O N D J F M A M J J
Grow
th ra
te (k
g/ha
/d)
0
30
60
90
120Just add water
9.8 t/ha
Growth rates (2 year means)
Mills et al. 2006, 2009

Winter ⇒ temperature response

Thermal time (°Cd)0 1000 2000 3000
DM y
ield
(t/h
a)
0
10
20
30
Water & Nitrogen
y = 7.0 kg DM/ha/oCd21.9 t/ha
Water but No Nitrogen
y = 3.3 kg DM/ha/oCd
9.8 t/ha
Where do we get our N?
Mills et al. 2006; 2009

Water and nitrogen = ryegrass(230,000 ha irrigated dairy)
Pho
to: D
r WR
Sco
ttLi
ncol
n U
nive
rsity

Moot et al. 2010: Department of Statistics
Deer & cattle numbers in Canterbury
Year1990 1995 2000 2005 2010 2015
Stoc
k nu
mbe
rs (m
illion
s)
0.0
0.2
0.4
0.6
0.8
1.0
1.2
1.4Beef cattle Dairy cattleDeer

Year
N c
onsu
mpt
ion
('000
t)
0
100
200
300
400
500
6 000 t
397 000 t
Fertiliser N use in NZ- Nationally sustainable?
NZ Fertiliser Association 2015

Year1960/61 1970/71 1980/81 1990/91 2000/01 2010/11
CO
2em
itted
dur
ing
the
man
ufac
ture
of N
app
lied
(t)
0
250000
500000
750000
1000000
1250000
1500000
CO2 emitted in production of our N- Globally sustainable?
Based on energy use of 65 MJ/kg N produced and an emission rate of 0.05 kg CO2/MJ energy used (Saunders et al. 2006)
1960/6119,500 t CO2
2013/141,290,250 t CO2

West Coast Tasman
Southland
Year1990 1995 2000 2005 2010Regi
onal
nitr
ate
leac
hing
per
yea
r (t)
0
5000
10000
15000
20000
25000
Regional annual nitrate losses- Sustainable regionally?
Canterbury OtagoMarlborough
Redrawn from Dymond et al. 2013

Mean annual nitrate levels in Harts Creek - Sustainable locally?
Year1995 2000 2005 2010 2015N
itrat
e an
d N
itrite
Nitr
ogen
(mg/
L) (d
etec
tion
limits
hal
ved)
National bottom line for nitrate toxicity in streams
0
2
4
6
8
10
Data ©Environment Canterbury

Evapotranspiration
1000 kg N/ha

- Limited water supply- N to make plants grow!- Meet animal demand (lactation)- Minimize impact on air, soil, water- Productive and profitable- Socially acceptable
Legume dominant
Future pastures

High feeding value pastures have;- high legume content- high leaf content- low stem content- young herbage age

Sheep prefer 70% legume, 30% grassP
hoto
: Jo
Grig
g‘T
empe
llo’ M
arlb
orou
gh

40% White clover

Good quality lucerne
Mostly clover pastureLi
vew
eigh
t g (g
/day
)
-300
+400
0
+300
+200
-100
+100
-200
8 9 10 11 12 13
All dead and stem
Poor hay
Good quality hay
Bailage/silage
50% stem or dead, little clover
Average ryegrass clover growing
pasture
Ewe milk
Rape Pasja
Swedes & turnips
Energy value of diet (MJ ME/kg DM)
Adapted from: 400 Plus. A guide to improved lamb growth

Nitrogen fixation25-30 kg N/t DM Lucas et al. 2010
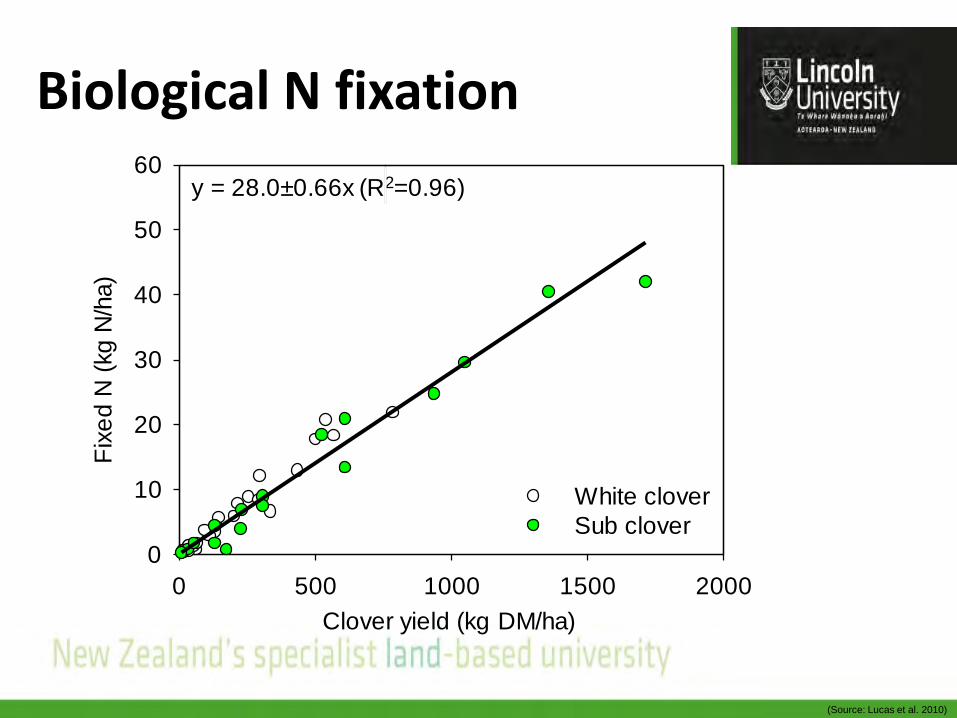
Biological N fixation
(Source: Lucas et al. 2010)
Clover yield (kg DM/ha)0 500 1000 1500 2000
Fixe
d N
(kg
N/h
a)
0
10
20
30
40
50
60
White cloverSub clover
y = 28.0±0.66x (R2=0.96)

Summer ⇒ moisture responseMills 2007

Water stress effect on yield
D+N
15.7 t/ha
21 Nov 30 Jan
Thermal time0 1000 2000 3000
DM
yie
ld (t
/ha)
0
10
20
30I+N
y = 7.0 kg DM/ha/oCd
21.9 t/ha
Mills et al. 2006

Rain
fall
(mm
)
0
50
100
Thermal time (°Cd)0 1000 2000 3000
Defic
it (m
m)
0
50
100
150
D+ND-N
Total rain = 520 mm
Soil moisture deficit 2003/04
Mills 2007

The ‘MaxClover’ Grazing experiment in paddock H19 at Lincoln University
RG/WcLucerneCF/SubCF/BalansaCF/CcCF/Wc

Date
Jul02 Jan03 Jul03 Jan04 Jul04 Jan05 Jul05 Jan06 Jul06 Jan07 Jul07 Jan08 Jul08 Jan09 Jul09 Jan10 Jul10 Jan11 Jul11
Tota
l ann
ual a
ccum
ulat
ed D
M y
ield
(t D
M/h
a/y)
0
5
10
15
17.8
12.9
10.5 9.8
8.9
13.1
11.5
10.5
8.4
18.5
11.2
10.0 9.0
11.5
10.0
8.0
17.4
10.810.0
8.4
14.0
11.2
9.0
7.1
14.0
9.0
6.6
5.2
Year 12002/03
Year 32004/05
Year 42005/06
Year 52006/07
Year 62007/08
Year 72008/09
Year 22003/04
Year 82009/10
Year 92010/11
12.8
9.5
8.4
6.7
12.9
8.7
5.8
461 mm 493 mm 635 mm 601 mm 643 mm 651 mm 767 mm 612 mm 602 mm
Total annual accumulated dry matter production
Rainfall
CF/SubCF/Bal CF/Wc CF/Cc RG/Wc Luc
Source: Moot 2012

Growth season1 2 3 4 5 6 7 8 9
Pro
porti
on o
f sow
n co
mpo
nent
s
0.0
0.2
0.4
0.6
0.8
1.0
2002/03 2003/04 2004/05 2005/06 2006/07 2007/08 2008/09 2009/10 2010/11
All the cocksfoot pastures lost sown components at about 3% per annum
The perennial ryegrass/white clover pasture lost RG+Wc at about 10% per annum
Mills et al. 2014a
Change in the proportion of originally sown pasture components (grass + clover) over time

Yr 8 Summer(Dec 2009)RG/Wc
Summer rainfall was about 30% below average and the sheep grazing in the background continue to avoid the less palatable dying seedheads of the invading grasses.
There is no evidence of perennial ryegrass seedheads in this image.
Much of the green material is goose grass, Vulpia and Poa annua.
http://www.lincoln.ac.nz/PageFiles/23851/MaxClover-Photo-Diary.pdf

Yr 8 Spring(Sept 2009)CF/Sub
CF/Sub pasture in Plot 5.
In Yr 8 the 2.4 t/ha of yield contributed by sub clover was more than double the clover yield produced from any other grass based pasture.
For the spring period (to 16 Nov 2009) about 40% of the DM yield on offer was sub clover.
http://www.lincoln.ac.nz/PageFiles/23851/MaxClover-Photo-Diary.pdf

Yr 8 Spring (Sept 2009)Luc
First spring grazing with ewes and twin lambs at foot.
Lucerne yield was 12.8 t DM/ha compared with the 6.7 (CF/Wc) to 9.5 t DM/ha (CF/Sub) produced by the grass based pastures.
Rainfall for the Jul-Nov period was 195 mm and almost 30% below average. Summer rainfall was also below average in Year 8. http://www.lincoln.ac.nz/PageFiles/23851/MaxClover-Photo-Diary.pdf

Water use (mm)0 100 200 300
Accu
mul
ated
DM
(t/h
a)
0
2
4
6
Grass only
13 kg DM/ha/mm
20 kg DM/ha/mm
Spring WUE
Moot et al. 2008
Grass/clover28 kg DM/ha/mmLucerne

Conclusions from MaxClover after nine years• Animal LWG was associated with more dry matter production in
spring.
• Lucerne produced more DM than all grass based pastures in most years.
• CF/Sub clover was the highest yielding grass based pastures in Years 6-9.
• Yields of all pastures declined over time.
• Lucerne used water more efficiently than the grass based pastures -especially in spring.

Case study – Bonavaree farm, MarlboroughOver grazed – high erosion riskDryland Lucerne conversion

Year1970 1975 1980 1985 1990 1995 2000 2005 2010
Ann
ual r
ainf
all (
mm
)
225275325375425475525575625650675725775825875
Annual rainfall at ‘Bonavaree’
Long-term Average

Partitioning to roots
A S O N D J F M A
1.5
2.0
2.5
3.0
3.5
Tap
root
dry
wei
ght (
t/ha)
Month
42-day
Moot et al. 2003
28-day

Maximize reliable spring growth – high priority stock

Spring
Growing point at the top of the plant
Seasonal grazing management
• 1st rotation aided by root reserves to produce high quality vegetative forage.
• can graze before flowers appear (~1500 kg DM/ha) ideally ewes and lambs but

Rotation 1 Pre-grazePlot 1 (21/9/07) 2.3 t DM/ha20-25 cm tall

DateJul07 Sep07 Nov07 Jan08 Mar08 May08 Jul08
Mon
thly
rain
fall
(mm
)
DM
Yie
ld (t
/ha)
454
0
1
2
3
4
5
0
100
200
300
400
4
32
1
45
6
321
4
5 6
3
21
45
6
325
16
32
4
5
1
6
2 56
1
MaxClover – 38-42 day rotation
Moot & Smith 2011Practical Lucerne Management Guide

‘Bonavaree’ production change over 10 years
2002 2012 ChangeLand area (ha) 1100 1800 64%
Sheep numbers 3724 4158 12%
Lambing (%) 117 145 24%
Lamb weights (kg) 13.3 19 43%
Lamb sold (kg) 38324 74460 94%
Wool (kg) 18317 20869 14%
Sheep:cattle 70:30 50:50
Gross trading profit (ha) $317 $792 149%Moot & Avery 2013

Phot
o: D
oug
Aver
y, ‘B
onav
aree
’, M
arlb
orou
gh6/
10/2
015

Resilient drought-proofed landscape
SI Farmer of the Year 2010

“With better income we can focus on the environment and preserve it for generations to come”
Doug Avery

Integrity & Trust


Weaned lamb
2011 2012 2013
Lam
b w
eane
d (t)
0
100
110
120
130
Lamb weaned and Ewes mated
Year
Ew
es m
ated
0
3400
3500
3600
3700
3800
3900
Ewes mated
11% increase in lamb weaned per ewe mated (2011 vs. 2012/2013)31.2 vs 34.6 kg weaned per ewe mated
Anderson et al. 2014

Landscape farmingPh
oto:
Bog
Roy
Sta
tion

Lucerne
Ryegrass
0 10 20 30
Soil
dept
h (m
)
0
1
2
Water extraction (mm)
328 mm
Soil water extraction: Species
243 mm
Lucerne dries the bucket to reduce the risk of drainage

White Clover
N fertiliser applied (kg/ha)0 100 200 300 400 500 600
0
20
40
60
80
100 Lucerne
Ryan-Salter unpublished
Ndfa%= 103.7(±1.28) - 0.34(±0.011)x + 0.00034(±0.000018)x2 (R2 = 0.98)

Over 200,000 ha sown 800+ txt alerts
“28-35% Rate of return on investment”

Sub. clover dominant pasture 8 Oct 2015

Seasonal clover growth
Jul-04 Jan-05 Jul-05 Jan-06
Grow
th ra
te (k
g/ha
/d)
0
20
40
60
80Sub clover
White clover
Wet summer Dry summer
Brown et al. 2006

Bulls grazing sub. dominant pasture 8 Oct 2015
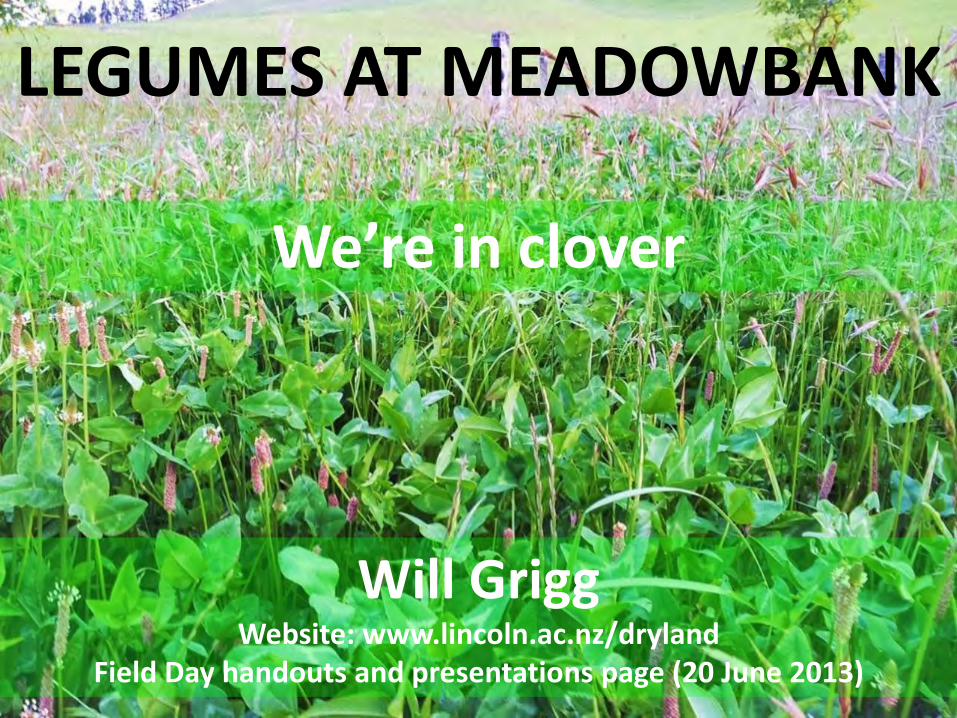
LEGUMES AT MEADOWBANK
Will GriggWebsite: www.lincoln.ac.nz/dryland
Field Day handouts and presentations page (20 June 2013)
We’re in clover


• Lucerne/prairie grass/plantain mix in late January 2013. • Sown October 2012 and first grazed late March 2013. • 16 ha split into five paddocks and water troughs installed.

Lucerne, prairie and plantain October 2012. Twin ewes and lambs at 12 ewes /ha and 1 steer/ha.

Grazing after shutting up for sub clover seeding.

Close up of germinating clover seedlings on 1 May

WHAT’S HAPPENED TO PRODUCTION AT MEADOWBANK?
• Similar stock numbers, better fed.• Ewe efficiency increased 40% since 2005
2005 2012 ChangeEwe Lambing% 121% 142% 21%Hogget Lambing% 60% 81% 21%Weaning weight 28 kg/hd 34 kg/hd 21%Return $730/ha $2640/ha $1910/ha
(>260%)

Ashley Dene P21 Phase IIEwes & lambs grazing Plot 8 on 5 Oct 2015
g/head/day
Pasture Ewe Lamb
Cocksfoot/Sub 63 350
Cocksfoot/Sub/Balansa 114 366
Ryegrass/Sub 187 338
Ryegrass/Sub/Balansa 160 353First stock entered pastures 20/8 & all grazing animals weighed on 25/9/15

Sustainable dryland farming?
• Production – 40-100% incr. LWG/ha
• Risk – beat the drought
• Economic – 30% IRR
• Environment – efficient water and N fert., lowered CO2 emissions, ecosystem services, dry profile
• Social – “green” dryland, fire breaks, employment, landscape farming


Website Handouts & presentations
FAQs
Direct link to Blog
Website: www.lincoln.ac.nz/drylandFacebook: @DrylandPasturesResearch

Urea – CO2 emissions (natural gas)
Urine – leaching from cows
Fixed – 25 kg N per t legume grown
Water use – efficiency increased
Consumed – Liveweight gain
Nitrogen friend or foe?Conclusion

References
Anderson, D., Anderson, L., Moot, D.J., Ogle, G.I. 2014. Integrating lucerne (Medicago sativa L.) into a high country merino system.Proceedings of the New Zealand Grassland Association 76: 29-34.
Brown, H. E., Moot, D. J., Lucas, R. J. and Smith, M. 2006. Sub clover, cocksfoot and lucerne combine to improve dryland stock production.Proceedings of the New Zealand Grassland Association, 68, 109-115.
Department of Statistics. 2013. Agricultural Production Survey variables (various years). Accessed: (various dates). Online:http://www.stats.govt.nz
Dymond, J.R.; Ausseil, A.G.E.; Parfitt, R.L.; Herzig, A.; McDowell, R.W. 2013. Nitrate and phosphorus leaching in New Zealand: a nationalperspective. New Zealand Journal of Agricultural Research 56: 49-59.
Grigg, W. We’re in Clover. Presentation to the Dryland Legume Workshop held at the Marlborough Research Centre on 20 June 2013. Online:http://www.lincoln.ac.nz/PageFiles/23598/2013-06-20-Legumes-at-Meadowbank-Will-Grigg.pdf.
Kerr, P. 2000. 400 Plus: A Guide to Improved Lamb Growth for Farmers and Advisors. The New Zealand Sheep Council: Wellington.Lucas, R. J., Smith, M. C., Jarvis, P., Mills, A. and Moot, D. J. 2010. Nitrogen fixation by subterranean and white clovers in dryland cocksfoot
pastures. Proceedings of the New Zealand Grassland Association, 72, 141-146.Mills, A. 2007. Understanding constraints to cocksfoot (Dactylis glomerata L.) based pasture production, PhD thesis, Lincoln University,
Canterbury. Online access: http://researcharchive.lincoln.ac.nz/dspace/bitstream/10182/32/1/mills_phd.pdf. 202 pp.Mills, A.; Lucas, R.J.; Moot, D.J. 2014. ‘MaxClover’ Grazing Experiment: I. Annual yields, botanical composition and growth rates of six dryland
pastures over nine years. Grass and Forage Science 70: 557-570.Mills, A., Moot, D. J. and Jamieson, P. D. 2009. Quantifying the effect of nitrogen of productivity of cocksfoot (Dactylis glomerata L.) pastures.
European Journal of Agronomy, 30, 63-69.

References (cont.)
Mills, A., Moot, D. J. and McKenzie, B. A. 2006. Cocksfoot pasture production in relation to environmental variables. Proceedings of the NewZealand Grassland Association, 68, 89-94.
Moot, D.J. 2012. An overview of dryland legume research in New Zealand. Crop and Pasture Science 63: 726–733.Moot, D. J. and Avery, D. 2013. Sustainable intensification of livestock grazing systems in low rainfall regions of New Zealand. First
International Conference on Global Food Security, O3.O3 (4 pgs).Moot, D. J., Brown, H. E., Pollock, K. and Mills, A. 2008. Yield and water use of temperate pastures in summer dry environments. Proceedings
of the New Zealand Grassland Association, 70, 51-57.Moot, D.J.; Brown, H.E.; Teixeira, E.I.; Pollock, K.M. 2003. Crop growth and development affect seasonal priorities for lucerne management.
pp. 201-208. In: D.J Moot (Ed.). Legumes for Dryland Pastures. Proceedings of a New Zealand Grassland Association Symposium. 18-19November 2003.
Moot, D. J., Mills, A. and Pollock, K. M. 2010. Natural resources for Canterbury agriculture. Proceedings of the New Zealand GrasslandAssociation, 72, IX-XVII.
Moot, D. J. and Smith, M. 2011. Practical Lucerne Management Guide. 9 pp. http://www.lincoln.ac.nz/Documents/Dryland-Pasture-Research/presentations/Lucerne-management-guide-Col.pdf
NIWA 2013. Climate Explorer – National Median Annual Rainfall Map. Accessed: 1/10/2010 2010. http://climate-explorer.niwa.co.nz.Saunders, C.; Barber, A.; Taylor, G. 2006. Food Miles - Comparative energy/emissions. Performance of New Zealand's agriculture industry.
Research Report No. 285. Lincoln University Agribusiness & Economics Research Unit (AERU), Lincoln University. 105 pp. Accessed:14/9/2009. http://www.lincoln.ac.nz/story_images/2328_RR285_s13389.pdf

Acknowledgements & DPR Online Presence
Acknowledgements for data/graphs• Environment Canterbury (ECAN) for Harts Creek data (data ©ECAN)• New Zealand Fertiliser Association for the nitrogen fertiliser data
Websites/Social Media presenceLincoln University Dryland Pastures Website: http://www.lincoln.ac.nz/drylandThe MaxClover Photo Diary: http://www.lincoln.ac.nz/PageFiles/23851/MaxClover-Photo-Diary.pdfLincoln University Dryland Pastures Blog: https://blogs.lincoln.ac.nz/dryland/YouTube: https://www.youtube.com/DrylandPasturesGoogle+: https://plus.google.com/+DrylandPasturesFacebook: https://www.facebook.com/DrylandPasturesResearch