Transforming an oil sands leader - Cenovus Energy · Reinforces position as an oil sands leader...
39
Transforming an oil sands leader
Transcript of Transforming an oil sands leader - Cenovus Energy · Reinforces position as an oil sands leader...

Transforming an oil sands leader
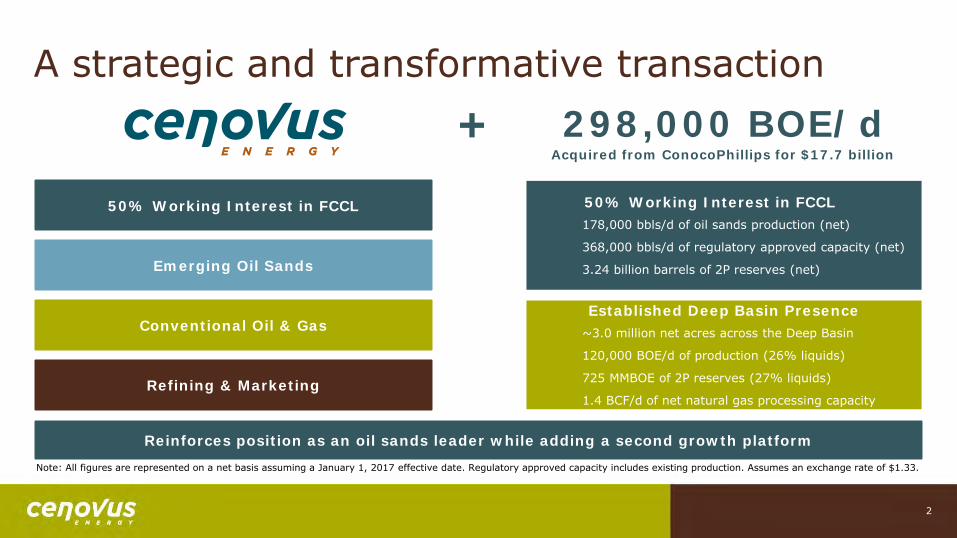
A strategic and transformative transaction 298,000 BOE/d +
Reinforces position as an oil sands leader while adding a second growth platform
50% Working Interest in FCCL
Emerging Oil Sands
Conventional Oil & Gas
Refining & Marketing
50% Working Interest in FCCL • 178,000 bbls/d of oil sands production (net)
• 368,000 bbls/d of regulatory approved capacity (net)
• 3.24 billion barrels of 2P reserves (net)
Established Deep Basin Presence • ~3.0 million net acres across the Deep Basin
• 120,000 BOE/d of production (26% liquids)
• 725 MMBOE of 2P reserves (27% liquids)
• 1.4 BCF/d of net natural gas processing capacity
Acquired from ConocoPhillips for $17.7 billion
2
Note: All figures are represented on a net basis assuming a January 1, 2017 effective date. Regulatory approved capacity includes existing production. Assumes an exchange rate of $1.33.

$83 $78
$40 $34 $21 $19 $16 $12 $10 $9 $7 $6
020406080
100
Pro forma Cenovus
• Immediately accretive to per share metrics • expected to increase 2018F adjusted funds flow per share
by 18%, net of planned asset sales
• expected to reduce 2018F operating costs per BOE by 16% and G&A per BOE by 26%, net of planned asset sales
• Enhances scale and capital flexibility • pro forma production base of 588 MBOE/d
• pro forma 2P reserves of 7,763 MMBOE
• Maintains financial resilience • leverages Cenovus’s existing cash balance into premier
assets while preserving financial strength
• scale and capital structure support access to capital markets and investment grade credit ratings from S&P Global Ratings, Fitch Ratings, and DBRS Limited
• plan to revisit the optimal level of dividend after substantial completion of asset sales
Transforming an oil sands leader 2017F production volumes
Enterprise value
947
708 588
404 396 329 290 245 179 173 122 109
0200400600800
1,000
Pro forma Cenovus
$ billions
MBOE/d
Note: Production volumes for peers based on consensus estimates as per FactSet as of March 17, 2017. Enterprise values per Bloomberg as of March 17, 2017; pro forma calculated as current enterprise value plus total transaction value before the impact of planned asset sales. Cenovus 2017F production volumes represent the midpoint of December 8, 2016 guidance. Pro forma 2017F production volumes assume a full year contribution from the acquired assets. In each case after announced, but not yet completed transactions and before proposed asset sales for peers. Peers include ARX, CNQ, CPG, ECA, HSE, IMO, PEY, SU, TOU, and VII.
3

• Consolidates ownership of top-tier oil sands projects
• no incremental staff or integration required
• low-risk growth profile with emerging technology upside
• Deep Basin assets high-grade portfolio
• high quality position in the prolific Deep Basin of Alberta and British Columbia
• ~3.0 million net acres with significant owned and majority operated infrastructure
• deep inventory of short-cycle and high IRR potential drilling opportunities
• provides significant capital flexibility
Anchor position in two high quality plays
Palliser (53,000 BOE/d )
Weyburn (14 ,000 BOE/d)
Oil sands (356,000 bbls /d)
Acquiring ConocoPhillips’ 50% interest
Pelican Lake (21,000 bbls /d)
Deep Basin (120,000 BOE/d)
Suffield (24,000 BOE/d )
ConocoPhillips (Horn River)
4

Asset overview
• 298,000 BOE/d (70% liquids) based on 2017F estimates • ConocoPhillips’ 50% interest in the FCCL Partnership (178,000 bbls/d 2017F) • Majority of ConocoPhillips’ Deep Basin assets (120,000 BOE/d 2017F; 26% liquids; 17% decline rate)
• 2017F Operating Margin of $1.8 billion based on US$50/bbl WTI • ~3.0 million net acres of land across the Deep Basin (70% average working interest) • 3,966 MMBOE of 2P reserves as of December 31, 2016 • Approximately 1.4 BCF/d of net natural gas processing capacity
Consideration • Total consideration of $17.7 billion
• $14.1 billion in cash • 208 million Cenovus common shares to vendor
Contingent payment terms • Contingent payments based on $52/bbl Western Canadian Select trigger price • Five-year term beginning on the closing date of the transaction • Based on current FCCL volumes Cenovus retains 80-85% of the benefit above the trigger price
Financing • $3.6 billion of existing cash and committed credit facility • $3.0 billion concurrent bought-deal common share equity offering • Remainder of cash purchase price financed through long-term debt and asset sale proceeds • $10.5 billion of fully committed bridge facilities in place to manage timing differences
Other information • Transaction subject to customary regulatory approvals
Timing • January 1, 2017 effective date; closing expected in Q2 2017
Detailed transaction overview
Note: Production and reserves data are on a net basis assuming a January 1, 2017 effective date. See Advisory.
5
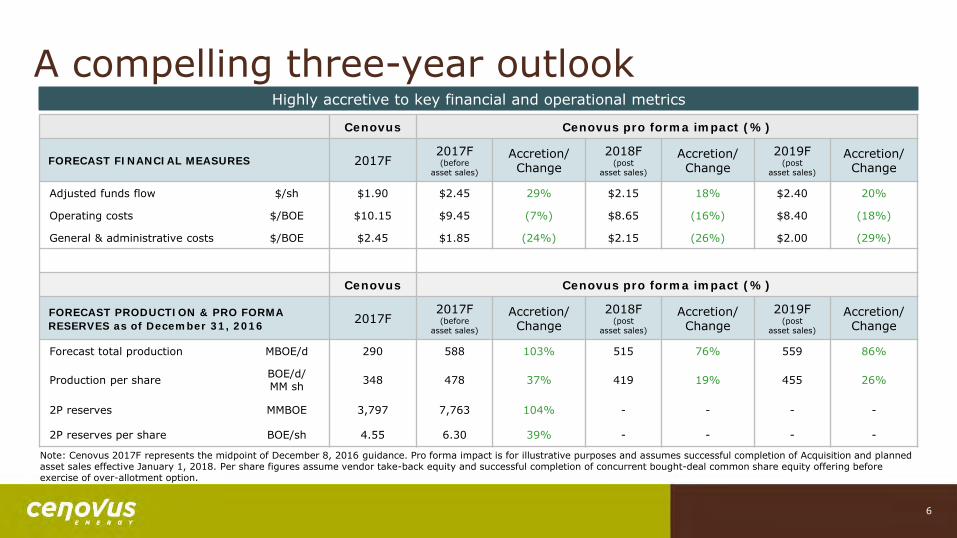
A compelling three-year outlook Cenovus Cenovus pro forma impact (%)
FORECAST FINANCIAL MEASURES 2017F 2017F (before
asset sales)
Accretion/ Change
2018F (post
asset sales)
Accretion/ Change
2019F (post
asset sales)
Accretion/ Change
Adjusted funds flow $/sh $1.90 $2.45 29% $2.15 18% $2.40 20%
Operating costs $/BOE $10.15 $9.45 (7%) $8.65 (16%) $8.40 (18%)
General & administrative costs $/BOE $2.45 $1.85 (24%) $2.15 (26%) $2.00 (29%)
Cenovus Cenovus pro forma impact (%)
FORECAST PRODUCTION & PRO FORMA RESERVES as of December 31, 2016 2017F
2017F (before
asset sales)
Accretion/ Change
2018F (post
asset sales)
Accretion/ Change
2019F (post
asset sales)
Accretion/ Change
Forecast total production MBOE/d 290 588 103% 515 76% 559 86%
Production per share BOE/d/ MM sh 348 478 37% 419 19% 455 26%
2P reserves MMBOE 3,797 7,763 104% - - - -
2P reserves per share BOE/sh 4.55 6.30 39% - - - -
Highly accretive to key financial and operational metrics
Note: Cenovus 2017F represents the midpoint of December 8, 2016 guidance. Pro forma impact is for illustrative purposes and assumes successful completion of Acquisition and planned asset sales effective January 1, 2018. Per share figures assume vendor take-back equity and successful completion of concurrent bought-deal common share equity offering before exercise of over-allotment option.
6

Transaction is fully funded
• Successfully executed strategic financing plan
• issued $3.6 billion of Cenovus common shares to ConocoPhillips
• closed $3.0 billion common equity bought deal to fund a portion of purchase price
• priced US$2.9 billion Senior Notes offering
• utilizing a portion of cash on hand and available revolving credit facility
• Pelican Lake and Suffield disposition programs underway
• further asset sales to be initiated in 2017
Financing strategy supports execution of transaction Transaction is fully financed
Note: Assumes an exchange rate of $1.33.
Transaction is fully funded
$ billions
$17.7 $3.6
$14.1 $3.6
$10.5 $3.0
$3.9
$3.6
$0.0
$3.0
$6.0
$9.0
$12.0
$15.0
$18.0
Totalconsideration
Vendor take-back equity
Cashpurchase
price
Cash &committed
credit facility
Fullycommitted
bridgefinancing
Bought-dealcommonequity
Long-termdebt
Asset salebridge
7

Maturity and liquidity profile Strong liquidity pro forma the acquisition Debt maturity profile
Note: US$ principal amounts
(US$ millions)
5.70%
3.00% 3.80%
4.25%
5.25%
6.75%
4.45%
5.20%
5.40%
$0
$250
$500
$750
$1,000
$1,250
$1,500
2019
2022
2023
2027
2037
2039
2042
2043
2047
• Committed to investment grade credit ratings
• investment grade ratings from S&P Global Ratings, Fitch Ratings, and DBRS Limited
• Intend to repay borrowings under the Asset Sale Bridge Facility through the sale of certain of our assets
• Expect to have approximately $4.0 billion of available liquidity pro forma the acquisition
• combination of cash and availability on the existing credit facility
• sufficient liquidity to fund working capital needs and operations for the foreseeable future
• US $7.65 billion outstanding with weighted-average cost of debt of ~5.2%
8

Committed to executing on asset sales
• High degree of confidence in ability to execute dispositions and repay outstanding bridge loan
• Pelican Lake and Suffield in market
• represents ~45,000 BOE/d based on 2017F (61% liquids)
• Depth of portfolio provides strategic optionality
• other legacy conventional oil & gas properties
• royalty interests
• infrastructure assets
• $3.6 billion asset sale bridge consists of three tranches payable over 12, 18, and 24 months
Depth of portfolio provides optionality for asset sales Transaction is fully financed Potential asset sale proceeds Potential proceeds $ billions
9
$0.0
$1.0
$2.0
$3.0
$4.0
$5.0
$6.0
$7.0
$8.0
10 30 50 70 90 110 130 150
$50k/flowing
$40k/flowing
$30k/flowing
Average daily production (MBOE/d)
Note: Potential sale proceeds per flowing barrel of oil equivalent based on publicly announced precedent transactions in the WCSB.
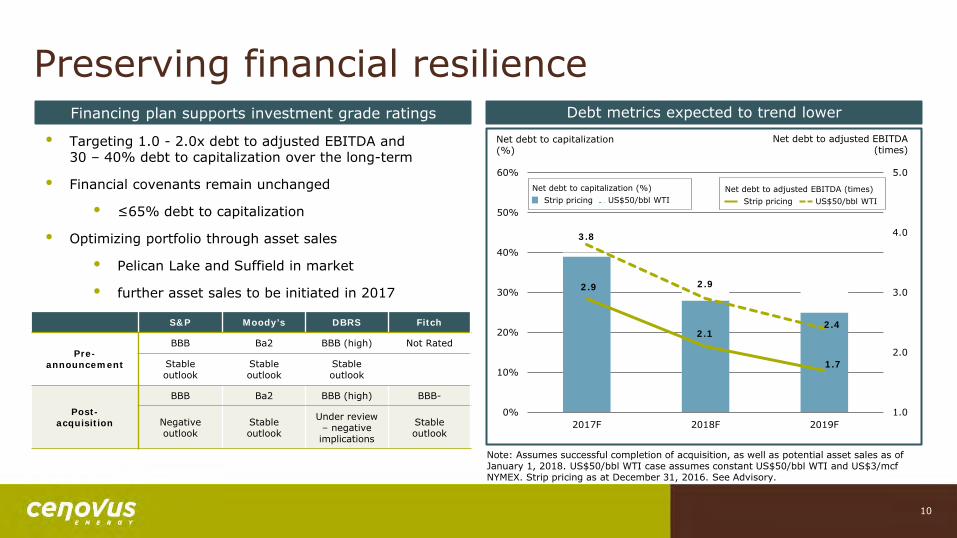
3.8
2.9
2.4
2.9
2.1
1.7
1.0
2.0
3.0
4.0
5.0
0%
10%
20%
30%
40%
50%
60%
2017F 2018F 2019F
Preserving financial resilience Debt metrics expected to trend lower
Note: Assumes successful completion of acquisition, as well as potential asset sales as of January 1, 2018. US$50/bbl WTI case assumes constant US$50/bbl WTI and US$3/mcf NYMEX. Strip pricing as at December 31, 2016. See Advisory.
Net debt to capitalization (%)
• Targeting 1.0 - 2.0x debt to adjusted EBITDA and 30 – 40% debt to capitalization over the long-term
• Financial covenants remain unchanged
• ≤65% debt to capitalization
• Optimizing portfolio through asset sales
• Pelican Lake and Suffield in market
• further asset sales to be initiated in 2017
Financing plan supports investment grade ratings Net debt to adjusted EBITDA
(times)
S&P Moody’s DBRS Fitch
Pre-announcement
BBB Ba2 BBB (high) Not Rated
Stable outlook
Stable outlook
Stable outlook
Post- acquisition
BBB Ba2 BBB (high) BBB-
Negative outlook
Stable outlook
Under review – negative implications
Stable outlook
10
US$50/bbl WTI Strip pricing Net debt to adjusted EBITDA (times)
Strip pricing US$50/bbl WTI Net debt to capitalization (%)

Consolidating our interest in top-tier oil sands
Overview of FCCL
Partnership assets
• Acquiring remaining 50% interest in two top-tier producing thermal oil sands projects with current production capacity of 390,000 bbls/d
• lowest portfolio-weighted steam-oil ratios
• low operating and sustaining capital costs
• Combined regulatory approved capacity of 735,000 bbls/d at Christina Lake, Foster Creek, and Narrows Lake
• Full exposure to future upside potential through emerging technologies (e.g. drilling improvements, flow control devices, facility modifications, implementation of a solvent aided process, and partial upgrading)
FCCL Partnership summary statistics
• 2017F production: 356,000 bbls/d (100% oil)
• Total net acres: 0.3 million
• Regulatory approved capacity: 735,000 bbls/d
• 2P reserves: 6,480 MMbbls (72% proved)
Foster Creek 2017F production: 158,000 bbls/d Production capacity: 180,000 bbls/d December 2016 SOR: 2.4x 2P reserves: 2,660 MMbbls
Christina Lake & Narrows Lake 2017F production: 198,000 bbls/d Production capacity: 210,000 bbls/d December 2016 SOR: 1.9x 2P reserves: 3,820 MMbbls
Note: Production and reserves data are on a gross basis assuming a January 1, 2017 effective date and assuming closing of the proposed Acquisition. Figures relate to FCCL Partnership assets only. Production capacity includes currently producing projects at Foster Creek and Christina Lake. Regulatory approved capacity includes existing production.
73-9W4
Christina Lake region
Foster Creek region
66-8W4
81-5W4
75-4W4
11

2.1
2.8
2.1
4.0
4.3
2.2
3.1
2.4
4.3 4.5
3.2
2.5
1.0
2.0
3.0
4.0
5.0
0
100
200
300
400
.
December 2016 Average Production Portfolio-Weighted SOR
Largest & most efficient thermal portfolio Reinforcing our position as a leader in SAGD
Production (Mbbls/d)
Portfolio-Weighted SOR
Note: Production data and steam-oil ratio based on AER data as of December 2016. Portfolio-weighted SOR calculated based on project operator and is a measure of current project efficiency. Peers include ATH, CNOOC, CNQ, COP, DVN, HSE, IMO, MEG, PGF, and SU.
Pro forma Cenovus
12
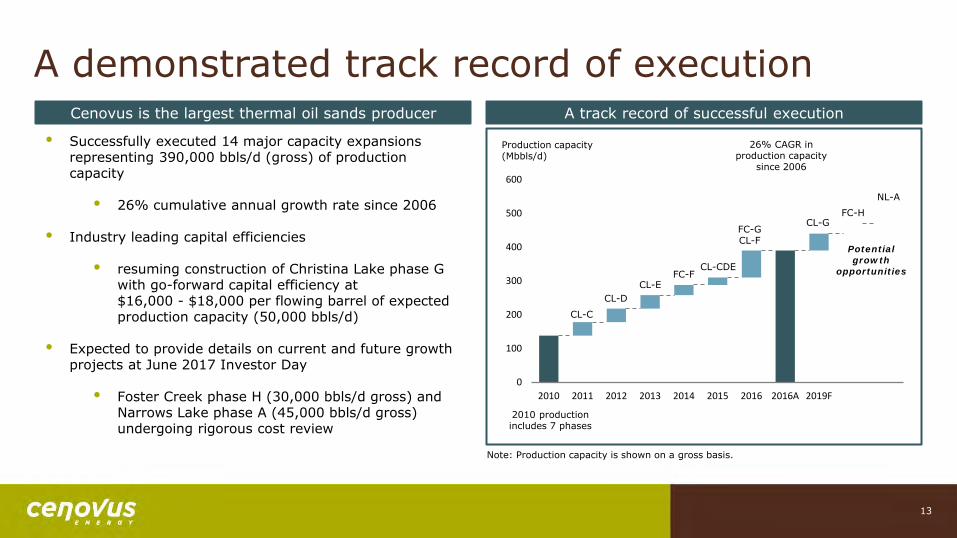
A demonstrated track record of execution
• Successfully executed 14 major capacity expansions representing 390,000 bbls/d (gross) of production capacity
• 26% cumulative annual growth rate since 2006
• Industry leading capital efficiencies
• resuming construction of Christina Lake phase G with go-forward capital efficiency at $16,000 - $18,000 per flowing barrel of expected production capacity (50,000 bbls/d)
• Expected to provide details on current and future growth projects at June 2017 Investor Day
• Foster Creek phase H (30,000 bbls/d gross) and Narrows Lake phase A (45,000 bbls/d gross) undergoing rigorous cost review
Cenovus is the largest thermal oil sands producer A track record of successful execution
Production capacity (Mbbls/d)
Note: Production capacity is shown on a gross basis.
0
100
200
300
400
500
600
2010 2011 2012 2013 2014 2015 2016 2016A 2019F
CL-C
CL-D CL-E
FC-F CL-CDE
FC-G CL-F
CL-G FC-H
NL-A
2010 production includes 7 phases
Potential growth
opportunities
26% CAGR in production capacity
since 2006
13
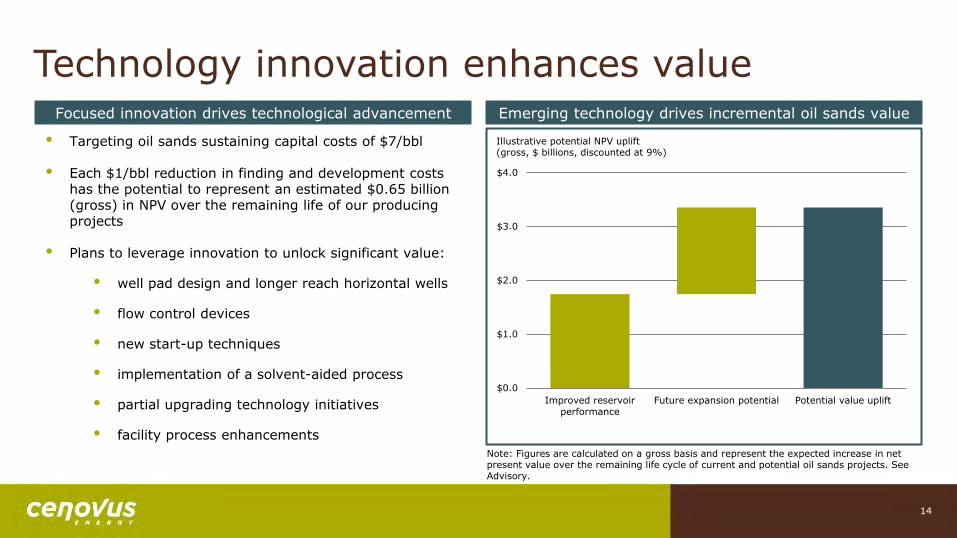
Technology innovation enhances value
• Targeting oil sands sustaining capital costs of $7/bbl
• Each $1/bbl reduction in finding and development costs has the potential to represent an estimated $0.65 billion (gross) in NPV over the remaining life of our producing projects
• Plans to leverage innovation to unlock significant value:
• well pad design and longer reach horizontal wells
• flow control devices
• new start-up techniques
• implementation of a solvent-aided process
• partial upgrading technology initiatives
• facility process enhancements
Focused innovation drives technological advancement Emerging technology drives incremental oil sands value
$0.0
$1.0
$2.0
$3.0
$4.0
Improved reservoirperformance
Future expansion potential Potential value uplift
Illustrative potential NPV uplift (gross, $ billions, discounted at 9%)
Note: Figures are calculated on a gross basis and represent the expected increase in net present value over the remaining life cycle of current and potential oil sands projects. See Advisory.
14
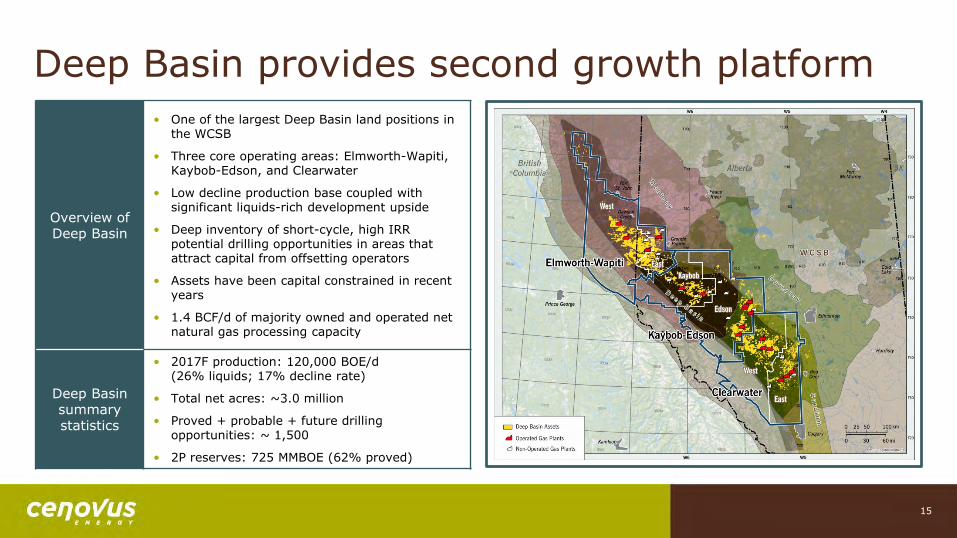
Deep Basin provides second growth platform
Overview of Deep Basin
• One of the largest Deep Basin land positions in the WCSB
• Three core operating areas: Elmworth-Wapiti, Kaybob-Edson, and Clearwater
• Low decline production base coupled with significant liquids-rich development upside
• Deep inventory of short-cycle, high IRR potential drilling opportunities in areas that attract capital from offsetting operators
• Assets have been capital constrained in recent years
• 1.4 BCF/d of majority owned and operated net natural gas processing capacity
Deep Basin summary statistics
• 2017F production: 120,000 BOE/d (26% liquids; 17% decline rate)
• Total net acres: ~3.0 million
• Proved + probable + future drilling opportunities: ~ 1,500
• 2P reserves: 725 MMBOE (62% proved)
15

Over a decade of future drilling opportunities ~1,500 potential drilling opportunities identified
GLJ type curve information IP365
(boe/d) Well costs
($MM,DC&T) Gas (%)
IRR (%)
NPV 10% before-tax
($MM) Payout (years)
F&D ($/boe)
Recycle ratio (x)
1 year capital efficiency
($k/flowing)
Elmworth-Wapiti Montney type well 478 $6.2 58% >100% $8.7 ~1.6 $4.90 4.1 $13.0
Kaybob Spirit River type well 582 $6.4 80% ~84% $5.8 ~1.8 $5.60 2.8 $11.0
Clearwater Spirit River type well 395 $4.2 81% ~87% $3.9 ~1.8 $5.50 2.8 $10.7
Large inventory of short-cycle, high IRR potential drilling opportunities
• Initial development focused on the Spirit River and Montney formations
• Plan to retain high quality technical staff associated with the acquired assets
• Attractive half-cycle development economics supported by majority owned and operated infrastructure
• type well information provided by independent qualified reserve evaluator
Focused on the Spirit River and Montney formations
0
200
400
600
800
Spirit River Montney Glauconitic Other Targets
Internal Cenovus estimates
GLJ - Probable
GLJ - Proved
Future drilling opportunities by targeted formation
Note: See Advisory for key underlying assumptions and risks and a description of the metrics provided above. Assumes constant US$50/bbl WTI and NYMEX US$3.00/mcf.
16
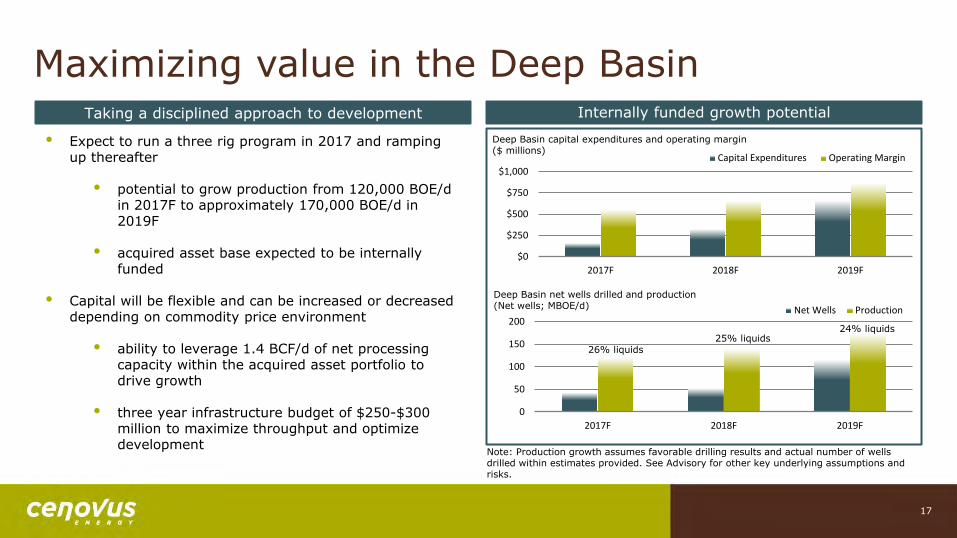
Maximizing value in the Deep Basin
• Expect to run a three rig program in 2017 and ramping up thereafter
• potential to grow production from 120,000 BOE/d in 2017F to approximately 170,000 BOE/d in 2019F
• acquired asset base expected to be internally funded
• Capital will be flexible and can be increased or decreased depending on commodity price environment
• ability to leverage 1.4 BCF/d of net processing capacity within the acquired asset portfolio to drive growth
• three year infrastructure budget of $250-$300 million to maximize throughput and optimize development
Taking a disciplined approach to development Internally funded growth potential
0
50
100
150
200
2017F 2018F 2019F
Net Wells Production
$0
$250
$500
$750
$1,000
2017F 2018F 2019F
Capital Expenditures Operating Margin
Deep Basin capital expenditures and operating margin ($ millions)
Deep Basin net wells drilled and production (Net wells; MBOE/d)
Note: Production growth assumes favorable drilling results and actual number of wells drilled within estimates provided. See Advisory for other key underlying assumptions and risks.
26% liquids 25% liquids
24% liquids
17
The new Cenovus
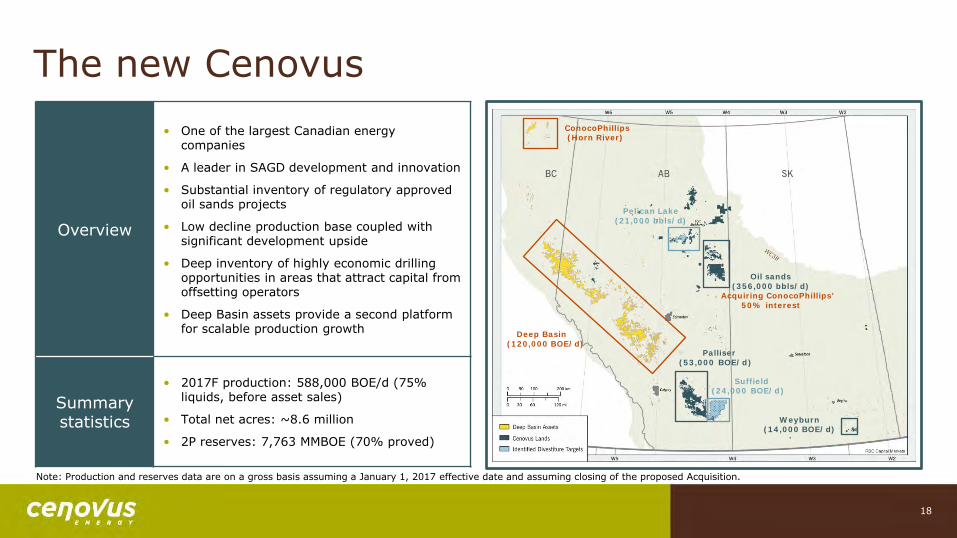
Overview
• One of the largest Canadian energy companies
• A leader in SAGD development and innovation
• Substantial inventory of regulatory approved oil sands projects
• Low decline production base coupled with significant development upside
• Deep inventory of highly economic drilling opportunities in areas that attract capital from offsetting operators
• Deep Basin assets provide a second platform for scalable production growth
Summary statistics
• 2017F production: 588,000 BOE/d (75% liquids, before asset sales)
• Total net acres: ~8.6 million
• 2P reserves: 7,763 MMBOE (70% proved)
Note: Production and reserves data are on a gross basis assuming a January 1, 2017 effective date and assuming closing of the proposed Acquisition.
Palliser (53,000 BOE/d )
Weyburn (14 ,000 BOE/d)
Oil sands (356,000 bbls /d)
Acquiring ConocoPhillips’ 50% interest
Pelican Lake (21,000 bbls /d)
Deep Basin (120,000 BOE/d)
Suffield (24,000 BOE/d )
ConocoPhillips (Horn River)
18

Significant cash generation capacity
• Financial resilience and safe, reliable operations
• Sustainable returns to shareholders
• plan to revisit the optimal level of dividend after substantial completion of asset sales
• Value added growth at Christina Lake phase G and short-cycle, high IRR potential drilling opportunities
• Christina Lake phase G capital efficiencies are industry leading
• Deep Basin development
• optimizing development plans for Foster Creek phase H and Narrows Lake phase A
• Portfolio optimization, advancing emerging projects, technology development, and margin enhancement
• Pelican Lake and Suffield properties currently in market
Capital allocation priorities Free funds flow provides capital flexibility
Note: Independent base case sensitivities assuming constant WTI, holding all other assumptions equal. Assumes NYMEX natural gas price of US$3.00/mcf. Includes the impact of planned asset sales. See Advisory.
Pro forma 2018F free funds flow before dividends ($ millions)
$0
$500
$1,000
$1,500
$2,000
$2,500
US$50/bbl US$60/bbl US$70/bbl
19

A compelling three-year outlook
• Clear line of sight to production growth through steady capital investment
• 125,000 bbls/d of potential near-term capacity at Christina Lake, Foster Creek, and Narrows Lake
• over a decade of attractive drilling opportunities already identified on the acquired Deep Basin assets
• Asset sales high-grade the portfolio
• Pelican Lake and Suffield in market
• further asset sales to be identified in 2017
• Financial resilience supports future growth
• targeting 1.0 - 2.0x debt to adjusted EBITDA and 30 – 40% debt to capitalization over the long-term
Increased scale and depth of portfolio Second growth platform provides capital flexibility
Note: 2017F is before asset sales, 2018F and 2019F include the impact of planned asset sales as of January 1, 2018. See Advisory.
100
200
300
400
500
600
2017F 2018F 2019F
Cenovus Pro forma
$1,000
$1,500
$2,000
$2,500
2017F 2018F 2019F
Cenovus Pro forma
Total Cenovus capital expenditures ($ millions)
Total Cenovus production (MBOE/d)
20

Top-tier assets drive value-added growth Full exposure to future growth opportunities Illustrative 5-year growth outlook
Note: Pro forma production is for illustrative purposes and assumes successful completion of Acquisition. 2017F is before asset sales. 2018F - 2021F assume the impact of potential asset sales as of January 1, 2018. 2020F and 2021F assume Deep Basin capital expenditures held constant at 2019 forecast levels. See Advisory.
100
200
300
400
500
600
700
2017F 2018F 2019F 2020F 2021F
Total Cenovus pro forma production (MBOE/d)
21
• Expanded portfolio enhances scale and generates significant long-term production growth
• Well defined oil sands growth opportunities with emerging technology upside
• combined regulatory approved capacity of 735,000 bbls/d at Christina Lake, Foster Creek, and Narrows Lake
• Complimentary short-cycle, low-decline production provides second growth platform in the Deep Basin
• ~1,500 potential drilling opportunities already identified

Low cost structure drives margin improvement
• Oil sands netbacks remain competitive
• estimated field level break-even oil price of US$25-$30/bbl WTI
• Structural cost reductions have improved our sustainability:
• adjusted dividend and workforce with market conditions
• ~50% reduction in sustaining capital
• ~30% reduction in oil sands operating costs
• ~30% reduction in G&A expenses
• Cenovus generated free funds flow in 2016 despite WTI averaging approximately US$43/bbl
Cost reductions improving sustainability Meaningful cost reductions drive future performance
Note: Field level break-even is defined as the price of US$ WTI required to offset royalties, transportation, and operating costs. Assumes US$/C$ foreign exchange rate of $0.70-$0.72, 32% light-heavy differential, sliding scale royalty payments, and condensate costs at 101% of Edmonton benchmark. 2017F based on December 8, 2016 guidance and is before the impact of the proposed Acquisition. See Advisory.
48% 32%
33%
$0.00
$3.00
$6.00
$9.00
$12.00
$15.00
Oil Sands SustainingCapital ($/BOE)
Oil Sands OperatingCosts ($/BOE)
G&A ($/BOE)
Cenovus 2014A Cenovus 2017F$/BOE
22
Downstream assets provide integration
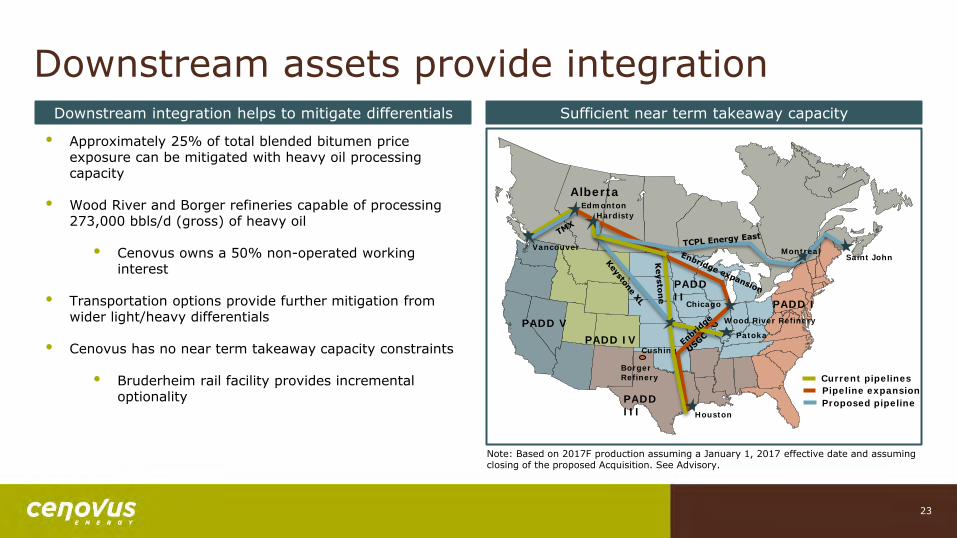
• Approximately 25% of total blended bitumen price exposure can be mitigated with heavy oil processing capacity
• Wood River and Borger refineries capable of processing 273,000 bbls/d (gross) of heavy oil
• Cenovus owns a 50% non-operated working interest
• Transportation options provide further mitigation from wider light/heavy differentials
• Cenovus has no near term takeaway capacity constraints
• Bruderheim rail facility provides incremental optionality
Downstream integration helps to mitigate differentials Sufficient near term takeaway capacity
PADD V PADD IV
PADD III
PADD I
Alberta
Borger Refinery
Wood River Refinery
PADD II
Hardisty
Montreal Saint John
Houston
Cushing
Chicago
Pipeline expansion Proposed pipeline
Edmonton
Patoka
Vancouver
Current pipelines
Note: Based on 2017F production assuming a January 1, 2017 effective date and assuming closing of the proposed Acquisition. See Advisory.
23
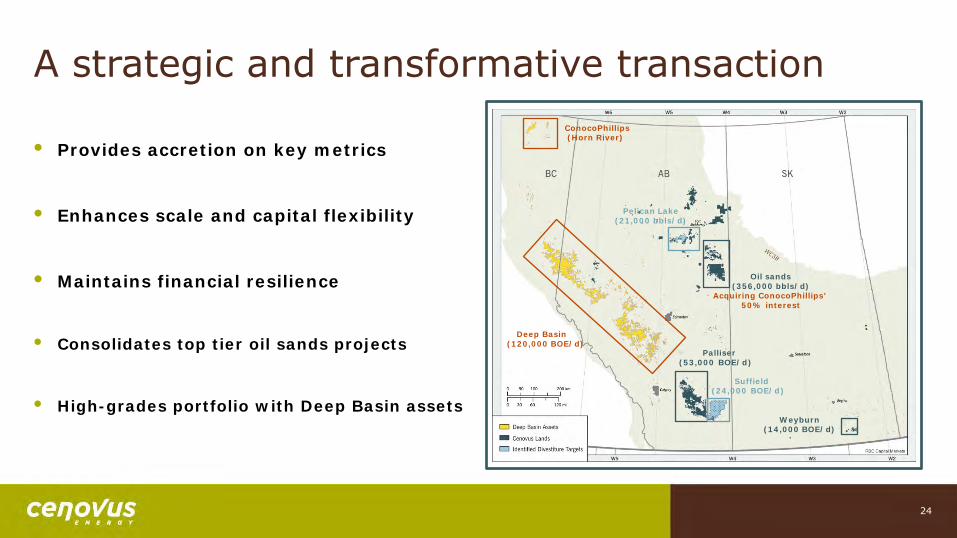
• Provides accretion on key metrics
• Enhances scale and capital flexibility
• Maintains financial resilience
• Consolidates top tier oil sands projects
• High-grades portfolio with Deep Basin assets
A strategic and transformative transaction
Palliser (53,000 BOE/d )
Weyburn (14 ,000 BOE/d)
Oil sands (356,000 bbls /d)
Acquiring ConocoPhillips’ 50% interest
Pelican Lake (21,000 bbls /d)
Deep Basin (120,000 BOE/d)
Suffield (24,000 BOE/d )
ConocoPhillips (Horn River)
24

Appendix
Christina Lake asset overview Asset overview
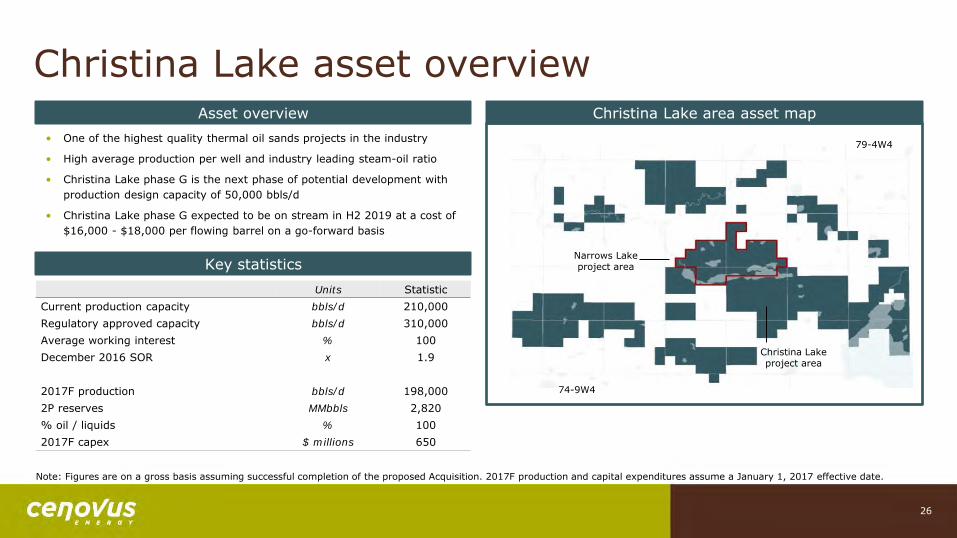
• One of the highest quality thermal oil sands projects in the industry
• High average production per well and industry leading steam-oil ratio
• Christina Lake phase G is the next phase of potential development with production design capacity of 50,000 bbls/d
• Christina Lake phase G expected to be on stream in H2 2019 at a cost of $16,000 - $18,000 per flowing barrel on a go-forward basis
Key statistics
Units Statistic Current production capacity bbls/d 210,000 Regulatory approved capacity bbls/d 310,000 Average working interest % 100 December 2016 SOR x 1.9
2017F production bbls/d 198,000 2P reserves MMbbls 2,820 % oil / liquids % 100 2017F capex $ millions 650
Note: Figures are on a gross basis assuming successful completion of the proposed Acquisition. 2017F production and capital expenditures assume a January 1, 2017 effective date.
Christina Lake area asset map
Christina Lake project area
74-9W4
79-4W4
Narrows Lake project area
26
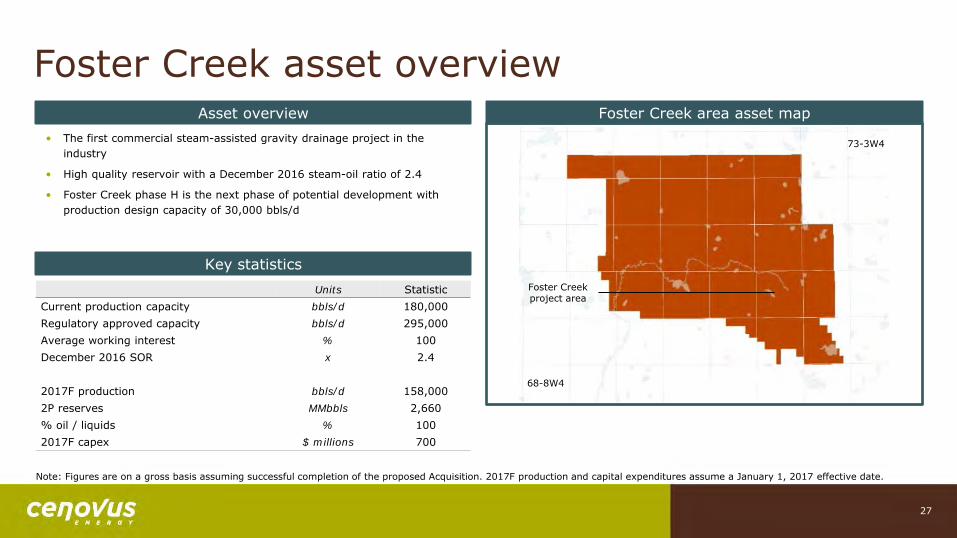
Foster Creek asset overview Asset overview Foster Creek area asset map
• The first commercial steam-assisted gravity drainage project in the industry
• High quality reservoir with a December 2016 steam-oil ratio of 2.4
• Foster Creek phase H is the next phase of potential development with production design capacity of 30,000 bbls/d
Key statistics
Units Statistic Current production capacity bbls/d 180,000 Regulatory approved capacity bbls/d 295,000 Average working interest % 100 December 2016 SOR x 2.4
2017F production bbls/d 158,000 2P reserves MMbbls 2,660 % oil / liquids % 100 2017F capex $ millions 700
68-8W4
73-3W4
Foster Creek project area
Note: Figures are on a gross basis assuming successful completion of the proposed Acquisition. 2017F production and capital expenditures assume a January 1, 2017 effective date.
27

Narrows Lake asset overview Asset overview Narrows Lake area asset map
• Expected to be the first commercial steam-assisted gravity drainage project to utilize solvents in the industry
• Solvent aided process is expected to reduce SOR by ~30% while increasing recovery factor by ~15%
• Narrows Lake phase A is the first phase of potential development with production design capacity of 45,000 bbls/d (gross)
Key statistics
Units Statistic Current production capacity bbls/d - Regulatory approved capacity bbls/d 130,000 Average working interest % 100 Targeted SOR x 1.8
2017F production bbls/d - 2P reserves MMbbls 1,000 % oil / liquids % 100 2017F capex $ millions 30
Narrows Lake project area
74-9W4
79-4W4
Christina Lake project area
Note: Figures are on a gross basis assuming successful completion of the proposed Acquisition. 2017F production and capital expenditures assume a January 1, 2017 effective date.
28

Elmworth-Wapiti asset overview Asset overview Elmworth-Wapiti area asset map
• ~1.2 million net acres of land developed largely with vertical wells; acreage held by production with minimal expiries
• Prolific hydrocarbon stack producing oil & gas from multiple formations
• Strong horizontal liquids-rich development potential within the Montney and Spirit River group
• Significant area infrastructure underpins near-term growth potential
Key statistics
Units Statistic Net acres acres ~1,200,000 Proved + probable + future drilling opportunities # ~310
Average working interest % ~71 Net operated processing capacity MMcf/d ~585
2017F production BOE/d 46,000
% oil / liquids % 27
2017F capex $ millions 55
Note: 2017F production and capital expenditures assume a January 1, 2017 effective date.
29

Kaybob-Edson asset overview Asset overview Kaybob-Edson area asset map
• Asset anchored by Spirit River development and production in Kakwa and Edson
• Meaningful Montney and Duvernay potential with continued delineation activity by offsetting operators
• Additional multi-horizon potential given Cretaceous and Jurassic rights
Key statistics
Units Statistic Net acres acres ~720,000 Proved + probable + future drilling opportunities # ~630
Average working interest % ~71 Net operated processing capacity MMcf/d ~265
2017F production BOE/d 37,000 % oil / liquids % 18 2017F capex $ millions 60
Note: 2017F production and capital expenditures assume a January 1, 2017 effective date.
30

Clearwater asset overview Asset overview Clearwater area asset map
• Significant horizontal development potential across Spirit River, Cardium, and Glauconitic
• Meaningful offsetting industry activity in recent years despite limited capitalization of the acquired Clearwater assets
• Infrastructure ownership results in attractive operating cost structure with capacity to support near-term growth
Key statistics
Units Statistic Net acres acres ~840,000 Proved + probable + future drilling opportunities # ~540
Average working interest % ~68 Net operated processing capacity MMcf/d ~125
2017F production BOE/d 37,000 % oil / liquids % 36 2017F capex $ millions 55
Note: 2017F production and capital expenditures assume a January 1, 2017 effective date.
31

Deep Basin infrastructure overview Asset overview Deep Basin infrastructure map
• ~1.4 BCF/d of net natural gas processing capacity and significant associated gathering infrastructure
• Infrastructure footprint spans the Deep Basin
• Ownership and control underpins operational flexibility
• Excess processing capacity supports near-term development potential
• Third party processing revenues support competitive cost advantage
Key statistics
Units Statistic Operated and non-operated assets # 27 Avg. working interest of operated facilities % 77 Total net processing capacity MMcf/d ~1,400
Key facilities
Facility Units Statistic Elmworth 01-08-70-11W6 Net MMcf/d 395 Noel B-059-D/093-9-08 Net MMcf/d 150 Peco 6-19-73-08W6 Net MMcf/d 69
32

Supplemental terms of the transaction
• Based on a 5-year time horizon, with a threshold price of $52.00/bbl Western Canadian Select (“WCS”)
• Calculation based on $6.0 million per quarter multiplied by the difference between the average WCS price and the threshold price of $52.00/bbl
• Payments and calculations are done on a quarterly basis
• Contingent payments will be reduced during periods of material production outages
• Cenovus retains 80-85% of the benefit above the trigger price based on current FCCL production volumes
Contingent payment terms Vendor take-back terms
• ConocoPhillips has agreed to receive 208 million common shares of Cenovus
• Share consideration reinforces ConocoPhillips’ confidence in the strategic rationale of this transaction and future outlook for Cenovus
• ConocoPhillips is bound by the terms in the investor agreement, including a restriction on its ability to sell or hedge its shares for a minimum period of six months from the closing date of the transaction
• ConocoPhillips has agreed to vote with Cenovus management voting recommendations or abstain from voting and is restricted from nominating new members to Cenovus’s Board of Directors
33

Kam Sandhar Vice-President, Investor Relations & Corporate Development [email protected] 403.766.5883 Graham Ingram Manager, Investor Relations [email protected] 403.766.2849 Steven Murray Senior Analyst, Investor Relations [email protected] 403.766.3382 Michelle Cheyne Analyst, Investor Relations [email protected] 403.766.2584 Cenovus Energy Inc. 500 Centre Street SE Calgary, Alberta T2P 0M5 Telephone: 403.766.2000 Toll free in Canada: 403.766.2066 Fax: 403.766.7600 cenovus.com
Investor relations contacts

Advisory
A final base shelf prospectus containing important information relating to the securities described in this presentation has been filed with the securities regulatory authorities in each of the provinces and territories of Canada. A copy of the final base shelf prospectus, any amendment to the final base shelf prospectus and any applicable prospectus supplement is required to be delivered with this presentation.
This presentation does not provide full disclosure of all material facts relating to the securities offered. Investors should read the final base shelf prospectus, any amendment and any applicable prospectus supplement for disclosure of those facts, especially risk factors relating to the securities offered, before making an investment decision.
The issuer has filed a registration statement (including a final base shelf prospectus) with the United States Securities and Exchange Commission (“SEC”), which has become effective under the United States Securities Act of 1933, as amended, for the offering to which this communication relates. Preliminary and final prospectus supplements describing the offering will also be filed with the securities regulatory authorities in each of the provinces and territories of Canada and with the SEC. Before you invest, you should read the prospectus in that registration statement and the preliminary prospectus supplement and other documents the issuer has filed with the SEC for more complete information about the issuer and this offering. You may get any of these documents for free by visiting EDGAR on the SEC website at www.sec.gov or via SEDAR at www.sedar.com. Alternatively, the issuer, any underwriter or any dealer participating in the offering will arrange to send you the prospectus and the prospectus supplement if you request it in the U.S. from J.P. Morgan Securities LLC, via Broadridge Financial Solutions, 1155 Long Island Avenue, Edgewood, New York 11717; Phone: (866) 803-9204; or Email: [email protected], or RBC Capital Markets, LLC, 200 Vesey Street, 8th Floor, New York, NY 10281-8098, Attention: Equity Syndicate (tel: 877-822-4089; email: [email protected]), or in Canada from RBC Dominion Securities Inc., Attn: Simon Yeung, Distribution Centre, RBC Wellington Square, 8th Floor, 180 Wellington St. W., Toronto, Ontario, M5J 0C2 (tel:416-842-5349; email: [email protected]).
FORWARD-LOOKING INFORMATION
This presentation contains certain forward-looking statements and other information (collectively "forward-looking information") about Cenovus' current expectations, estimates and projections, made in light of our experience and perception of historical trends. Forward-looking information in this document is identified by words such as "estimate", "target", "to be", "future", "F", "expect", "potential", "capacity", "will", "capable", "horizon", "contingent", "strategy", "outlook", "pro forma", "illustrative" or similar expressions and includes suggestions of future outcomes, including statements about: the planned acquisition (the "Acquisition") of a 50% working interest in the FCCL Partnership (the "FCCL Assets") and the majority of ConocoPhillips' western Canadian conventional assets, including ConocoPhillips' exploration and production assets and related infrastructure and agreements in the Elmworth-Wapiti, Kaybob-Edson and Clearwater operating areas and other operating areas, and all of ConocoPhillips' interest in petroleum and natural gas rights and oil sands leases within a certain area of mutual interest northwest of Foster Creek (collectively, the "Deep Basin Assets" and together with the FCCL Assets, the "Assets"), including the expected closing thereof; the anticipated benefits to us of the Acquisition, including the effect on Adjusted Funds Flow; cash flow, dividend growth and dividend level; our pro forma financial, operating and reserves information, anticipated drilling locations, drilling inventories and drilling opportunities, and production estimates after completion of the Acquisition; the midstream gathering, processing and transportation arrangements to be acquired and assumed by us in connection with the Acquisition; the availability and repayment of the revolving credit facility and the fully committed bridge financing; replacement of a portion of the bridge financing through the issuance of the Common Shares pursuant to the bought deal; replacement, refinancing or repayment of the long term debt bridge facility through the issuance by Cenovus of debt securities; anticipated disposition of certain assets and the expected application of the proceeds of such dispositions to amounts owing under the asset sale bridge facility; potential asset dispositions and anticipated impacts to us; the anticipated effect of the Acquisition on Cenovus' credit ratings; the anticipated effect of the Acquisition on staffing; Cenovus' sustaining cost targets; the issuance of the common shares to ConocoPhillips; future contingent payments; Cenovus' strategy and related milestones and schedules including expected timing for oil sands expansion phases and associated expected production capacities; Cenovus' pro forma financial and operational projections for 2017 and future years and our plans and strategies to realize such projections; our forecast exchange rates and trends; the expected development and growth of our business projections for the current year and future years and our plans and strategies to realize such projections; our forecast operating and financial results, including forecast sales prices, costs and cash flows; targets for our leverage ratios of Debt (and Net Debt) to Adjusted EBITDA as well as Debt (and Net Debt) to Capitalization, including illustrative trend expectations for such metrics; our expected ability to satisfy payment obligations as they become due; planned capital expenditures, including the amount, timing and financing thereof; our annual capital investment forecasts and plans with respect thereto; the techniques expected to be used to recover reserves and forecasts of the timing thereof; our expected recovery of income taxes; our expected future production, including the timing, stability or growth thereof; our expected reserves, contingent and prospective resources and related information, including future net revenue and future development costs; oil sands sustaining capital costs and the impact on net present value of oil sands projects; over ten years of steady capital investment and production growth; our expected capacities, including for projects, transportation and refining; our expected ability to preserve our financial resilience and various plans and strategies with respect thereto; forecast cost savings and sustainability thereof; our priorities for 2017 and future years; our expectations for broadening market access; our expectations for improving cost structures, forecast cost savings and the sustainability thereof; our dividend plans and strategy; the future impact of regulatory measures; our forecast commodity prices, forecast inflation and trends; differentials and trends and expected impacts to Cenovus; expected impacts of the contingent payment agreement; future use and development of technology; ability to access and implement all technology necessary to efficiently and effectively operate our assets (including, but not limited to, the Assets) and achieve and sustain future cost reductions; and our projected shareholder return. Readers are cautioned not to place undue reliance on forward looking information as Cenovus' actual results may differ materially from those expressed or implied.
Developing forward-looking information involves reliance on a number of assumptions and consideration of certain risks and uncertainties, some of which are specific to Cenovus and others that apply to the industry generally. The factors or assumptions on which the forward-looking information is based include: timing and receipt of applicable regulatory approvals for the bought deal financing and the Acquisition; all required financing being available to complete the Acquisition; our ability to successfully integrate the Deep Basin Assets; our ability to obtain and retain qualified staff and equipment in a timely and cost-efficient manner; our ability to access sufficient capital to pursue our development plans associated with full ownership of the FCCL Assets; the bought deal financing being completed on the terms and timing expected; Cenovus' ability to complete asset dispositions, including to repay and retire the asset sale bridge facility; expected impacts of completing potential asset dispositions; Cenovus' ability to issue debt securities, including to repay and retire the debt bridge facility; the impact that the Acquisition and the financing thereof may have on Cenovus' current credit ratings; forecast crude oil and natural gas prices, forecast inflation and other assumptions inherent in our current guidance set out below; expected impact of the contingent payment agreement; alignment of realized WCS prices (as defined herein) and WCS prices as calculated under the contingent payment agreement; our projected capital investment levels, the flexibility of capital spending plans and the associated sources of funding; sustainability of achieved cost reductions; the achievement of further cost reductions and sustainability thereof, including, but not limited to, in relation to the Assets; expected condensate prices; estimates of quantities of oil, bitumen, natural gas and NGLs from properties and other sources not currently classified as proved; future use and development of technology; our ability to access and implement all technology necessary to efficiently and effectively operate our assets (including but not limited to, the Assets) and achieve and sustain cost reductions; our ability to obtain necessary regulatory and partner approvals; our ability to implement capital projects or stages thereof in a successful and timely manner; our ability to generate sufficient cash flow to meet our current and future obligations; estimated abandonment and reclamation costs, including associated levies and regulations; and other risks and uncertainties described from time to time in the filings we make with securities regulatory authorities. The information contained on our website is not incorporated by reference into this presentation. The reference to our website is intended to be an inactive textual reference.
Advisory
35

FORWARD-LOOKING INFORMATION CONTINUED
The forward looking information in this presentation also includes financial outlook regarding Cenovus and other forward looking metrics (including production and financial oil and gas related metrics) relating to the Acquisition and the Assets, namely with respect to: the projected impact of lowering sustaining capital, including on the net present value of our assets; our estimates regarding the Field Level Break Even (as defined herein) WTI price for our oil sands assets; our projections for and expectations relating to our Free Funds Flow; our projected capital expenditures; projected contingent payments; projections related to drilling locations and other opportunities, IRR, NPV, Payout, F&D, Recycle Ratio and Capital Efficiency (each as defined herein)metrics for wells drilled in respect of the Deep Basin Assets; our expectations regarding the impact of the Acquisition on Adjusted Funds Flow, Adjusted Funds Flow per Common Share, upstream operating costs per BOE, general and administrative ("G&A") expenses per BOE, Free Funds Flow, operating costs, G&A and capital expenditures and our targeted Debt (and Net Debt) to Adjusted EBITDA and Debt (and Net Debt) to Capitalization ratios (as each defined herein). See also “Drilling Locations” and “Conventions and Industry Terminology” for important information regarding our disclosure of drilling locations and other opportunities and the other oil and gas metrics referred to above.
Unless otherwise specifically stated or the context dictates otherwise, the financial outlook and other forward looking metrics contained in this presentation, in addition to the generally applicable assumptions described above, are based on the following specific assumptions, as applicable: (i) WTI prices averaging US$50.00 in 2017, 2018, and 2019; (ii) Brent prices averaging US$52.25 in 2017, 2018, and 2019; (iii) NYMEX natural gas prices averaging US$3.00 in 2017, 2018, and 2019; (iv) AECO natural gas prices averaging $3.07 in 2017, 2018, and 2019; (v) the exchange rate for the conversion of one U.S. dollar into Canadian dollars averaging $1.33 in 2017, 2018, and 2019; (vi) the pricing differential between WCS and WTI averaging US$14.50 in 2017, 2018, and 2019; (vii) Chicago 3-2-1 Crack Spread averaging US$15.00/bbl in 2017, 2018, and 2019; (viii) the successful completion of our forecast capital expenditure and development plans as outlined in this presentation (including favourable drilling results and successful completion of major projects on time and on budget); (ix) the alignment of realized WCS prices and WCS prices as calculated under the contingent payment agreement; (x) overall production rates for 2017, 2018 and 2019 being in line with our expectations as outlined in this presentation; (xi) royalty rates in Alberta, Saskatchewan and British Columbia remaining unchanged from the currently announced rates for 2017, 2018 and 2019; and (xii) operating and G&A costs per BOE being in line with our expectations as outlined in this presentation.
Unless otherwise specifically stated or the context dictates otherwise, the financial outlook and forward looking metrics in this presentation, in addition to the generally applicable assumptions described above, do not include or account for the effects or impacts of planned asset sales.
The risk factors and uncertainties that could cause Cenovus' actual results to differ materially include: possible failure by us to realize the anticipated benefits of, and synergies from, the Acquisition; our inability to complete the Acquisition on the terms contemplated by the Acquisition Agreement or at all; possible failure to access or implement some or all of the technology necessary to efficiently and effectively operate our assets (including, but not limited to, the Assets) and achieve and sustain future cost reductions; volatility of and other assumptions regarding commodity prices; the effectiveness of our risk management program, including the impact of derivative financial instruments, the success of our hedging strategies and the sufficiency of our liquidity position; the accuracy of cost estimates; commodity prices, currency and interest rates; possible lack of alignment of realized WCS prices and WCS prices as calculated under the contingent payment agreement; product supply and demand; market competition, including from alternative energy sources; risks inherent in our marketing operations, including credit risks; exposure to counterparties and partners, including ability and willingness of such parties to satisfy contractual obligations in a timely manner; risks inherent in the operation of our crude-by-rail terminal, including health, safety and environmental risks; maintaining desirable ratios of Debt (and Net Debt) to Adjusted EBITDA as well as Debt (and Net Debt) to Capitalization; our ability to access various sources of debt and equity capital, generally, and on terms acceptable to us; our ability to finance growth and sustaining capital expenditures; changes in credit ratings applicable to us or any of our securities; changes to our dividend plans or strategy, including the dividend reinvestment plan; accuracy of our reserves, resources, future production and future net revenue estimates; our ability to replace and expand oil and gas reserves; our ability to maintain our relationship with our partners and to successfully manage and operate our integrated business; reliability of our assets including in order to meet production targets; potential disruption or unexpected technical difficulties in developing new products and manufacturing processes; the occurrence of unexpected events such as fires, severe weather conditions, explosions, blow-outs, equipment failures, transportation incidents and other accidents or similar events; refining and marketing margins; inflationary pressures on operating costs, including labour, natural gas and other energy sources used in oil sands processes; potential failure of products to achieve or maintain acceptance in the market; risks associated with fossil fuel industry reputation; unexpected cost increases or technical difficulties in constructing or modifying manufacturing or refining facilities; unexpected difficulties in producing, transporting or refining of crude oil into petroleum and chemical products; risks associated with technology and its application to our business; risks associated with climate change; the timing and the costs of well and pipeline construction; our ability to secure adequate and cost-effective product transportation including sufficient pipeline, crude-by-rail, marine or alternate transportation, including to address any gaps caused by constraints in the pipeline system; availability of, and our ability to attract and retain, critical talent; possible failure to obtain and retain qualified staff and equipment in a timely and cost-efficient manner; changes in our labour relationships; changes in the regulatory framework in any of the locations in which we operate, including changes to the regulatory approval process and land-use designations, royalty, tax, environmental, greenhouse gas, carbon, climate change and other laws or regulations, or changes to the interpretation of such laws and regulations, as adopted or proposed, the impact thereof and the costs associated with compliance; the expected impact and timing of various accounting pronouncements, rule changes and standards on our business, our financial results and our consolidated financial statements; changes in general economic, market and business conditions; political and economic conditions in the countries in which we operate or supply; occurrence of unexpected events such as war, terrorist threats and the instability resulting therefrom; and risks associated with existing and potential future lawsuits and regulatory actions against us.
Statements relating to "reserves" and "resources" are deemed to be forward looking information, as they involve the implied assessment, based on certain estimates and assumptions, that the reserves and resources described exist in the quantities predicted or estimated, and can be profitably produced in the future.
Readers are cautioned that the foregoing lists are not exhaustive and are made as at the date hereof. Events or circumstances could cause our actual results to differ materially from those estimated or projected and expressed in, or implied by, the forward looking information.
Advisory
36
Purchasers should not place undue reliance on the forward looking information contained in this presentation, the final base shelf prospectus, any applicable prospectus supplement or the documents incorporated by reference therein, as actual results achieved will vary from the forward looking information provided in this presentation, the final base shelf prospectus, any applicable prospectus supplement and the documents incorporated by reference therein, and the variations may be material. We make no representation that actual results achieved will be the same in whole or in part as those set out in the forward looking information. Furthermore, the forward looking information contained in this presentation, the final base shelf prospectus, any applicable prospectus supplement and the documents incorporated by reference therein is made as of the date of this presentation or as of the date specified in any applicable prospectus supplement or the documents incorporated by reference therein, as the case may be.
The purpose of the financial outlook in this presentation is to provide management's expectations of the effects of the offering of securities and/or the Acquisition, as applicable. Except as required by applicable securities law, we undertake no obligation to update publicly or otherwise revise any forward looking information or the foregoing list of factors affecting those statements, whether as a result of new information, future events or otherwise or the foregoing lists of factors affecting this information. For a discussion of Cenovus' material risk factors, see "Risk Factors" in the base shelf prospectus, the discussion of risk factors in any applicable prospectus supplement, "Risk Factors" in the company's annual information form or Form 40-F for the year ended December 31, 2016 and "Risk Management" in our management discussion and analysis of financial condition and results of operations for the year ended December 31, 2016, each available on the company's website at Cenovus.com, on SEDAR at sedar.com, and on EDGAR at sec.gov.
NON-GAAP MEASURES AND ADDITIONAL SUBTOTAL
The following measures do not have a standardized meaning as prescribed by International Financial Reporting Standards ("IFRS" or "GAAP") and therefore are considered non-GAAP measures. You should not consider these measures in isolation or as a substitute for analysis of our results as reported under IFRS. These measures are defined differently by different companies in our industry. These measures may not be comparable to similar measures presented by other issuers.
Netback is a non-GAAP measure commonly used in the oil and gas industry to assist in measuring operating performance on a per-unit basis. Netback is defined as gross sales less royalties, transportation and blending, operating expenses and production and mineral taxes divided by sales volumes. Netbacks do not reflect non-cash write-downs of product inventory until the inventory is sold. Netbacks reflect Cenovus' margin on a per-barrel basis of unblended bitumen and crude oil. As such, the bitumen and crude oil sales price, transportation and blending costs, and sales volumes exclude the impact of purchased condensate. Condensate is blended with the bitumen and heavy oil to reduce its thickness in order to transport it to market. Our Netback calculation is aligned with the definition found in the Canadian Oil and Gas Evaluation Handbook ("COGE Handbook"). See Appendix "A" in the prospectus supplement for a reconciliation of Netback to the applicable line items of the Pro Forma Operating Statement.
Adjusted Funds Flow is a non-GAAP measure commonly used in the oil and gas industry to assist in measuring a company’s ability to finance its capital programs and meet its financial obligations. Adjusted Funds Flow is defined as Cash From Operating Activities excluding net change in other assets and liabilities and net change in non-cash working capital. Net change in other assets and liabilities is composed of site restoration costs and pension funding. Non-cash working capital is composed of current assets and current liabilities, excluding cash and cash equivalents and risk management.
Free Funds Flow is a non-GAAP measure defined as Adjusted Funds Flow less capital investment.
Debt is a non-GAAP measure that we define as short-term borrowings and the current and long-term portions of long-term debt. Debt is used as a component of Net Debt.
Net Debt is a non-GAAP measure defined as Debt net of cash and cash equivalents. Adjusted EBITDA is a non-GAAP measure that we define as earnings before finance costs, interest income, income tax expense, depreciation, depletion and amortization, goodwill impairments, asset impairments and reversals, unrealized gains (losses) on risk management, foreign exchange gains (losses), gains (losses) on divestiture of assets, revaluation gain and other income (loss), net, calculated on a trailing 12-month basis. Net debt to Adjusted EBITDA is used to steward our overall debt position and as a measure of our overall financial strength.
Capitalization is a non-GAAP measure that we define as Debt plus shareholders’ equity. Net Debt to Capitalization is defined as net debt divided by net debt plus shareholders’ equity.
Operating Margin is an additional subtotal found in Note 1 of the undaudited annual comparative consolidated financial statements and auditor's report thereon for the year ended December 31, 2016 and is used to provide a consistent measure of the cash generating performance of our assets for comparability of our underlying financial performance between periods. Operating Margin is defined as revenues less purchased product, transportation and blending, operating expenses and production and mineral taxes plus realized gains less realized losses on risk management activities.
OIL AND GAS INFORMATION
The estimates of reserves and resources data and related information contained in this presentation were prepared by independent qualified reserves evaluators, based on the Canadian Oil and Gas Evaluation Handbook and in compliance with the requirements of National Instrument 51-101 Standards of Disclosure for Oil and Gas Activities (“NI 51-101”). The SEC definitions of proved and probable reserves are different from the definitions contained in NI 51-101; therefore, proved and probable reserves disclosed herein in compliance with NI 51-101 may not be comparable to U.S. standards. The U.S. Securities and Exchange Commission (the "SEC") requires U.S. oil and gas reporting companies, in their filings with the SEC, to disclose only proved reserves after the deduction of royalties and production due to others but permits the optional disclosure of probable and possible reserves.
Advisory
37

OIL AND GAS INFORMATION
With respect to the Assets, the reserves and resources data and related information in this presentation were prepared by McDaniel & Associates Consultants Ltd. ("McDaniel") and GLJ Petroleum Consultants Ltd. ("GLJ"). McDaniel evaluated approximately 84% of the Assets' proved reserves and GLJ evaluated approximately 16% of the Assets’ proved reserves and the information is dated March 22, 2017, with an effective date of December 31, 2016. McDaniel’s preparation date of the information was March 21, 2017 and GLJ’s preparation date was March 6, 2017.
With respect to Cenovus' pre-Acquisition assets, the reserves and resources data and related information in this presentation were also prepared by McDaniel and GLJ. McDaniel evaluated approximately 97 percent of Cenovus' proved reserves, located in Alberta, and GLJ evaluated approximately three percent of the Cenovus' proved reserves, located in Saskatchewan. This reserves data and other oil and gas information is dated February 15, 2017, with an effective date of December 31, 2016. McDaniel’s preparation date of the information was January 11, 2017 and GLJ’s preparation date was January 11, 2017.
All estimates are presented using McDaniel’s January 1, 2017 price forecast.
Barrels of Oil Equivalent
Certain natural gas volumes have been converted to barrels of oil equivalent (BOE) on the basis of six thousand cubic feet (Mcf) to one bbl. BOE may be misleading, particularly if used in isolation. A conversion ratio of six Mcf to one bbl is based on an energy equivalency conversion method primarily applicable at the burner tip and does not represent value equivalency at the wellhead. Given that the value ratio based on the current price of crude oil as compared to natural gas is significantly different from the energy equivalency of six to one, utilizing a conversion on a six to one basis may be misleading as an indication of value.
Drilling Locations and Future Drilling Opportunities
This presentation discloses potential future drilling locations in two categories: (a) proved locations and (b) probable locations. This presentation also discloses additional un-booked future drilling opportunities. Proved locations and probable locations are proposed drilling locations identified in the Assets Reserves Reports (as defined in the prospectus supplement) that have proved and/or probable reserves, as applicable, attributed to them in such report. Un-booked future drilling opportunities are internal Cenovus estimates based on prospective acreage and an assumption as to the number of wells that can be drilled per section based on industry practice and internal Cenovus technical analysis and review. Un-booked future drilling opportunities have been identified by Cenovus management based on evaluation of applicable geologic, seismic, engineering, production and reserves information. Un-booked future drilling opportunities do not have proved or probable reserves attributed to them in the Assets Reserves Reports. Of the approximately 1,500 identified drilling opportunities within the Deep Basin to be acquired, 212 are proved locations, 221 are probable locations and the remainder of which are un-booked future drilling opportunities.
Cenovus' ability to drill and develop these locations and opportunities and the drilling locations on which Cenovus actually drills wells depends on a number of uncertainties and factors, including, but not limited to, the availability of capital, equipment and personnel, oil and natural gas prices, capital and operating costs, inclement weather, seasonal restrictions, drilling results, additional geological, geophysical and reservoir information that is obtained, production rate recovery, gathering system and transportation constraints, net price received for commodities produced, regulatory approvals and regulatory changes. As a result of these uncertainties, there can be no assurance that the potential future drilling locations and opportunities Cenovus has identified will ever be drilled or if Cenovus will be able to produce oil, NGL or natural gas from these or any other potential drilling locations or opportunities. As such, Cenovus' actual drilling activities may differ materially from those presently identified, which could adversely affect Cenovus' business. While certain of the identified un-booked drilling opportunities have been de-risked by drilling existing wells in relatively close proximity to such un-booked drilling opportunities, some of the other un-booked drilling opportunities are farther away from existing wells where Cenovus management has less information about the characteristics of the reservoir and therefore there is more uncertainty whether wells will be drilled and, if drilled, there is further uncertainty that such wells will result in additional proved or probable reserves or production.
Conventions and Industry Terminology
References in this presentation to "crude oil" means "bitumen", "heavy crude oil", "light crude oil" and "medium crude oil" combined as those terms are defined in NI 51-101; references to "natural gas" means, collectively, "conventional natural gas" as defined in NI 51-101; "shale gas" as defined in NI 51-101, "coal bed methane" as defined in NI 51-101, "solution gas" as defined in Canadian Securities Administrators Staff Notice 51-324 Glossary to NI 51-101 – Standards of Disclosure for Oil and Gas Activities; references to "NGLs" means "natural gas liquids" as defined in NI 51-101; references to "heavy oil" means "heavy crude oil" as defined in NI 51-101, and references to "liquids" means crude oil and NGLs.
Types of wells described in this presentation are based on actual drilling results from such wells to date.
"Capital Efficiency" is defined as initial well costs divided by IP365. Initial well costs include the average expected costs to drill, complete, and tie-in a single well and exclude costs associated with early stage appraisal activity such as seismic, stratigraphic test drilling, and other infrastructure. Capital Efficiency does not have any standard meaning prescribed by IFRS or the COGE Handbook and therefore may not be comparable with the calculation of similar measures for other entities. We believe that the presentation of Capital Efficiency is relevant and useful to investors because it shows the illustrative economics in respect of wells that may be comparable to those we anticipate drilling in respect of the Deep Basin Assets over the first 365 days of production of such wells..
Advisory
38

OIL AND GAS INFORMATION
"Decline rate" is defined as the rate at which proved developed producing reserves are expected to naturally decline according to the evaluation by our independent qualified reserves evaluator.
"F&D" is defined as expected initial well costs divided by forecasted average recovery based on type curve analysis. F&D does not have any standard meaning prescribed by IFRS and therefore may not be comparable with the calculation of similar measures for other entities. We believe that the presentation of F&D is relevant and useful to investors because it shows the illustrative well-level finding and development cost economics in respect of wells that may be comparable to those we anticipate drilling in respect of the Deep Basin Assets.
"Field Level Break-Even" is the approximate benchmark WTI oil price at which realized bitumen revenues cover cash costs, including royalties, transportation and blending, and operating costs. Field Level Break-Even does not have any standard meaning prescribed by IFRS or the COGE Handbook and therefore may not be comparable with the calculation of similar measures for other entities. We believe that the presentation of Field Level Break-Even is relevant and useful to investors because it provides an illustrative field level break-even economic WTI oil price in respect of our oil sands projects.
"IP365" is defined as the estimated average producing day rate over the first 365 days of a type curve forecast based on analysis of existing wells having characteristics believed to be similar as the identified drilling opportunities.
"IRR" is defined as the interest rate at which the net present value of all future cash flows from a well equal zero. IRR does not have any standard meaning prescribed by IFRS or the COGE Handbook and therefore may not be comparable with the calculation of similar measures for other entities. We believe that the presentation of IRR is relevant and useful to investors because it shows illustrative well-level economics in respect of wells that may be comparable to those we anticipate drilling in respect of the Deep Basin Assets.
"NPV" is defined as the difference between the present value of projected cash inflows and the present value of projected cash outflows. NPV does not have any standard meaning prescribed by IFRS and therefore may not be comparable with the calculation of similar measures for other entities. We believe that the presentation of NPV is relevant and useful to investors because it presents the relative monetary significance of wells that may be comparable to those we anticipate drilling in respect of the Deep Basin Assets. Further, investors may utilize the measure as a basis for comparison of the relative size and value of our reserves to other companies. We use this measure when assessing the potential return on investment related to our oil and natural gas properties. NPV, however, does not purport to present the fair value of our oil, natural gas and NGLs reserves.
"Payout" is the number of years required for projected after-tax cash inflows to exceed initial well costs. Payout does not have any standard meaning prescribed by IFRS and therefore may not be comparable with the calculation of similar measures for other entities. We believe that the presentation of Payout is relevant and useful to investors because it presents an illustration of the time length to profitability of wells that may be comparable to those we anticipate drilling in respect of the Deep Basin Assets.
"Recycle Ratio" is defined as estimated total operating margin over the life of a well divided by initial well costs. Recycle Ratio does not have any standard meaning prescribed by IFRS or the COGE Handbook and therefore may not be comparable with the calculation of similar measures for other entities. We consider Recycle Ratio to be a useful supplemental measure of operating performance and profitability in respect of wells that may be comparable to those we anticipate drilling in respect of the Deep Basin Assets.
"Well Costs" include the average expected costs to drill, complete, and tie-in a single well.
Material assumptions used in calculating, and the risks applicable to, the above metrics in this presentation are consistent with those detailed above under "Forward-Looking Information".
For more information see the sections titled "Note Regarding Reserves and Resources Disclosure", "Drilling Locations" and "Conventions and Industry Terminology" in the prospectus supplement.
Production Presentation Basis
Cenovus presents production volumes on a net to Cenovus before royalties basis, unless otherwise stated. Any ticker symbols noted in this presentation are in respect of companies listed on Toronto Stock Exchange.
All dollar amounts in this presentation are in Canadian dollars unless otherwise indicated.
TM denotes a trademark of Cenovus Energy Inc.
© 2017 Cenovus Energy Inc.
Advisory
39