Transformer Design Transformer Design Transformer Design Transformer Design Transformer
Upload
ssp-innovationsCategory
view
35download
5
Transformer LoadingDriving Enterprise Decisions with ArcGIS Online
Esri User Conference 2015
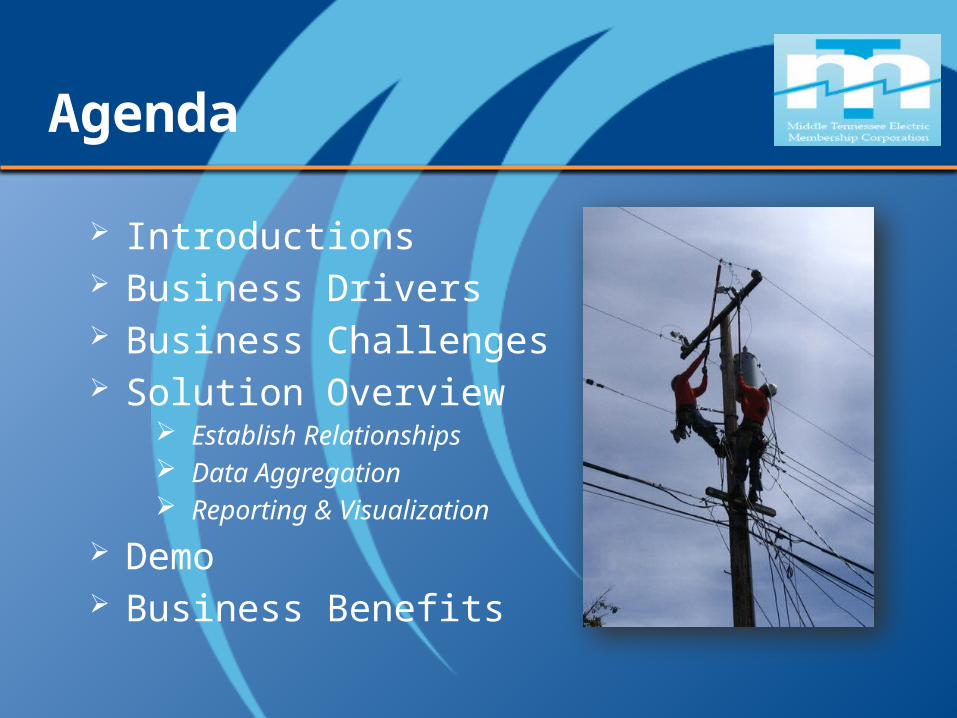
Agenda
Introductions Business Drivers Business Challenges Solution Overview
Establish Relationships Data Aggregation Reporting & Visualization
Demo Business Benefits
Introductions
Nathaniel Everett | Middle Tennessee EMC• GIS Technical Lead• Covers ArcGIS / ArcFM / Designer• Information Services Department
Skye Perry | SSP Innovations• Principal Consultant• Esri & Schneider Electric Technical Architect• Utility-Focused ArcGIS Online Specialty Partner• Began work with MTEMC in 2013
Business Drivers
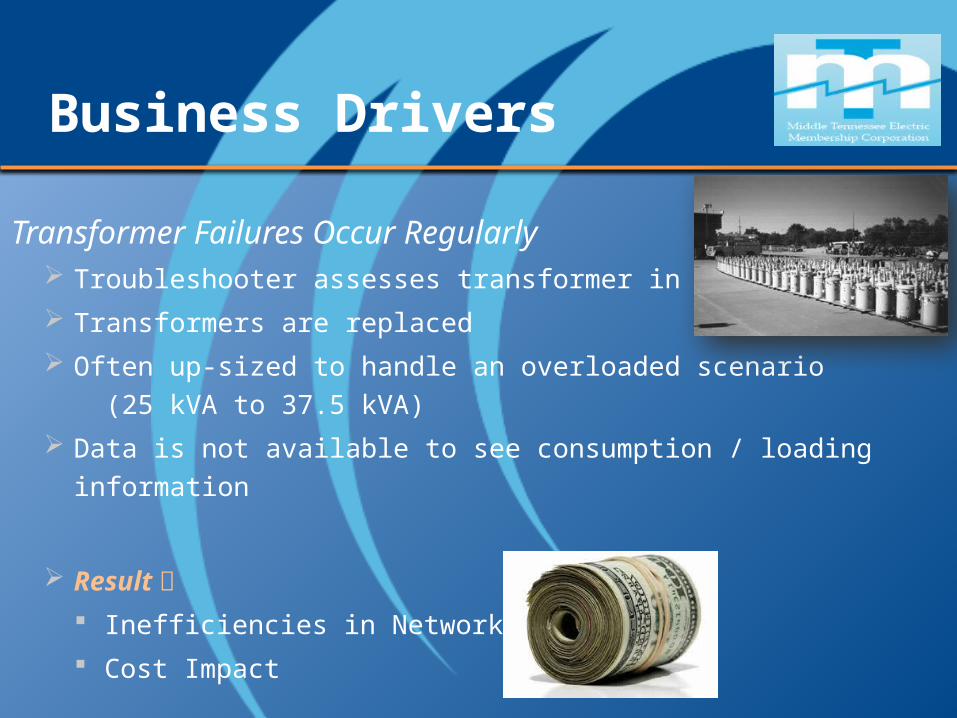
Transformer Failures Occur Regularly Troubleshooter assesses transformer in the field
Transformers are replaced
Often up-sized to handle an overloaded scenario (25 kVA to 37.5 kVA)
Data is not available to see consumption / loading information
Result
Inefficiencies in Network
Cost Impact
Business Drivers
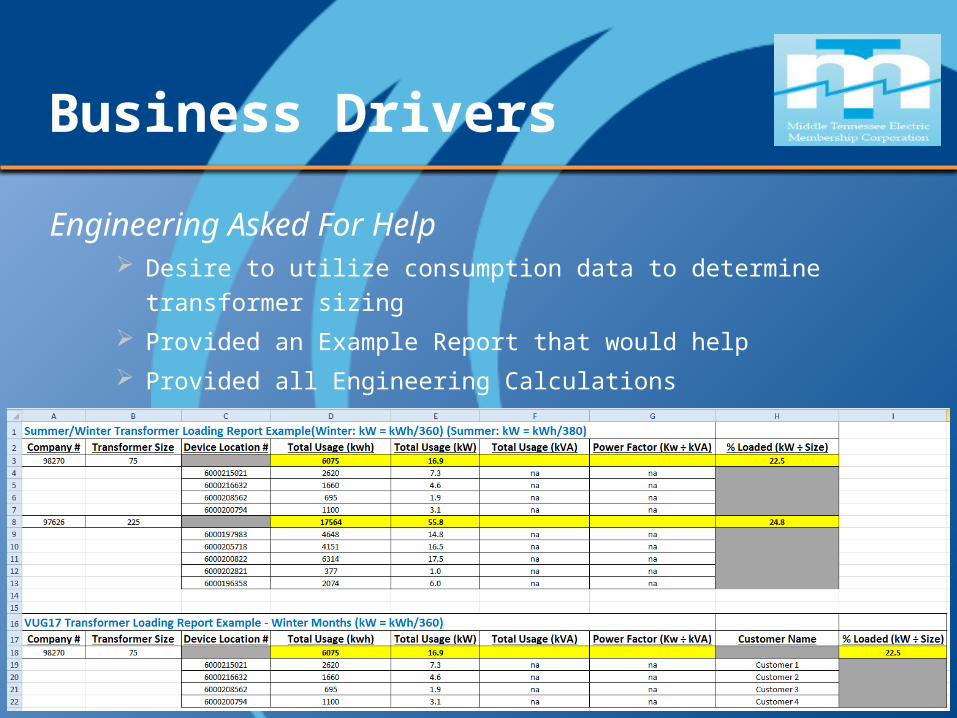
Engineering Asked For Help Desire to utilize consumption data to determine transformer
sizing
Provided an Example Report that would help
Provided all Engineering Calculations
Business Challenges
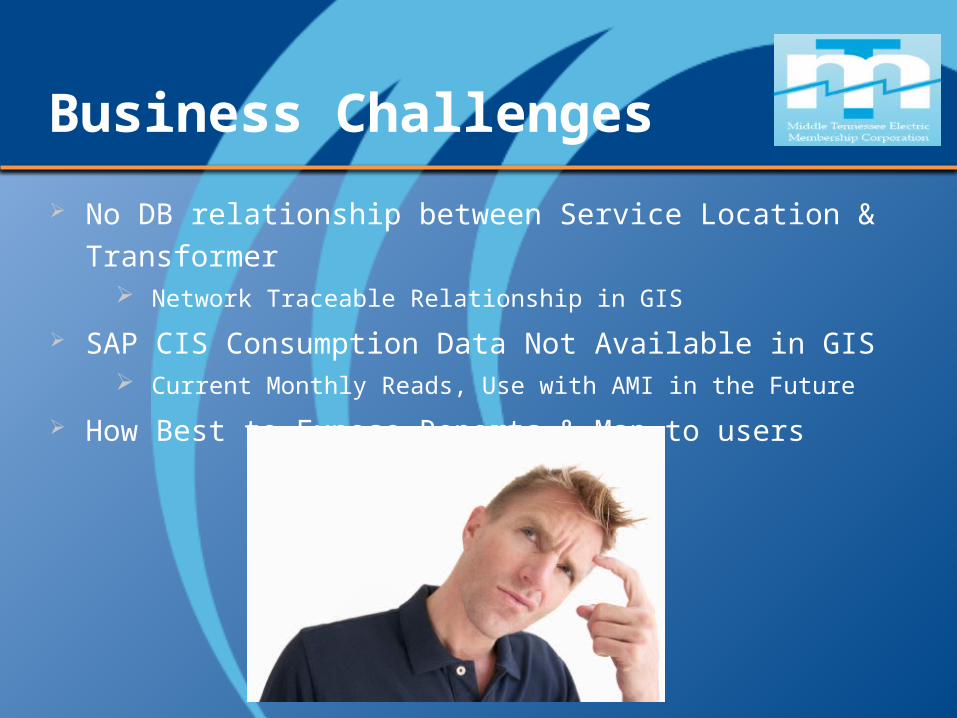
No DB relationship between Service Location & Transformer
Network Traceable Relationship in GIS
SAP CIS Consumption Data Not Available in GIS Current Monthly Reads, Use with AMI in the Future
How Best to Expose Reports & Map to users
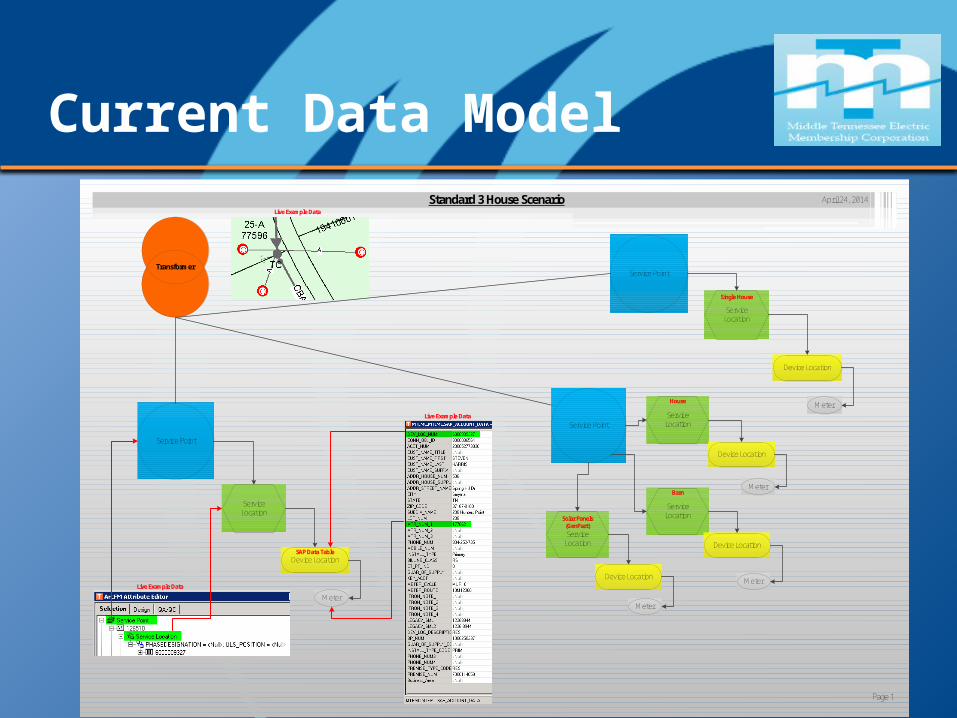
Current Data ModelApril 24, 2014
Page 1
Service Point
Service Location
Device Location
Meter
Service PointService
Location
Device Location
Meter
Service Point
Service Location
Device Location
Meter
Transformer
Standard 3 House Scenario
Live Example Data
Live Example Data
Live Example Data
Single House
House
Service Location
Device Location
Meter
Solar Panels (GenPart)
Service Location
Device Location
Meter
Barn
SAP Data Table
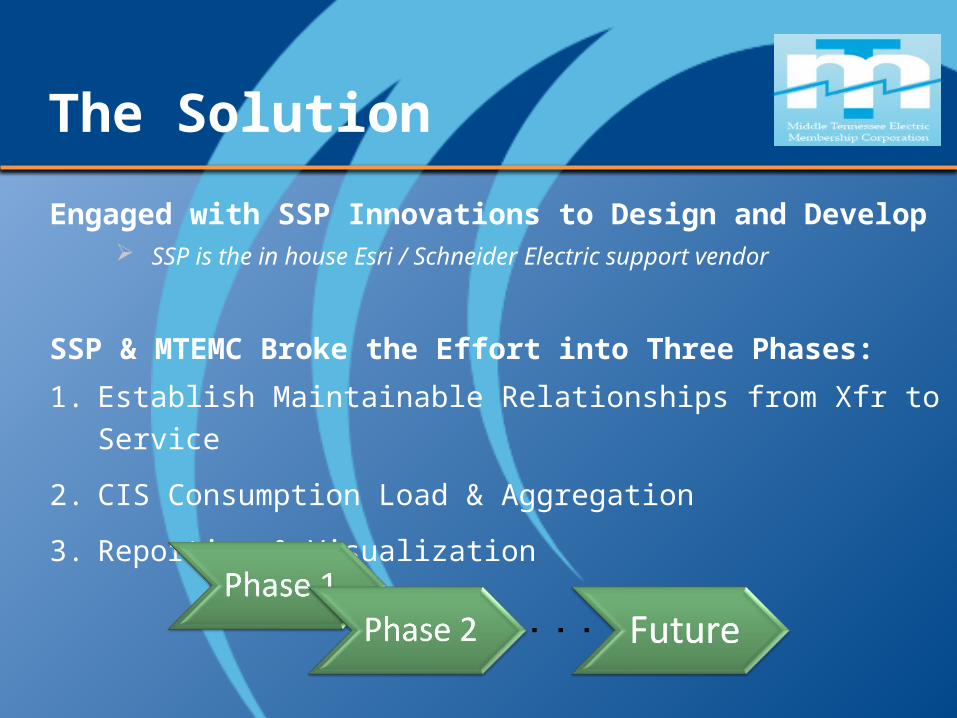
The Solution
Engaged with SSP Innovations to Design and Develop SSP is the in house Esri / Schneider Electric support vendor
SSP & MTEMC Broke the Effort into Three Phases:
1. Establish Maintainable Relationships from Xfr to Service
2. CIS Consumption Load & Aggregation
3. Reporting & Visualization
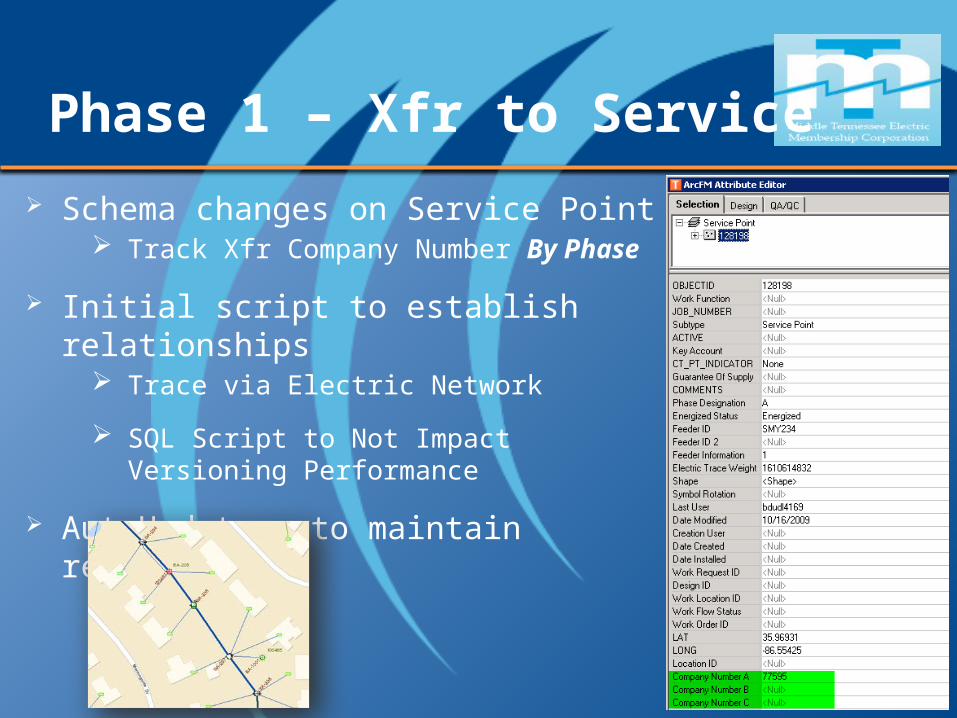
Phase 1 – Xfr to Service
Schema changes on Service Point Track Xfr Company Number By Phase
Initial script to establish relationships
Trace via Electric Network
SQL Script to Not Impact Versioning Performance
AutoUpdaters to maintain relationship
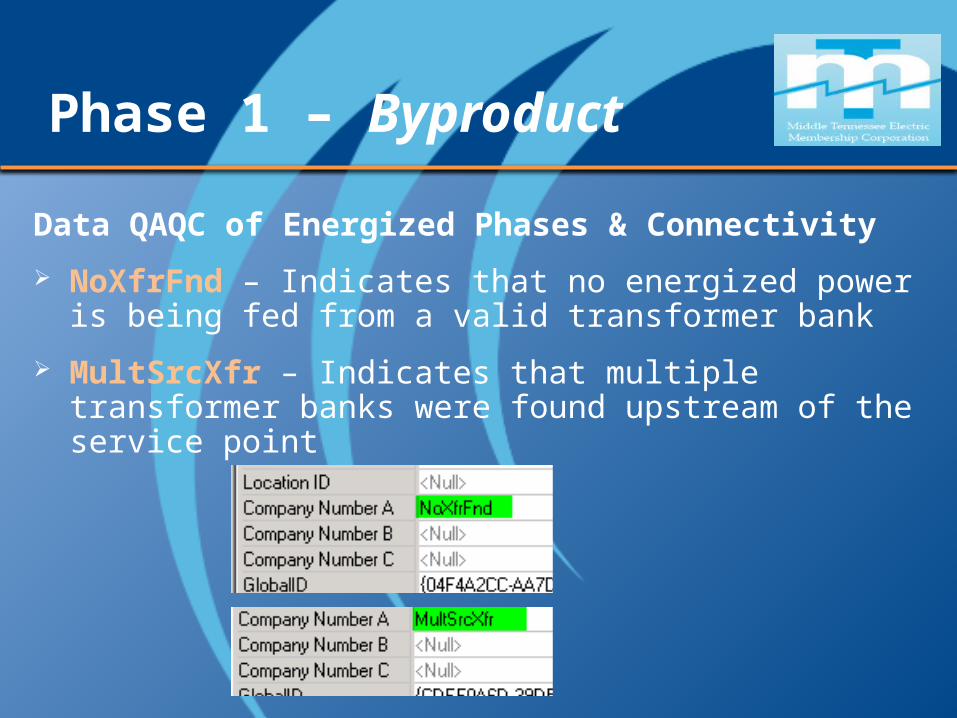
Phase 1 – Byproduct
Data QAQC of Energized Phases & Connectivity
NoXfrFnd – Indicates that no energized power is being fed from a valid transformer bank
MultSrcXfr – Indicates that multiple transformer banks were found upstream of the service point
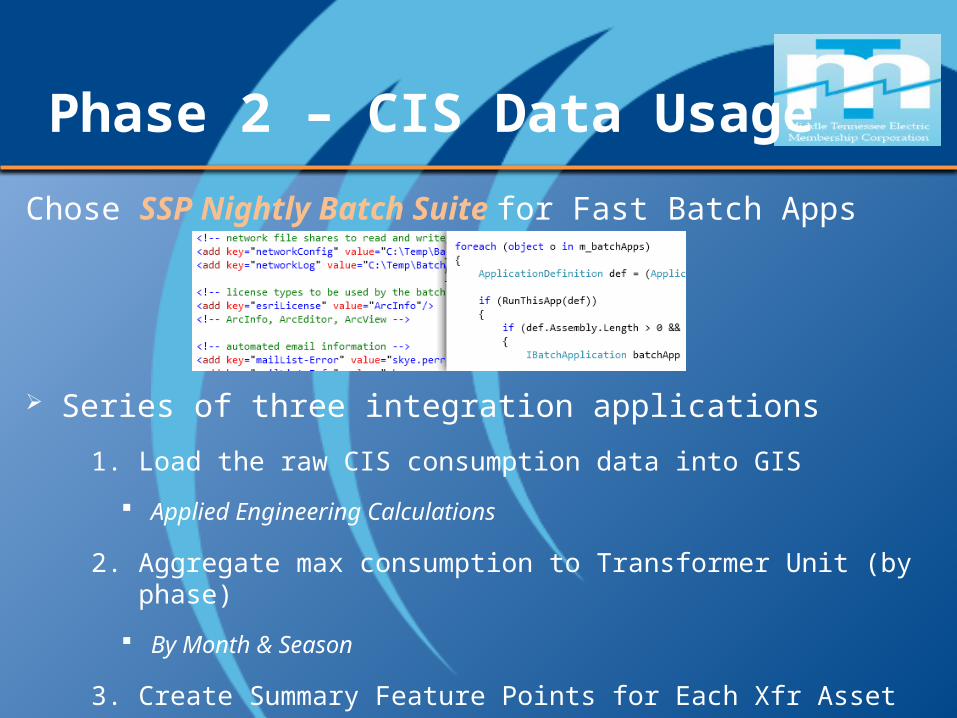
Phase 2 – CIS Data Usage
Chose SSP Nightly Batch Suite for Fast Batch Apps
Series of three integration applications
1. Load the raw CIS consumption data into GIS
Applied Engineering Calculations
2. Aggregate max consumption to Transformer Unit (by phase)
By Month & Season
3. Create Summary Feature Points for Each Xfr Asset
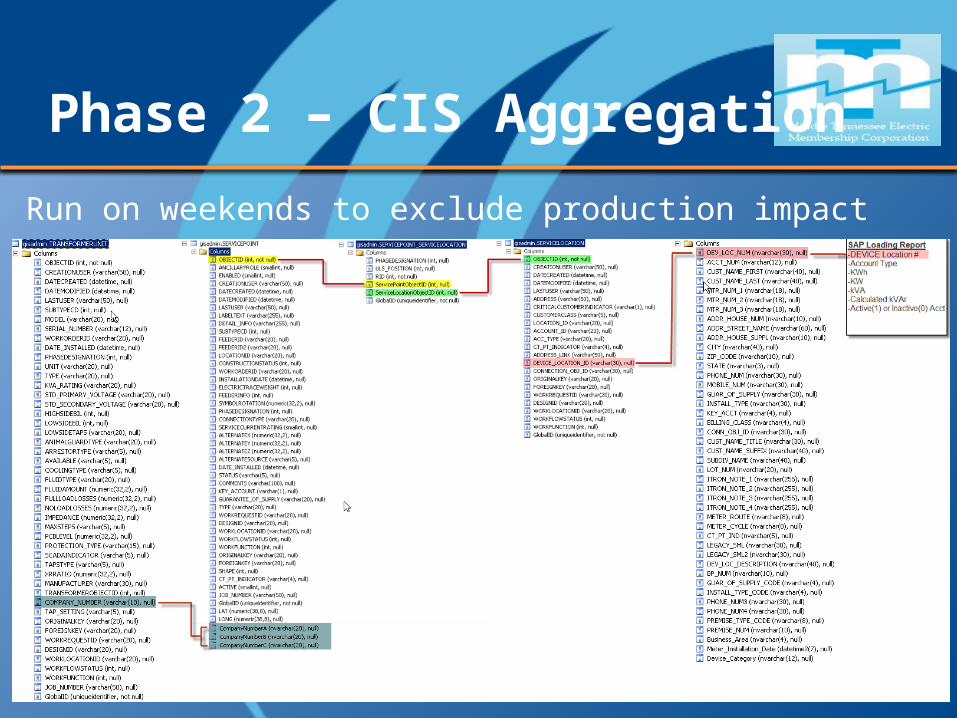
Phase 2 – CIS Aggregation
Run on weekends to exclude production impact
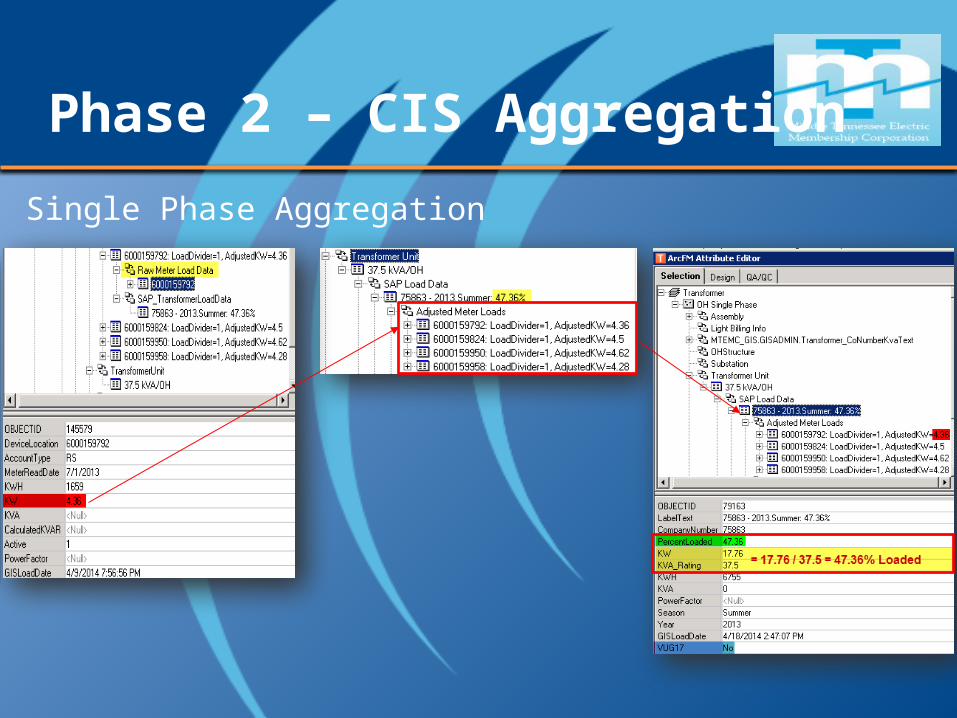
Phase 2 – CIS Aggregation
Single Phase Aggregation
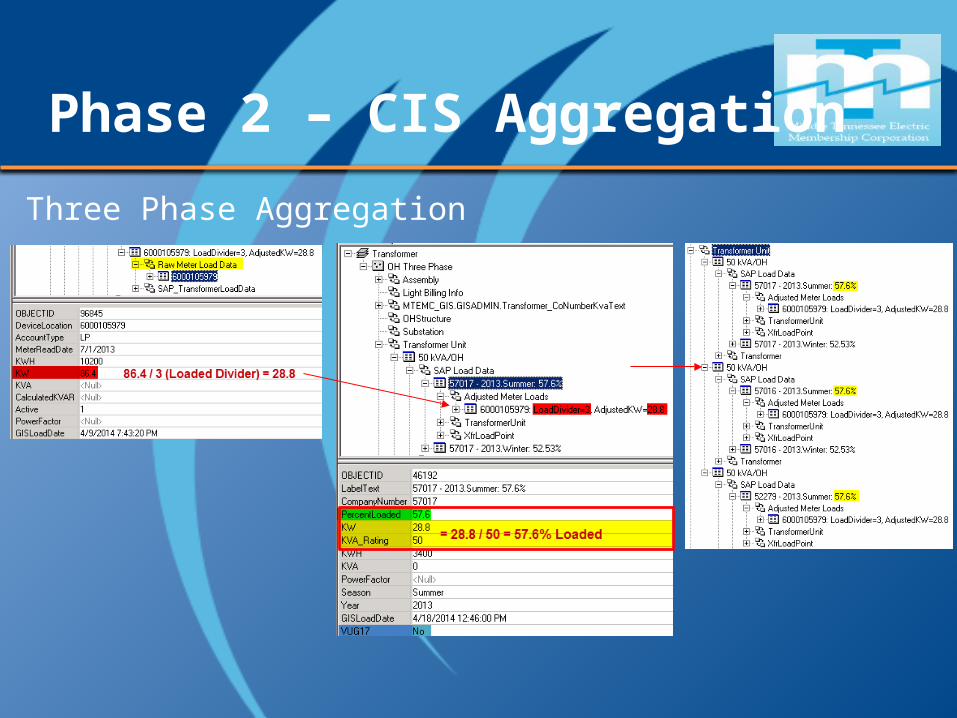
Phase 2 – CIS Aggregation
Three Phase Aggregation
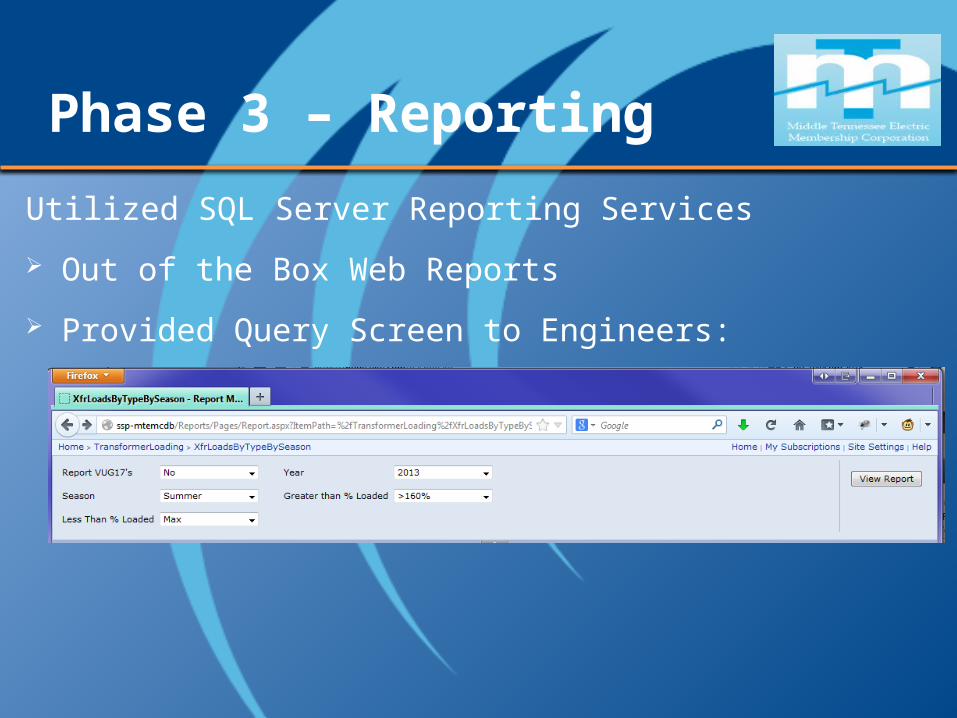
Phase 3 – Reporting
Utilized SQL Server Reporting Services
Out of the Box Web Reports
Provided Query Screen to Engineers:
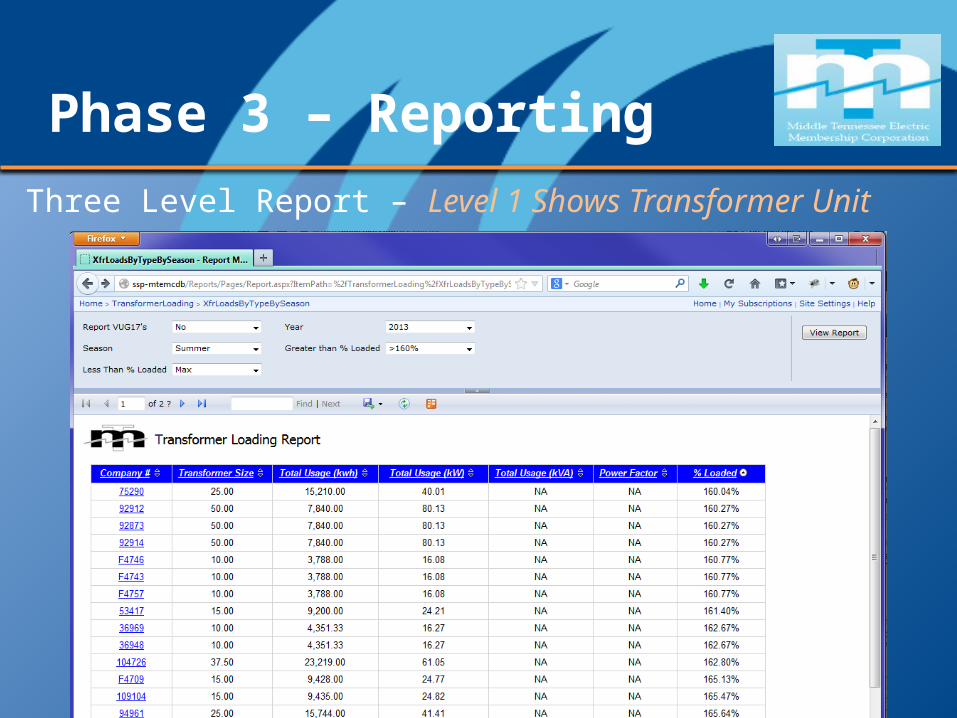
Phase 3 – Reporting
Three Level Report – Level 1 Shows Transformer Unit
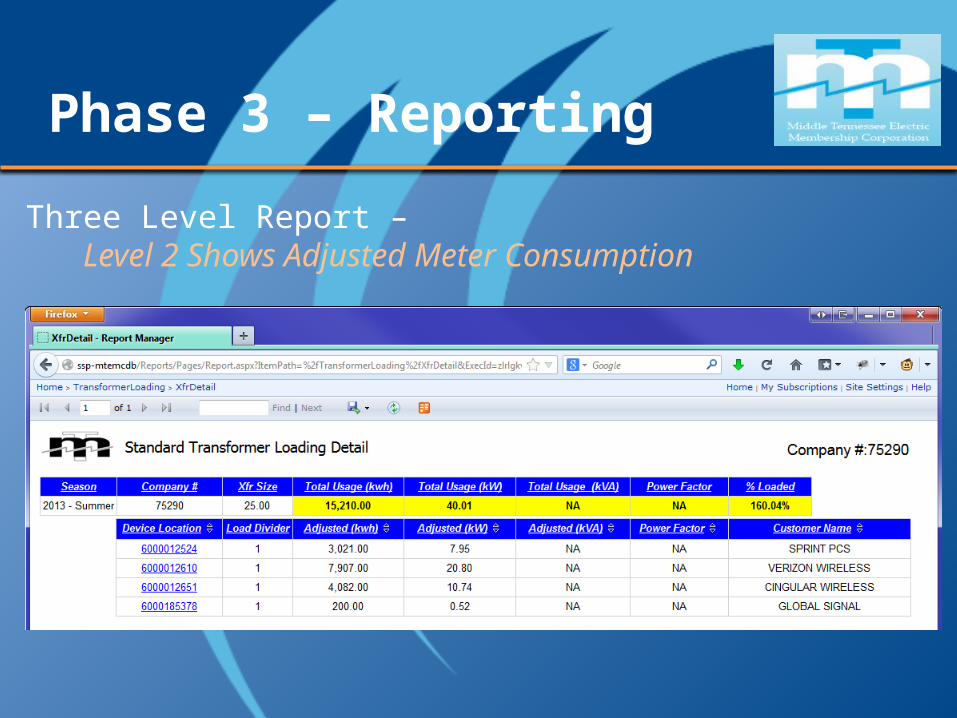
Phase 3 – Reporting
Three Level Report – Level 2 Shows Adjusted Meter Consumption
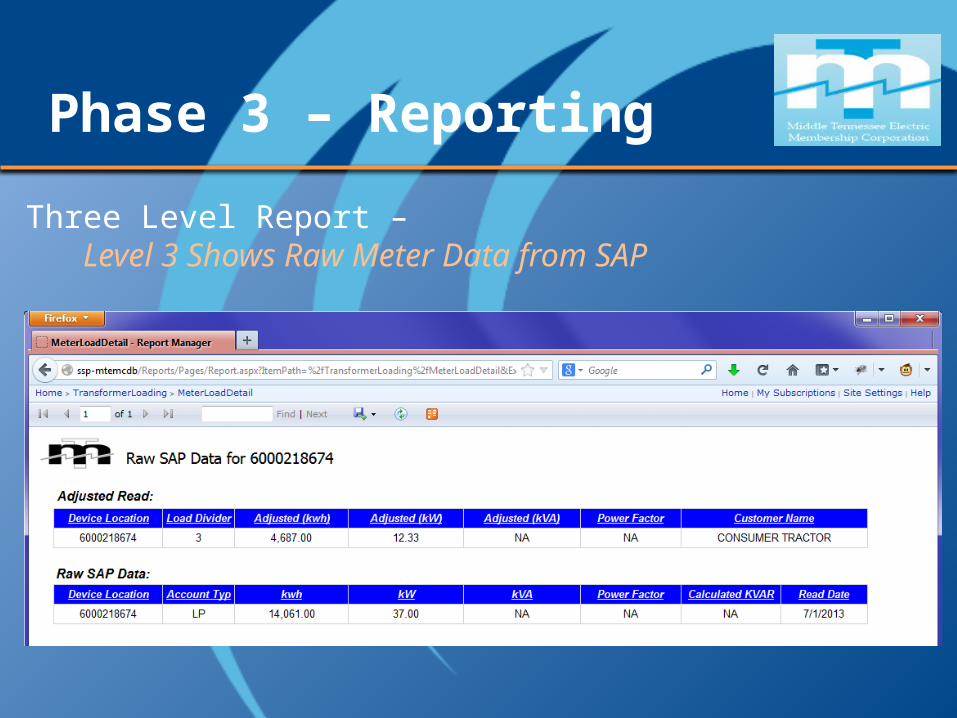
Phase 3 – Reporting
Three Level Report – Level 3 Shows Raw Meter Data from SAP
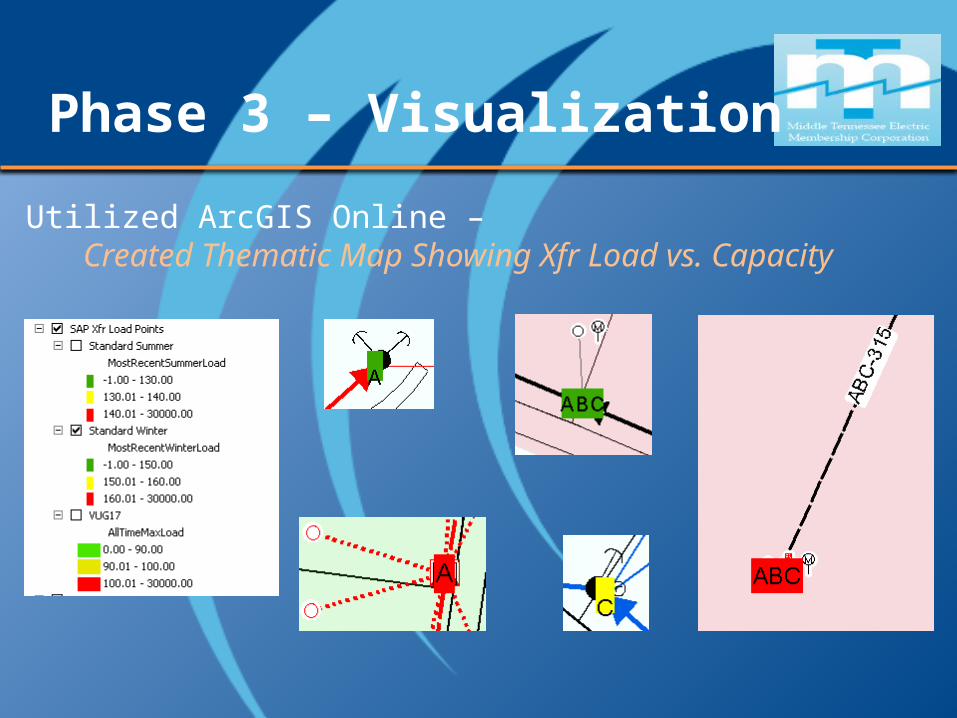
Phase 3 – Visualization
Utilized ArcGIS Online – Created Thematic Map Showing Xfr Load vs. Capacity
Phase 3 – Visualization
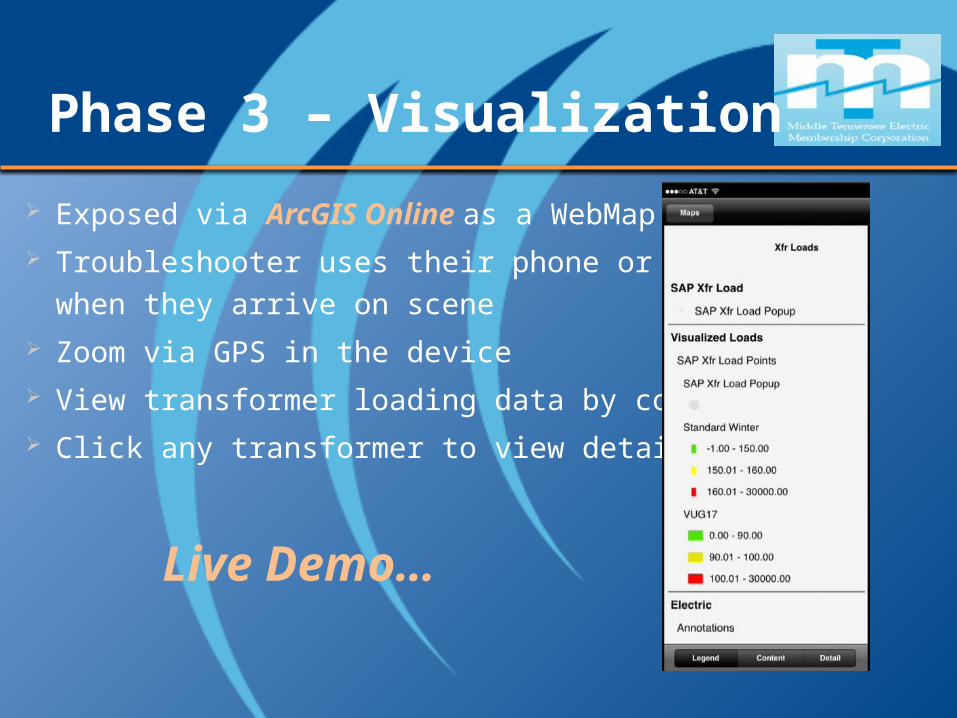
Exposed via ArcGIS Online as a WebMap Troubleshooter uses their phone or tablet
when they arrive on scene Zoom via GPS in the device View transformer loading data by color Click any transformer to view details
Live Demo…
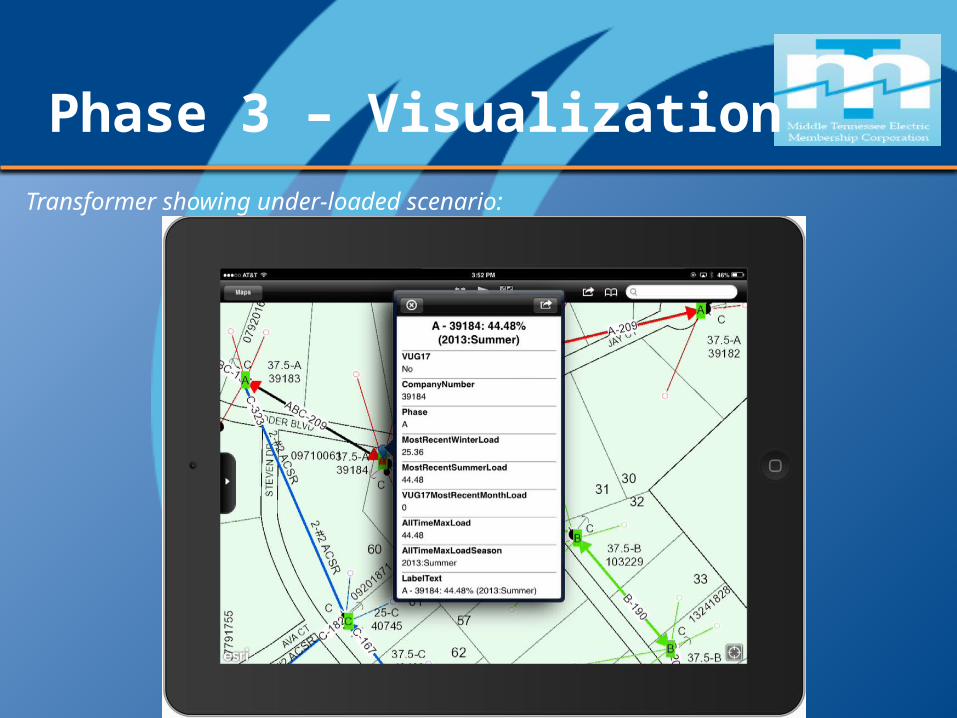
Transformer showing under-loaded scenario:
Phase 3 – Visualization
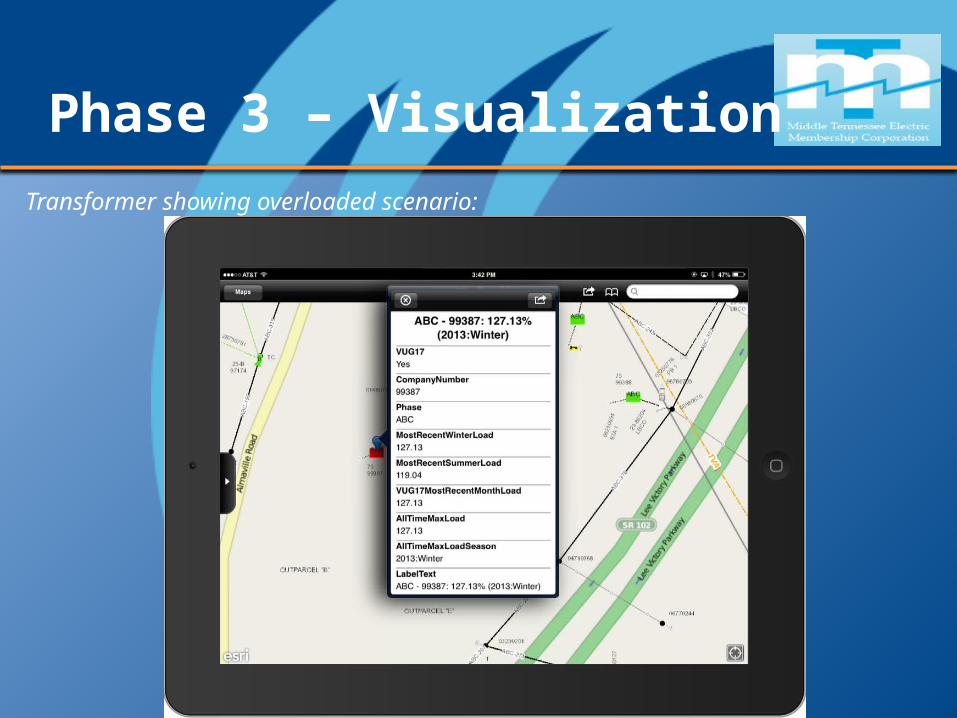
Transformer showing overloaded scenario:
Phase 3 – Visualization
Business Benefits
Operations Empowered Engineers & Troubleshooters with New Data Provided Real Time Data Access in field from ANY Device
Allows for educated decision making
Engineering Can Review Existing Xfr Installs Against Usage
May reallocate network
Net Result is Cost Savings, Better Efficiency, & System Awareness
Business Benefits
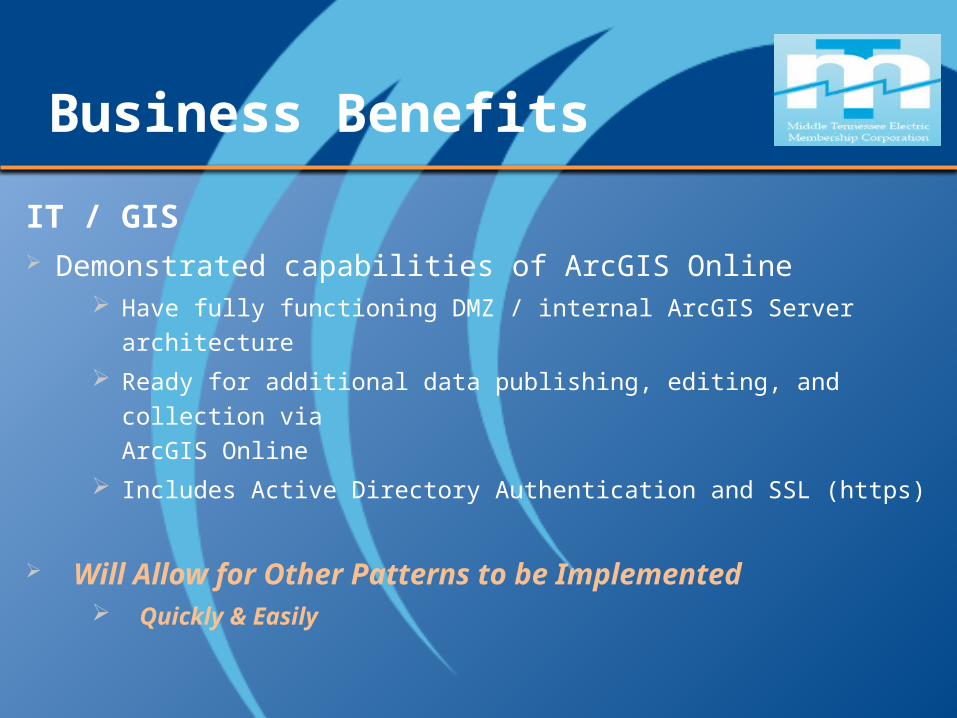
IT / GIS Demonstrated capabilities of ArcGIS Online
Have fully functioning DMZ / internal ArcGIS Server architecture
Ready for additional data publishing, editing, and collection via ArcGIS Online
Includes Active Directory Authentication and SSL (https)
Will Allow for Other Patterns to be Implemented Quickly & Easily
Questions?
Skye PerryPrincipal Consultant
SSP Innovations
Nathaniel EverettGIS Technical Lead
Middle Tennessee EMC

Transformer LoadingDriving Enterprise Decisions with ArcGIS Online
Esri User Conference 2015


![Python and ArcGIS Enterprise - static.packt-cdn.com€¦ · Python and ArcGIS Enterprise [ 2 ] ArcGIS enterprise Starting with ArcGIS 10.5, ArcGIS Server is now called ArcGIS Enterprise.](https://static.fdocuments.us/doc/165x107/5ecf20757db43a10014313b7/python-and-arcgis-enterprise-python-and-arcgis-enterprise-2-arcgis-enterprise.jpg)