Transformational Leadership for Virtual Teams in an ...
100
Walden University ScholarWorks Walden Dissertations and Doctoral Studies Walden Dissertations and Doctoral Studies Collection 2015 Transformational Leadership for Virtual Teams in an Information Technology Organization Russell omas Hogue Walden University Follow this and additional works at: hps://scholarworks.waldenu.edu/dissertations Part of the Business Administration, Management, and Operations Commons , Management Sciences and Quantitative Methods Commons , and the Organizational Behavior and eory Commons is Dissertation is brought to you for free and open access by the Walden Dissertations and Doctoral Studies Collection at ScholarWorks. It has been accepted for inclusion in Walden Dissertations and Doctoral Studies by an authorized administrator of ScholarWorks. For more information, please contact [email protected].
Transcript of Transformational Leadership for Virtual Teams in an ...

Walden UniversityScholarWorks
Walden Dissertations and Doctoral Studies Walden Dissertations and Doctoral StudiesCollection
2015
Transformational Leadership for Virtual Teams inan Information Technology OrganizationRussell Thomas HogueWalden University
Follow this and additional works at: https://scholarworks.waldenu.edu/dissertations
Part of the Business Administration, Management, and Operations Commons, ManagementSciences and Quantitative Methods Commons, and the Organizational Behavior and TheoryCommons
This Dissertation is brought to you for free and open access by the Walden Dissertations and Doctoral Studies Collection at ScholarWorks. It has beenaccepted for inclusion in Walden Dissertations and Doctoral Studies by an authorized administrator of ScholarWorks. For more information, pleasecontact [email protected].

Walden University
College of Social and Behavioral Sciences
This is to certify that the doctoral dissertation by
Russell Hogue
has been found to be complete and satisfactory in all respects,
and that any and all revisions required by
the review committee have been made.
Review Committee
Dr. Rebekah Cardenas, Committee Chairperson, Psychology Faculty
Dr. Barbara Chappell, Committee Member, Psychology Faculty
Dr. John Schmidt, University Reviewer, Psychology Faculty
Chief Academic Officer
Eric Riedel, Ph.D.
Walden University
2015

Abstract
Transformational Leadership for Virtual Teams in an Information Technology
Organization
by
Russell T. Hogue
MBA, University of Phoenix, 2003
BSBA, Southern Illinois University, 1998
Dissertation Submitted in Partial Fulfillment
of the Requirements for the Degree of
Doctor of Philosophy
Organizational Psychology
Walden University
August 2015

Abstract
Research has shown that transformational leadership behavior impacts team performance
in a traditional work environment; however, no research has evaluated the relationship
between transformational leadership and team performance in a virtual setting. Building
on the theoretical foundation of Bass’ 1990 work, this study examined the relationship
between transformational leadership behavior and 3 measures linked to team success:
work effort, perceived leader effectiveness, and job satisfaction for virtual teams. The
present research focused on the transformational leadership behaviors of 41 senior
executives in an information technology (IT) organization and over 300 direct report
employees. Employees used the Multifactor Leadership Questionnaire 5x to rate their
direct report supervisors’ leadership characteristics. Regression analyses were used to
evaluate the relationship between transformational leadership and the preceding
indicators for successful performance. The findings supported the applicability of Bass’
leadership model beyond the traditional workforce. The results of this study will
positively impact social change by clarifying how executive leadership behavior directs
virtual IT team success, enabling IT organizations to better identify future leaders, and
allowing organizations to institute training opportunities to develop internal candidates to
become better leaders.

Transformational Leadership for Virtual Teams in an Information Technology
Organization
by
Russell T. Hogue
MBA, University of Phoenix, 2003
BSBA, Southern Illinois University, 1998
Dissertation Submitted in Partial Fulfillment
of the Requirements for the Degree of
Doctor of Philosophy
Organizational Psychology
Walden University
August 2015

Dedication
This work is dedicated to my father and my grandfather, Gary Killion and Clyde
Goodman. My father, Gary Killion passed away just before the completion of this
project. For the past 20 years he has been a foundation for our family, a reliable voice of
reason and a person I looked up to with admiration and love.
My grandfather, Clyde Goodman, was a World War II veteran, a father figure, a
grandfather, and a friend. He inspired me to do more and to be more, and above all else
he demonstrated how to be a loving father and husband. I was inspired to pursue a
doctoral degree by his belief in me.

Acknowledgments
I would like to acknowledge and thank my committee members, Dr. Rebekah
Cardenas and Dr. Barbara Chappell, for the support, guidance, and patience to help me
make it through the dissertation and learn so much in the process. My time at Walden
University has been extraordinary because of the faculty, staff, and classmates who have
created such a great learning experience. I would also like to thank my mother, Pam
Killion. She sacrificed so much so that I could have the opportunity to advance my
academic career; without her dedication to our family, this achievement would never
have been possible. Finally, I would like to thank my wife, Gloria Hogue, for everything
she does to make our home and to raise our kids. Gloria is the person who makes
everything I do possible. She never looks for or expects accolades, but truth be told, I was
only able to complete this research because of the work she has done to support me.

i
Table of Contents
List of Tables ..................................................................................................................... iv
List of Figures ......................................................................................................................v
Chapter 1: Introduction to the Study ....................................................................................1
Introduction ....................................................................................................................1
Background of the Study ...............................................................................................1
Problem Statement .........................................................................................................2
Purpose of the Study ......................................................................................................4
Nature of the Study ........................................................................................................4
Research Questions and Hypotheses .............................................................................5
Theoretical Base.............................................................................................................6
Definition of Terms........................................................................................................7
Assumptions ...................................................................................................................9
Limitations .....................................................................................................................9
Delimitations ................................................................................................................10
Significance of the Study .............................................................................................10
Summary and Transition ..............................................................................................12
Chapter 2: Literature Review .............................................................................................13
Introduction ..................................................................................................................13
Leadership Styles .........................................................................................................13
Laissez-faire Leadership ....................................................................................... 15
Transactional Leadership ...................................................................................... 18

ii
Transformational Leadership ................................................................................ 21
Applying a Leadership Model to Performance in the Workplace ........................ 25
Virtual Teams...............................................................................................................26
Measuring Leadership and Virtual Team Success ................................................ 29
Competing Ideas and Instruments ......................................................................... 29
Summary ......................................................................................................................31
Chapter 3: Research Method ..............................................................................................33
Introduction ..................................................................................................................33
Research Design and Approach ...................................................................................33
Setting and Sample ......................................................................................................35
Data Collection Methodology ......................................................................................36
Instrument ....................................................................................................................38
Data Analysis ...............................................................................................................40
Informed Consent and Protection of Human Participants ...........................................42
Chapter 4: Results ..............................................................................................................44
Introduction ..................................................................................................................44
Data Collection ............................................................................................................44
Response Rate ..............................................................................................................45
Sample Demographics .................................................................................................46
Descriptive Statistics ....................................................................................................46
Test of Assumptions ....................................................................................................48
Independence of Errors ......................................................................................... 48

iii
Linear Relationship ............................................................................................... 49
Homoscedasticity of Residuals ............................................................................. 51
Multicollinearity ................................................................................................... 52
Normal Distribution .............................................................................................. 53
Evaluation of the Relationship Between Predictor and Criterion Variables................55
Hypothesis Testing.......................................................................................................56
Research Question 1 ............................................................................................. 56
Research Question 2 ............................................................................................. 58
Research Question 3 ............................................................................................. 60
Summary ......................................................................................................................61
Chapter 5: Discussion, Conclusions, and Recommendations ............................................63
Introduction ..................................................................................................................63
Interpretation of the Findings.......................................................................................64
Limitations of the Study...............................................................................................69
Recommendations ........................................................................................................69
Implications..................................................................................................................70
Conclusion ...................................................................................................................71
References ..........................................................................................................................74
Appendix A: Informed Consent Form ...............................................................................84
Appendix B: Survey Demographic Questions ...................................................................87

iv
List of Tables
Table 1. Summary of Multifactor Leadership Questionnaire 5X Response Rate............. 46
Table 2. Descriptive Statistics for Transformational Leadership ..................................... 47
Table 3. Descriptive Statistics for Criterion ..................................................................... 47
Table 4. Assumptions: Independence of Errors ................................................................ 49
Table 5. Assumptions: Correlations and Tolerance .......................................................... 53
Table 6. Assumptions: Normal Distribution (Outliers) .................................................... 53
Table 7. Multiple Linear Regression/R2: Criterion Variables—Extra Effort ................... 57
Table 8. Transformational Leadership and Extra Effort ................................................... 58
Table 9. Multiple Linear Regression/R2: Criterion Variables—Leader Effectiveness ..... 59
Table 10. Transformational Leadership and Perceived Effectiveness .............................. 59
Table 11. Multiple Linear Regression/R2: Criterion Variables—Employee Satisfaction 60
Table 12. Transformational Leadership and Employee Satisfaction ................................ 61

v
List of Figures
Figure 1. Scatterplot: Transformational leadership and extra effort. .................................50
Figure 2. Scatterplot: Transformational leadership and leader effectiveness. ...................50
Figure 3. Scatterplot: Transformational leadership and employee satisfaction. ................51
Figure 4. Assumptions: Homoscedasticity of residuals. ....................................................52
Figure 5. Normal distribution histogram for extra effort. ..................................................54
Figure 6. Normal distribution histogram for leader effectiveness. ....................................55
Figure 7. Normal distribution histogram for employee satisfaction. .................................55

1
Chapter 1: Introduction to the Study
Introduction
Many information technology (IT) organizations have considered virtual teams as
an option to reduce costs while increasing productivity (Meyer, 2011). According to
“Best-Paying Work-At-Home Jobs,” 2011, businesses are planning to hire remote
workers to create a more flexible work environment because of the challenging economic
conditions consequent to the recession of the 2000s. This is especially true for IT teams
that are able to work in different geographic locations, and many organizations are
starting to shift to globalized virtual teams (Nunamaker, Reinig, & Briggs, 2009).
Because virtual teams are becoming more commonplace, there is a need to better
understand the leadership characteristics that contribute to virtual team success (Meyer,
2011). The present research investigated transformational leadership behavior (TLB) and
three characteristics linked to team success: (a) an employee’s willingness to exert extra
effort, (b) an employee’s perception of his or her leader’s effectiveness, and (c) an
employee’s job satisfaction.
Background of the Study
Although there has been an abundance of leadership research on the traditional
workplace, the pending shift to a virtual workforce has called much of the existing body
of knowledge into question, or at the very least has necessitated confirmation that
findings in a traditional work environment are still applicable to the virtual workforce
(Hooijberg, Hunt, & Dodge, 1997). Leaders of a virtual workforce face different team
dynamics than leaders in a traditional work environment. Without daily face-to-face

2
interaction, certain aspects of leading a team, such as building team trust and
cohesiveness, motivating employees, and accomplishing goals, may prove more difficult
(Hooijberg et al., 1997). In fact, Bennis (1985) suggested that traditional forms of
leadership simply do not work in a virtual team environment.
In a virtual environment, leaders have to lead differently, build trust differently,
and reach decisions differently (Meyer, 2011). For example, International Business
Machines Corporation (IBM) has used virtual teams internally for several years and has
been a leader in virtualization technologies (Bruner, 1996). IBM is developing and
enhancing new tools, including virtual conference rooms, technology to share pictures
and videos, and virtual team-building games to improve team interaction, so workers in
different geographic locations can share a somewhat traditional work experience (Bruner,
1996). Technology may make the virtual experience similar to a traditional work
environment; however, at this time, the differences between the work environment for an
onsite worker and a virtual worker are significant (Meyer, 2011). For example, the
“boredom” of plain text messaging and other asynchronous communication is simply not
on par with face-to-face interaction (Yukl, 2002).
Problem Statement
According to the existing body of business research, selecting the right personnel
is important for all businesses and for leaders (Bass, 1998). Equally important is retaining
high-caliber employees, which is a critical factor that leads to team success. In a
traditional workplace, TLB has demonstrated clear ties to employee work effort.
Furthermore, researchers have linked it to employee job satisfaction, and it leads to a

3
belief in the manager’s effectiveness (Bass, 1999; Fjermestad & Hiltz, 1998). The shift
from a traditional workplace to a virtual work environment, however, fundamentally
changes the way leaders and workers interact, and such a significant change in workplace
dynamics cannot be taken for granted (Yukl, 2002).
The strategy of forming virtual teams for IT organizations is becoming
commonplace because of the challenging economic conditions whereby virtual teaming is
a means to save money on travel and reduced office space (Meyer, 2011). Virtual
teaming is supported by various newer technologies that have made virtual teaming more
palatable for workers (Bruner, 1996). Because the number of virtual teams is growing so
quickly, understanding the relationship between leadership styles and successful virtual
teams may have a real and significant social impact (Meyer, 2011).
The rapid rate of change in the IT industry requires the emergence of new leaders
(Alon & Higgins, 2005). Building new leaders in a new, virtualized workplace can be a
significant challenge. In addition to a changing work environment, IT executives will
face a number of other challenges, including global competition, economic constraints,
and increased demands for service and quality (Boyatzis, 2008). A leader needs to have
the right skills and abilities to lead through turbulent times. IT executives are expected to
use innovative and creative techniques to implement new technologies; diminish costs;
and improve strategic alignment of human capital, culture, behavior, and values within an
organization (Barbuto & Burbach, 2006). Though virtual teams are expected to save
money and provide a faster, more flexible workforce, how to identify and employ
successful leadership to manage virtual teams still needs more research (Meyer, 2011).

4
Purpose of the Study
Prior research has shown that transformational leaders demonstrate leadership
behaviors that facilitate both individual and team success (Bass, 1985). Research in the
traditional workplace has suggested that leaders may exhibit multiple different leadership
characteristics. Collectively, these leadership behaviors are classified as transformational,
transactional, or laissez-faire; however, TLBs are directly correlated with improved team
performance (Bass, 1999). Chapter 2 details the existing body of knowledge about
leadership and traditional teams along with the gaps in research as pertaining to virtual
teams. The intent of the present study was to research the relationship between
transformational leadership of IT executive leaders and the work effort, perceived
effectiveness, and job satisfaction of direct report employees working in a virtual team
environment. The results of this study will help recruiters, human resource managers,
industrial–organizational psychologists, executive IT leaders, and employees to
understand the relationship between TLB and team success. With this knowledge,
organizations can make better decisions with regard to hiring, promoting, and training
leaders.
Nature of the Study
The study is quantitative in design and leveraged a correlational design through
the use of an online survey. The target population was obtained through a large IT
organization in the central United States. Participants consisted of male and female
employees and their direct report manager. While employees and their direct report
managers were all actively participating on virtual teams, it was likely that there were

5
differences in the ways their teams interacted. It was a goal of the present research to
include a variety of participants with different virtual team policies. Participation in the
study was voluntary, and participants were required to electronically sign an informed
consent form (Appendix A).
The online survey was distributed to all participants through the IT organization’s
online survey tool. The survey consisted of an informed consent form, demographic
items, and the 45-question Multifactor Leadership Questionnaire (MLQ) 5X (Short
Form) (Bass, 1998). Specific demographic items were also gathered to help describe the
sample. The information included age, gender, tenure with the organization, length of
time working on virtual teams, and time spent reporting to the same direct report leader.
Research Questions and Hypotheses
The research questions for the present study were focused on understanding more
about the nature of the relationship between TLB and virtual teams. The following
research questions and hypotheses guided this study:
RQ1: Is there a relationship between executive transformational leadership
behavior and the work effort of virtual team members who report to the leader?
H01 (null): There is no correlation between executive transformational
leadership behavior and work effort of virtual team members who directly
report to those leaders.
Ha1 (alt): There is a relationship between executive transformational
leadership behavior and the work effort of virtual team members who
directly report to those leaders.

6
RQ2: Is there a relationship between executive transformational leadership
behavior and a team member’s perception of a leader’s effectiveness?
H02 (null): There is no correlation between executive transformational
leadership behavior and employee perceived effectiveness of the direct
report manager to whom employees reports.
Ha2 (alt): There is a relationship between executive transformational
leadership behavior and an employee’s perceived effectiveness of the
direct report manager to whom the employee reports.
RQ3: Is there a relationship between executive transformational leadership
behavior and the job satisfaction of virtual team members who report to the
leader?
H03 (null): There is no correlation between executive transformational
leadership behavior and the job satisfaction of the virtual team members
who directly report to those leaders.
Ha3 (alt): There is a relationship between executive transformational
leadership behavior and job satisfaction of virtual team members who
directly report to those leaders.
Theoretical Base
The theoretical base for the present research, studying leadership style and an
employee’s willingness to exert extra effort, an employee’s perception of the
effectiveness of a leader, and an employee’s job satisfaction, derived from the Avolio and
Bass (1985) model of leadership style findings. Bass (1985) applied theories of
7
transformational leadership to business environments of the time. Researchers perceive
transformational leaders as raising the bar for subordinates’ involvement and overall
drive to achieve more (Bass, 1985). Transformational leaders accomplish this by
expanding subordinates’ interests to go beyond their own self-interests (Bass, 1985). This
shift in an employee’s mind-set should result in extra effort, an improved perception that
the leader is more effective, and a willingness, on behalf of the employee, to exert extra
effort (Bass, 1999).
Virtual teams are becoming much more commonplace (Meyer, 2011).
Transformational leadership has a positive impact on employee job satisfaction,
perceived effectiveness, and willingness to exert extra effort (Bass, 1999), and there is no
reason to expect different results in a virtual team environment; however, the change in
team structure may cause substantial workplace modifications such that the leadership
behaviors that lead to success will be vastly different than the leadership behaviors in a
traditional workplace (Meyer, 2011). When comparing a traditional workplace to the
virtual team environment, the interactions between leaders and subordinates, such as the
methods and modes of communication, feedback, and direction, take substantially
different form (Meyer, 2011).
Definition of Terms
Information technology (IT) organization: Composed of different levels of
management that deal with IT. The senior management, middle management, and highly
skilled executives are all equally important in the IT organization, and all levels of
8
management are expected to be leaders. Highly intellectual persons are the backbone of
the IT industry (Carte, 2006).
Job satisfaction: Employee’s attitude of liking or not liking his or her job (Judge
& Piccolo, 2004).
Laissez-faire leader: A leader who avoids making decisions, abdicates
responsibility, and does not use authority (Turner & Muller, 2005).
Leadership: Influencing others to understand and agree about what needs to be
done and how it can be done effectively. The process of facilitating individual and
collective efforts to accomplish shared objectives (Yukl, 2002).
Perceived leader effectiveness: The direct report employee holds views regarding
the ability of his or her direct line manager to influence up-line managers.
Transactional leader: A leader who takes a conventional, highly structured
approach to employee motivation, tends to point out mistakes, takes action when
employees make mistakes, promises incentives for performance sometimes, does not give
due praise or affirm interpersonal relationships, and relies on systems and rules of
organizations, thereby contrary to the use of emotional intelligence (Conger, 1999).
Transformational leader: A leader who is charismatic, visionary, inspirational,
and intellectually stimulating and who develops followers by creating a direction for
them to follow but allows freedom for followers to control their own behavior (Judge,
2004).
Virtual team: A collection of geographically dispersed team members with
assigned tasks and shared outcomes as part of a larger team (Gibson & Gibbs, 2006).

9
Work effort: Described in the MLQ as the willingness to do more even beyond
self-interest (Bass, 1998).
Assumptions
As the researcher, I assumed that (a) access to the organizational employees
targeted for the study would be provided, (b) a sufficient number of employees would
participate, and (c) participants would be truthful in completing the MLQ.
Limitations
The present study had some limitations. First, the success of virtual teams and
measurement of TLB were based on a single point in time, not over an extended period.
Second, although the research instruments described in this dissertation have been widely
used and have demonstrated acceptable validity and reliability scores (Avolio & Bass,
2004), the study made use of the assumption that no demographic characteristics prevent
understanding or responding to the items on the questionnaires.
The present study has furthered the body of knowledge regarding the relationship
between the predictor, TLB, and three criterion variables: employee job satisfaction,
perceived influence, and willingness to exert extra effort. The research furthers
understanding related to both direction and strength of the relationship between the
predictor and criterion variables. A more complete understanding of transformational
leadership as it relates to virtual teams provides an opportunity to influence social change
as more organizations and employees seek the virtual team structure. By performing the
regression testing outlined, however, there are still limitations, and further research may
be needed outside of the IT field.

10
Delimitations
The current study included some constraints to eliminate bias. The following
delimiters were present for the study:
Participants in the study were within IT infrastructure teams.
Participants in the study were IT professionals.
The population was a single IT organization; all participants had similar job
goals and objectives, and the organizational structure was similar for each
participant.
Significance of the Study
Tough economic times have forced organizations to use virtual teams as a way to
reduce costs and establish a more flexible workforce. Some prior research has suggested
that traditional teams are often more successful than virtual teams (Zakaria, Amelincks,
& Duncan, 2004). A review of the literature, however, suggested that in a traditional
workplace, transformational leadership is the most effective leadership style for
cultivating employees and inspiring them to achieve more (Lowe, Kroek, &
Sivasubramaniam, 1996). Unlike transactional and laissez-faire leadership behaviors,
researchers have linked transformational leadership to organizational success (Avolio &
Bass, 1988; Yukl, 2002).
Despite the mounting body of research, existing literature has demonstrated a
clear gap in knowledge because very few researchers have investigated leadership styles
and their implications for virtual teams. For example, Avolio (1999) investigated the
relationship between life experience and leadership. Barbuto (2000) investigated the

11
relationship between motivation and leadership. Barbuto and Burbach (2006) even linked
the self-report measure of transformational leadership with emotional intelligence. Each
of these studies noted the importance of leadership.
The present study has added considerable information to the body of knowledge
involving virtual teams. As a legitimate alternative to the traditional workplace, virtual
teams offer flexibility to the workforce, and for businesses, virtual teams also provide an
opportunity to recognize savings with the removal of traditional brick-and-mortar office
locations. In part, this is why virtual teams are becoming more common. This research
project has provided significant data for organizations, leaders, and team members
seeking to understand more about building effective virtual teams. The study has also
added to the body of work focused on transformational leadership.
The present study has considered TLB and employee effort, effectiveness, and
satisfaction, which have other benefits that could promote positive social change. First,
for potential leaders of virtual teams, the present study provided some insight into
leadership behaviors that are more likely to result in increased or improved work by
employees. Second, for employers, the present research provided more information that
will allow organizations to develop programs specifically targeted toward leaders who
will have responsibility for virtual teams. The present study investigated the importance
of TLB in the virtual work environment; specifically, this study gathered information
from IT executives and virtual team members, throughout the central United States, of a
large IT consulting company.

12
Summary and Transition
This chapter provided an introduction and statement of the problem. Given the
difficult economic times, organizations are aggressively seeking opportunities to lower
costs and create a more flexible work environment; thus understanding how leadership
styles affect virtual team performance has significant ramifications. The background and
purpose of the study, the study’s significance, key terms and definitions used in the study,
and the assumptions and limitations of the study were all discussed in detail. Ultimately,
the research can influence positive social change for both workers seeking employment
opportunities and employers seeking to get the most out of virtual teams. Chapter 2
reviews the existing literature describing leadership challenges for a virtual workforce
(i.e., transformational leadership and effective leadership for virtual teams). Chapter 3
describes the research methodology, the design of the study, and the sample population,
along with the data collection process and procedure. Chapter 4 reviews the purpose of
the study, and examines the selected research tools. Results are interpreted and
recommendations for next steps are made in Chapter 5.

13
Chapter 2: Literature Review
Introduction
The purpose of this quantitative survey study was to examine the relationship
between transformational leadership and the success of virtual teams in an IT
organization. Research has suggested that leaders of virtual teams demonstrate a variety
of leadership characteristics, based on leadership roles, to facilitate improved team
performance and success of the team (Denison, Hooijbert, & Quinn, 1995). Research has
also suggested that transformational leaders assume multiple leadership characteristics in
an effort to lead high-performance teams (Avolio & Bass, 2004).
This chapter reviews the literature related to transformational leadership and
virtual teams with a focus on literature related to the research questions and the
hypotheses of the study. Online research databases EBSCO and ProQuest were used to
search peer-reviewed journals, books, and websites. A Boolean search combining terms
such as virtual teams, transformational leadership, and team success resulted in
approximately 1,500 references. After a thorough review, many references were not
considered relevant to the present study. Literature that was determined to be important
for the present study was included in the review.
Leadership Styles
Managing successful teams often takes strong leadership (Barbuto & Burbach,
2006). Different strategies can motivate team members and drive successful team
performance (Barbuto, 2000). Leaders understand the value properly managed
subordinates can have in improving production (Bass & Avolio, 1993). In 1939,

14
according to Weber (1947) researchers considered three different leadership styles. The
autocratic leader makes decisions without consulting others. The democratic leader
involves subordinates in the decision-making process. The laissez-faire leader takes a
hands-off approach and minimizes the leader’s involvement in decision making, allowing
subordinates to make independent decisions (Antonakis, Avolio, & Sivasubramaniam,
2003).
Weber’s work in 1947 broke new ground with the idea of charismatic leadership.
His work formed the basis for much of leadership theory over the next 30 years (Burns,
1978). Weber described a charismatic leader as someone with vision and exceptional
leadership qualities, someone people want to follow.
In 1978, Burn’s work on transformational and transactional leadership described
transformational leaders who uplift morale, motivate employees, and are firmly
grounded with morals. Transactional leaders, alternatively, focus on the exchange of
work purely for purposes of self-interest. Burns introduced transformational leadership as
a style of leadership that places an emphasis on followers and their personal values,
connecting the vision to the follower in a personal way. Bass (1985) extended the work
on transformational leadership by identifying the differences between transformational,
transactional, and laissez-faire leadership within the context of personal exchanges.
The description of leadership has changed over time and has grown to include
motivation and inspiration (Avolio & Bass, 2004), influence of team behavior (Barbuto &
Burbach, 2006), and potentially even specific guidance to drive individual results or
project success (Hoyt & Blacovich, 2003). Being a leader requires interactive behavior

15
and the ability to adapt to dynamic work environments to influence followers (Ilies,
Judge, & Wagner, 2006). Leaders need to have the capacity to manage change,
uncertainty, and increased competition within a diverse workforce, and in today’s
business climate, a leader also needs to be comfortable working with teams that may or
may not be in a single geographic location (Panagiotis, 2006). The purpose of the present
study was to evaluate leadership style and its effect on virtual team success.
With this purpose in mind, the MLQ 5X (Avolio & Bass, 2004) instrument is well
suited and was selected for the present study. The MLQ 5X uses the full-range leadership
model of Bass (1990) and is a comprehensive assessment, including 45 items measuring
the full range of leadership styles: laissez-faire, transactional, and transformational
(Avolio & Bass, 2004). The following literature review begins with a discussion of
laissez-faire leadership, followed by reviews of transactional and transformational
leadership styles.
Laissez-faire Leadership
Lewin (1939) described laissez-faire leadership as a style of leadership that lies
between autocratic and democratic leadership styles, whereby the autocratic leader makes
decisions without consulting others. In the case of an autocratic leader, only the leader’s
ideas matter. To ensure that goals are attained, the autocratic leader will use direct orders
and sometimes manipulation. Employees are told what to do and how to do it.
Communication is one way, from leader to follower (Lewin, 1939). Typically,
communication with followers occurs infrequently and sometimes only when a mistake is
made (Daft, 2003). As a by-product of an autocratic leader’s leadership style,

16
absenteeism and turnover are key metrics (Hernez-Broome & Hughes, 2004; Panagiotis,
2006). Although employees often dislike autocratic leadership, there are times when it is
effective, for example, when change is required or when a quick decision must be made
without the luxury of time for feedback or employee input. Under high-stress conditions,
sometimes followers will favor the autocratic leadership style as it can reduce stress on
the followers (Haakonsson, Burton, Obel, & Lauridsen, 2008).
The democratic leadership style allows for followers to be active participants in
the decision-making process; however, the leader still has the final decision-making
power (Rahim, 2006). As a by-product of the democratic style of leadership, employees
often exhibit higher morale and increased sense of teamwork. For higher skilled
employees, the democratic leader is often more respected, and followers buy in to the
team strategy (Boyatzis, 2008). Followers tend to feel more engaged and will typically
participate in decision making that creates a sense of empowerment (Atwater, 1993). At
the wrong time, the democratic leader may be viewed as weak; however, higher skilled
employees will likely exhibit respect toward a leader who gathers input before making a
decision (Antonakis et al., 2003). In some situations, the democratic leadership style has
very specific benefits because usually this style of leadership generates more alternatives
for consideration (Antonakis et al., 2003). The democratic leadership style is not as
controlling as the autocratic leadership style but offers more guidance than the laissez-
faire style of leadership (Boyatzis, 2008).
The laissez-faire leadership style gives followers the ability to make decisions
independently. Laissez-faire almost implies “no leadership” because the leader provides

17
very little and perhaps no direction. In some regard, the laissez-faire style means the
leader avoids responsibilities, is absent, or fails to make decisions (Skogstad, Einarsen,
Torsheim, Aasland, & Hetland, 2007). Goal setting, decision making, or problem
resolution completely falls to the individuals on the team because the leader does not
participate (Northouse, 2001). This style of leadership is especially concerning in a
virtual environment where communication may already be somewhat more challenging.
Laissez-faire leadership is not the same as empowering employees because a
laissez-faire leader does not provide a clear mission. With laissez-faire leaders, tasks are
delegated, and follow-up is the only mechanism to determine of the work was completed
successfully (Lowe et al., 1996). The lack of a clear mission or goal often causes
followers to exhibit higher levels of stress and frustration (Burns, 2003). When teams
experience laissez-faire leadership, they become less productive, deliver fewer results,
and generally become uninspired and out of control (Hartog, van Muijen, & Koopman,
1997). For a team to deliver results, it is important to maintain control so that team
objectives can be met (Northouse, 2001). For virtual teams, guidance, goal alignment,
and sense of mission are important for achieving organizational objectives (Reilly,
Lojeski, & Reilly, 2005).
Although results, or team success, may still be achieved with a laissez-faire
leader, based on individual contributor capabilities, some researchers have suggested that
laissez-faire leadership causes more problems than no leadership (Skogstad, Einarsen,
Torsheim, Aasland, & Hetland, 2007). Human resources and other organizational leaders
need to be aware of the potential negative impact of laissez-faire leadership. Uncertainty

18
about roles and responsibilities leads to additional stress for workers (Judge & Piccolo,
2004). Often the leader is detached from regular, day-to-day operations, and failure to
support subordinates in tough situations can cause resentment among the team (Skogstad
et al., 2007). Laissez-faire leaders assume that followers are motivated to be successful
without any additional guidance from the leader (Eagley, 2003).
In dealing with virtual teams, the laissez-faire leadership style is especially
dangerous because team members can already feel somewhat removed from other team
members, who are not located in the same geographic area. Leaders have the
responsibility to provide direction and communicate goals and objectives (Carte,
Chidambaram, & Becker, 2006). Even with leaders who are engaged, it is not uncommon
for virtual teams to feel separated and detached from the rest of the team (Zhang,
Fjermestad, & Tremaine, 2005). Laissez-faire leadership could increase team members’
frustration from lack of communication.
Transactional Leadership
Transactional leaders create an exchange whereby followers receive rewards for
accomplishing set objectives (Bass, 1999). Leaders understand employees and what
motivates employees, so the rewards are thought to be the only tool for motivation (Bono
& Judge, 2004). In some cases, leaders use money, wages, and bonuses as the primary
incentives to motivate employees (El-Meligi, 2005). For transactional leaders, achieving
set goals can be achieved through this simple reward system (El-Meligi, 2005). Leaders
offer pay incentives to achieve goals; however, followers are rarely inspired to do more
than simply achieve the goal, and they are certainly not inspired to seek creative solutions

19
to do more than is expected. Sometimes transactional leaders will understand that to
achieve strategic goals, a change in strategy may be required; however, it is
uncharacteristic for a transactional leader to place a priority on the personal development
of followers (Bass, 1990). Failure to acknowledge employees’ personal development
requirements and the lack of meaningful incentives do nothing to grow team chemistry.
If, however, incentives are set appropriately, team members may do more in an effort to
achieve set goals (Jung, Chow, & Wu, 2003).
Although it is common for transactional leaders to provide positive incentives to
encourage employees to achieve team goals, incentives are not the only way to practice
leadership (Jung, Chow, & Wu, 2003). Conversely, leaders may seek to punish undesired
behavior. For example, when performance targets are achieved, the transactional leader
may provide financial incentives (Barbuto & Burbach, 2006). When performance targets
are missed, negative reinforcements, such as disciplinary actions, may be taken (Barbuto
& Burbach, 2006). Because transactional leadership is an exchange process with
followers, the relationship requires more discussion (Wren, 1995). A considerable
amount of research has focused on leaders, followers, and the relationship between them
(Askarany, Smith, & Yazdifar, 2007). Leader–member exchange theories begin with the
idea that leaders and followers form a distinctive relationship within an organization
(Askarany, Smith, & Yazdifar, 2007). According to the leader–follower theories, it would
make sense for leaders to have a strong relationship with some team members and less
strong relationships with others (Askarany, Smith, & Yazdifar, 2007). The leader–

20
member exchange theories consider leadership as nothing more than a series of
interactions between leaders and followers (Hooijberg et al., 1997).
Graen and Uhl-Bien (1995) posited that leaders behave differently toward
individual followers. Graen (1976) suggested followers could be categorized as
belonging to either an in-group or an out-group, depending on the quality of the
relationship between leader and follower. In-group followers have a very positive
relationship demonstrating trust and respect, whereas the out-group relationship has a
much more formal work or job description basis (Jung et al., 2003). The leader–member
exchange theory says that a leader, when talking to a follower, uses different
communication avenues based on the in-group or out-group status of the follower (Jung
et al., 2003). In addition to different communication tools, leader–member theory also
puts forth the idea that in-group team members will have higher quality, more personal
communications with the leader, thus reporting two-way communication, in contrast to
the one-way communication that out-group employees describe (Chang & Lin, 2008).
According to Yukl (2002), better communication is more likely when the leader
perceives the follower as capable and trustworthy (Yukl, 2002). The quality of the
leader–worker relationship has a direct impact on the quality of work the follower
performs (Bass, 1990). Transactional leaders motivate employees through incentives or
disincentives, but often the arrangement is mutually beneficial, and both leader and
follower achieve success through delivery of results (Judge & Piccolo, 2004). If the
leader does not have the resources to provide the proper incentives to achieve a goal, then
this type of leader is likely to have significant problems motivating employees (Avolio &
21
Bass, 1995). The negative reinforcement of policies results in a much different
relationship between leader and follower because punishment is perceived much more
negatively (Avolio & Bass, 2004). Negative reinforcement will cause employees to work
just hard enough to avoid the negative response, and this approach will almost never
result in the employee exerting maximum effort (Yukl, 2002). In a virtual work
environment, transactional leadership poses several challenges because the lack of one-
on-one attention requires workers to be more self-motivated (Solansky, 2008).
Transformational Leadership
Bass (1990) compared and contrasted transformational leaders with transactional
leaders. He considered a transformational leader to be someone who could transform an
organization and seek ways to further the relationship with followers beyond merely self-
interest. Conversely, Bass (1990), suggested the transactional leader would focus on self-
interest. In other words, the transformational leader has more than self-interest at stake:
What is good for the organization will ultimately be better for both the leader and the
follower (Tucker et al., 2004). This difference is significant because the transformational
leader seeks to inspire employees to look beyond mere self-interest and see the bigger
picture.
By comparison, transactional leaders do not seek to inspire beyond self-interests,
which limits team building and creativity (Bass, 1990). The transformational leader seeks
to change the organizational culture, whereas the transactional leader simply looks to
operate within the existing guidelines (Avolio & Bass, 1995). Transformational leaders
use more than simple rewards to motivate (Avolio & Bass, 1995). Transformational

22
leaders motivate through personal leadership, inspiring employee effort, intellectual
stimulation, and individual consideration (Askarany et al., 2007). Both transformational
and transactional leaders strive to achieve set goals; however, the transformational leader
places a greater emphasis on organizational impact (Avolio & Bass, 1999, 2004).
Transformational leaders are uplifting and motivational, and they drive a higher moral
incentive for team members (Burns, 1978). Transactional leaders give orders to achieve
success. Transformational leaders sell ideas and believe in the team’s ability to achieve
success (Riketta, 2008).
Burns (1978) introduced transformational leadership as a model where change
leaders help motivate and incentivize followers. Transformational leadership requires
perceptual changes of the follower regarding the importance of the team or organization,
not just self-interest (Barbuto, 2000). Transformational leadership requires a wide range
of leadership characteristics (Northouse, 2001). Bass (1995) extended the construct of
transformational leadership by explaining how leaders have higher quality relationships
with followers when compared to transformational leaders. According to most research,
transformational leadership comprises four interrelated components: idealized influence,
inspirational motivation, intellectual stimulation, and individualized consideration.
Starting with Bass’s (1997) research, certain aspects of transformational
leadership are clearly linked to team success, including, as posited in the present study,
the success of virtual teams. First, idealized influence suggests that transformational
leaders have followers who trust and respect them, and as a result, these leaders have
much more influence over followers (Boyatzis, 2008). Followers develop a belief in their

23
leader and identify with both the leader and the stated mission. Next, inspirational
motivation requires the leader to communicate a clear and precise plan of action
(Boyatzis, 2008). With clear objectives, followers can help the team succeed with or
without idealized influence (Turner & Muller, 2005). Intellectual stimulation provides an
outlet for followers to be creative, challenge ideas, and seek out better alternatives.
Individualized consideration is an outgrowth of Burns’s (1978) work and suggests that a
leader should understand individual worker characteristics to identify ways to make each
individual contribute to team success (Avolio & Bass, 2004).
Other forms of leadership also identify that individual consideration is important
(Boyatzis, 2008). Transformational leaders, however, have a vision about how things can
work better. Like the earlier charismatic leadership theories, a leader can communicate to
workers through exuberance and excitement to inspire followers to join in making the
vision possible (Turner & Muller, 2005). Multiple researchers have verified that
transformational leaders have a very positive effect on traditional face-to-face workers
(Ilies et al., 2006). By promoting a vision and a belief in a mission, transformational
leaders build individual and team commitment to cause, a belief in the team, and a desire
to see the team or organization succeed (Chen, Beck, & Amos, 2005). A transformational
leader recognizes the capacity of followers to be successful and achieves employee
motivation through satisfaction of a “higher need” (Burns, 1978).
Transformational leaders understand followers’ motives and leverage this
understanding to achieve successful outcomes (Burns, 1978). Transformational leaders
create a vision and build consensus based on ethical or moral implications often
24
transcending self-interest (Avolio & Yammarino, 2002; Block, 2003; Dulewicz, 2005).
Ethics and morals play a central role in Burns’s (1978) original theory. Bass (1990)
extended Burns’s (1978) work by focusing on the follower more so than the leader. Bass
(1990) outlined a new possibility that leaders could be both transformational and
transactional based on the situation. Transactional leadership can get the job done, but
transformational leaders motivate followers to do more, to achieve more (Antonakis et
al., 2003; Bass, 1997; Bass & Avolio, 1990). Transformational leaders are more likely to
enable change and drive changes in a follower’s belief system (Avolio & Bass, 2004;
Avolio & Yammarino, 2002). Among Avolio and Bass’s (2004) four components of
transformational leadership (i.e., inspirational motivation, idealized influence,
individualized consideration, and intellectual stimulation), the question is which
management style, or, more precisely, which characteristics within the management style,
are more effective in a virtual environment (Boyatzis, 2008; Crossley, Bennett, Jex, &
Burnfield, 2007).
Charisma is one of the top characteristics described in the transformational
leadership model. From the earliest days, people believed charismatic leaders had a gift
from the gods (Atwater, 1993). Because it is considered a trait of successful leaders,
many researchers have investigated charisma (Conger, 1999). Weber (1947) provided the
germinal research around charisma as a characteristic of leadership. Charisma clearly
delineates leaders from followers. In fact, the characteristics of a charismatic leader
almost seemed divine in nature, as leaders demonstrated exceptional capabilities to lead
with supreme confidence (Weber, 1947). House (1977) described leaders as moral

25
leaders who lead with vision, conviction, and personal belief. In later research,
charismatic leaders were described by unconventional, visionary, and often risk-taking
behavior (Barbuto, 2000). The ability to lead in times of change and express visionary
attributes almost causes people to follow without question (Hoyt & Blacovich, 2003).
Bass (1997) considered charisma, along with other personality traits, to enable a leader to
inspire and motivate followers (Solansky, 2008). Charisma is an essential aspect of
leadership in the transformational leadership model, and vision is perhaps the most
important consideration (Barbuto & Burbach, 2006).
Conger (1999) discussed the ability of a leader to create a shared vision for
followers whereby the followers completely buy in to the idea of the future goal. A
leader’s ability to articulate and show passion for a future goal is connected to followers’
acceptance of a shared goal (Dulewicz, 2005. The leader’s actions are based on the
individual traits but are summarized by the dedication to a vision (Dickson & Lorenz,
2009). Conger (1999) suggested that a leader’s charisma is directly related to the
dedication of followers trying to achieve the shared goals. However, it should be
understood that the idea of a charismatic leader is not without controversy.
Applying a Leadership Model to Performance in the Workplace
In 1985, Bass discovered that transformational leadership contributes to
predicting certain outcomes with respect to individual employees and team performance.
In particular, Bass recognized that leadership behavior can be used to predict employee
satisfaction, willingness to exert extra effort, and perceived effectiveness (see also Bass
& Avolio, 1995). According to Bass (1985), in the full range of leadership models,

26
positive organizational outcomes can consistently be linked to transformational
leadership. Subsequent research has supported and furthered findings that associate
transformational leadership with positive business results (Barling, J., Slater, F., & Kevin
Kelloway, E., 2000). In fact, organizational success and success of direct report
employees are not limited to a single field or type of organization; rather, performance is
tied to leadership behavior where the leader articulates a vision and demonstrates that
performance is about more than just individual goals and instead about the greater good
(Bass, 1998; Avolio & Bass, 1998). Finally, Bass (1995 suggested that transformational
leaders are highly correlated with reduced turnover, higher employee satisfaction, and
increased productivity. The concept, then, is simple: Through charismatic leadership that
influences followers to raise the bar, become better team contributors, and exert extra
effort, team performance will improve (Bass, 1985).
Virtual Teams
In a face-to-face environment, a charismatic person has the ability to work the
room, interacting with individuals and providing feedback that inspires personal
investment among the participants (Hoyt & Blacovich, 2003). In a virtual environment, it
is less clear whether transformational leadership will have the same effect. Some research
has determined that the quality of relationships among members of a successful team is
not at all clear (Carless, Wearing, & Mann, 2000). Yukl (2002) asserted that virtual teams
would continue to become more important as they have the potential to generate more
innovative solutions to problems and ultimately spark greater productivity and creativity.
If the primary characteristics of a transformational leader are tied to his or her ability to
27
express a vision or demonstrate charismatic traits, there is a legitimate question whether
these characteristics are applicable in the growing virtual environments of many
contemporary IT organizations (Anderson, 1998; Crawford, Gould, & Scott, 2003).
Although many virtual teams will adopt technology that allows team members to see one
another face-to-face, most commonly, communication through e-mail, instant messaging,
or telephone is the norm, and these will not provide the same visual cues that Malhotra,
Majchrzak, and Benson (2007) describe. Without important queues such as body
movement, facial expressions, and hand gestures, interpretation of a follower’s feedback
to communication becomes increasingly difficult (Gibson & Gibbs, 2006).
The global economy has changed the way corporations conduct business (Yukl,
2002). According to Sussan and Johnson (2007), emerging technologies will enable
virtual teams to become much more prevalent. Many organizations, such as Microsoft,
IBM, and HP, have instituted home offices for many employees, and many times these
employees must work together across geographic and cultural boundaries using various
computer technologies. The virtual teams enable cost reductions for travel, housing, and
office space, along with other expenses typically covered in an office environment
(Cromb, 2005). Malhotra et al. (2007) identified the necessity for virtual teams to work
across geographical and cultural boundaries because of the potential cost savings and
increase in productivity but further suggested that leadership is a critical factor in the
success of these virtual teams.
The 2006 research by Gibson and Gibbs, determined a supportive environment
must include the ability to communicate effectively and strengthen social connections

28
within a team. Creating a work environment that fosters team success and communication
between leader and follower is important to the cohesiveness of virtual teams (Gibson &
Gibbs, 2006).
With challenges in communication, Malhotra et al. (2007) also suggested that
there may be an issue with trust. The leader–follower relationship is essential for a
charismatic–transformational leader (Lockwood, 2010). Interestingly, in 2003, Elmuti
conducted a study focused on virtual teams using the Internet as the primary mode of
communication (Eberlin & Tatum, 2008). The teams were extensively trained on how to
use the communication technologies, and they were, in fact, successful (Hoyt &
Blacovich, 2003). Given advances in technology since the early 2000s, technology and
communication practices such as instant messaging, text messaging, e-mail, and VoIP
and video chatting are much more common. Eventually, these technological innovations
may enable traditional leader–follower relationships to develop; however, today, a variety
of challenges inhibit performance and the relationship between a leader and follower,
thus influencing virtual team success (Gibson & Gibbs, 2006).
For virtual team success to be realized, a clear mission is critical (Gareis, 2006).
Because of challenges with communication, research demonstrates that small problems
may soon spin out of control (Gareis, 2006). Without face-to-face communication
problems, a virtual team is likely to be successful (Sobel-Lojeski & Reilly, 2007).
Leaders of virtual teams must deal with a variety of challenges, and in a virtual
environment, demands on leadership become more complicated (Hooijberg et al., 1997).
29
Culture differences are perhaps the most critical challenges facing leaders of a
virtual team. Culture differences include customs, values, and perceptions that an
individual acquires through life experiences (Cromb, 2005). Because the present research
does not include teams outside of the United States, this particular challenge is not
addressed. For future research, however, cross-cultural differences should certainly be
considered.
Measuring Leadership and Virtual Team Success
As Block (2003) described, virtual teams are different from traditional teams.
However, some researchers have suggested that leadership in a virtual environment is no
different from leadership in a traditional environment (Emery & Barker, 2007);
conversely, still others have reported that the existing body of knowledge does not
sufficiently cover the complexities of a virtual work environment (Cromb, 2005). In
particular, because of the specific technical challenges with communication and team
building that the virtual environment engenders, it is unclear if the charismatic or
transformational leader will be as successful in a virtual environment as he or she is in a
traditional environment, or if one of the other management styles, transactional or laissez-
faire, might be a better match (Cohen, 1990; Galup, Klein, & Jiang, 2008). Much of the
existing body of knowledge focuses on the relationship of team members within the
virtual team instead of on the specific style of leadership (Zhu & Kraemer, 2005).
Competing Ideas and Instruments
Some researchers have identified that charismatic leaders tend to believe their
followers are capable of achieving shared goals and that it is this belief along with

30
empowering actions that lead to success (Chen, 2004). By taking the focus away from the
leader and instead focusing on the behavior characteristics that empower employees,
some researchers reject the idea of charismatic leadership (Page & Vella-Brodrick, 2009).
In fact, along with the idea that leadership style is less important than enabling
employees, charismatic leadership may be viewed as quite a negative phenomenon, one
responsible for various cults and other behaviors driven by a leader’s own desire for
power (Block, 2003).
The alternate ideas are in direct contrast with the majority of the research
available, in which charismatic leaders are considered visionary, self-confident, and truly
motivational (Conger, 1999). A charismatic or transformational leader will inspire
followers and is genuinely interested in their success, and it is this leader’s focus on
followers that encourages them to be creative and achieve results (Antonakis & House,
2002; Garcie-Serrano, 2009). The leader–follower relationship is essential to team
success because followers identify with the leader’s vision, shared goals, and direction
(Solansky, 2008). Just as there are different ideas about leadership style, there are also
different tools to measure leadership.
Since Burns’s (1978) creation of the notions of transactional and transformational
leadership, many other researchers have developed instruments to measure leadership
behaviors (Avolio & Bass, 2004). By a wide margin, the most used instrument for
measuring transformational leadership is Bass’s MLQ (Alon & Higgins, 2005). The
MLQ has been updated several times since its initial publication, and it has demonstrated
the highest levels of validity and reliability (Northouse, 2001). The MLQ has been

31
repeatedly demonstrated to be both valid and reliable in two forms: as a self-report
measure and when taken by followers to measure a leader’s behavior (Howell & Higgins,
1990).
There are alternatives to selecting the MLQ, for example, the Leadership
Behavior Questionnaire (LBQ; Sashkin & Burke, 1990). The MLQ itself has other forms.
The MLQ 6S is a 21-item survey, but it demonstrates a lower validity than the MLQ 5X
used in this study (Northouse, 2001). The MLQ 6S has consequently not been used in
nearly as many studies as its 5X counterpart. Additionally, the 6S is a self-assessment-
only version of the survey.
Summary
The literature review has provided a thorough discussion of relevant literature for
the present study. At points throughout the literature review, references to the present
study were made to illustrate the connection between existing literature and the
theoretical foundation of the current work. Understanding leadership and gaining some
further knowledge about the relationship between leadership and the performance of
virtual teams will provide a foundation for future research.
According to a review of existing literature, a gradual transition from the 1947
work of Weber’s charismatic leadership theories, expanded by Burns exploration in 1978,
culminated in groundbreaking research with Bass’s (1990) work that not only formulated
the theories on transformational leadership, but also provided a foundation for measuring
different leadership behaviors. Using proven instruments like the MLQ, TLB is most
commonly tied to higher performing teams where leaders understand the motives of

32
followers and leverage that understanding to achieve successful outcomes (Burns, 1978).
Transformational leaders create a vision and build consensus based on ethical or moral
implications often transcending self-interest (Avolio & Yammarino, 2002; Block, 2003;
Dulewicz, 2005).
A review of the available literature demonstrates a clear gap in research
surrounding leadership styles and virtual teams. The lack of attention to leadership
behaviors and the virtual workforce is relevant because of the increasing demand for
geographically dispersed workers. The current study has attempted to fill this gap in the
literature through the use of the MLQ 5X, where the relationship between leadership
behaviors and team performance can be evaluated.
Chapter 3 outlines the method of inquiry for the present study. The research
model for the study, introduced in chapter 1, is discussed, and a methodology for testing
the hypotheses is developed. In addition to laying out the methodology, the next chapter
includes a discussion on data analysis, survey administration, sampling technique, and the
security procedures for confidentiality. Chapter 4 reviews the purpose of the study,
outlines data collection methods, and examines the selected research tools. Results are
interpreted and recommendations for next steps are made in Chapter 5.

33
Chapter 3: Research Method
Introduction
The purpose of this study was to perform a quantitative analysis of the
relationship between TLB and the effort, effectiveness, and satisfaction of direct report
employees in a virtual work environment. Initially, I expected previous findings
regarding the relationship between TLB and each of the measures of direct report
performance in traditional work environments to hold true in a virtual team environment.
The present research evaluated TLBs, and each of the measures of direct report
performance as well as the strength and directionality of the relationship were assessed.
Some researchers might be tempted simply to apply findings from a traditional workplace
to those employees in a virtual environment, but to date, there has been no evidence that
transformational leadership has the same impact in a virtual workplace (Cromb, 2005).
An explanation of the study’s design and methods and an examination of the population,
sampling procedure, and measurement process are presented, along with the process used
to select the instrumentation and a detailed discussion regarding this instrumentation. The
collection and analysis of data are discussed, and finally, the ethical considerations for
the present study are outlined.
Research Design and Approach
The present research explored the relationship between transformational
leadership and the effort, effectiveness, and satisfaction of virtual team members in an IT
organization. A multiple regression analysis evaluated leadership behavior, various
demographic characteristics, and each of the outcome variables associated with strong

34
team performance. Because there has been substantial research in a traditional workplace,
but limited research regarding transformational leadership in a virtual team environment,
this approach was appropriate (Cronbach, 1951; Newman & Rudestam, 1999).
Furthermore, the present research provided a foundation to understanding and improving
the performance of organizations, leaders, and team members who work in a virtual
environment. In the present research, understanding the relationship between leaders and
followers in a virtual workplace was extremely complex. The goal was to better
understand the nature of the relationship between leadership style and various
performance measures linked to team success.
For the present study, transformational leadership as defined by Avolio and Bass
(2004) was the predictor. The criterion, performance characteristics, was measured by
evaluating self-rated measures for extra effort, leader effectiveness, and job satisfaction
from the MLQ survey. The study’s predictor was transformational leadership as defined
and measured in the MLQ 5X. As noted earlier, the study’s criterion was a measure of
employee response to the leadership behavior, measured as extra effort, leadership
effectiveness, and employee job satisfaction (Barbuto & Burbach, 2006).
Data were collected using the MLQ 5X. The MLQ 5X form was selected because
of wide acceptance to accurately measure TLB (Block, 2003). Transformational
leadership as measured by five subscales—idealized influence (attributed), idealized
influence (behavior), inspirational motivation, intellectual stimulation, and individualized
consideration—was evaluated along with three measures for team success: effort,
perceived effectiveness, and job satisfaction. The predictor, transformational leadership,
35
was calculated by combining the score from each of the five subscales into a single mean
transformational leadership score. Using the transformational leadership mean scores, a
multiple linear regression analysis was conducted on each of the criteria (extra effort,
perceived effectiveness, and employee satisfaction) with transformational leadership as
the predictor so that each hypothesis could be accepted or rejected based on the findings.
Demographic controls for gender, age, ethnicity, education, relationship status,
employment duration, length of time reporting to supervisor, and team size were entered
into the first step of the regression analysis.
Setting and Sample
Individuals participating in the present study were all employees of the same IT
organization with a total population of 1,200 employees. The IT executive leadership
team comprised 41 individuals, and their direct report employees, the virtual team
members, comprised another 396 IT professionals. The direct report employees reported
to a leader with the title of senior director, area director, or vice president. The
participating individuals came from a variety of teams; however, all participants operated
within the IT department of the company. Each individual provided a release form
allowing the use of test scores for purposes of this research. Participants were selected for
reasons of (a) accessibility and (b) being of legal age to provide informed consent.
Sampling in the present study was based on employee agreement to participate.
The available pool of participants was reasonably large (N = 396). Based on the criteria
for participating in the study, the entire population of IT professionals was eligible to
participate. To determine the sample required for the present study, I used a .05 level of

36
significance with a .95 level of confidence, which is common for quantitative studies in
psychological research (Antonakis & House, 2002; Chang & Lin, 2008). For preliminary
power analysis, I used G* Power 3.1, a free software download for power analysis, to
determine the approximate sample size required to achieve the desired results for the
present study. To achieve a significance level of .05 and to detect an effect size of .30
with a power of .95, the present study required a sample of at least 134 participants.
Based on historical information provided by the organization, it was expected that the
dropout rate would be around 20%. Dropout of some participants can be expected
because of vacation, sick time, and employment termination during the course of the
study.
Data Collection Methodology
The human resources department of the participating organization provided
participant contact information. A total 396 prospective respondents were contacted via
e-mail. An initial e-mail provided a link to the participation form (Appendix A). A
second e-mail was sent to those who agreed to participate that provided a link to the
Web-based demographic survey (Appendix B) and MLQ 5X survey. All participants
completed a consent form, and agreement to participate was indicated to be implicit by
the completion of the survey (Appendix A). The MLQ survey was available for 1 month
from the date of the introductory e-mail.
To collect data and measure the variables, the 45-item MLQ 5X was used because
it has been demonstrated to be both valid and reliable for measuring transformational
leadership and characteristics that lead to team success (Bass & Avolio, 1995). More

37
specifically, the electronic version of the survey was used primarily because of logistics,
cost, and ease of administration. All participants in this study were working in a virtual
work environment, mostly from home. With few exceptions, exact work locations were
not disclosed. The organization does not use corporate e-mail for communications. As a
result, it was simpler and more cost-effective to deliver this survey through the Web.
Furthermore, electronic communication was preferred for interacting with participants
because all participants were keenly aware of the technology required to participate,
owing to the nature of their work (Brown, Metz, Cregan, & Kulik, 2007).
Each week a reminder e-mails was sent to potential participants until the final
survey closure date. After the closure date, no further responses were considered, and all
valid responses were reviewed. Any duplicate, incomplete, or missing responses would
have been identified and documented; however, all responses for the survey were
completed in full and thus considered usable. The entire data collection cycle took 4
weeks, and 319 responses were recorded. Upon completion of the survey administration,
data were transferred to an encrypted drive for analysis. If fewer than 134 participants
had responded, the survey would have been reopened with the same process so that
additional data could have been collected.
All participants in this study were working in a virtual work environment, most
from home. The organization’s policy did not allow for use of corporate e-mail for
communications such as this research. As a result, it was simpler and more cost-effective
to deliver this survey through the Web. Furthermore, given the focus of this research on
virtual teams, electronic communication was preferred for interacting with the

38
participants because all participants were keenly aware of the technology required to
participate (Brown et al., 2007).
Instrument
The present study attempted to investigate the relationship between TLB and the
success of virtual teams in an IT organization. For this purpose, no other instrument has
demonstrated the level of reliability and validity that the MLQ has. Out of 45 questions,
20 items focused on transformational leadership. The subcomponents and questions are
broken down as follows: attributed idealized influence (4), behavior idealized influence
(4), inspirational motivations (4), intellectual stimulation (4), and individualized
consideration (4). Nine items focused on the criteria extra effort (3), effectiveness (4),
and satisfaction (2).
Leadership data were gathered by administering the MLQ 5X. As outlined in the
literature review, the MLQ 5X is based on a long history of leadership research,
culminating with the 2002 Avolio and Bass construct. The current leadership model has
been shown to be one of the most reliable instruments for measuring TLB (Antonakis et
al., 2003). Participants rated their direct report leaders on all 45 items on a 5-point Likert
scale ranging from 0 (not at all) to 4 (frequently, if not always). The TLB responses for
each subscale were averaged to score the MLQ. The transformational leadership scale
consisted of idealized attributes, idealized behaviors, inspirational motivation, intellectual
stimulation, and individual consideration.
The MLQ 5X leverages three leadership behavior styles: transformational,
transactional, and laissez-faire. For purposes of the present study, only the

39
transformational leadership style was of interest. Unfortunately, many other research
projects have attempted to use the MLQ in a self-report form; however, this method of
testing has caused suspicious results. The primary weakness of self-report tests remains
the same: In a self-report test, perceived behavior, or, in some cases, behavior perceived
to be desirable, may be reported instead of actual behavior. For instance, in a self-report
test, a leader may believe that he or she provides employees with intellectual stimulation
and thus answer the question affirmatively. However, the direct report employees of the
leader may have a different perspective. Self-report tests cannot be said to measure actual
behavior but rather the individual’s perceived behavior. For that reason, the present study
utilized the MLQ 5X, where the employees rate the leader’s actual behavior.
There are a number of potential risks for researchers conducting quantitative data
analysis (Lowe et al., 1996). Issues with reliability, for example, are concerned with
whether the instrument scores accurately each time it is administered. Validity concerns
whether the instrument measures the variable that needs to be measured. Avolio and Bass
(2004) reported that the MLQ achieves .76 to .92 for reliability measures, and subsequent
research has supported the general reliability of the instrument (Creswell, 2003). The
same is true for validity, where Avolio and Bass (2004) showed Cronbach’s alpha
ranging from .74 to .94, once again substantiated by Creswell (2003). At the heart of the
discussion, reliability and validity are essential for research projects because they allow
for researchers to identify accurate conclusions from data due to some factors controlled
by the study (Graen & Uhl-Bien, 1995). The researcher took special care to select an

40
instrument that provided adequate reliability and validity measures. The MLQ was the
most widely accepted instrument for measuring TLB.
To collect data and measure the variables, the 45-item MLQ 5X was used because
it has been demonstrated to be both valid and reliable for measuring transformational
leadership and characteristics that lead to team success (Bass & Avolio, 2004). The
transformational leadership and measures of increased effort, effectiveness, and job
satisfaction were reported. The survey was distributed via the Web. The MLQ contained
45 items that served to identify and measure TLBs and three measures of leadership
effectiveness (Avolio & Bass, 2004). The leadership styles measured by the MLQ
included transformational, transactional, and laissez-faire. The MLQ was used to measure
the predictor, leadership style, and the criterion variables, extra effort, perceived
effectiveness, and employee satisfaction. The MLQ factors were rated on a 5-point Likert
scale ranging from 0 (not at all) to 4 (frequently, if not always). For each question,
participants selected one answer, and the results were calculated by averaging the scores
for each item. Higher scores on a leadership style indicated the tendency to exhibit the
associated leadership behaviors.
Data Analysis
Data have been protected in accordance with the Walden University IRB
requirements. Data collection focused on the questions and hypotheses described in the
first chapter. Both Microsoft Excel and Statistical Package for Social Sciences (SPSS)
21.0 were used to calculate and analyze the raw data. The data from the MLQ survey
were analyzed to determine the type of leadership behaviors virtual team members have

41
observed from their IT leaders. In addition, each team member rated his or her own
perception about the leader’s ability to inspire extra effort, manage effectively, and
improve employee job satisfaction.
Transformational leadership, as measured by five subscales—idealized influence
(attributed), idealized influence (behavior), inspirational motivation, intellectual
stimulation, and individualized consideration—was evaluated along with three measures
for team success: effort, perceived effectiveness, and job satisfaction. The predictor,
transformational leadership, was described by evaluating each of the five subscales and,
in this case, combining the subcomponents to estimate the total impact of TLBs. A linear
regression analysis was then conducted on each of the criteria (extra effort, perceived
effectiveness, and employee satisfaction) with transformational leadership as the
predictor so that each hypothesis could be accepted or rejected based on the findings.
Demographic controls were entered into the first step of the regression analyses.
Prior research has indicated that a relationship between TLB and team success is
very strong (Tucker, 2004). The question, however, has had minimal investigation to
confirm the existence of a relationship for virtual teams and their leadership. As such, the
hypotheses for the present study were exploratory in nature. The present study measured
transformational leadership based on actual behavior, not based on an individual’s self-
rated perception of leadership behavior.
The MLQ was selected as the instrument for the present research and was scored
by averaging the TLB responses. Each response was rated on a 5-point Likert scale
ranging from 0 (not at all) to 4 (frequently, if not always). The transformational
42
leadership scale consisted of five areas: idealized attributes, idealized behaviors,
inspirational motivation, intellectual stimulation, and individual consideration. The
combined mean scores for each of the five subcomponents were tallied to measure the
overall mean score for TLB.
Next, the scores for the three criterion variables were considered. Based on the
responses from the MLQ, participants had a score for job satisfaction, perceived
influence of their direct report manager, and willingness to exert extra effort. To test the
three hypotheses identified in chapter 1, the data were evaluated through multiple
regression analyses to determine the variance explained by TLB. Based on the
hypotheses outlined in chapter 1, the present research expected data to represent a strong
positive correlation between TLB and each of the criterion measures. That is, results from
regression analyses were expected to show that TLB would account for a significant
portion of the variance in employee levels of job satisfaction, willingness to exert extra
effort, and perceived influence of the leader.
Informed Consent and Protection of Human Participants
An informed consent form was provided for each participant via the Web-based
delivery forum. The informed consent page informed participants of the voluntary nature
of the study. The electronic submission of the survey was considered consent to
participate in the study. All responses were anonymous. To protect participant
confidentiality, no surveys were shared with the company for which the respondents
worked. No personal data were requested or stored with survey responses. No anticipated
risks were associated with participating in the present study.

43
The consent form included background information for the study, procedures for
participation, confidentiality requirements, the voluntary nature of the study, and ethical
considerations. A copy of the consent form is provided in Appendix A. My e-mail
address and phone number were provided so participants could submit any additional
questions or concerns.
Once an individual agreed to the terms of participation, the online testing began.
A brief demographic form requested information such as gender, age, education, and
ethnicity. A copy of the demographic questionnaire is provided in Appendix B. After
submitting the demographic information, the participant moved on to take the MLQ.
The proposed research methodology has been reviewed along with the design of
the study. Chapter 3 has provided needed details for the sample population and
concerning the data collection process and procedure. Chapter 4 reviews the purpose of
the study, outlines data collection results, and examines the data by using the selected
research tools. Chapter 5 includes an interpretation of results and makes
recommendations for future research.

44
Chapter 4: Results
Introduction
In a large IT organization, leadership characteristics and the impact on direct
report employees were evaluated to examine the influence on employee satisfaction,
willingness to exert extra effort, and perception of the leader’s effectiveness. The
leadership theories used as a theoretical framework for this study were based on Avolio
and Bass’s (2004) leadership model, which examines leadership styles ranging from
passive, laissez-faire leadership to the charismatic leadership style classified as
transformational leadership. This chapter presents an analysis of the findings. Chapter 1
introduced the study, including the purpose of the study and key terms. Chapter 2
included a review of the relevant literature for this study. Chapter 3 contained a
description of the methodology that was used in the study. This chapter presents the data
gathered using the methodology detailed in Chapter 3. To begin, the data collection
methods are outlined. Next, the selected research tools are examined, data analysis is
discussed, and findings are presented.
Data Collection
After receiving approval from Walden University’s IRB, I contacted the research
partner to begin the survey process. The participating organization’s human resources
department provided participant contact information. The criteria for participation in the
present research project were as follows: First, each employee reported to a senior IT
leader, and second, he or she needed to be working as a member of a virtual team.
Prospective respondents were contacted via e-mail by their human resources department.

45
The Web-based survey was distributed to 319 company employees. All participants were
in the IT organization and reported directly to a director, area director, or vice president.
The participants evaluated leadership behaviors of the leader to which they reported
along with the necessary demographic information required for this research. The initial
e-mail provided a link to the participation form (Appendix A). Following the introductory
e-mail, a second e-mail was sent to provide a link to the demographic survey (Appendix
B) and the MLQ survey online. All participants acknowledged consent, and agreement to
participate was implicit in the completion of the survey. The MLQ survey was available
for 1 month from the date of the introductory e-mail. The Walden University IRB
approved using the MLQ.
Response Rate
The MLQ 5X was distributed as a self-administered survey to a selection of
employees of a large U.S.-based IT organization. The organization distributed the
invitation to participate in the survey to all of its IT employees. For every leader, a unique
link was provided. A total of 319 surveys were returned, corresponding with 41 different
leaders. Table 1 presents a summary of the response rates. I reviewed, coded, and entered
the data into a Microsoft Excel spreadsheet and SPSS 21.0 for data analysis.
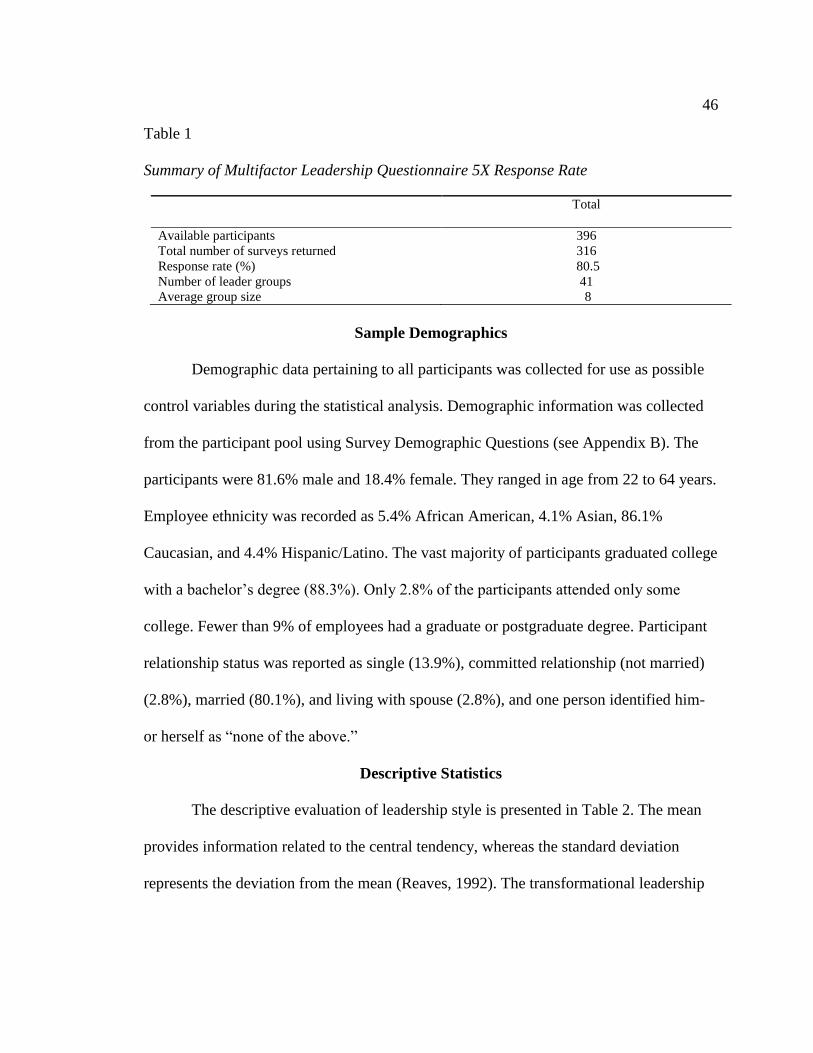
46
Table 1
Summary of Multifactor Leadership Questionnaire 5X Response Rate
Total
Available participants 396
Total number of surveys returned 316
Response rate (%) 80.5
Number of leader groups 41
Average group size 8
Sample Demographics
Demographic data pertaining to all participants was collected for use as possible
control variables during the statistical analysis. Demographic information was collected
from the participant pool using Survey Demographic Questions (see Appendix B). The
participants were 81.6% male and 18.4% female. They ranged in age from 22 to 64 years.
Employee ethnicity was recorded as 5.4% African American, 4.1% Asian, 86.1%
Caucasian, and 4.4% Hispanic/Latino. The vast majority of participants graduated college
with a bachelor’s degree (88.3%). Only 2.8% of the participants attended only some
college. Fewer than 9% of employees had a graduate or postgraduate degree. Participant
relationship status was reported as single (13.9%), committed relationship (not married)
(2.8%), married (80.1%), and living with spouse (2.8%), and one person identified him-
or herself as “none of the above.”
Descriptive Statistics
The descriptive evaluation of leadership style is presented in Table 2. The mean
provides information related to the central tendency, whereas the standard deviation
represents the deviation from the mean (Reaves, 1992). The transformational leadership

47
factor of idealized influence–attributed had the highest mean score (2.80). The lowest
mean score was idealized influence–behavioral (2.48).
Table 2
Descriptive Statistics for Transformational Leadership
Leadership M SD
Idealized influence
Attributed 2.80 0.780
Behavioral 2.48 1.001
Inspirational motivation 2.71 0.807
Intellectual stimulation 2.51 0.758
Individualized consideration 2.62 0.847
Average transformational leadership score 2.62 0.707
Note. Valid N (listwise) = 316.
The descriptive evaluation of the criterion variables is presented in Table 3. The
mean provides information related to the central tendency, whereas the standard deviation
represents the deviation from the mean (Reaves, 1992). The highest mean score was
employee satisfaction (3.32), and the lowest mean score was willingness to exert extra
effort (2.49).
Table 3
Descriptive Statistics for Criterion
Perceived behavior M SD
Extra effort 2.49 1.001
Leader effectiveness 2.98 0.660
Employee satisfaction 3.32 0.708
Note. Valid N (listwise) = 316.

48
Test of Assumptions
Before analyzing the data from a multiple linear regression, a few assumptions
had to be demonstrated to be accurate; otherwise, a multiple linear regression would not
be the appropriate form of analysis. First, data were analyzed for independence of errors.
Second, the evaluation of a linear relationship was conducted by use of a scatterplot.
Next, homoscedasticity of residuals (equal error variances) was evaluated. Fourth,
confirmation that no multicollinearity existed was achieved. Fifth, evaluation of outliers
was conducted. Finally, confirmation that errors were normally distributed was secured.
Validation of these assumptions was important to provide accuracy and goodness
of fit for the regression model, determine variation in the criterion as it is explained by
the predictor, and finally achieve acceptance or rejection of the hypotheses based on the
regression equation. If these assumptions had not been met, then alternate statistical tests
would have been required.
Independence of Errors
The Durbin–Watson statistic for each of the criteria was calculated as 2.3 (extra
effort), 2.1 (job satisfaction), and 2.02 (leader effectiveness). Each of these results
demonstrated that there was an independence of residuals, as assessed by a Durbin–
Watson statistic. See Table 4 for recorded data.

49
Table 4
Assumptions: Independence of Errors
Model R R2 Adjusted R2 Std. error of the estimate Durbin–Watson
Extra effort
1 .321 .103 .079 .9604
2 .784 .614 .603 .6311 2.3
Employee satisfaction
1 .231 .054 .029 .6979
2 .599 .359 .340 .5753 2.1
Leader effectiveness
1 .380 .145 .122 .6184
2 .729 .531 .517 .4587 2.02
Linear Relationship
First, it was assumed that the relationship between variables would be linear
without significant outliers. A multiple linear regression will not be affected too greatly if
there are some deviations; however, to review the data, a bivariate scatterplot was used to
validate the linear relationship between transformational leadership and each of the
measures for team success. Figures 1–3 demonstrate a clear linear relationship: As
transformational leadership scores rise, so, too, do the scores for each criterion.
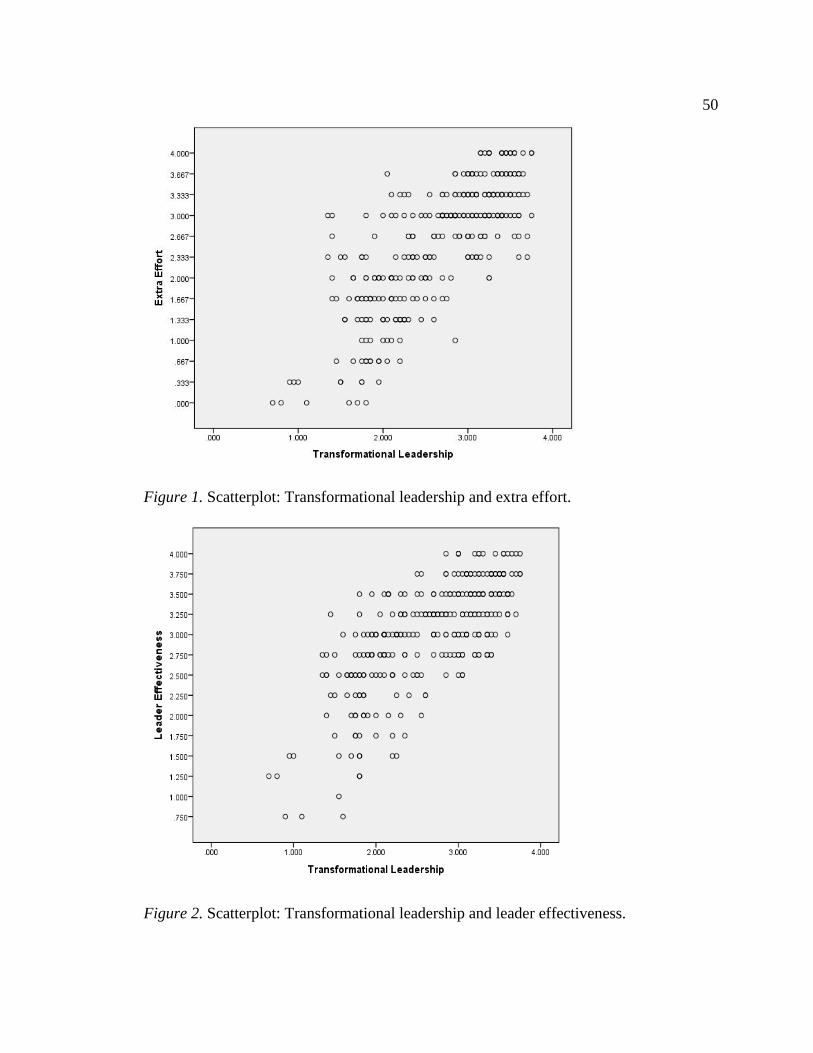
50
Figure 1. Scatterplot: Transformational leadership and extra effort.
Figure 2. Scatterplot: Transformational leadership and leader effectiveness.

51
Figure 3. Scatterplot: Transformational leadership and employee satisfaction.
Homoscedasticity of Residuals
The assumption of homoscedasticity suggests that residuals are equal for all
values of the predicted criterion. By plotting standardized residuals against the
unstandardized predicted values, a scatterplot demonstrates that the predicted values are
equally spread over the predicted values of the dependent variable. As illustrated in
Figure 4, the residuals are evenly spread across the predicted values.
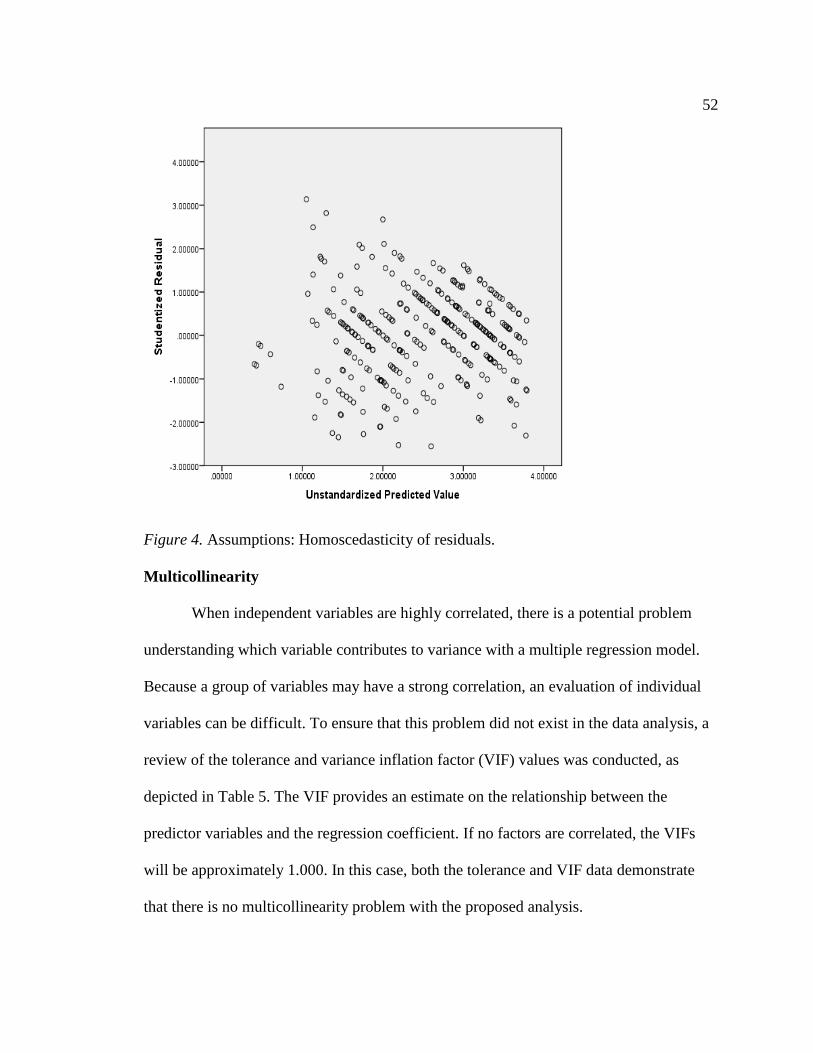
52
Figure 4. Assumptions: Homoscedasticity of residuals.
Multicollinearity
When independent variables are highly correlated, there is a potential problem
understanding which variable contributes to variance with a multiple regression model.
Because a group of variables may have a strong correlation, an evaluation of individual
variables can be difficult. To ensure that this problem did not exist in the data analysis, a
review of the tolerance and variance inflation factor (VIF) values was conducted, as
depicted in Table 5. The VIF provides an estimate on the relationship between the
predictor variables and the regression coefficient. If no factors are correlated, the VIFs
will be approximately 1.000. In this case, both the tolerance and VIF data demonstrate
that there is no multicollinearity problem with the proposed analysis.

53
Table 5
Assumptions: Correlations and Tolerance
Model Tolerance VIF
Employee gender .970 1.031
Employee age .982 1.018
Employee ethnicity .952 1.050
Employee education .981 1.019
Employee relationship status .942 1.062
Employee employment duration .984 1.016
Employee supervisor duration .915 1.093
Employee team size .813 1.230
Transformational leadership .869 1.150
Normal Distribution
As part of checking the assumptions, I identified that two points fall outside three
standard deviations from the normal distribution, hence they are outliers. The two
outliers, both from the same participant, are listed in Table 6. No outliers were related to
leader effectiveness.
Table 6
Assumptions: Normal Distribution (Outliers)
Case no. Std. residual Value Predicted value Residual
Extra effort 41 3.091 3.000 1.049 1.950
Employee satisfaction 41 –3.100 0.750 2.168 –1.418
The two outliers create a decision point before going further with the data
analysis. I determined that each case should be included in the overall data evaluation and
that no cases should be removed. The single outlier in a sample size of more than 300
participants will not have a material impact on the results of a linear regression analysis.
To demonstrate this point, using Cook’s distance to evaluate the influence of a single
case illustrates that no case had influence over 0.078 (mean = 0.0036, median = 0.0010,

54
range, 0.0000–0.0784; N = 316). Thus, no individual case has undue influence, and all
results should be included in the analysis.
To run inferential statistics and determine errors in prediction, data need to be
normally distributed. Figures 5–7 illustrate the normality using a histogram and normal
distribution bell curve for each of the criterion variables as well as a plot of the regression
standard residual compared to each criterion. Each of the following graphs demonstrates
a normal distribution and represents the final step of validating the assumptions.
Figure 5. Normal distribution histogram for extra effort.

55
Figure 6. Normal distribution histogram for leader effectiveness.
Figure 7. Normal distribution histogram for employee satisfaction.
Evaluation of the Relationship Between Predictor and Criterion Variables
After reviewing all assumptions follows evaluation of the multiple linear
regression. Because the information gathered in the demographic questionnaire can be
combined with the data measured from the MLQ, I performed a two-step regression
analysis. In the first step, the demographic information was entered into the equation
serving as control variables. The control variables included the information from the

56
employee demographic questionnaire reproduced as Appendix B. The control variables
used in the first stage of the regression analysis were employee gender, age, ethnicity,
education, employment duration, supervisor employment duration, and team size. Next,
the predictor measure for transformational leadership was added to the evaluation.
Hypothesis Testing
Descriptive statistics and multiple linear regression was used to examine the
relationship between the predictor, transformational leadership, and the criterion
variables or outcomes: extra effort, perception of leader effectiveness, and employee
satisfaction.
The data were reviewed to test each hypothesis and to answer each of the research
questions. To arrive at an answer, a regression analysis was performed to evaluate the
amount of variance in each outcome variable that could be attributed to the predictor
relative to other demographic variables. The assumptions of independence of errors,
linearity, homoscedasticity, and normality of data were met. When controlled with
measures for employee gender, age, ethnicity, education, relationship status, employment
duration, employee supervisor duration, and employee team size, it is found that
transformational leadership has a statistically significant relationship when predicting the
criterion variables extra effort, leader effectiveness, and employee satisfaction.
Research Question 1
The first research question asked: Is there a relationship between executive
transformational leadership behaviors and the work effort of virtual team members who
report to the leader? Hypothesis 1 predicted that TLB would not be associated with an

57
employee’s willingness to expend extra effort. Thus the first criterion variable was extra
effort. To test Hypothesis 1, the eight control variables mentioned previously were
entered as a first step in the multiple linear regression. The inclusion variable, TLB, was
entered in the second step. Results indicate that Step 1 was significant, accounting for
10.3% of the variance. The employee’s willingness to exert extra effort was significantly
predicted by the demographic control variables. Support for Hypothesis 1 was found in
that the change in R2 for Step 2 was significant, accounting for 61.4% of the variance (see
Table 7). As it relates to extra effort, TLB accounts for 61.4% of the variance, and only
10.3% of the variance can be accounted for by combining the impact of all demographic
variables. Transformational leadership significantly accounts for variation in extra effort
at the p < .05 level.
Table 7
Multiple Linear Regression/R2: Criterion Variables—Extra Effort
Model R R2 Std. error of the estimate Significance
Demographic variables
Employee satisfaction
.321
.784
.103
.614
.9604
.6311
.000
.000
The test of Hypothesis 1 resulted in the rejection of the null hypothesis. A
multiple regression was run to predict the criterion variable extra effort from employee
gender, age, ethnicity, education, relationship status, employment duration, employee
supervisor duration, and employee team size and the measure for transformational
leadership. The assumptions of independence of errors, linearity, homoscedasticity, and
normalization of data were met, and these variables statistically significantly predicted

58
extra effort, F(16, 95) = 37.955, p < .0005, adjusted R2 =.61. Employee supervisor
duration and TLB were statistically significant predictors, p < .05 (see Table 8).
Table 8
Transformational Leadership and Extra Effort
Model B SE β Significance
(Constant) –0.957 .659 .148
Employee gender 0.007 .093 .003 .942
Employee age 0.004 .005 .034 .338
Employee ethnicity –0.024 .068 –.013 .724
Employee education 0.034 .102 .012 .743
Employee relationship status –0.007 .038 –.006 .860
Employee employment duration –0.002 .011 –.008 .833
Employee supervisor duration 0.034 .016 .079 .034
Team size 0.017 .011 .064 .106
Transformational leadership 1.111 .055 .767 .000
Research Question 2
The second research question asked: Is there a relationship between executive
transformational leadership behaviors and team members’ perception of a leader’s
effectiveness? Hypothesis 2 predicted that TLB would not be associated with employee
perceptions of leadership effectiveness. Thus, the second criterion variable was perceived
effectiveness. To test Hypothesis 2, the eight control variables mentioned previously
were entered as a first step in the multiple linear regression. The inclusion variable, TLB,
was entered in the second step. Results indicate that Step 1 was significant, accounting
for 14.5% of the variance. The demographic control variables significantly predicted the
perceived effectiveness of an employee’s direct report leader. Support for Hypothesis 2
was found in that the change in R2 for Step 2 was significant, accounting for 51.7% of the
variance (see Table 9). As it relates to leader effectiveness, TLB accounts for 51.7% of
the variance, and only 14.5% of the variance can be accounted for by combining the

59
impact of all demographic variables. Transformational leadership significantly accounts
for variation in perceived leader effectiveness at the p < .05 level.
Table 9
Multiple Linear Regression/R2: Criterion Variables—Leader Effectiveness
Model R R2 Std. error of the estimate Significance
Demographic variables
Employee satisfaction
.380
.729
.145
.517
.6184
.4587
.000
.000
The test of Hypothesis 2 resulted in the rejection of the null hypothesis. Multiple
regression analyses were conducted to predict the criterion variable, perceived
effectiveness, from demographic variables outlined previously, along with the TLB of the
executive leader. The assumptions of independence of errors, linearity, homoscedasticity,
and normalization of data were met, and these variables statistically significantly
predicted perceived effectiveness, F(5, 95) = 69.063, p < .0005, adjusted R2 = .52. Only
employee team size and transformational leadership added statistically significant
findings to the prediction of perceived leader effectiveness, p < .05 (see Table 10).
Table 10
Transformational Leadership and Perceived Effectiveness
Model B SE β Significance
(Constant) 0.605 .479 .208
Employee gender –0.520 .068 –.300 .444
Employee age 0.003 .003 .380 .334
Employee ethnicity –0.015 .049 –.012 .759
Employee education 0.094 .074 .050 .208
Employee relationship status –0.009 .027 –.013 .739
Employee employment duration –0.009 .008 –.046 .240
Employee supervisor duration 0.007 .012 .024 .550
Team size 0.024 .008 .138 .002
Transformational leadership 0.637 .040 .667 .000

60
Research Question 3
The third research question asked: Is there a relationship between executive
transformational leadership behaviors and the job satisfaction of virtual team members
who report to the leader? Hypothesis 3 predicted that TLB would not be associated with
employee satisfaction. Thus the third criterion variable was employee satisfaction. To test
Hypothesis 3, the eight control variables mentioned previously were entered as a first step
in the multiple linear regression. The inclusion variable, TLB, was entered in the second
step. Results indicate that Step 1 was statistically significant, accounting for 5.4% of the
variance. The demographic control variables significantly predicted employee
satisfaction. Support for Hypothesis 3 was found in that the change in R2 for Step 2 was
significant as TLB accounted for 35.9% of the variance for employee satisfaction,
compared to just 5.4% for the demographic variables (see Table 11).
Table 11
Multiple Linear Regression/R2: Criterion Variables—Employee Satisfaction
Model R R2 Std. error of the estimate Significance
Demographic variables
Employee satisfaction
.231
.599
.054
.359
.6979
.5753
.029
.000
The findings for the test of Hypothesis 3 resulted in the rejection of the null
hypothesis. A multiple regression was run to predict the criterion, job satisfaction, from
employee age, employment duration, time reporting to the leader, team size, and the
measure for transformational leadership. The assumptions of independence of errors,
linearity, homoscedasticity, and normalization of data were met, and these variables
statistically significantly predicted employee satisfaction, F(5, 95) = 33.055, p < .0005,

61
adjusted R2 = .34. Only transformational leadership added statistically significant
findings to the prediction of employee job satisfaction, p < .05 (See Table 12).
Table 12
Transformational Leadership and Employee Satisfaction
Model B SE β Significance
(Constant) 1.567 .601 .010
Employee gender 0.106 .085 .058 .213
Employee age –0.003 .004 –.031 .508
Employee ethnicity –0.065 .062 –.050 .290
Employee education 0.071 .093 .035 .449
Employee relationship status –0.051 .034 –.070 .136
Employee employment duration 0.003 .010 .015 .744
Employee supervisor duration 0.017 .015 .057 .235
Team size 0.005 .010 .026 .609
Transformational leadership 0.607 .050 .593 .000
The multiple regression analysis suggests leadership behaviors are related to
subordinate outcomes in support of the applicability of Bass’s (1985) theory of
transformational leadership in a large IT organization.
Summary
A multiple regression analysis was conducted to predict the effects of
transformational leadership on the criterion variables for the present study: extra effort,
leader effectiveness, and employee job satisfaction. The assumptions required to
complete a thorough data analysis were reviewed and demonstrated to be satisfactory to
move forward with only two outliers, which demonstrated very small effect on data
analysis. Transformational leadership added statistical significance to the predictions for
each of the three criterion variables. As it relates to extra effort, transformational
leadership accounts for 61.4% of the variance, and only 10.3% of the variance can be
accounted for by combining the impact of all demographic variables. As it relates to

62
leader effectiveness, transformational leadership accounts for 51.7% of the variance, and
only 14.5% of the variance can be accounted for by combining the impact of all
demographic variables. TLB accounted for 35.9% of the variance in employee
satisfaction, compared to just 5.4% of the variance contributed to the demographic
variables. Transformational leadership statistically significantly accounts for variation in
all three criterion variables at the p < .05 level.

63
Chapter 5: Discussion, Conclusions, and Recommendations
Introduction
Employee job satisfaction, perceived leader effectiveness, and employee
willingness to exert extra effort have all been linked to employee retention, work quality,
and overall productivity (Riketta, 2008). Lack of leadership, or the wrong type of
leadership, can have negative implications for employee retention, work quality, and
overall productivity (Riketta, 2008). The purpose of this quantitative study was to
evaluate the relationship between transformational leadership and employee willingness
to exert extra effort, perceived leader effectiveness, and job satisfaction.
A multiple regression analysis was conducted to predict the effects of leadership
transformation on the criterion variables for the present study: extra effort, leader
effectiveness, and employee job satisfaction. The assumptions required to complete a
thorough data analysis were reviewed and demonstrated to be satisfactory to move
forward with only two outliers, which demonstrated very small effect on data analysis.
Transformational leadership added statistical significance to the predictions for each of
the three criterion variables. Transformational leadership accounted for 61.4%, 51.7%,
and 35.7% of the variance for extra effort, leader effectiveness, and employee
satisfaction, respectively. By comparison, all of the demographic variables combined
accounted for only 10.3% variance for extra effort, 14.5% variance for leader
effectiveness, and 5.4% variance for employee satisfaction. Transformational leadership
accounted for variation in all three criterion variables at the p < .05 level.

64
Interpretation of the Findings
This study tested the theory that TLB would lead to increased productivity for
virtual team members, who do not experience the same daily interactions with their
leadership as employees in a traditional workforce do. In particular, this study was
interested in exploring the Bass (1985) framework as it applies to a virtual workforce.
Quantitative research methods were used for this study. The predictor for the study was
transformational leadership, and the criterion variables were employees’ willingness to
exert extra effort, perceived effectiveness, and job satisfaction. The population for this
study was provided through a research partner, a large IT organization that frequently
uses a virtual workforce.
The findings of the study indicated transformational leadership had a statistically
significant relationship that accounted for variation in all three criterion variables at the p
< .05 level. Furthermore, transformational leadership was more impactful to the variation
than all demographic variables combined. Based on the findings presented in the present
study, there is strong support to improve the current body of research and suggest that
findings built from Avolio and Bass (1998) hold true beyond the traditional workplace.
Consistent with the 1997 findings, transformational leaders build trust and respect with
their direct report employees, and transformational leaders inspire employees to achieve
more. In the present study, an employee’s willingness to exert extra effort, an employee’s
perception of the effectiveness of a leader, and an employee’s job satisfaction were
viewed as measures of a successful team and were explored with each research question
and each hypothesis.

65
The findings outlined in Chapter 4 demonstrated that transformational leadership
accounted for significant variance with an employee’s willingness to exert extra effort.
The findings supported the applicability of Bass’s (1985) theory of transformational
leadership in a virtual work environment. This section includes an analysis for each
research question and how the findings fit with the existing research. The present study
was grounded in three research questions.
The first research question was focused on the relationship between executive
TLB and the work effort of virtual team members that report to the leader. In 1997,
Boehnke et al. suggested that transformational leadership was related to exceptional work
performance. The measure of an employee’s willingness to exert extra effort
demonstrates that characteristic. Bass (1985) suggested that transformational leaders
develop a vision and influence team members to believe in the vision and put forth extra
effort to ensure the vision becomes a reality.
The eight control variables mentioned previously were entered as a first step in
the multiple linear regression. The independent variable, TLB, was entered in the second
step. Results indicated that Step 1 was significant, accounting for 10.3% of the variance.
Employee willingness to exert extra effort was significantly predicted by the
demographic control variables. Support for Hypothesis 1 was found in that the change in
R2 for Step 2 was significant, accounting for 61.4% of the variance (see Table 7). As it
relates to extra effort, transformational leadership accounted for 61.4% of the variance,
and only 10.3% of the variance could be accounted for by combining the impact of all

66
demographic variables. Transformational leadership statistically significantly accounted
for variation in extra effort at the p < .05 level.
I concluded that there was a significant and strong positive correlation between
extra effort and the transformational leadership style. A multiple regression was run to
predict the criterion variable extra effort from employee gender, age, ethnicity, education,
relationship status, employment duration, employee supervisor duration, employee team
size, and the measure for transformational leadership. The assumptions of independence
of errors, linearity, homoscedasticity, and normalization of data were met, and these
variables statistically significantly predicted extra effort, F(16, 95) = 37.955, p < .0005,
adjusted R2 = .61. Two factors, employee supervisor duration and TLB, added
statistically significant findings to the prediction, p < .05.
It is interesting to note that supervisor employment duration was significantly
linked to an employee’s willingness to exert extra effort. This finding has not been
reproduced within the current body of research. As a result of only one study, it would
not be prudent to jump to conclusions and expect this finding to hold true; however, it is
worth future research in a virtual environment to determine if a leader’s duration with an
organization is in fact linked to employees’ willingness to exert extra effort. One might
conclude that a leader’s longevity and track record of success within an organization are
pervasive and that when a leader has a track record of success, team members are more
inclined to work harder to support continued success.
The second research question evaluated the relationship between executive TLB
and team members’ perceptions of a leader’s effectiveness. To test Hypothesis 2, the

67
eight control variables mentioned previously were entered as a first step in the multiple
linear regression. The inclusion variable, TLB, was entered in the second step. Results
indicated that Step 1 was significant, accounting for 14.5% of the variance. The
demographic control variables significantly predicted the perceived effectiveness of an
employee’s direct report leader. Support for Hypothesis 2 was found in that the change in
R2 for Step 2 was significant, accounting for 51.7% of the variance (see Table 8). As it
relates to leader effectiveness, transformational leadership accounted for 51.7% of the
variance, and only 14.5% of the variance could be accounted for by combining the impact
of all demographic variables. Transformational leadership statistically significantly
accounted for variation in perceived leader effectiveness at the p < .05 level.
It was concluded that there was a significant and strong positive relationship
between the employees’ perceived effectiveness of their direct report managers and the
transformational leadership style. Multiple regression analyses were conducted to predict
the criterion variable perceived effectiveness from demographic variables outlined
previously along with TLB of the executive leader. The assumptions of independence of
errors, linearity, homoscedasticity, and normalization of data were met, and these
variables statistically significantly predicted perceived effectiveness, F(5, 95) = 69.063, p
< .0005, adjusted R2 =.52 . Only employee team size and transformational leadership
added statistically significant findings to the prediction of perceived leader effectiveness,
p < .05.
Again, having a demographic variable demonstrate a significant relationship with
perceived leader effectiveness was not expected and not further supported within existing

68
research. This finding is of interest and worth future exploration. One might posit that
when teams are smaller, there is a more personal relationship between the leader and each
follower. In a virtual environment, the sense of a strong personal relationship might be
influential. However, the cause of the relationship cannot be clearly identified in the
present research.
The third research question was to evaluate the relationship between executive
TLB and the job satisfaction of virtual team members who report to the leader. Results
indicate that Step 1 was statistically significant, accounting for 5.4% of the variance. The
demographic control variable significantly predicted employee satisfaction. Support for
Hypothesis 3 was found in that the change in R2 for Step 2 was significant as TLBs
accounted for 35.9% of the variance for employee satisfaction, compared to just 5.4% of
the variance that can be contributed to the demographic variables (see Table 11).
It was concluded that there is a significant and strong positive relationship
between an employee’s job satisfaction and the transformational leadership style. A
multiple regression was run to predict the criterion job satisfaction from employee age,
employment duration, time reporting to the leader, team size, and the measure for
transformational leadership. The assumptions of independence of errors, linearity,
homoscedasticity, and normalization of data were met, and these variables statistically
significantly predicted employee satisfaction, F(5, 95) = 33.055, p < .0005, adjusted R2 =
.34. Only transformational leadership added statistically significant findings to the
prediction of employee job satisfaction, p < .05. This finding supports Bass’s (1985)

69
theory of transformational leadership in a large IT organization even when the teams are
in a virtual work environment.
Limitations of the Study
The present study had some limitations. First, the success of virtual teams and
measurement of TLB was based on a single point in time, not over an extended period.
Second, although the research instrument described in this dissertation has been widely
used and has demonstrated acceptable validity and reliability scores, the study assumed
that there were no demographic characteristics that prevent understanding or responding
to the items on the questionnaires.
The present study tried to further the body of knowledge regarding the
relationship between the predictor, TLB, and three criterion variables: employee job
satisfaction, perceived influence, and willingness to exert extra effort. The research was
expected to further understanding related to both direction and strength of the relationship
between the predictor and criterion variables. By more completely understanding
transformational leadership as it relates to virtual teams, there is an opportunity to
influence social change as more organizations and employees seek the virtual team
structure. By performing the regression testing outlined, however, there are still
limitations, and further research may be needed outside of the IT field.
Recommendations
There are several opportunities for further research on leadership behaviors for
virtual teams. First, the present research limited the scope of leadership to a single style,
transformational leadership. It might be worth exploring other leadership styles to

70
determine if those other leadership styles are more or less effective in a virtual team
environment.
Next, the present research was limited to a single IT organization. A broader
scope of businesses should be considered. There are reasons to consider different
organizations, especially those where employees are less likely to be technically savvy
and discern whether leadership characteristics and team performance really mirror those
of a traditional workplace.
As discussed, a few demographic variables explained a significant variance in the
criterion variables. In the case of willingness to exert extra effort, the duration of
employment for the leader is significantly related to performance. For a leader’s
perceived effectiveness, team size demonstrates a significant relationship. It is worth
further research to consider the implications of these findings.
Implications
This study measured the impact of transformational leadership on employees’
willingness to exert extra effort, perceived leader effectiveness, and job satisfaction.
Through specific scientific testing, the study has supported major findings of the existing
body of research that supports that transformational leadership has a strong positive
relationship accounting for much of the variation in employee performance.
This study has significant implications for businesses seeking to leverage a virtual
work environment. It appears that despite different communication and interaction
mechanisms, finding and developing transformational leaders is directly tied to team
performance. The present research supports transformational leaders as being well suited

71
to lead virtual teams in an IT organization because leaders who exhibit TLBs will be
directly linked to team success.
Conclusion
Prior research has shown that transformational leaders demonstrate leadership
behaviors that facilitate both individual and team success (Bass, 1997). Research in the
traditional workplace has demonstrated that leaders may exhibit multiple different
leadership characteristics classified as transformational, transactional, or laissez-faire;
however, TLBs are directly correlated with improved team performance. The present
research has attempted to address gaps in research as it pertains to virtual teams. The
intent of the present study was to research the relationship between transformational
leadership of IT executive leaders and the work effort, perceived effectiveness, and job
satisfaction of direct report employees working in a virtual team environment. The results
of this study may help recruiters, human resource managers, industrial–organizational
psychologists, executive IT leaders, and employees to understand the relationship
between TLB and team success. With this knowledge organizations, can make better
decisions for hiring, promoting, and training.
According to a review of existing literature, a gradual transition from the 1947
work of Weber’s charismatic leadership theories, expanded by Burns’s exploration in
1978, culminated in groundbreaking research with Bass’s (1997) work that not only
formulated the theories on transformational leadership but also provided a foundation for
measuring different leadership behaviors. As instruments like the MLQ prove, TLB is
most commonly tied to higher performing teams where leaders understand the motives of

72
followers and leverage their understanding to achieve successful outcomes (Burns, 1978).
Transformational leaders create a vision and build consensus based on ethical or moral
implications often transcending self-interest (Avolio & Yammarino, 2002; Block, 2003;
Dulewicz, 2005).
A review of the available literature demonstrated a clear gap in research
surrounding leadership styles and virtual teams. The lack of attention to leadership
behaviors and the virtual workforce is relevant because of the increasing demand for
geographically dispersed workers. The current study has attempted to fill this gap in the
literature by using the MLQ 5X, through which the relationship between leadership
behaviors and team performance can be evaluated.
After conducting research and gathering data from 316 different participants from
a large IT organization, a multiple regression analysis was run to predict the effects of
leadership transformation on the criterion variables for the present study: extra effort,
leader effectiveness, and employee job satisfaction. The assumptions required to
complete a thorough data analysis were reviewed and demonstrated to be satisfactory to
move forward with only two outliers, which demonstrated very small effect on data
analysis. Transformational leadership added statistical significance to the predictions for
each of the three criterion variables. As it relates to extra effort, transformational
leadership accounts for 61.4% of the variance, and only 10.3% of the variance can be
accounted for by combining the impact of all demographic variables. As it relates to
leader effectiveness, transformational leadership accounts for 51.7% of the variance, and
only 14.5% of the variance can be accounted for by combining the impact of all

73
demographic variables. TLBs accounted for 35.9% of the variance in employee
satisfaction compared to just 5.4% of the variance that can be contributed to the
demographic variables. Transformational leadership statistically significantly accounts
for variation in all three criterion variables at the p < .05 level.
Challenging economic times and continuously improving technology have
brought with them a paradigm shift for the workforce. Employees can work from home,
or work from anywhere they have access to an Internet connection. However, as
employee interaction changes and face-to-face communication is no longer the norm,
there is a need to better understand the implications of leadership in a virtual team
environment. Virtual teams are the future, as organizations seek to lower costs and
increase the available talent pool for any given position. Thus understanding leadership
styles and implications of leadership behavior on virtual team performance will allow
organizations to better prescribe training, hire more effectively, and perhaps even seek to
better use existing employees in a more effective way. The present research has furthered
the existing body of knowledge by supporting that transformational leadership has direct
positive implications for successful team performance.

74
References
Alon, I., & Higgins, J. M. (2005). Global leadership success through emotional and
cultural intelligences. Business Horizons, 48(6), 501–512.
doi:10.1016/j.bushor.2005.04.003
Anderson, T. (1998). Transforming leadership: Equipping yourself and coach. Boca
Raton, FL: St. Lucie Press.
Antonakis, J., Avolio, B. J., & Sivasubramaniam, N. (2003). Context and leadership: an
examination of the nine-factor full-range leadership theory using the Multifactor
Leadership Questionnaire. The Leadership Quarterly, 14(3), 261–295.
doi:10.1016/s1048-9843(03)00030-4.
Antonakis, J., & House, R. J. (2002). An analysis of the full-range leadership theory: The
way forward. In B. J. Avolio & F. J. Yammario (Eds.), Transformational and
charismatic leadership: The road a-head (pp. 3–34). Amsterdam, The
Netherlands: JAI Press.
Askarany, D., Smith, M., & Yazdifar, H. (2007). Attributes of innovation and the
implementation of managerial tools: An activity-based management technique.
International Journal of Business and Systems Research, 1(1), 98–114.
Atwater, L. (1993). Personal attributes as predictors of superiors’ and subordinates’
perceptions of military academy leadership. Human Relations, 46(5), 645–668.
Avolio, B. J., & Bass, B. M. (1998). The full range leadership development programs:
Basic and advanced manuals. Binghamton, NY: Bass, Avolio.
Avolio, B. J. (1999). Full leadership development: Building vital forces in organizations.

75
Thousand Oaks, CA: Sage.
Avolio, B. J., & Bass, B. M. (1999). Re-examining the components of transformational
and transactional leadership using the multifactor leadership questionnaire.
Journal of Occupational and Organizational Psychology, 72, 441–462.
Avolio, B. J., & Bass, B. M. (2004). Multifactor leadership questionnaire: Technical
Report. Palo Alto, CA: Mind Garden.
Avolio, B. J., & Yammarino, F. J. (2002). Transformational and charismatic leadership:
The road ahead. Oxford, England: Elsevier Science.
Barbuto, J. E. (2000). Motivation and transactional, charismatic, and transformational
leadership: A test of antecedents. Journal of Leadership & Organizational
Studies, 11(4), 26–40.
Barbuto, J. E., Jr., & Burbach, M. E. (2006). The emotional intelligence of
transformational leaders: A field study of elected officials. Journal of Social
Psychology, 146(1), 51–69.
Barling, J., Slater, F., & Kevin Kelloway, E. (2000). Transformational leadership and
emotional intelligence: an exploratory study. Leadership & Organization
Development Journal, 21(3), 157–161. doi:10.1108/01437730010325040
Bass, B. M. (1985). Leadership and performance beyond expectations. New York, NY:
Free Press.
Bass, B. M. (1990). Bass and Stogdill’s handbook of leadership: Theory, research, and
managerial applications (3rd ed.). New York, NY: Free Press.
Bass, B. M. (1997). Transformational leadership: Military and civilian impact. Mahwah,

76
NJ: Lawrence Erlbaum.
Bass, B. M. (1998). Transformational leadership: Military and civilian impact. Mahwah,
NJ: Lawrence Erlbaum.
Bass, B. M. (1999). Two decades of research and development in transformational
leadership. European Journal of Work and Organizational Psychology, 8(1), 9–
32.
Bass, B. M., & Avolio, B. J. (1990). Multifactor Leadership Questionnaire. Palo Alto,
CA: Consulting Psychologists Press.
Bass, B. M., & Avolio, B. J. (1993). Transformational leadership and organizational
culture. Public Administration Quarterly, 17(1), 112–125.
Bass, B. M., & Avolio, B. J. (1995). Multifactor Leadership Questionnaire. PsycTESTS
Dataset. doi:10.1037/t03624-000
Best-paying Work-at-home Jobs. (2011, September 27). Retrieved from
http://www.forbes.comBlock, L. (2003). The leadership–culture connection: An
exploratory investigation. Leadership & Organization Development Journal,
24(6), 318–334.
Bono, J. E., & Judge, T. A. (2004). Personality and transformational and transactional
leadership: A meta-analysis. Journal of Applied Psychology, 89, 901–910.
Boyatzis, R. (2008). Resonant leadership. Boston, MA: Harvard Business School.
Brown, M., Metz, I., Cregan, C., & Kulik, C. T. (2009). Irreconcilable differences?
Strategic human resource management and employee well-being. Asia Pacific
Journal of Human Resources, 47(3), 270–294. doi:10.1177/1038411109106859
77
Bruner, J. (1996). The culture of education. Cambridge, MA: Harvard University Press.
Burns, J. M. (1978). Leadership. New York, NY: Harper and Row.
Burns, J. M. (2003). Transforming leadership: A new pursuit of happiness. New York,
NY: Grove Press.
Carless, S. A., Wearing, A. J., & Mann, L. (2000). Journal of Business and Psychology,
14(3), 389–405. doi:10.1023/a:1022991115523.
Carte, T. A., Chidambaram, L., & Becker, A. (2006). Emergent leadership in self-
managed virtual teams. Group Decisions and Negotiation, 15(4), 323–350.
Chang, H., & Lin, G. (2008). Effect of personal values transformation on leadership
behavior. Total Quality Management, 19(1), 67–79.
Chen, L. (2004). Examining the effect of organizational culture and leadership behaviors
on organizational commitment, job satisfaction, and job performance at small and
middle sized firms of Taiwan. Journal of American Academy of Business, 5, 592–
599.
Chen, H., Beck, S., & Amos, L. (2005). Leadership styles and nursing faculty job
satisfaction in Taiwan. Journal of Nursing Scholarship, 37, 374–380.
Cohen, W. A. (1990). The art of the leader. Englewood Cliffs, NJ: Prentice Hall.
Conger, A. J. (1999). Charismatic and transformational leadership in organizations: An
insider’s perspective on these developing streams of research. Leadership
Quarterly, 10(2), 145–179.
Crawford, C. B., Gould, L. V., & Scott, R. F. (2003). Transformational leader as
champion and techie: Implications for leadership educators. Journal of

78
Leadership Education, 2(1), 57–73.
Creswell, J. (2003). Educational research: Planning, conducting, and evaluating
quantitative and qualitative research. Upper Saddle River, NJ: Pearson.
Cromb, D. (2005). A guide to organizational and human factors. Leadership &
Organizational Development Journal, 26, 166–180.
Cromb, D. (2005). Implementing virtual teams: A guide to organizational and human
factors. Leadership & Organizational Development Journal, 26, 166.
Cronbach, L. J. (1951). Coefficient alpha and the internal structure of tests.
Psychometrika, 16, 297–334.
Crossley, C., Bennett, R., Jex, S., & Burnfield, J. (2007). Development of global measure
of job embeddedness and integration into a traditional model of voluntary
turnover. Journal of Applied Psychology, 92, 1030–1040.
Daft, R. L. (2003). The leadership experience. Cincinnati, OH: Southwestern.
Denison, D., Hooijbert R., & Quinn, R. (1995). Paradox and performance: Toward a
theory of behavioral complexity in managerial leadership. Organization Science,
6, 524–541.
Dickson, K., & Lorenz, A. (2009). Psychological empowerment and job satisfaction: A
preliminary investigation. Journal of Behavioral and Applied Management, 10,
160–190.
Dulewicz, V., (2005). An assessment of group support systems experiment research:
Methodology and results. Journal of Management Information Systems, 15, 7–
148.

79
Eagley, P. C. (2003). Cultural intelligence. Harvard Business Review, 82, 139–153.
Eberlin, R., & Tatum, B. (2008). Making just decisions: Leadership. Management
Decisions, 46, 311–330.
El-Meligi, M. (2005). A Humanistic View of Leadership, 19–30.
doi:10.1142/9789812700940_0002
Emery, C., & Barker, K. (2007). The effect of transactional and transformational
leadership styles on the organization commitment and job satisfaction of customer
contact personnel. Journal of Organizational Culture, Communications, and
Conflict, 11, 77–90.
Fjermestad, J., & Hiltz, S. R. (1998). An assessment of group support systems experiment
research: Methodology and results. Journal of Management Information Systems,
15, 7–148.
Galup, S., Klein, G., & Jiang, J. (2008). The impacts of job characteristics on employee
satisfaction. Journal of Computer Information Systems, 48(4), 55–65.
Garcie-Serrano, C. (2009). Job satisfaction, union membership, and collective bargaining.
European Journal of Industrial Relations, 15, 90–115.
Gareis, E. (2006). Virtual teams: A comparison of online communication channels.
Journal of Language for International Business, 17, 6–22.
Gibson, C. B., & Gibbs, J. L. (2006). Unpacking the concept of virtuality: The effects of
geographic dispersion, electronic dependence, dynamic structure, and national
diversity on team innovation. Administrative Science Quarterly, 51(3), 451–495.
Graen, G. (1976). Role making processes within complex organizations. In Handbook of
80
industrial and organizational psychology (pp. 219–247). Chicago, IL: Rand
McNally.
Graen, G., & Uhl-Bien, M. (1995). Relationship-based approach to leadership.
Leadership Quarterly, 6, 660–671.
Haakonsson, D., Burton, R., Obel, R., & Lauridsen, J. (2008). How failure to align
organizational climate and leadership style affects performance. Management
Decisions, 46, 406–431.
Hartog, D. N., van Muijen, J. J., & Koopman, P. L. (1997). Transactional versus
transformational leadership: An analysis of the MLQ. Journal of Occupational
and Organizational Psychology, 70(1), 19–34.
Hernez-Broome, G., & Hughes, R. L. (2004). Leadership development: Past, present, and
future. Human Resource Planning, 27, 24–34.
Hooijberg, R., Hunt, J. G., & Dodge, G. E. (1997). Leadership complexity and
development of the leaderplex model. Journal of Management, 23, 375–408.
House, R. J. (1977). A 1976 theory of charismatic leadership. In J. G. Hunt & L. L.
Larson (Eds.), Leadership: The cutting edge (pp. 187–207). Carbondale, IL: South
Illinois University Press.
Howell, J. M., & Higgins, C. A. (1990). Champions of change. Business Quarterly,
54(4), 31–36.
Hoyt, C., & Blacovich, J. (2003). Transformational and transactional leadership in virtual
and physical environments. Small Group Research, 34, 678–715.
Ilies, R., Judge, T., & Wagner, D. (2006). Making sense of motivational leadership: The

81
trail from transformation leaders to motivational followers. Journal of Leadership
and Organisation Studies, 13(1), 101–113.
Judge, T. A., & Piccolo, R. F. (2004). Transformational and transactional leadership: A
test of relative validity. Journal of Applied Psychology, 89, 750–768.
Jung, D., Chow, W., & Wu, B. (2003). Effects of leadership style and followers’ cultural
orientation on performance in group and individual task conditions. Academy of
Management Journal, 42, 375–403.
Lewin, K. (1939). Patterns of aggressive behavior in experimentally created social
climates. Journal of Social Psychology, 10, 273–300.
Lockwood, N. R. (2010). Leveraging employees’ engagement for competitive advantage:
HR’s strategic role. HR Magazine, 52(2), 1–21.
Lowe, K. B., Kroeck, K. G., & Sivasubramaniam, N. (1996). Effectiveness correlates of
transformation leadership and transactional leadership: A meta-analytic review of
the MLQ literature. Leadership Quarterly, 7, 385–425.
Malhotra, A., Majchrzak, A., & Benson, R. (2007). Leading virtual teams. Academy of
Management Perspectives, 2(1), 60–70.
Meyer, E. (2011). The four keys to success with virtual teams. Forbes. Retrieved from
http://www.forbes.com
Newman, R., & Rudestam, K. (1999). Your statistical consultant. Thousand Oaks, CA:
Sage.
Northouse, P. G. (2001). Leadership: Theory and practice. Thousand Oaks, CA: Sage.
Nunamaker, J. F., Reinig, B. A., & Briggs, R. O. (2009). Principles for effective virtual

82
teamwork. Communications of the ACM, 52(4), 113–118.
Page, K., & Vella-Brodrick, D. (2009). Employee well-being: A new model. Social
Indicators Research, 90, 439–455.
Panagiotis, P. V. (2006). Transformational leadership and work motivation in modern
organizations. Advances in Management, 1(3), 80–92.
Rahim, M. A. (2006). Emotional intelligence and transformational leadership: A group
level analysis in five countries. Current Topics in Management, 11, 223–236.
Reaves, C. C. (1992). Quantitative research for the behavioral sciences. New York, NY:
John Wiley.
Reilly, R. R. (2005). Virtual Distance and Team Performance: A Preliminary Study.
PsycEXTRA Dataset. doi:10.1037/e518612013-589
Riketta, M. (2008). The causal relation between job attitude and performance. Journal of
Applied Psychology, 93, 470–481.
Sashkin, M., & Burke, W. W. (1990). Understanding and assessing organizational
leadership. In K. E. Clark & M. B. Clark, Measures of leadership (pp. 297–320).
West Orange, NJ: Leadership Library of America.
Skogstad, A., Einarsen, S., Torsheim, T., Aasland, M., & Hetland, H. (2007). The
destructiveness of laissez-faire leadership behavior. Journal of Occupational
Health Psychology, 12, 77–92.
Sobel-Lojeski, K., & Reilly, R. (2007). The role of virtual distance in innovation and
success. Retrieved from EBSCOhost database.
Solansky, S. (2008). Leadership style and team processes in self-managed teams. Journal

83
of Leadership and Organizational Studies, 14, 332–350.
Sussan, A., & Johnson, W. (2007). Strategic capabilities of business process: Looking for
competitive advantage. Competitiveness Review, 13(2), 46–52. Retrieved from
EBSCOhost database.
Tucker, B. A., & Russell, R. F. (2004). The influence of the transformational leader.
Journal of Leadership and Organizational Studies, 10(4), 103–112.
Turner, J. R., & Muller, R. (2005). The project manager’s leadership style as a success
factor on projects. Project Management Journal, 36, 49–61.
Weber, M. (1947). The theory of social and economic organization (A. M. Henderson &
T. Parsons, Trans.). New York, NY: Free Press.
Wren, J. (1995). The leader’s companion: Insights on leadership through the ages. New
York, NY: Free Press.
Yukl, G. (2002). Leadership in organizations (5th ed.). Upper Saddle River, NJ: Prentice
Hall.
Zakaria, N., Amelincks, A., & Duncan, W. (2004). Working together or apart? Creativity
& Innovation Management, 13, 15–29.
Zhang, Fjermestad, J., & Tremaine, M. (2005). Leadership Styles in Virtual Team
Context: Limitations, Solutions and Propositions. Proceedings of the 38th Annual
Hawaii International Conference on System Sciences. doi:10.1109/hicss.2005.382
Zhu, K., & Kraemer, K. L. (2005). Post-adoption variations in usage and value of e-
business by organizations: Cross-country evidence from the retail industry.
Information Systems Research, 16(1), 61–85.
84
Appendix A: Informed Consent Form
You are invited to take part in a research study to investigate the relationship
between transformational leadership and the success of virtual teams. You were chosen
for the study because you and your direct report manager are members of a virtual team.
This form is part of a process called “informed consent,” which will allow you to
understand this study before deciding whether to take part.
This study is being conducted by a researcher named Russell T. Hogue, who is a
doctoral student at Walden University.
Background Information
The purpose of the research is to help reveal more information about the
importance of leadership in a virtual team environment. The results of this study may
help recruiters, human resource managers, executive IT leaders, and employees, as the
results will provide information for hiring, promoting, and training.
Procedures
If you agree to be in this study, you will be asked to:
Complete an online survey that will take approximately 20 minutes.
Voluntary Nature of the Study
Your participation in this study is voluntary. This means that everyone will
respect your decision whether to be in the study. No communication regarding your
participation will be provided to your direct report manager if you decide not to be in the
study. If you decide to join the study now, you can still change your mind during the
study. You may skip any questions that you feel are too personal.

85
Risks
The risks of this study are minimal. The questions are multiple choice, and you
are free to skip any questions you feel uncomfortable answering. You may decline to
answer any or all questions, and you may terminate your involvement at any time if you
choose.
Benefits
There will be no direct benefit to you for your participation in this study.
However, this study may benefit supervisors, employees, and organizations that are
interested in working in a virtual work environment.
Compensation
There will not be compensation for participation.
Confidentiality
Any information you provide will be kept anonymous. The researcher will not use
your information for any purposes outside of this research project. This survey will
leverage the same corporate survey tool used for other confidential surveys.
Contacts and Questions
You may ask any questions you have now, or, if you have questions later, you
may contact the researcher via e-mail at [contact information removed] or by calling
[contact information removed]. Walden University’s approval number for this study was
09-25-13-0023801, and it expired on September 25, 2014.
Statement of Consent

86
I have read the above information and I feel I understand the study well enough to make a
decision about my involvement. By clicking here, I am agreeing to the terms described
above.
* Electronic signatures are regulated by the Uniform Electronic Transactions Act.
Legally, an “electronic signature” can be the person’s typed name, their e-mail address,
or any other identifying marker. An electronic signature is just as valid as a written
signature, as long as both parties have agreed to conduct the transaction electronically.
Printed Name of Participant
Date of consent
Participant’s Written or Electronic* Signature
Researcher’s Written or Electronic*
Signature

87
Appendix B: Survey Demographic Questions
What is your gender?
1 = male, 2 = female
What is your age?
_____ years
What is your ethnicity? (Indicate all that apply)
1 = African American, 2 = Asian, 3 = Caucasian, 4 = Hispanic/Latino,
5 = Native American, 6 = Pacific Islander, 7 = Other ___________
What is your highest level of education?
1 = did not graduate high school, 2 = high school graduate or equivalent,
3 = some college or vocational school, 4 = associate’s degree, 5 = bachelor’s degree,
6 = graduate degree, 7 = postgraduate degree
What is your relationship status?
1 = single, 2 = in a committed relationship (not married), 3 = married,
4 = living with spouse, partner, significant other, 5 = none of the above

88
How long have you been working for your current employer? (Tenure in the
organization)
_____ years
How long have you been working for the present supervisor? (Tenure on team)
_____ years
How many employees are on your team?
_____ number of employees