Transformable Nanomaterials as Artificial Extracellular ...
30
Transformable Nanomaterials as Artificial Extracellular Matrix for Inhibiting Tumor Invasion and Metastasis Xiao-Xue Hu, †, ‡ Ping-Ping He, ‡ Guo-Bin Qi, ‡ Yu-Juan Gao, ‡ Yao-Xin Lin, ‡ Chao Yang, ‡ Pei-Pei Yang, ‡ Hongxun Hao *,† Lei Wang *,‡ and Hao Wang *,‡ † National Engineering Research Center of Industrial Crystallization Technology State Key Laboratory of Chemical Engineering School of Chemical Engineering and Technology Tianjin University Tianjin 300072, P. R. China E-mail: [email protected] ‡ CAS Center for Excellence in Nanoscience, CAS Key Laboratory for Biological Ef- fects of Nanomaterials and Nanosafety, National Center for Nanoscience and Tech- nology (NCNST) No. 11 Beiyitiao, Zhongguancun, Beijing (China) Fax: (+86) 10-82545759 E-mail: [email protected]; [email protected] Homepage: http://www.nanoctr.cn/wanghao
Transcript of Transformable Nanomaterials as Artificial Extracellular ...

Transformable Nanomaterials as Artificial Extracellular
Matrix for Inhibiting Tumor Invasion and Metastasis
Xiao-Xue Hu, †, ‡
Ping-Ping He, ‡
Guo-Bin Qi, ‡
Yu-Juan Gao, ‡ Yao-Xin Lin,
‡ Chao
Yang, ‡
Pei-Pei Yang, ‡ Hongxun Hao
*,† Lei Wang
*,‡and Hao Wang
*,‡
†National Engineering Research Center of Industrial Crystallization Technology
State Key Laboratory of Chemical Engineering
School of Chemical Engineering and Technology
Tianjin University
Tianjin 300072, P. R. China
E-mail: [email protected]
‡CAS Center for Excellence in Nanoscience, CAS Key Laboratory for Biological Ef-
fects of Nanomaterials and Nanosafety, National Center for Nanoscience and Tech-
nology (NCNST)
No. 11 Beiyitiao, Zhongguancun, Beijing (China)
Fax: (+86) 10-82545759
E-mail: [email protected]; [email protected]
Homepage: http://www.nanoctr.cn/wanghao

Supporting Information for:
Figure S1. MALDI-TOF mass spectrum of peptide 1.
Figure S2. MALDI-TOF mass spectrum of peptide 2.
Figure S3. UV-vis spectra characteristics of self-assembly process to form 2-NPs in
mixed H2O/DMSO solutions (c = 3.0 × 10⁻⁵
M).
Figure S4. Fluorescence spectra of self-assembly process to form 2-NPs in mixed
H2O/DMSO solutions (c = 3.0 × 10⁻⁵
M).
Figure S5. DLS of 2 nanoaggregates structural evolution in the absence/presence of
Ca2+
ions in aqueous solutions (c = 3.0 × 10⁻⁵
M) in 6 days.
Figure S6. TEM images for the corresponding structure images of 2 nanoaggregates
(c = 3.0 × 10⁻⁵
M) in 6 days.
Figure S7. CD of 2 nanoaggregates structural evolution in the absence/presence of
Ca2+
ions in aqueous solutions (c = 3.0 × 10⁻⁵
M) in 6 days.
Figure S8. Time-dependent TEM images of 1-NPs (c = 3.0 × 10⁻⁵
M) incubated with
blood plasma.
Figure S9. CLSM images of 1-NPs and 2-NPs treated MCTs (MDA-MB-231 cells).
Figure S10. SEM images of 1-NPs and 2-NPs treated different cells surfaces with
untreated cells as control.
Figure S11. Quantitative analysis of CLSM images of MDA-MB-231 (breast cancer
cells), B16-F10 (melanoma cells), HUVECs (endothelial cells), L929 (normal fibro-
blasts) incubated with 1-NPs and 2-NPs (2 h).
Figure S12. SEM images of 1-NPs and 2-NPs transformation from nanoparticles to
nanofibers on MDA-MB-231 cell surfaces. Line 1, Blank MDA-MB-231 cells, line 2
and 3 line were 2-NPs and 1-NPs treated MDA-MB-231 cells for 3 h, respectively.
Figure S13. SEM images of 1-NPs and 2-NPs transformation from nanoparticles to
nanofibers on B16-F10 cell surfaces. Line 1, Blank B16-F10 cells, line 2 and 3 line
were 2-NPs and 1-NPs treated B16-F10 cells for 3 h, respectively.
Figure S14. SEM images of 1-NPs and 2-NPs transformation from nanoparticles to
nanofibers on HUVECs cell surfaces. Line 1, Blank HUVECs cells, line 2 and 3 line
were 2-NPs and 1-NPs treated HUVECs cell for 3 h, respectively.
Figure S15. SEM images of 1-NPs and 2-NPs transformation from nanoparticles to
nanofibers on L929 cell surfaces. Line 1, Blank L929 cells, line 2 and 3 line were
2-NPs and 1-NPs treated L929 cells for 3 h, respectively.
Figure S16. The cell viability of 1-NPs and 2-NPs for different cells. a)
MDA-MB-231, b) B16-F10, c) HUVECs, d) L929.
Figure S17. Microscopy images of wound healing before a) and after different treat-
ments: control b), 2-NPs c), 1-NPs d).
Figure S18. Biological effect of 1-NPs and 2-NPs. Microscopy images of wound
healing a) migration c) and invasion e) and quantitative analysis (b, d, f respectively)
of B16-F10 cells that passed through the membrane. The first column, the control
group without any treatment, the second and third columns, incubated with 1-NPs,
1-NPs for 24 h, respectively, **p < 0.01, ***p < 0.001.
Figure S19. Flow cytometry analysis of apoptosis of MDA-MB-231 cells induced by
1-NPs and 2-NPs.
Figure S20. Representative photomicrographs of the heart, liver, spleen and kidney
sections (H&E staining) of MDA-MB-231 tumor-bearing mice treated 1-NPs, 2-NPs,
RGD+YIGSR and PBS, respectively.
Figure S21. The number of lung metastases a), body weight b) and tumor volume c)
of 1-NPs (50 µM), 2-NPs (50 µM), RGD+YIGSR (50 µM) and PBS treated mice.
Figure S22. The number of lung metastases a), body weight b) and tumor volume c)
of 1-NPs (200 µM), 2-NPs (200 µM), RGD+YIGSR (200 µM) and PBS treated mice.
Figure S23. In vivo therapeutic effect of transformable 1-NPs in a B16-F10 melano-
ma tumor metastasis model and 2-NPs, RGD+YIGSR, PBS treated groups as controls.
a) Representative photomicrographs of the heart, liver, spleen, kidney and lung sec-
tions (H&E staining) and tumor (CD-31 staining) of mice treated 1-NPs, 2-NPs,
RGD+YIGSR and PBS, respectively. The body weight b) and the tumor volume c) of
1-NPs, 2-NPs, RGD+YIGSR and PBS treated mice. d) The quantitative analysis of
lungs from a). e) The quantitative analysis of MVD from a). Data was given as mean
± SD (n = 4). *p < 0.05, **p < 0.01 and ***p < 0.001.
1. Experimental Section
1.1. Materials
Materials: All reagents and solvents for organic synthesis were purchased from
commercially available sources and used without further purification unless otherwise
stated. O-(benzotriazol-1-yl)-N, N, N’, N’-tetramethyluronium hexafluorophosphate
(HBTU), piperidine, 4-methylmorpholine (NMM), 2, 5-dihydroxybenzoic acid (DHB),
trifluoroacetic acid (TFA) were purchased from Sigma-Aldrich Chemical Co. All
Fmoc-amino acids and Wang-resins were obtained from GL Biochem. (Shanghai) Ltd.
Cell counting kit-8 assay (CCK-8) was obtained from Beyotime Institute of Biotech-
nology, China. The cell lines MDA-MB-231, B16-F10, HUVECs, L929 were pur-
chased from cell culture center of Institute of Basic Medical Sciences, Chinese
Academy of Medical Sciences (Beijing, China). Cell culture medium and fetal bovine
serum (FBS) were from Wisent Inc. (Multicell, Wisent Inc., St. Bruno, Quebec, Can-
ada). 0.25% Trypsin-EDTA and antibiotic solution (penicillin and streptomycin) were
purchased from Invitrogen (Invitrogen, Carlsbad, CA). Culture dishes and plates were
from Corning (Corning, New York, USA). Dichloromethane (DCM) and N,
N-dimethylformamide (DMF) were distilled over CaH2 and stored under Ar. Silica
gel (200-300 mesh). Distilled and deionized water was used throughout the work.
1.2. Methods
Mass spectrometry (MS) Measurement: Mass spectra were acquired on a MAL-
DI-TOF-MS using a Microflex LRF System spectrometer (Bruker Daltonics) under
positive-ion mode.
UV-vis spectroscopy: UV-vis absorption spectra were recorded on a Shimadzu 2600
UV-vis spectrophotometer. Spectroscopic studies of solvents were spectroscopic grade
and used as received. The spectra were recorded in quartz glass cuvettes and accord-
ing to Lambert-Beer’s law the extinction coefficients were calculated.
Fluorescence spectroscopy: A F-280 spectrofluorometer was used for fluorescence
spectroscopic studies. These samples (1 mL) were added in a quartz cuvette (1 cm
path length) and the measurements were carried out at room temperature. The emis-
sion spectra (λex = 340 nm) were recorded between 370 and 675 nm.
CD spectroscopy: The CD spectra were recorded by J-810 Circular Dichroism Spec-
trometer (Jasco, Japan).
Dynamic light scattering (DLS): DLS measurements were performed at room tem-
perature on a Delsa Nano C Particle Analyzer (Beckman Coulter) with 25 mW He-Ne
solid state laser (660 nm).
Scanning electron microscope (SEM): High resolution scanning electron microscopy
images were acquired on Hitachi S4800+EDS under an acceleration voltage of 10.0
kV, a working distance of 5.0 mm.
Transmission electron microscopy (TEM): The measurements were performed on a
Tecnai G20 S-TWIN electron microscope operating at an acceleration voltage of 200
kV. For the observation of aggregates, a drop of sample solutions was placed on car-
bon-coated copper grids. The surface-deposited nanoparticles were negatively stained
with 2% uranyl acetate for 40 s before the TEM studies.
Cell culture: Cells were cultured in DMEM medium supplemented with 10% fetal
bovine serum (FBS) and 1% antibiotic solution (penicillin and streptomycin) at 37 °C
in an atmosphere containing 5% CO2.
Confocal laser scanning microscope (CLSM): The 1-NPs and 2-NPs treated cells
were investigated on a Zeiss LSM710 confocal laser scanning microscope (Jena,
Germany).
Cell cytotoxicity assay: Cells were seeded in a 96-well plate and incubated for 24 h.
Then cells were treated with materials with a serial of concentrations at 37 °C in a
humidified environment containing 5% CO2 for another 24 h. Cell Counting Kit
(CCK-8) was utilized to detect cell survival rate.
Wound healing assay: In monolayer culture, scratches produce callus area between
cells, and then monitor the cells growth to scratch to reflect the migration phenome-
non. The area of wound healing was photographed under a microscope (Leica
DMI6000B, Germany).
Migration assays and Invasion assays: Transwell chambers (Corning, China) were
placed in the corresponding culture plate. Upper and lower culture was apart by poly-
ethylene terephthalate (PET) membrane apart. As a result of PET membrane permea-
bility, the lower the composition in the culture can affect the interior of cells. This
method can study the lower the culture influence on cell growth, migration and inva-
sion.
Statistical analysis: Data are presented as the mean ± standard deviation (SD). Com-
parison between groups was analysis with the Student’s t-test. Differences were con-
sidered statistically significant when the p value was less than 0.05 (p < 0.05). The
level of significance was defined at *p < 0.05, **p < 0.01 and ***p < 0.001.

1.3. Synthesis and characterization
1.3.1. Synthesis and characterization of peptide 1 and 2
Scheme S1. Synthetic route of peptide 1 and 2. (i) Fmoc/tBu SPPS: Piperidine/DMF
(1:4); Fmoc-Xaa-OH, NMM, HBTU, DMF; (ii) BP-COOH, NMM, HBTU, DMF; (iii)
Hydrazinium hydrate/DMF (1:50); Fmoc-Xaa-OH, NMM, HBTU, DMF; (iv)
TFA/H2O/EDT (92.5:2.5:2.5).
1.3.2. Self-assembly characterization and preparation of 1-NPs and 2-NPs
The peptide 1 was dissolved in DMSO to form solution (1.5 × 10⁻³
M). The 20 µL of
peptide 1 solutions were further diluted with DMSO (880, 680, 480, 280, 80, 0 µL)
and mixed with deionized water (100, 300, 500, 700, 900, 980 µL), respectively.
The UV-vis and fluorescence of 0%, 10%, 30%, 50%, 70%, 90%, 98% aqueous solu-
tion were measured to validate the formation of 1-NPs and 2-NPs

1.4. Morphological transformation in solution and in vitro
1.4.1. Transmission elelctron microscope (TEM) charaterization in solution
The peptide 1 or 2 was dissolved in DMSO with a concentration of 1.5 × 10⁻³
M. The
peptide 1 or 2 solution (20 µL) was added into deionized water (980 µL), followed by
addition of CaCl2 aqueous solutions with concentration of 3 × 10⁻⁵
M. The resulting
samples (at 0 d, 2 d and 6 d) were drop-coated onto carbon-coated copper grids. After
contacting the droplets with copper grids for 5 min, excess droplets were removed
using filter papers. The uranyl acetate was drop-coated onto carbon-coated copper
grids for 40 s, excess droplets were removed using filter papers. All samples were
dried under vacuum before the TEM studies.
1.4.2. Dynamic light scattering (DLS) charaterization in solution
The sizes of samples were calculated by average values of at least triple measure-
ments. The measurements were performed at 25 °C with a detection angle of 90° and
the raw data were subsequently correlated to Z average mean size using a cumulative
analysis by the Zeta sizer software package.
1.4.3. Scanning electron microscope (SEM) for morphological transformation on
cell surfaces
The morphologies of 1-NPs or 2-NPs treated cells were directly examined using SEM.
The SEM samples were prepared by performing 1-NPs or 2-NPs (3.0 × 10⁻⁵
M) incu-
bation with cells in DMEM (1 mL) on silicon wafer. After contacting the solution
with silicon water for 1 h, an excess amount of solution were removed. Subsequently,
the cells were solidified with glutaraldehyde (4%) overnight and then coated by gold
for 2 min.
1.4.4. Confocal laser scanning microscopy (CLSM) validation of 1-NPs and
2-NPs structural transformation on cell surfaces
The 1-NPs or 2-NPs reconstruction on cells surfaces were investigated on a Zeiss
LSM710 confocal laser scanning microscope (Jena, Germany). The cells were cul-
tured for 12 h in glass bottom dishes. The same concentration of 1-NPs or 2-NPs (3 ×
10-5
M) were incubated with cells (1 × 10⁵ cells/mL) in DMEM at 37 °C for 2 h, fol-
lowed by washing with PBS for 3 times. Then, the cells were the cells were solidified
with glutaraldehyde (4%) 10 min and washed with PBS for 3 times. Finally, the cells
were cultured with PBS for measurements. The specimens were examined by confo-
cal laser scanning microscopy with a × 40 immersion objective lens using a 405 nm
laser for 1-NPs or 2-NPs.
1.4.5 Multicellular tumor spheroids (MCTs) experiment
MCTs were prepared in 96-well plates. At the bottom of each well was added 50 µL
agarose, after sterilization, 1600 cells per well were inoculated. It was observed that
cells get together into balls after 4 days. 1-NPs or 2-NPs (30 µM) were added to in-
cubate for 24 h. Finally, the cells were cultured with DMEM for CLSM measure-
ments.
1.5. Inhibition effect of 1-NPs and 2-NPs for tumor cells invasion and metastasis
in vitro
1.5.1. The cell viability of 1-NPs and 2-NPs for different cells
Cells were seeded in a 96-well plate (1×10⁴ cells/well) and incubated for 24 h. Then
cells were treated with 1-NPs or 2-NPs at serial concentrations at 37 °C in a humidi-
fied environment containing 5% CO2 for another 24 h. After washing with PBS twice,
10 µL CCK-8 solutions was added to each well and cultured for 2 h. The UV-vis ab-
sorptions of each well were measured using a Microplate reader at a test wavelength
of 450 nm and a reference wavelength of 690 nm, respectively. Cell viability (%) was
calculated and data were presented as mean ± standard deviation (SD) in triplicate.
Flow cytometry analysis of MDA-MB-231 cells upon treatment 1-NPs and 2-NPs
were carried out on BD FACSAriaIII.
1.5.2. Wound healing assay
For wound healing assay, MDA-MB-231 cells or B16-F10 cells seeded in 12-well
plates were incubated 24 h while cells cover 70~80% of the dish surface. Then the
confluent cell monolayers were wounded with a P200 pipette tip and cells were
washed with PBS twice and incubated with 1-NPs or 2-NPs at the concentration of 30
µM for another 24 h. The area of wound healing was photographed under a micro-
scope. We utilized the wound width calculated the degree of wound healing.

1.5.3. Migration and invasion assay
In migration experiment, the number of MDA-MB-231 cells or B16-F10 cells were 1
× 106 plated to the top chambers of transwell without Matrigel. MDA-MB-231 or
B16-F10 cells were removed serum medium and suspended in serum-free medium for
12 h. Then the lower chambers were added with 500 mL medium as a chemoattractant.
After incubation with 1-NPs, 2-NPs or culture medium for 24 h, the cells that did not
migrate or invade in the upper wells were removed with a cotton swab. Cells passed
through the membrane on the lower surface were fixed with anhydrous methanol,
stained with crystal violet.
In invasion experiment, MDA-MB-231 cells or B16-F10 cells were removed serum
medium and suspended in serum-free medium for 12 h. After trypsinized, 1 × 10⁵
cells suspended in serum-free medium were plated to the top chambers of transwell
coated with Matrigel (BD Biosciences) and 500 µL 10% FBS in medium was added to
lower chamber and incubated with 1-NPs, 2-NPs or culture medium for 24 h. The ar-
ea of migration and invasion was photographed under a microscope.
1.6. Biological effect of 1-NPs and 2-NPs in vivo
1.6.1. Distribution of 1-NPs and 2-NPs in tumor in vivo
The mice were treated with 200 µL of 1-NPs (100 µM per mouse), 2-NPs (100 µM
per mouse) and PBS through intravenous injection when the tumor volume reaching
100 mm3. The fluorescence imaging of mice at 4, 10, 24, 48, 72 h were monitored by
CRI maestro 2 multispectral fluorescence small animal in vivo imaging system.
1.6.2. Ex vivo fluorescence imaging
The major organs heart, liver, spleen, lung, kidney showed negligible fluorescence,
indicating the tumor-targeting biodistribution. After the mice were treated with 200
µL of 1-NPs (100 µM per mouse), 2-NPs (100 µM per mouse) and PBS through in-
travenous injection. The mice were scarified and the major organs were collected. The
fluorescence imaging of major organs was monitored by CRI maestro 2 multispectral
fluorescence small animal in vivo imaging system.
1.6.3. Fluorimetric assay for plasma concentration of BP
The blood (20 µL) was collected from the mouse tail, and blood plasma (40 µL) was
further separated by centrifugation upon the addition of anticoagulation (40 µL, 15g/L
EDTA). The resultant blood plasma was diluted with 120 µL PBS for fluorescence
measurements.
1.6.4. In vivo therapeutic effect
All animal experiments were performed complying with the NIH guidelines for the
care and use of laboratory animals of Peking University Animal Study Committee’s
requirements and according to the protocol approved by the Institutional Animal Care.
Balb/c nude mice with MDA-MB-231cell (5 × 10⁶ cells per mouse) tumors inoculated
on their right side of the mammary gland were used in our experiments. The mice
were divided into four groups 7-day post tumor inoculation. Each of them treated with
1-NPs, 2-NPs, RGD+YIGSR, PBS every 72 h via intravenous administration. During
the process of the treatment, the tumor volumes and body weight were measured once
every two days.

2. Supporting Figures
Figure S1. MALDI-TOF mass spectrum of peptide 1.

Figure S2. MALDI-TOF mass spectrum of peptide 2.

Figure S3. UV-vis spectra characteristics of self-assembly process to form 2-NPs in
mixed H2O/DMSO solutions (c = 3.0 × 10⁻⁵
M).
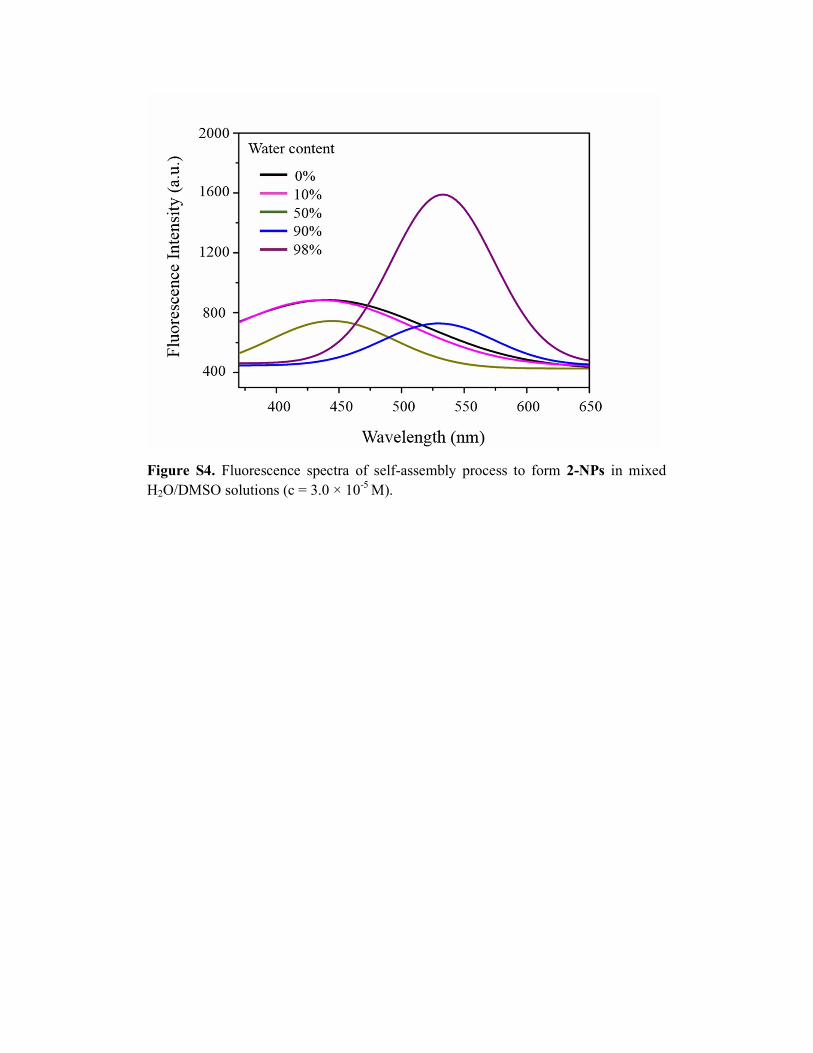
Figure S4. Fluorescence spectra of self-assembly process to form 2-NPs in mixed
H2O/DMSO solutions (c = 3.0 × 10⁻⁵
M).

Figure S5. DLS of 2 nanoaggregates structural evolution in the absence/presence of
Ca2+
ions in aqueous solutions (c = 3.0 × 10⁻⁵
M) in 6 days.
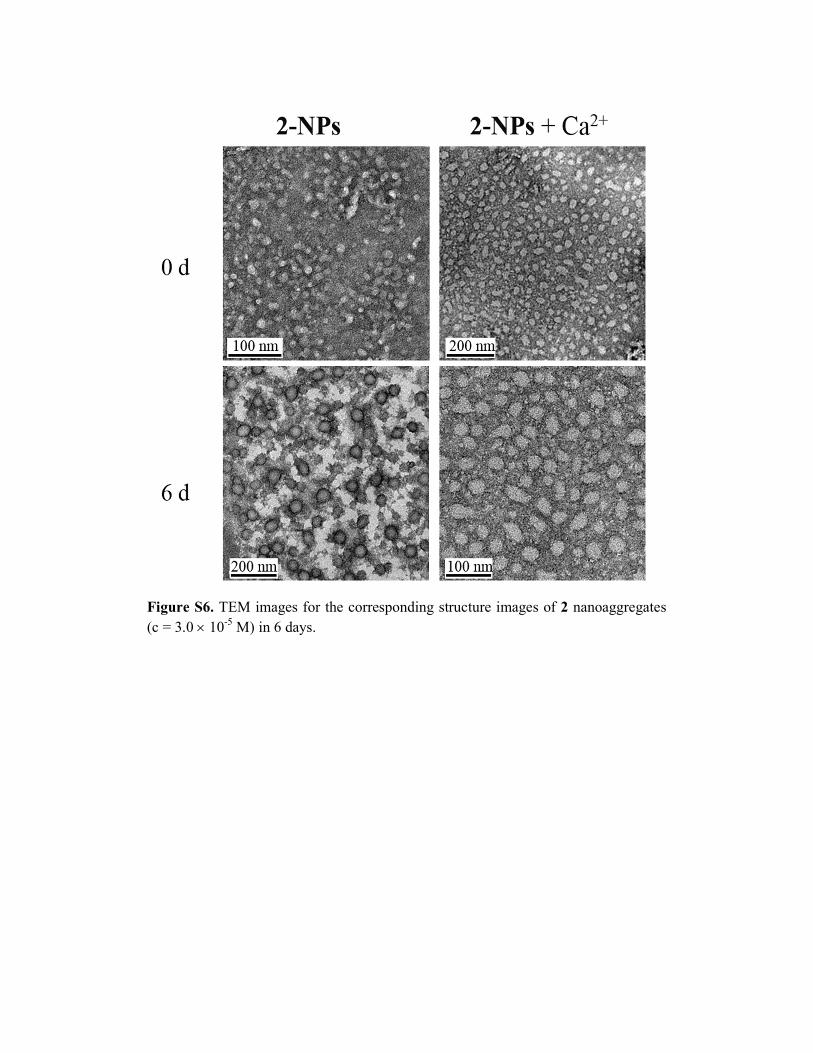
Figure S6. TEM images for the corresponding structure images of 2 nanoaggregates
(c = 3.0 × 10⁻⁵
M) in 6 days.
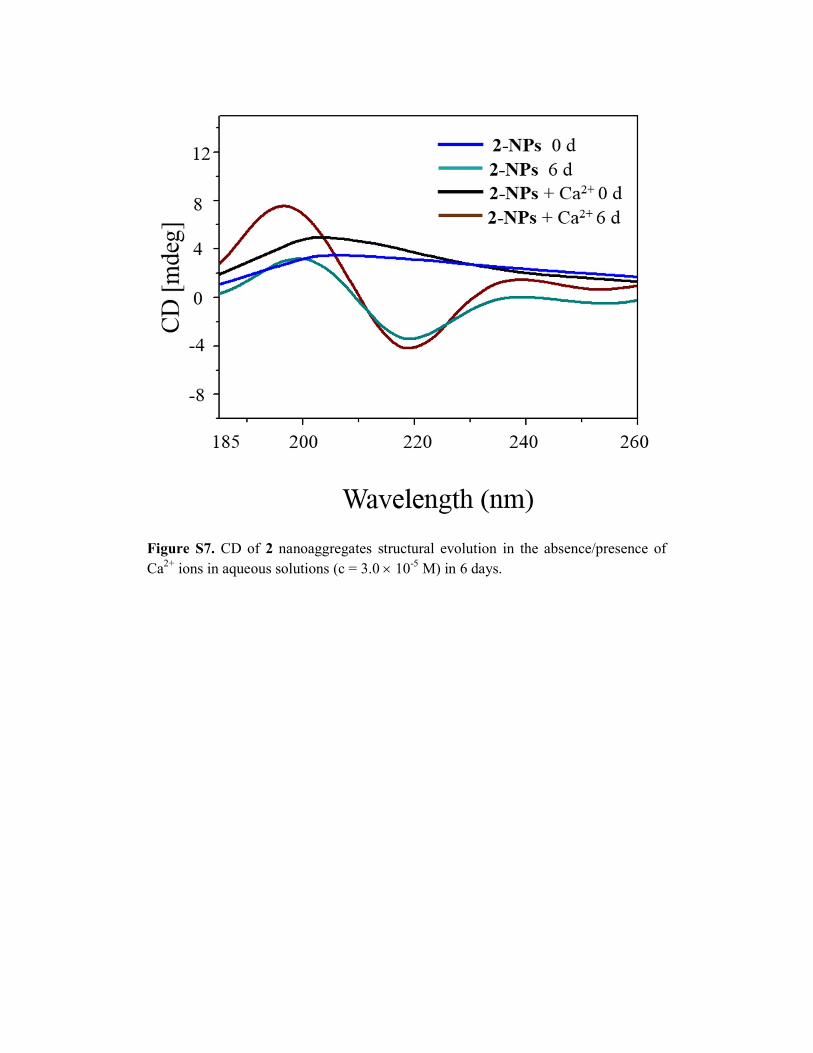
Figure S7. CD of 2 nanoaggregates structural evolution in the absence/presence of
Ca2+
ions in aqueous solutions (c = 3.0 × 10⁻⁵
M) in 6 days.

Figure S8. Time-dependent TEM images of 1-NPs (c = 3.0 × 10⁻⁵
M) incubated with
blood plasma.
Figure S9. CLSM images of 1-NPs and 2-NPs treated MCTs (MDA-MB-231 cells).

Figure S10. CLSM images of MDA-MB-231 (breast cancer cells), B16-F10 (mela-
noma cells), HUVECs (endothelial cells), L929 (normal fibroblasts) incubated with
1-NPs and 2-NPs (2 h).
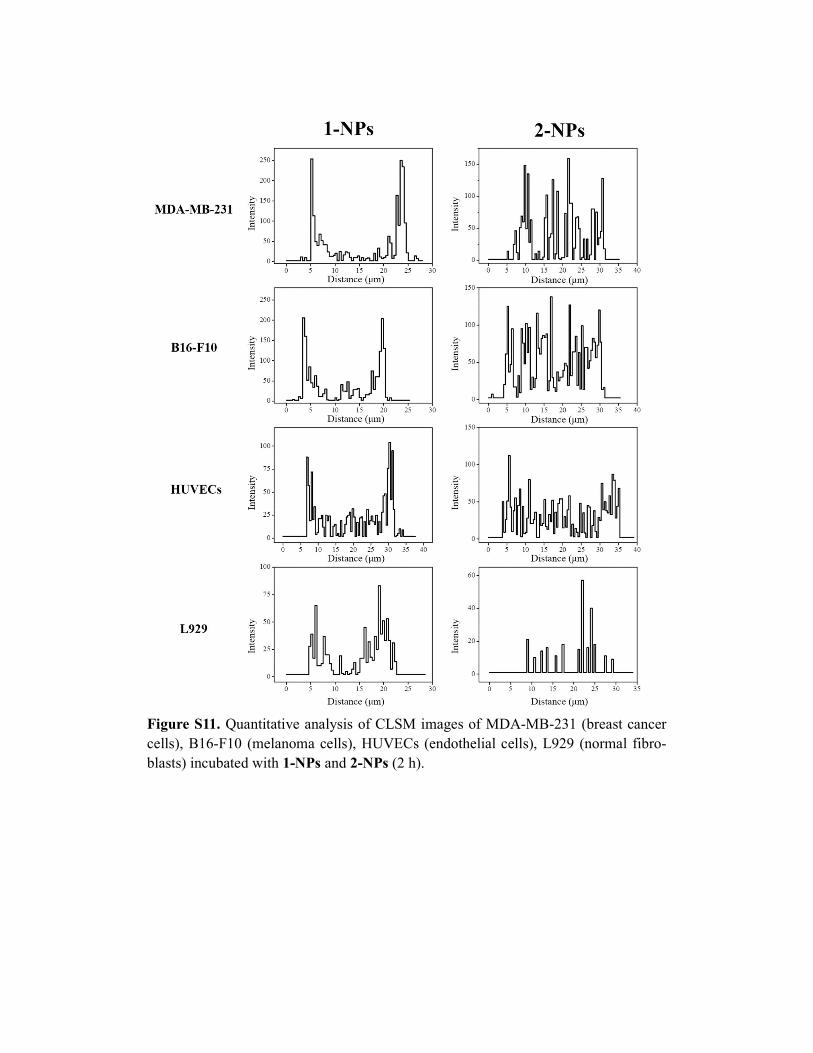
Figure S11. Quantitative analysis of CLSM images of MDA-MB-231 (breast cancer
cells), B16-F10 (melanoma cells), HUVECs (endothelial cells), L929 (normal fibro-
blasts) incubated with 1-NPs and 2-NPs (2 h).
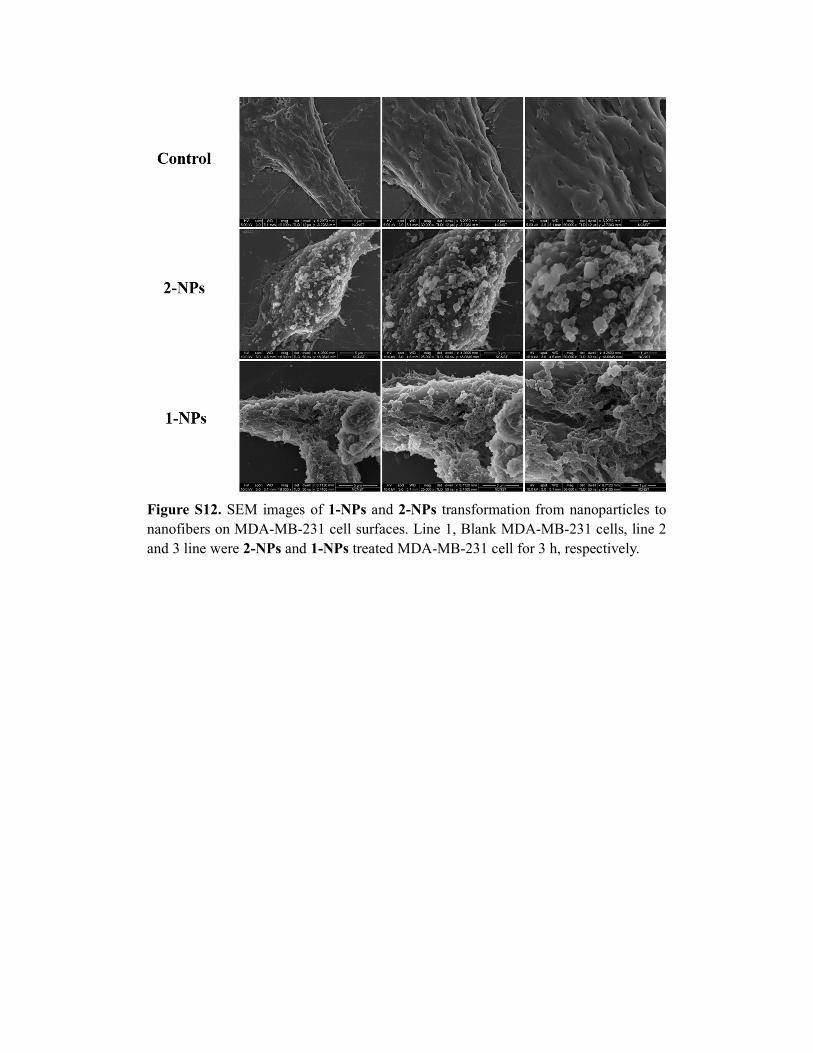
Figure S12. SEM images of 1-NPs and 2-NPs transformation from nanoparticles to
nanofibers on MDA-MB-231 cell surfaces. Line 1, Blank MDA-MB-231 cells, line 2
and 3 line were 2-NPs and 1-NPs treated MDA-MB-231 cell for 3 h, respectively.

Figure S13. SEM images of 1-NPs and 2-NPs transformation from nanoparticles to
nanofibers on B16-F10 cell surfaces. Line 1, Blank B16-F10 cells, line 2 and 3 line
were 2-NPs and 1-NPs treated B16-F10 cells for 3 h, respectively.

Figure S14. SEM images of 1-NPs and 2-NPs transformation from nanoparticles to
nanofibers on HUVECs cell surfaces. Line 1, Blank HUVECs cells, line 2 and 3 line
were 2-NPs and 1-NPs treated HUVECs cell for 3 h, respectively.

Figure S15. SEM images of 1-NPs and 2-NPs transformation from nanoparticles to
nanofibers on L929 cell surfaces. Line 1, Blank L929 cells, line 2 and 3 line were
2-NPs and 1-NPs treated L929 cells for 3 h, respectively.

Figure S16. The cell viability of 1-NPs and 2-NPs for different cells. a)
MDA-MB-231, b) B16-F10, c) HUVECs, d) L929.
Figure S17. Microscopy images of wound healing before a) and after different treat-
ments of MDA-MB-231: control b), 2-NPs c), 1-NPs d).

Figure S18. Biological effect of 1-NPs and 2-NPs. Microscopy images of wound
healing a), migration c) and invasion e), and quantitative analysis (b, d, f respectively)
of B16-F10 cells that passed through the membrane. The first column, the control
group, without any treatment, the 2 and 3 columns, incubated with 1-NPs, 1-NPs for
24 h, respectively, **p < 0.01, ***p < 0.001.
Figure S19. Flow cytometry analysis of apoptosis of MDA-MB-231 cells induced by
1-NPs and 2-NPs.
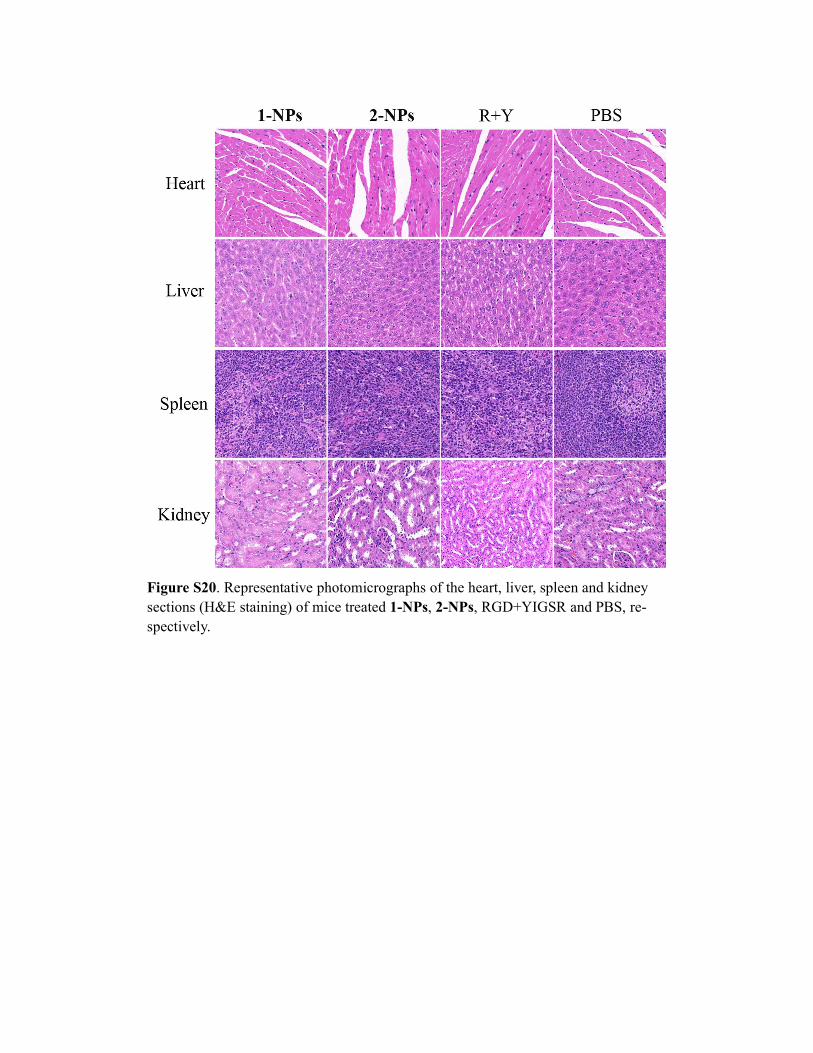
Figure S20. Representative photomicrographs of the heart, liver, spleen and kidney
sections (H&E staining) of mice treated 1-NPs, 2-NPs, RGD+YIGSR and PBS, re-
spectively.

Figure S21. The number of lung metastases a), body weight b) and tumor volume c)
of 1-NPs (50 µM), 2-NPs (50 µM), RGD+YIGSR (50 µM) and PBS treated mice.
Figure S22. The number of lung metastases a), body weight b) and tumor volume c)
of 1-NPs (200 µM), 2-NPs (200 µM), RGD+YIGSR (200 µM) and PBS treated mice.

Figure S23. In vivo therapeutic effect of transformable 1-NPs in a B16-F10 melano-
ma tumor metastasis model and 2-NPs, RGD+YIGSR, PBS treated groups as controls.
a) Representative photomicrographs of the heart, liver, spleen, kidney and lung sec-
tions (H&E staining) and tumor (CD-31 staining) of mice treated 1-NPs, 2-NPs,
RGD+YIGSR and PBS, respectively. The body weight b) and the tumor volume c) of
1-NPs, 2-NPs, RGD+YIGSR and PBS treated mice. d) The quantitative analysis of
lungs from a). e) The quantitative analysis of MVD from a). Data was given as mean
± SD (n = 4). *p < 0.05, **p < 0.01 and ***p < 0.001.