Equivalent Ratios How to Determine and Find Equivalent Ratios.
Transfer function based equivalent modeling method for windfarm
Feng WU1 , Junxia QIAN1, Ping JU1, Xiaoping ZHANG2,
Yuqing JIN1, Dan XU1, Michael STERLING2
Abstract To effectively study the dynamics of power
systems with large-scale wind farms (WFs), an equivalent
model needs to be developed. It is well known that back-to-
back converters and their controllers are important for the
dynamic responses of the wind turbine (WT) under dis-
turbances. However, the detailed structure and parameters
of the back-to-back converters and their controllers are
usually unknown to power grid operators. Hence, it is
difficult to build an accurate equivalent model for the WF
using the component model-based equivalent modeling
method. In this paper, a transfer function based equivalent
modeling method for the WF is proposed. During model-
ing, the detailed structure and parameters of the WF are not
required. The objective of the method is reproducing the
output dynamics of the WF under the variation of the wind
speed and power grid faults. A decoupled parameter-esti-
mation strategy is also developed to estimate the parame-
ters of the equivalent model. A WF that consists of 16 WTs
is used to test the proposed equivalent model. Additionally,
the proposed equivalent modeling method is applied to
build the equivalent model for a real WF in Northwest
China. The effectiveness of the proposed method is vali-
dated by the real measurement data.
Keywords Wind farm, Equivalent modeling, Transfer
function, Parameter estimation, Particle swarm
optimization
1 Introduction
Wind energy generation is developing very quickly.
Many large-scale wind farms (WFs) have been integrated
into the power grid, and they have had significant impact
on the operation of the power grid [1]. The model of the
WF is a major factor in evaluation; however, it has been
widely recognized that it is inefficient to model each wind
turbine (WT) in the WF in the dynamic simulation of the
power grid integrated with large scale WFs. Hence, the
equivalent model of the WF needs to be built to improve
the efficiency of the simulation [2].
Many studies have been carried out to build the equiv-
alent model for the WF. A one-machine equivalent model
was developed in [3, 4] to represent the WF. Simulations
showed that the dynamic responses of the aggregated
model were very close to those of the detailed model under
CrossCheck date: 12 March 2018
Received: 28 July 2017 / Accepted: 12 March 2018 / Published online:
7 May 2018
� The Author(s) 2018
& Feng WU
Junxia QIAN
Ping JU
Xiaoping ZHANG
Yuqing JIN
Dan XU
Michael STERLING
1 College of Energy and Electrical Engineering, Hohai
University, Nanjing 210098, China
2 Department of Electronic, Electrical and Computer
Engineering, University of Birmingham, Birmingham
B15 2TT, UK
123
J. Mod. Power Syst. Clean Energy (2019) 7(3):549–557
https://doi.org/10.1007/s40565-018-0410-8

the disturbances of wind speed change and grid fault and
the computational complexity was reduced significantly,
but the impact factors were not discussed. In [5], the
parameter calibration was performed when WF was large,
with variations in the wind speed received by the individual
WTs, the type of WTs installed in the WF, and the impe-
dance of the collector system. After calibration, the accu-
racy of the one-machine model was improved under
different conditions. In [6], 150 WTs in an offshore WF
were separated into three equal groups, and a three-ma-
chine equivalent model was proposed to represent WF. The
WT cluster method is very simple, and it is also difficult to
carry out the parameter estimation for three machines. For
the equivalent models mentioned above, the details of the
WTs, collector network, and control system must be known
before the equivalence, which is very difficult for power
system operators.
The recently developed WTs, such as the WT with the
doubly fed induction generator (DFIG) or direct drive
permanent magnet generator, are interfaced to the power
grid through the back-to-back converters, which decouple
the inertia dynamics of the WT from the power grid.
Hence, from the power grid’s perspective, the dynamics of
the WF are different from those of the traditional power
plants, which are normally connected to the power grid
directly. The converters and their controllers play impor-
tant roles in the dynamic responses of the WTs under the
conditions of power system faults and wind speed changes.
For the installed WTs, it is difficult for the power grid
operators to know the details of the WF, especially the
structure of the controllers and their parameters. In this
condition, the traditional equivalent modeling method
based on the component models of the WT is not suit-
able to aggregate the dynamic models of the WF. Hence, it
is necessary to study the equivalent modeling method for
the WF [7].
The transfer function based equivalent modeling
method has been widely used in equivalent modeling for
power systems. This model has been successfully used to
aggregate the dynamics of the electrical load and excitation
system of the synchronous generator in [8] and [9],
respectively. When using the transfer function to build the
equivalent model, the object is regarded as a ‘‘black box’’
or a ‘‘grey box.’’ The dynamics of the input and output of
the object are used to build the equivalent model, while the
details of its structure and parameters are not required.
Hence, the transfer function based equivalent modeling
method is suitable to be used to aggregate the dynamics of
the WF.
In this paper, a transfer function based equivalent model
is proposed to represent the dynamics of the WF under the
power grid fault and wind speed variation. The coherence
of the WTs in the WF are discussed to examine whether the
conditions of the aggregation are satisfied. A decoupled
parameter-estimation strategy is also developed, and par-
ticle-swarm optimization (PSO) is applied to estimate the
parameters of the equivalent model of the WF. A WF
consisting of 16 WTs with DFIG is built in MATLAB, and
simulations are performed to test the proposed transfer
function based equivalent model. The field-measured
dynamics are also used to build the equivalent model for a
real WF. The proposed equivalent model is hence
validated.
2 Transfer function based equivalent modelfor WF
The output power of the WF changes under power
system faults and variation of the wind speed. During a
system fault, the terminal voltage drops sharply, and the
output power of the WF changes quickly, which mainly
depends on the control capability of the back-to-back
converters and their controllers; when the wind speed
varies, the output power of the WF changes with a short
time delay because of the inertia of the WTs.
The equivalent model is built to describe the dynamics
of the WF under both the system fault and wind speed
variation. Because the output power of the WF changes
quickly with the terminal voltage, the WF is regarded as a
nonlinear equivalent impedance. Hence, the output power
is proportional to the square of the terminal voltage.
According to the aerodynamics of the WT, the output
power is proportional to the cube of the wind speed. Hence,
taking the terminal voltage and wind speed as the input,
and the active power and reactive power of the WF as the
output of the equivalent model, the transfer function based
equivalent model for the WF is written as:
P ¼ P0 HpuðsÞU
U0
� �2" #
HpvðsÞv
v0
� �3" #
Q ¼ Q0 HquðsÞU
U0
� �2" #
HqvðsÞv
v0
� �3" #
8>>>>><>>>>>:
ð1Þ
where P and Q are the output active power and reactive
power of the WF, respectively; U and U0 are the terminal
voltage of the WF and its initial value, respectively; v and
v0 are the input wind speed and its initial value,
respectively; Hpu, Hpv, Hqu and Hqv are the transfer
functions, and the uniform of the transfer functions can
be written as follows:
550 Feng WU et al.
123
HðsÞ ¼ bmsm þ bm�1s
m�1 þ � � � þ b0
sn þ an�1sn�1 þ � � � þ a0ð2Þ
where bm, bm-1, …, b0, an-1, an-2, …, a0 are the constant
coefficients; m� n; a0=b0.
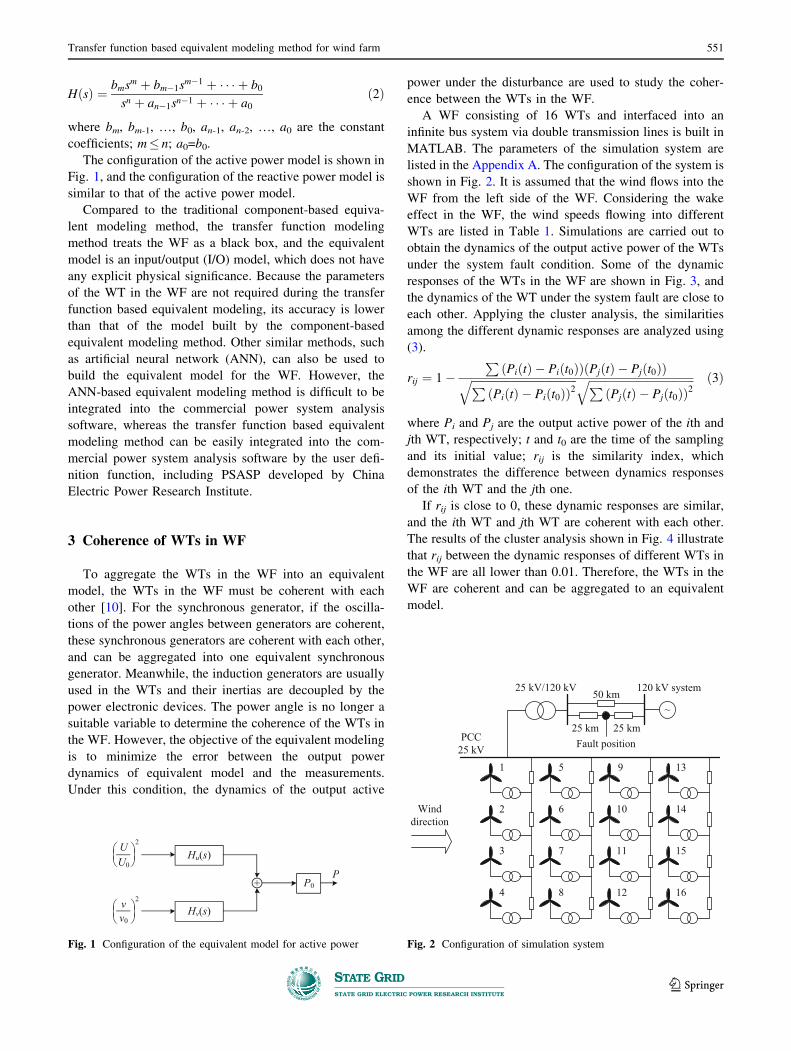
The configuration of the active power model is shown in
Fig. 1, and the configuration of the reactive power model is
similar to that of the active power model.
Compared to the traditional component-based equiva-
lent modeling method, the transfer function modeling
method treats the WF as a black box, and the equivalent
model is an input/output (I/O) model, which does not have
any explicit physical significance. Because the parameters
of the WT in the WF are not required during the transfer
function based equivalent modeling, its accuracy is lower
than that of the model built by the component-based
equivalent modeling method. Other similar methods, such
as artificial neural network (ANN), can also be used to
build the equivalent model for the WF. However, the
ANN-based equivalent modeling method is difficult to be
integrated into the commercial power system analysis
software, whereas the transfer function based equivalent
modeling method can be easily integrated into the com-
mercial power system analysis software by the user defi-
nition function, including PSASP developed by China
Electric Power Research Institute.
3 Coherence of WTs in WF
To aggregate the WTs in the WF into an equivalent
model, the WTs in the WF must be coherent with each
other [10]. For the synchronous generator, if the oscilla-
tions of the power angles between generators are coherent,
these synchronous generators are coherent with each other,
and can be aggregated into one equivalent synchronous
generator. Meanwhile, the induction generators are usually
used in the WTs and their inertias are decoupled by the
power electronic devices. The power angle is no longer a
suitable variable to determine the coherence of the WTs in
the WF. However, the objective of the equivalent modeling
is to minimize the error between the output power
dynamics of equivalent model and the measurements.
Under this condition, the dynamics of the output active
power under the disturbance are used to study the coher-
ence between the WTs in the WF.
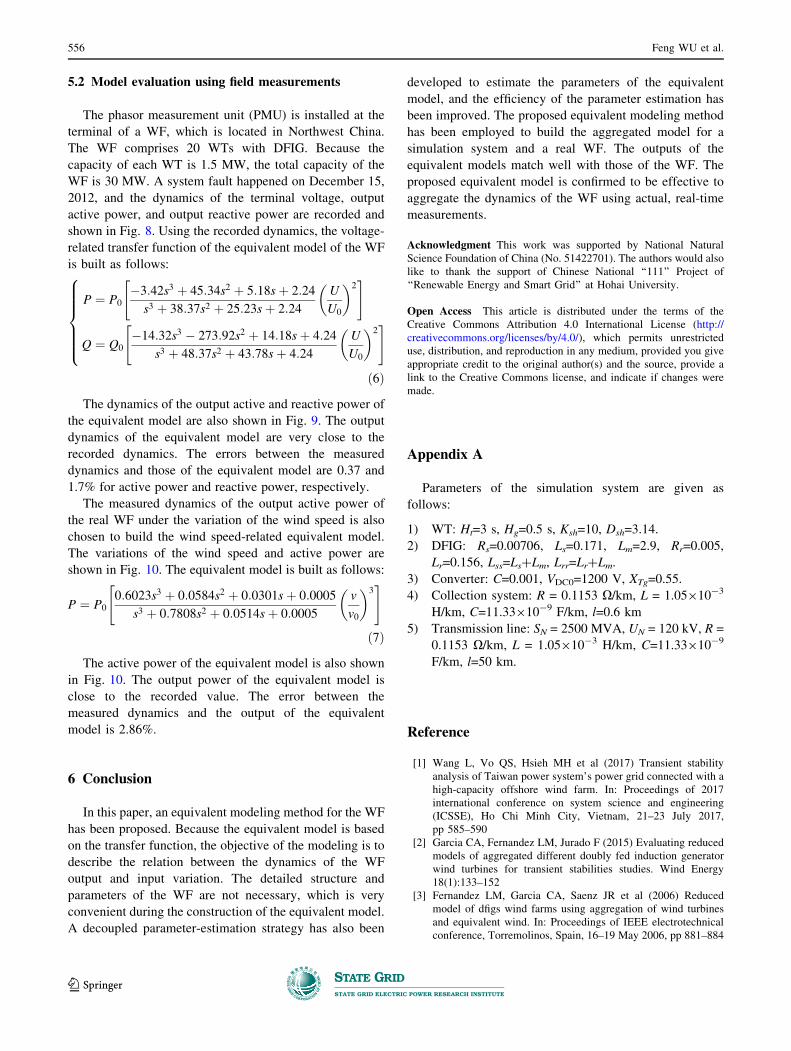
A WF consisting of 16 WTs and interfaced into an
infinite bus system via double transmission lines is built in
MATLAB. The parameters of the simulation system are
listed in the Appendix A. The configuration of the system is
shown in Fig. 2. It is assumed that the wind flows into the
WF from the left side of the WF. Considering the wake
effect in the WF, the wind speeds flowing into different
WTs are listed in Table 1. Simulations are carried out to
obtain the dynamics of the output active power of the WTs
under the system fault condition. Some of the dynamic
responses of the WTs in the WF are shown in Fig. 3, and
the dynamics of the WT under the system fault are close to
each other. Applying the cluster analysis, the similarities
among the different dynamic responses are analyzed using
(3).
rij ¼ 1�P
ðPiðtÞ � Piðt0ÞÞðPjðtÞ � Pjðt0ÞÞffiffiffiffiffiffiffiffiffiffiffiffiffiffiffiffiffiffiffiffiffiffiffiffiffiffiffiffiffiffiffiffiffiffiffiffiffiffiPðPiðtÞ � Piðt0ÞÞ2
q ffiffiffiffiffiffiffiffiffiffiffiffiffiffiffiffiffiffiffiffiffiffiffiffiffiffiffiffiffiffiffiffiffiffiffiffiffiffiPðPjðtÞ � Pjðt0ÞÞ2
q ð3Þ
where Pi and Pj are the output active power of the ith and
jth WT, respectively; t and t0 are the time of the sampling
and its initial value; rij is the similarity index, which
demonstrates the difference between dynamics responses
of the ith WT and the jth one.
If rij is close to 0, these dynamic responses are similar,
and the ith WT and jth WT are coherent with each other.
The results of the cluster analysis shown in Fig. 4 illustrate
that rij between the dynamic responses of different WTs in
the WF are all lower than 0.01. Therefore, the WTs in the
WF are coherent and can be aggregated to an equivalent
model.
Fig. 1 Configuration of the equivalent model for active power
1 5 9 13
2 6
3 7
4 8
10 14
1612
1511
25 kV/120 kV 50 km
25 km 25 kmPCC
25 kV
120 kV system
Fault position
Wind direction
~
Fig. 2 Configuration of simulation system
Transfer function based equivalent modeling method for wind farm 551
123

4 Decoupling parameter-estimation strategyfor equivalent model
The parameters of the transfer function based equivalent
model include the parameters Hpu(s), Hpv(s), Hqu(s) and
Hqv(s). There are tens of parameters in the equivalent
model to be estimated. If all these parameters are estimated
simultaneously, it is difficult for the parameter-estimation
method to converge. Hence, the decoupled parameter-es-
timation strategy must be developed to obtain the param-
eters of the equivalent model.
Fortunately, as mentioned in Section 2, the dynamics of
the WF under the system fault are much faster than those
under the variation of the wind speed. In other words, they
are decoupled with each other between time scales. The
decoupling parameter-estimation strategy is proposed as
follows.
When the parameters of the voltage-related transfer
function Hpu(s) and Hqu(s) are estimated, the wind speed is
assumed to be constant; when the parameters of the wind
speed-related transfer function Hpv(s) and Hqv(s) are esti-
mated, the terminal voltage of the WF is assumed to be
constant. Additionally, the active power-related transfer
function and the reactive power-related transfer function
are independent of each other because of the decoupling
control strategy, and their parameters are estimated sepa-
rately. Therefore, the number of simultaneously estimated
parameters is decreased significantly, and the efficiency of
the parameter estimation is improved.
The PSO is used in the parameter estimation, and its
flow chart is shown in Fig. 5. The details of the steps of
PSO are presented in [11, 12]. The steps of the parameter
estimation for the voltage-related transfer function
Hpu(s) in the active power model are taken as the example
to be introduced as follows.
Step 1: Initialization. In this step, bounds for the
parameters, initial particles, bounds for the velocities
for position updating, and initial velocities are generated.
Step 2: Evaluation. The fitness values are calculated to
evaluate the particles using the following fitness
function:
0 0.2 0.4 0.6 0.8 1.0
-0.5
0
0.5
1.0
1.5
2.0
Time (s)
Out
put a
ctiv
e po
wer
(MW
)
No. 1 WTNo. 10 WTNo. 12 WTNo. 16 WT
-1.0
Fig. 3 Dynamic responses of different WTs
Fig. 4 Result of cluster analysis
Update the speed ofeach particle
Update the positionof each particle
Y
Start
Initialize the position and velocity for each particle
Calculate the fitness of each particle
Select the best position of each particle
Select the best position of all particles
Satisfy the stopping criteria?
End
N
Fig. 5 Flow chart of PSO
Table 1 Wind speeds of different WTs
No. Wind speed (m/s) No. Wind speed (m/s)
1 15.0 9 14.4
2 13.8 10 12.8
3 12.6 11 11.6
4 11.4 12 10.4
5 14.5 13 13.5
6 13.3 14 12.3
7 12.1 15 11.1
8 10.9 16 9.9
552 Feng WU et al.
123

F ¼ minXccl¼1
Plm � Plcð Þ2( )
ð4Þ
where Plm is the measured output active power of the WF;
Plc is the calculated output active power of the WF
equivalent model; cc is the number of the sampling.
Step 3: Loop. Stopping criteria are checked. If the
maximum number of iterations is reached or the fitness
value is smaller than a specified value, the optimization
stops, and the particle with the smallest fitness value is
taken as the estimated parameter for the equivalent
model; otherwise, it goes to Step 4.
Step 4: Updating velocities and positions. The detailed
method for velocity and position updating can be found
in [12, 13]. After the update, go to Step 2.
5 Effectiveness evaluation of equivalent modelingmethod
5.1 Model evaluated using the simulations
in MATLAB
1) Parameter estimation of the voltage-related transfer
function
When the parameters of the voltage-related transfer
function are estimated, the wind speed is assumed to be
constant. Using the simulation system mentioned in Sec-
tion 3 and applying a three-phase short-circuit fault at the
middle of transmission line, as shown in Fig. 2, the
dynamics of the WF are simulated. Taking the simulated
dynamics as the measurements of the WF, the parameters
of the voltage-related transfer function with different
orders are estimated. The errors between the simulated
dynamics and the outputs of the equivalent models with
different orders are listed in Table 2. From Table 2, it can
be seen that the errors between the simulated dynamics and
those of the outputs of the equivalent model decrease sig-
nificantly from the 1st-order model to 3rd-order model,
whereas the errors decrease slightly when the order of the
transfer function is greater than 3. Hence, the 3rd-order
Table 2 Errors between simulated and calculated dynamics using voltage-related transfer-function model
Order of equivalent model Number of parameters Error of active power model (%) Error of reactive power model (%)
1 3 4.5906 23.8600
2 5 2.3432 5.4816
3 7 0.7124 1.8621
4 9 0.7040 1.8206
5 11 0.7032 1.8181
Table 3 Parameters of 3rd-order voltage-related model
Model b3 b2 b1 b0
P-U - 1.5067 4.3238 -5.7532 2.6132
Q-U - 6.8280 175.6800 4.2096 1.3083
Model a2 a1 a0
P-U 36.0100 40.8100 2.6132
Q-U 4.9014 0.6332 1.30830.90
0.95
1.00
1.05
Term
inal
vol
tage
(p.u
.)
6.5
7.0
7.5
8.0
8.5
9.0
9.5O
utpu
t act
ive
pow
er (M
W)
-2.0
-1.5
-1.0
-0.5
0
0.5
1.0
1.5
Time (s)
Out
put r
eact
ive
pow
er (M
var)
0 1 2 3 4 5
Detailed modelEquivalent model
Detailed modelEquivalent model
Fig. 6 Dynamics of 3rd-order voltage-related model
Transfer function based equivalent modeling method for wind farm 553
123

transfer function is the most cost-efficient model for the
voltage-related equivalent model, and it is used in the
further study in this paper. The estimated parameters of the
3rd-order model are listed in Table 3. The dynamics of the
outputs of the 3rd-order model are also shown in Fig. 6.
The dynamics of the output of the 3rd-order model are very
close to those simulated.
2) Parameter estimation of the wind speed-related trans-
fer function
When the parameters of the wind speed-related transfer
function are estimated, the terminal voltage of the WF is
assumed to be constant. The wind speed, consisting of
basic wind, gusty wind, ramp wind, and noisy wind, is the
input variable of the WF, as shown in Fig. 2. Considering
the wake effect, the wind speed decreases by 5% after
flowing through a WT. The simulations are performed. The
input wind speed and the output active and reactive power
Out
put a
ctiv
e po
wer
(M
W)
Out
put r
eact
ive
pow
er
(Mva
r)
Detailed modelEquivalent model
10.0
10.5
11.0
11.5
12.0
12.5
13.0
Win
d sp
eed
(m/s
)
11
12
8
9
10
-2.5
-2.0
-1.5
-1.0
-0.5
0 10 20 30 40 50Time (s)
Detailed modelEquivalent model
Fig. 7 Dynamics of WF under variation of wind speed
Table 4 Errors between simulated and calculated dynamics using voltage-related transfer-function model
Order of equivalent model Number of parameters Error of active power model (%) Error of reactive power model (%)
1 2 13.9235 34.4588
2 4 7.4014 10.8986
3 6 0.8102 3.7168
4 8 0.7988 3.5921
5 10 0.7884 3.5331
Table 5 Parameters of 3rd-order wind speed-related model
Model b2 b1 b0 a2 a1 a0
P-U 1.6826 4.1659 0.3545 19.5 10.4600 0.3545
Q-U 7.4130 2.0827 0.0301 16.1 0.7027 0.0301
Out
put a
ctiv
e po
wer
(MW
)O
utpu
t rea
ctiv
e po
wer
(M
var)
Detailed modelEquivalent model
10.0
10.5
11.0
11.5
12.0
12.5
13.0
Win
d sp
eed
(m/s
)
2
4
-4
-2
0
1520253035
0 10 20 30 40 50Time (s)
13.5
6
8
10
510
0-5
152535
5-5
Detailed modelEquivalent model
12
4
-40
8
10 11 12 13
12
10 11 12 13
Fig. 8 Dynamics of equivalent model and detailed model
554 Feng WU et al.
123

of the WF are taken as the measurements to build the
equivalent model.
Because the inertia of the WT is large and the dynamics
of the output power are slightly delayed, bm in (2) of the
wind speed-related transfer function is set to 0. The
parameters of the wind speed-related transfer function with
different orders are estimated. The errors between the
simulated dynamics and the dynamics of the equivalent
model with different orders are also listed in Table 4. From
Table 4, it is concluded that the 3rd-order model is the most
suitable one. Hence, the 3rd-order transfer function is used
in the later works of this paper. The estimated parameters
of the 3rd-order model are listed in Table 5, and the
dynamics of the output active and reactive power of the
3rd-order model are also shown in Fig. 7. The dynamics of
the output of the 3rd-order model and those simulated
match very well.
3) Evaluation of the equivalent model
Based on the voltage-related and wind speed-related
model, the transfer function based equivalent model of the
WF is built as follows:
P ¼ P0
�1:5067s3 þ 4:3238s2 � 5:7532sþ 2:6132
s3 þ 36:01s2 þ 40:81sþ 2:6132
U
U0
� �2" #
� 1:6826s2 þ 4:1659sþ 0:3545
s3 þ 19:5s2 þ 10:46sþ 0:3545
v
v0
� �3" #
Q ¼ Q0
�6:8280s3 þ 175:68s2 þ 4:2096sþ 1:3083
s3 þ 4:9014s2 þ 0:6332sþ 1:3083
U
U0
� �2" #
� 7:4130s2 þ 2:0827sþ 0:0301
s3 þ 16:1s2 þ 0:7027sþ 0:0301
v
v0
� �3" #
8>>>>>>>>>>>>>>>>>><>>>>>>>>>>>>>>>>>>:
ð5Þ
The model is built in MATLAB. To evaluate the
robustness of the equivalent model, another wind speed
shown in Fig. 8 is injected into the WF, and a three-phase
short-circuit fault is applied to the middle of the
transmission line at 11 s and cleared after 0.1 s. The
simulations are carried out, and the dynamics of output
active and reactive power during the entire simulation
period and around the time of the fault are shown in Fig. 7.
The dynamics of the equivalent model are very close to
those of the detailed WF model. The errors in the active
power and reactive power are 0.82 and 4.20%,
respectively.
Out
put a
ctiv
e po
wer
(MW
)O
utpu
t rea
ctiv
e po
wer
(Mva
r)
19.95
20.05
20.15
20.25Te
rmin
al v
olta
ge (k
V)
16
13
14
-45
-40
-35
-30
-20
0 1 2 3 4 6Time (s)
19.85
19.75
15
Measured dynamicsEquivalent model
-25
Measured dynamicsEquivalent model
5
Fig. 9 Dynamics of recorded output power and those of equivalent
model under system fault
Fig. 10 Dynamics of recorded output power and those of equivalent
model under wind speed variation
Transfer function based equivalent modeling method for wind farm 555
123
5.2 Model evaluation using field measurements
The phasor measurement unit (PMU) is installed at the
terminal of a WF, which is located in Northwest China.
The WF comprises 20 WTs with DFIG. Because the
capacity of each WT is 1.5 MW, the total capacity of the
WF is 30 MW. A system fault happened on December 15,
2012, and the dynamics of the terminal voltage, output
active power, and output reactive power are recorded and
shown in Fig. 8. Using the recorded dynamics, the voltage-
related transfer function of the equivalent model of the WF
is built as follows:
P ¼ P0
�3:42s3 þ 45:34s2 þ 5:18sþ 2:24
s3 þ 38:37s2 þ 25:23sþ 2:24
U
U0
� �2" #
Q ¼ Q0
�14:32s3 � 273:92s2 þ 14:18sþ 4:24
s3 þ 48:37s2 þ 43:78sþ 4:24
U
U0
� �2" #
8>>>>><>>>>>:
ð6Þ
The dynamics of the output active and reactive power of
the equivalent model are also shown in Fig. 9. The output
dynamics of the equivalent model are very close to the
recorded dynamics. The errors between the measured
dynamics and those of the equivalent model are 0.37 and
1.7% for active power and reactive power, respectively.
The measured dynamics of the output active power of
the real WF under the variation of the wind speed is also
chosen to build the wind speed-related equivalent model.
The variations of the wind speed and active power are
shown in Fig. 10. The equivalent model is built as follows:
P ¼ P0
0:6023s3 þ 0:0584s2 þ 0:0301sþ 0:0005
s3 þ 0:7808s2 þ 0:0514sþ 0:0005
v
v0
� �3" #
ð7Þ
The active power of the equivalent model is also shown
in Fig. 10. The output power of the equivalent model is
close to the recorded value. The error between the
measured dynamics and the output of the equivalent
model is 2.86%.
6 Conclusion
In this paper, an equivalent modeling method for the WF
has been proposed. Because the equivalent model is based
on the transfer function, the objective of the modeling is to
describe the relation between the dynamics of the WF
output and input variation. The detailed structure and
parameters of the WF are not necessary, which is very
convenient during the construction of the equivalent model.
A decoupled parameter-estimation strategy has also been
developed to estimate the parameters of the equivalent
model, and the efficiency of the parameter estimation has
been improved. The proposed equivalent modeling method
has been employed to build the aggregated model for a
simulation system and a real WF. The outputs of the
equivalent models match well with those of the WF. The
proposed equivalent model is confirmed to be effective to
aggregate the dynamics of the WF using actual, real-time
measurements.
Acknowledgment This work was supported by National Natural
Science Foundation of China (No. 51422701). The authors would also
like to thank the support of Chinese National ‘‘111’’ Project of
‘‘Renewable Energy and Smart Grid’’ at Hohai University.
Open Access This article is distributed under the terms of the
Creative Commons Attribution 4.0 International License (http://
creativecommons.org/licenses/by/4.0/), which permits unrestricted
use, distribution, and reproduction in any medium, provided you give
appropriate credit to the original author(s) and the source, provide a
link to the Creative Commons license, and indicate if changes were
made.
Appendix A
Parameters of the simulation system are given as
follows:
1) WT: Ht=3 s, Hg=0.5 s, Ksh=10, Dsh=3.14.
2) DFIG: Rs=0.00706, Ls=0.171, Lm=2.9, Rr=0.005,
Lr=0.156, Lss=Ls?Lm, Lrr=Lr?Lm.
3) Converter: C=0.001, VDC0=1200 V, XTg=0.55.
4) Collection system: R = 0.1153 X/km, L = 1.05910-3
H/km, C=11.33910-9 F/km, l=0.6 km
5) Transmission line: SN = 2500 MVA, UN = 120 kV, R =
0.1153 X/km, L = 1.05910-3 H/km, C=11.33910-9
F/km, l=50 km.
Reference
[1] Wang L, Vo QS, Hsieh MH et al (2017) Transient stability
analysis of Taiwan power system’s power grid connected with a
high-capacity offshore wind farm. In: Proceedings of 2017
international conference on system science and engineering
(ICSSE), Ho Chi Minh City, Vietnam, 21–23 July 2017,
pp 585–590
[2] Garcia CA, Fernandez LM, Jurado F (2015) Evaluating reduced
models of aggregated different doubly fed induction generator
wind turbines for transient stabilities studies. Wind Energy
18(1):133–152
[3] Fernandez LM, Garcia CA, Saenz JR et al (2006) Reduced
model of dfigs wind farms using aggregation of wind turbines
and equivalent wind. In: Proceedings of IEEE electrotechnical
conference, Torremolinos, Spain, 16–19 May 2006, pp 881–884
556 Feng WU et al.
123
[4] Muljadi E, Ellis A (2008) Validation of wind power plant
models. In: Proceedings of IEEE power and energy society
general meeting—conversion and delivery of electrical energy
in the 21st century, Pittsburgh, USA, 20–24 July 2008, 7 pp
[5] Elizondo MA, Lu S, Zhou N et al (2011) Model reduction,
validation, and calibration of wind power plants for dynamic
studies. In: Proceedings of IEEE power and energy society
general meeting, San Diego, USA, 24–29 July 2011, 8 pp
[6] Turegano JM, Villalba SA, Herraiz GC et al (2017) Model
aggregation of large wind farms for dynamic studies. In: Pro-
ceedings of 43rd annual conference of the IEEE industrial
electronics society, Beijing, China, 29 October–1 November
2017, pp 316–321
[7] Zou J, Peng C, Xu H et al (2015) A fuzzy clustering algorithm-
based dynamic equivalent modeling method for wind farm with
DFIG. IEEE Trans Energy Convers 30(4):1329–1337
[8] IEEE Task Force on Load Representation for Dynamic Perfor-
mance (1995) Bibliography on load models for power flow and
dynamic performance simulation. IEEE Trans Power Syst
10(1):523–538
[9] Zhou HQ, Huang XC, Wu L et al (2010) Aggregation of exci-
tation systems based on standard transfer functions. Autom
Electric Power Syst 34(1):15–19
[10] Sun T, Mou X, Li Z (2015) A practical clustering method of
DFIG wind farms based on dynamic current error. In: Pro-
ceedings of IEEE power and energy society general meeting,
Denver, USA, 26–30 July 2015, 5 pp
[11] Liu ZH, Wei HL, Zhong QC et al (2017) Parameter estimation
for VSI-fed PMSM based on a dynamic PSO with learning
strategies. IEEE Trans Power Electron 32(4):3154–3165
[12] Silva SAO, Sampaio LP, Oliveira FM et al (2017) Feed-forward
DC-bus control loop applied to a single-phase grid-connected
PV system operating with PSO-based MPPT technique and
active power-line conditioning. IET Renew Power Gener
11(1):183–193
[13] Wu F, Zhang XP, Godfrey K et al (2007) Small signal analysis
and optimal control of wind turbine with doubly fed induction
generator. IET Gener Transm Distrib 1(5):751–760
Feng WU received the B.Eng. and M.Sc. degrees in Electrical
Engineering from Hohai University, China, in 1998 and 2002,
respectively, and received the Ph.D. degree also in Electrical
Engineering from the University of Birmingham, UK in 2009. He is
current a professor at Hohai University, China. His research interest is
modeling and control of the renewable energy generation.
Junxia QIAN received the B.Eng. degree in Mechanical Engineering
from Nantong University in 1999, and received M.Sc. degree in
automation from Hohai University in 2005. She is currently pursuing
the Ph.D. degree in Electrical Engineering at Hohai University. Her
research interest is modeling of the renewable energy generation.
Ping JU received the B.Eng. and M.Sc. degrees in Electrical
Engineering from Southeast University, China in 1982 and 1985,
respectively. In 1988 he received the Ph.D. degree in Electrical
Engineering from Zhejiang University, Hangzhou, China. He was an
Alexander-von-Humboldt Fellow at the University of Dortmund,
Germany. He is now a professor of electrical engineering in the
College of Electrical Engineering at Hohai University, Nanjing,
China. His research interest is modeling and control of the power
system.
Xiaoping ZHANG received the B.Eng., M.Sc. and Ph.D. degrees in
Electrical Engineering from Southeast University in 1988, 1990,
1993, respectively. He worked at NARI, Ministry of Electric Power,
China on EMS/DMS advanced application software research and
development from 1993 to 1998. He visited UMIST from 1998 to
1999. He was an Alexander-von-Humboldt Research Fellow with the
University of Dortmund, Germany from 1999 to 2000. He was a
lecturer and then an associate professor at the University of Warwick,
UK till early 2007. Currently he is a professor at the University of
Birmingham, UK. His research interest is technologies for smart
grids.
Yuqing JIN received the B.Eng., M.Sc. and Ph.D. degrees in
Electrical Engineering from Hohai University in 2002, 2006, 2012,
respectively. He is currently an associate professor at Hohai
University. His research interest is modeling of the wind farm.
Dan XU received the B.Eng. and M.Sc. degrees in Electrical
Engineering from Hohai University in 2014 and 2017, respectively.
She is currently an electrical engineer at SUMEC Co. Ltd. Nanjing,
China. Her research interest is modeling of the ocean energy
generation.
Michael STERLING received a B.Eng. degree with First Class
Honours in Electronic and Electrical Engineering at the University of
Sheffield and subsequently a Ph.D. degree in computer control in
1971. In 1971 he joined the Department of Control Engineering,
University of Sheffield, as a lecturer, being promoted to senior
lecturer in 1978. In 1980 he was appointed as professor of engineering
at the University of Durham, UK. In 1989 he was appointed vice-
chancellor and principal of Brunel University. He was vice-chancellor
at the University of Birmingham. He is a fellow of the Institute of
Measurement and Control, the Institution of Electrical Engineers
(IET) and the Royal Academy of Engineering. He has served on the
IET Council, and is a former chairman of the Russell Group, and is
also a past president of the Institute of Electrical Engineers and the
Institute of Measurement and Control. His research interest is
operation of the power system.
Transfer function based equivalent modeling method for wind farm 557
123


![The Role of Arabidopsis Rubisco Activase inThe Role of Arabidopsis Rubisco Activase in Jasmonate-Induced Leaf Senescence1[W] Xiaoyi Shan2, Junxia Wang2, Lingling Chua, Dean Jiang,](https://static.fdocuments.us/doc/165x107/5e79f805d46ac7448a259c76/the-role-of-arabidopsis-rubisco-activase-in-the-role-of-arabidopsis-rubisco-activase.jpg)