Transcriptomic Analysis of Circulating Leukocytes Reveals ...Transcriptomic Analysis of Circulating...
15
Transcriptomic Analysis of Circulating Leukocytes Reveals Novel Aspects of the Host Systemic Inflammatory Response to Sheep Scab Mites Stewart T. G. Burgess 1 *, Andrew Greer 2 , David Frew 1 , Beth Wells 1 , Edward J. Marr 1 , Alasdair J Nisbet 1 , John F. Huntley 1 1 Moredun Research Institute, Pentlands Science Park, Bush Loan, Edinburgh, Midlothian, Scotland, United Kingdom, 2 Faculty of Agriculture and Life Sciences, Lincoln University, Lincoln, Canterbury, New Zealand Abstract Infestation of ovine skin with the ectoparasitic mite Psoroptes ovis results in the development of a rapid cutaneous inflammatory response, leading to the crusted skin lesions characteristic of sheep scab. To facilitate the identification of novel diagnostic and therapeutic targets, a better understanding of the host-parasite relationship in sheep scab is essential. Although our knowledge of the host’s local cutaneous inflammatory response to sheep scab has increased in recent years, we still know relatively little about the mechanisms of this response at the systemic level. This study used a combined network and pathway analysis of the in vivo transcriptomic response of circulating leukocytes to infestation with P. ovis, during a 6 week period. Network graph analysis identified six temporally-associated gene clusters, which separated into two distinct sub-networks within the graph, representing those genes either up or down-regulated during the time course. Functional and pathway analysis of these clusters identified novel insights into the host systemic response to P. ovis infestation, including roles for the complement system, clotting cascade and fibrinolysis. These analyses also highlighted potential mechanisms by which the systemic immune response to sheep scab can influence local tissue responses via enhanced leukocyte activation and extravasation. By analysing the transcriptomic responses of circulating leukocytes in sheep following infestation with P. ovis, this study has provided key insights into the inflammatory response to infestation and has also demonstrated the utility of these cells as a proxy of events occurring at local tissue sites, providing insight into the mechanisms by which a local allergen-induced inflammatory response may be controlled. Citation: Burgess STG, Greer A, Frew D, Wells B, Marr EJ, et al. (2012) Transcriptomic Analysis of Circulating Leukocytes Reveals Novel Aspects of the Host Systemic Inflammatory Response to Sheep Scab Mites. PLoS ONE 7(8): e42778. doi:10.1371/journal.pone.0042778 Editor: Christian Scho ¨ nbach, Kyushu Institute of Technology, Japan Received May 10, 2012; Accepted July 11, 2012; Published August 3, 2012 Copyright: ß 2012 Burgess et al. This is an open-access article distributed under the terms of the Creative Commons Attribution License, which permits unrestricted use, distribution, and reproduction in any medium, provided the original author and source are credited. Funding: This study was funded by the Department for Environment, Food and Rural Affairs, United Kingdom under project OD0553 and also supported by The Scottish Government’s Rural and Environment Science and Analytical Services Division. The funders had no role in study design, data collection and analysis, decision to publish, or preparation of the manuscript. Competing Interests: The authors have declared that no competing interests exist. * E-mail: [email protected] Introduction Sheep scab, or ovine psoroptic mange, caused by infestation of sheep skin with the mite Psoroptes ovis is highly contagious, causing intense pruritus and irritation, resulting in a disease of major welfare concern [1]. Current disease control strategies rely on the use of acaricidal dips and endectocides but the emerging issues of biological residues, eco-toxicity and development of acaricide resistance have raised concerns regarding the sustainability of this strategy, highlighting interest in the development of alternative control methods [2]. To develop alternative methods of control a deeper understanding of both the parasite and its interaction with the host are essential. Although the basic biology of the host:parasite interaction is well understood, there is a paucity of information about the mechanisms underlying the host response, in particular at the systemic level. Sheep scab infestation is characterised by three distinct phases, ‘‘early’’, ‘‘late’’ and a subsequent ‘‘decline’’ phase [3]. During the early phase, the host’s skin becomes reddened and inflamed within minutes of infestation and within 24 hours an epidermal influx of neutrophils (repre- senting the majority of infiltrating cells) and eosinophils can be observed, followed by blister formation and a pronounced serous fluid exudate and dermal oedema [4]. Increases in dermal mast cell numbers occur by 96 hours post-infestation, and P. ovis- specific IgE is detectable within one week post-infestation [3]. These histopathological and serological changes suggest an immediate-type hypersensitivity reaction may be involved in lesion development [5]. However, this does not fully explain the initial pro-inflammatory response, as this occurs in mite-naı ¨ve sheep which lack P. ovis-specific IgE [3]. We have shown previously that, within 24 hours of a primary infestation, the expression of genes encoding pro-inflammatory/pro-allergic me- diators [including colony stimulating factor 2 (CSF2), interleukin- 1A ( IL1A), IL1B, IL4, IL8, IL6 and IL13] is increased in sheep skin [6]. Expression of these cytokines is likely to be caused by keratinocyte activation, as P. ovis is a non-burrowing mite and these cells form the first point of contact between host and parasite [6]. This early stage can last from 2–3 weeks and clinical symptoms may not be observed without close examination during this time [3]. During this period the mite population increases and the lesion begins to expand, eventually spreading across the body PLoS ONE | www.plosone.org 1 August 2012 | Volume 7 | Issue 8 | e42778
Transcript of Transcriptomic Analysis of Circulating Leukocytes Reveals ...Transcriptomic Analysis of Circulating...
Transcriptomic Analysis of Circulating LeukocytesReveals Novel Aspects of the Host SystemicInflammatory Response to Sheep Scab MitesStewart T. G. Burgess1*, Andrew Greer2, David Frew1, Beth Wells1, Edward J. Marr1, Alasdair J Nisbet1,
John F. Huntley1
1 Moredun Research Institute, Pentlands Science Park, Bush Loan, Edinburgh, Midlothian, Scotland, United Kingdom, 2 Faculty of Agriculture and Life Sciences, Lincoln
University, Lincoln, Canterbury, New Zealand
Abstract
Infestation of ovine skin with the ectoparasitic mite Psoroptes ovis results in the development of a rapid cutaneousinflammatory response, leading to the crusted skin lesions characteristic of sheep scab. To facilitate the identification ofnovel diagnostic and therapeutic targets, a better understanding of the host-parasite relationship in sheep scab is essential.Although our knowledge of the host’s local cutaneous inflammatory response to sheep scab has increased in recent years,we still know relatively little about the mechanisms of this response at the systemic level. This study used a combinednetwork and pathway analysis of the in vivo transcriptomic response of circulating leukocytes to infestation with P. ovis,during a 6 week period. Network graph analysis identified six temporally-associated gene clusters, which separated into twodistinct sub-networks within the graph, representing those genes either up or down-regulated during the time course.Functional and pathway analysis of these clusters identified novel insights into the host systemic response to P. ovisinfestation, including roles for the complement system, clotting cascade and fibrinolysis. These analyses also highlightedpotential mechanisms by which the systemic immune response to sheep scab can influence local tissue responses viaenhanced leukocyte activation and extravasation. By analysing the transcriptomic responses of circulating leukocytes insheep following infestation with P. ovis, this study has provided key insights into the inflammatory response to infestationand has also demonstrated the utility of these cells as a proxy of events occurring at local tissue sites, providing insight intothe mechanisms by which a local allergen-induced inflammatory response may be controlled.
Citation: Burgess STG, Greer A, Frew D, Wells B, Marr EJ, et al. (2012) Transcriptomic Analysis of Circulating Leukocytes Reveals Novel Aspects of the HostSystemic Inflammatory Response to Sheep Scab Mites. PLoS ONE 7(8): e42778. doi:10.1371/journal.pone.0042778
Editor: Christian Schonbach, Kyushu Institute of Technology, Japan
Received May 10, 2012; Accepted July 11, 2012; Published August 3, 2012
Copyright: � 2012 Burgess et al. This is an open-access article distributed under the terms of the Creative Commons Attribution License, which permitsunrestricted use, distribution, and reproduction in any medium, provided the original author and source are credited.
Funding: This study was funded by the Department for Environment, Food and Rural Affairs, United Kingdom under project OD0553 and also supported by TheScottish Government’s Rural and Environment Science and Analytical Services Division. The funders had no role in study design, data collection and analysis,decision to publish, or preparation of the manuscript.
Competing Interests: The authors have declared that no competing interests exist.
* E-mail: [email protected]
Introduction
Sheep scab, or ovine psoroptic mange, caused by infestation of
sheep skin with the mite Psoroptes ovis is highly contagious, causing
intense pruritus and irritation, resulting in a disease of major
welfare concern [1]. Current disease control strategies rely on the
use of acaricidal dips and endectocides but the emerging issues of
biological residues, eco-toxicity and development of acaricide
resistance have raised concerns regarding the sustainability of this
strategy, highlighting interest in the development of alternative
control methods [2]. To develop alternative methods of control a
deeper understanding of both the parasite and its interaction with
the host are essential. Although the basic biology of the
host:parasite interaction is well understood, there is a paucity of
information about the mechanisms underlying the host response,
in particular at the systemic level. Sheep scab infestation is
characterised by three distinct phases, ‘‘early’’, ‘‘late’’ and a
subsequent ‘‘decline’’ phase [3]. During the early phase, the host’s
skin becomes reddened and inflamed within minutes of infestation
and within 24 hours an epidermal influx of neutrophils (repre-
senting the majority of infiltrating cells) and eosinophils can be
observed, followed by blister formation and a pronounced serous
fluid exudate and dermal oedema [4]. Increases in dermal mast
cell numbers occur by 96 hours post-infestation, and P. ovis-
specific IgE is detectable within one week post-infestation [3].
These histopathological and serological changes suggest an
immediate-type hypersensitivity reaction may be involved in
lesion development [5]. However, this does not fully explain the
initial pro-inflammatory response, as this occurs in mite-naıve
sheep which lack P. ovis-specific IgE [3]. We have shown
previously that, within 24 hours of a primary infestation, the
expression of genes encoding pro-inflammatory/pro-allergic me-
diators [including colony stimulating factor 2 (CSF2), interleukin-
1A ( IL1A), IL1B, IL4, IL8, IL6 and IL13] is increased in sheep skin
[6]. Expression of these cytokines is likely to be caused by
keratinocyte activation, as P. ovis is a non-burrowing mite and
these cells form the first point of contact between host and parasite
[6]. This early stage can last from 2–3 weeks and clinical
symptoms may not be observed without close examination during
this time [3]. During this period the mite population increases and
the lesion begins to expand, eventually spreading across the body
PLoS ONE | www.plosone.org 1 August 2012 | Volume 7 | Issue 8 | e42778
[3]. In response to the intense itching and increasing mite
population, it is during this late phase that the clinical signs of
disease become most apparent. In experimentally infested animals,
this late phase continues for a further 2–4 weeks until adaptive host
immune responses begin to affect mite numbers [3,4]. Compo-
nents of the pro-inflammatory response to pathogens have been
identified within circulating blood cells in humans and these have
been classified as the ‘systemic inflammatory response’ [7,8].
Currently little is known about the role of systemic inflammation
in the development of ovine psoroptic mange and analysis of
components of the systemic inflammatory response will aid
understanding of the mechanisms behind the host response to
infestation. Several circulating leukocyte populations are present in
sheep blood, including neutrophils (40–60%), eosinophils (1–4%),
basophils (0.4–1%), lymphocytes (25–35%) and monocytes (4–6%)
[9]. The activity of circulating leukocytes contributes to the levels
of cytokines and other pro-inflammatory markers, both systemi-
cally and at local sites of inflammation [10]. As such these cells are
able to influence the course and nature of an inflammatory
response occurring at local tissue sites [10]. It has been proposed
that, as circulating leukocytes are able to interact and communi-
cate with every tissue in the body, they can act as a ‘sentinel tissue’
reflecting disease progression at local sites of infection [11].
Depending on the specific pathogen/parasite, the RNA expression
profiles of these cells may possess a disease-specific signature,
reflecting the gene networks and signalling pathways involved in
the host response [12]. We described previously a transcriptomic
analysis of the localised host skin response to infestation with P.
ovis, elucidating the processes leading to the development of a
rapid and profound cutaneous inflammatory response [6]. Here,
to gain a greater understanding of the systemic host response, we
investigated gene expression in circulating leukocytes, providing a
series of ‘‘snap-shots’’ of the transcriptomic response in the host
vasculature over the progression of an infestation. The transcrip-
tomic profiles of circulating leukocytes were interrogated using a
gene expression microarray and a combined clustering, network
and pathway mapping approach enabling the identification of key
signalling events in the host systemic response to P. ovis.
Materials and Methods
Animal studyEthical approval for this study was obtained from the Moredun
Research Institute Experiments Committee and animals were
monitored daily in accordance with guidelines agreed with the UK
Home Office. P. ovis mites (a mixed population consisting of adults,
nymphs and larvae) were harvested from infested donor animals
maintained at the Moredun Research Institute as described
previously [6]. Scotch mule lambs (1–2 years old, n = 6) with no
previous exposure to P. ovis were maintained at the Moredun
Research Institute. Prior to infestation with P. ovis a blood sample
(9 ml) was removed from each animal by venipuncture into a Bio-
One 9 ml EDTA K3 Vacuette blood tube (Greiner, UK) and
processed immediately as described below for the isolation of
leukocytes and subsequent RNA extraction. These samples
represented the baseline (Time = 0) for each animal. Approxi-
mately 20–50 mites were placed directly onto the skin at the
withers of each animal and infestations allowed to proceed for 6
weeks. During this period blood samples were taken weekly and
processed as described for the baseline samples. Lesion area
measurements were obtained for all animals during the 6 week (42
day) period of infestation by measuring the length and breadth of
each lesion.
Isolation of leukocytes from whole bloodThe analysis of gene expression in whole blood samples is
hampered by the presence of large quantities of globin mRNA
which can represent up to 70% of the transcript population, thus
limiting the ability to accurately detect genes expressed at low
levels [13]. In order to reduce the issue of globin mRNA transcript
contamination we used a pre-filtration protocol to isolate
leukocytes from whole blood samples prior to cell lysis and
subsequent RNA extraction. Briefly, leukocytes were captured by
passing the whole blood samples, less than 1 hour after removal,
through an Ambion LeukoLOCK filter (Ambion, UK) under
vacuum pressure. The filter was then flushed with 3 ml phosphate
buffered saline (PBS) to remove residual erythrocytes and then
3 ml of RNALater (Ambion, UK) was passed into the filter to
preserve RNA signatures before storage at 280uC, prior to RNA
extraction.
RNA extractionRNA was extracted from the separated leukocyte samples
following the manufacturer’s protocol (Ambion). Briefly, the filter
was thawed on ice and residual RNALater flushed out using an
empty 5 ml syringe. The leukocytes on the filter were lysed by
flushing with 2.5 ml of Lysis/Binding buffer and the flow through
(lysis extract) collected in an RNase free tube. Residual proteins in
the eluate were degraded using a brief (5 mins) Proteinase K
digestion and RNA was captured using RNA-binding beads
following the manufacturer’s protocol. Residual DNA was
removed following DNase I treatment (10 mins, TURBO DNase,
Ambion, UK) and purified RNA was eluted into elution solution.
RNA sample quality was assessed on an Agilent Bioanalyser
(Agilent, UK), an RNA Integrity Number (RIN) obtained for each
sample and RNA yield was assessed on a ND-1000 Nanodrop
spectrophotometer (Thermo Scientific, UK). RNA samples with a
RIN.7.5 were considered to be of acceptable quality for
downstream microarray processing [14].
Microarray studyAs no suitable ovine microarray platform was available at the
start of this study transcriptomic analysis was performed with the
Agilent bovine gene expression microarray (43,803 probes
representing 21,520 bovine genes) in a 4644 K slide format.
Sheep cDNA samples derived from each time point were
randomly assigned to the arrays within a slide, with each sample
(time point) for each individual animal hybridised onto the arrays
on a single slide to limit technical variation. One array was
employed for each of 4 time points [non-infected (time = 0), 1 week
(7 days), 3 weeks (21 days) and 6 weeks (42 days) post-infestation]
per animal. Six animals were used in the study, giving a total of 24
arrays. The Agilent One-Colour gene-expression workflow (Cy3
dye, Quick Amp Labelling Protocol, Agilent, UK) was used to
amplify and process RNA samples, following the manufacturer’s
protocols. Briefly 800 ng total RNA was used for the generation of
fluorescently labelled (Cy3 dye) complementary RNA (cRNA),
using T7 RNA polymerase. Microarrays were hybridised at 65uCfor 17 hours in an Agilent Microarray Hybridisation Oven
(Agilent, UK), and scanned for Cy3 dye intensity on an Agilent
Microarray Scanner (Agilent, UK) at the manufacturer’s recom-
mended settings. Microarray signal data were extracted using
Agilent Feature Extraction software version 9.5.3 (Agilent, UK).
To enable inter-array comparisons, raw data for each array were
normalised to the 75th percentile of all non-control probes within
the Genespring GX 11.0 software package (Agilent, UK) prior to
log transformation. Further downstream filtering of the normalised
array data was performed in Genespring GX 11.0.
Systemic Response to Infestation with P. ovis
PLoS ONE | www.plosone.org 2 August 2012 | Volume 7 | Issue 8 | e42778
Statistical analysis of microarray dataDifferential gene expression across the time course of infestation
was determined using a one way-analysis of variance (ANOVA)
with a Student-Newman-Keuls (SNK) post-hoc test in Genespring
GX 11.0 (Agilent Technologies, UK) comparing each time point,
(time = 0, 1, 3 and 6 weeks post-infestation) across all animals.
Multiple test correction was performed using the Benjamini &
Hochberg False Discovery Rate (FDR) procedure with an FDR
corrected p-value cut-off set at #0.05 and a fold change cut-off of
$1.8 [15].
Network graph analysis and temporal clustering of geneexpression data
Normalised, log-transformed gene expression data along with
unique identifiers and all available annotation for the significantly
differentially expressed transcripts with a fold change $1.8 were
imported into the network visualisation and analysis tool
BioLayout Express 3D [16]. The software generated an ‘‘all
sample vs all sample’’ Pearson correlation matrix based on the
expression profiles of the selected probes. Probes with a Pearson
correlation co-efficient .0.7 were stored and network graphs were
generated at selected cut-off values above this threshold. The
graphs consisted of nodes, representing the individual probes
(genes), connected by edges representing expression correlations
above the selected Pearson threshold. Using the Markov
Clustering Algorithm (MCL) network graphs were clustered
according to connectivity between individual nodes, producing
groups of probes with similar expression profiles across the time
course of infestation [16,17]. In order to provide a metric for
statistical significance, BioLayout Express 3D used a two-sided
Fisher’s exact test and a Bonferroni correction for multiple testing
[16].
Pathway and gene network analysisData were analysed using Ingenuity Pathway Analysis (IPA,
Ingenuity Systems Inc, USA). Gene clusters identified from the
network graph and clustering analysis were uploaded as the input
data set into IPA. Each gene identifier was mapped to its
corresponding gene object in Ingenuity’s Knowledge Base. Gene
networks were then algorithmically generated based on their
connectivity and assigned a score indicating how relevant the
network was to the genes in the input dataset. Networks were
analysed to identify the biological and/or disease functions most
significant to the genes in that network. Canonical pathway
analysis identified the biological pathways of highest significance to
the input data sets. The significance of the association between the
data set and the canonical pathway was determined based on two
parameters: (1) A ratio of the number of genes from the dataset
that mapped to the pathway divided by the total number of genes
that mapped to the canonical pathway and (2) a p-value,
calculated using a Fisher’s exact test, determining the probability
that the association between the genes in the data set and the
canonical pathway was due to chance alone.
qPCR validationQuantitative real-time PCR (qPCR) was used to verify
differential expression of 10 selected genes from the final list of
differentially expressed transcripts. Briefly, RNA from sheep blood
samples, prepared as described above, was reverse transcribed into
cDNA using anchored Oligo(dT)23 primers (Sigma, UK) and
Superscript II reverse transcriptase (Invitrogen, UK) following the
manufacturers’ instructions. TaqMan qPCR was used to measure
relative transcript levels using pre-validated ‘‘assay-on-demand’’
specific primer and probe sets (Applied Biosystems, UK) for the
following genes: SPP1 (Assay ID: Bt03213107_m1); ALAS2
(Bt03221878_m1); ALOX15 (Bt03214775_m1); IGFBP4
(Bt03259499_m1); MPO (Bt03269033_m1); C4BPB
(Bt03237460); CTTN (Bt03240896_m1); PDLIM1
(Bt03222239_m1); PLAU (Bt03212959_m1) and ANG
(Bt03279285_m1). At the time of validation ovine gene sequences
were not available for the selected genes, so the homologous
bovine gene sequences were used for primer and probe set
selection and all values were normalised to the transcript levels of
the bovine glyceraldehyde-3-phosphate dehydrogenase (GAPDH)
internal control gene [Bt03210913_g1 (Applied Biosystems, UK)].
All sample analyses were performed in triplicate and the 2-DDCt
method was used to assess relative gene expression differences
between the respective time points post-infestation (1, 3 and 6
weeks) for each animal compared to the baseline (t = 0) sample for
each animal [18,19]. Transcript levels, measured in this way were
then normalised using the GAPDH internal control and expressed
as fold change (FC) compared to the control (t = 0) reference
sample. Genes for validation were selected to represent a range of
the clusters identified in the network graph analysis and to provide
a range of genes differentially expressed across different time
points. The expression profiles of the selected genes were then
compared to the corresponding microarray probe data.
Results
Sheep scab lesion development during infestationFollowing infestation with P. ovis, lesion size (n = 6 sheep) was
assessed weekly. Mean lesion areas (6 SEM) were as follows: Time
0 = no lesions; one week post-infestation (1 wpi) = 12 cm2
(63 cm2); 2 wpi = 79 cm2 (626 cm2); 3 wpi = 176 cm2
(659 cm2); 4 wpi = 347 cm2 (6148 cm2); 5 wpi = 772 cm2
(6429 cm2); 6 wpi = 1125 cm2 (6631 cm2). This represented an
approximate doubling of lesion size each week for all animals and
a linear increase over the 6 week infestation period.
Isolation of RNA from ovine circulating leukocytesTotal RNA from ovine circulating leukocytes isolated from
whole blood samples was successfully extracted from all samples
with a mean RIN value of 9.4 (Min = 9, Max = 9.6) indicating high
quality, purified RNA with little observable degradation. The
mean yield of total RNA across all leukocyte samples (n = 24) used
in the study was 36 mg (61.67 mg) from a 9 ml whole blood
sample.
Microarray data processingTo ensure quality and consistency of the sample-labelling
process and array hybridizations, control information was collated
from all arrays. Quality control data were found to be consistent
with the manufacturer’s (Agilent) recommendations. The perfor-
mance of the array hybridizations was further assessed through
scatter plots (data not shown) comparing each array with every
other generated. This confirmed linear distributions between
arrays, showing a dynamic uninterrupted range of expression
values from low to high signals. Box and whisker visualizations
confirmed the data had comparable distributions and were of
sufficient quality for further analysis (data not shown). Following
data normalisation and log transformation, invariant transcripts,
whose presence could contribute to multiple testing errors in the
subsequent statistical analysis, were removed. Downstream data
filtering of the array dataset (21,520 probes) was performed and
probes with a ‘‘present’’ or ‘‘marginal’’ flag call in 100% of the
samples at any one of the 4 time points were considered reliable
Systemic Response to Infestation with P. ovis
PLoS ONE | www.plosone.org 3 August 2012 | Volume 7 | Issue 8 | e42778
for further analysis, resulting in a final list of 14,174 probes for the
differential expression analysis.
Determination of differentially expressed transcriptsUsing a one way ANOVA combined with a Student-Newman-
Keuls (SNK) post-hoc test, 621 genes were designated as
significantly differentially expressed with a fold change $1.8 in
at least one of the 6 possible time point comparisons [non-infested
control (C) vs 1 wpi, C vs 3wpi, C vs 6wpi, 1wpi vs 3wpi, 1wpi vs
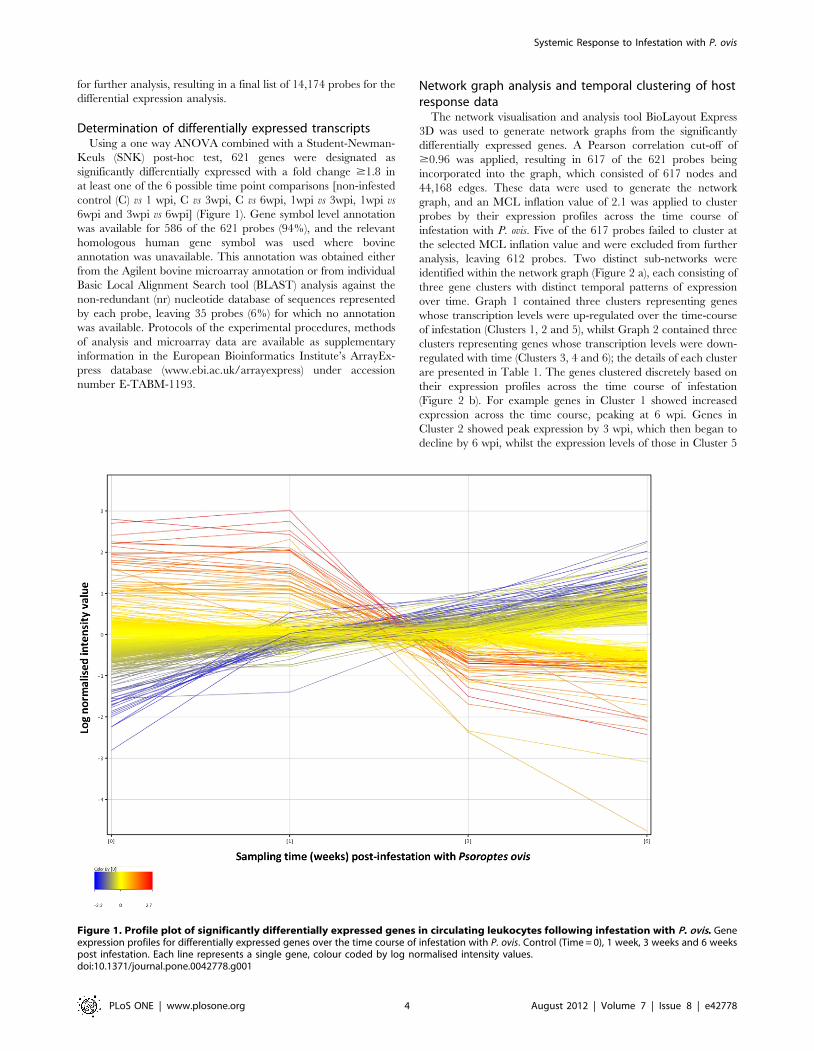
6wpi and 3wpi vs 6wpi] (Figure 1). Gene symbol level annotation
was available for 586 of the 621 probes (94%), and the relevant
homologous human gene symbol was used where bovine
annotation was unavailable. This annotation was obtained either
from the Agilent bovine microarray annotation or from individual
Basic Local Alignment Search tool (BLAST) analysis against the
non-redundant (nr) nucleotide database of sequences represented
by each probe, leaving 35 probes (6%) for which no annotation
was available. Protocols of the experimental procedures, methods
of analysis and microarray data are available as supplementary
information in the European Bioinformatics Institute’s ArrayEx-
press database (www.ebi.ac.uk/arrayexpress) under accession
number E-TABM-1193.
Network graph analysis and temporal clustering of hostresponse data
The network visualisation and analysis tool BioLayout Express
3D was used to generate network graphs from the significantly
differentially expressed genes. A Pearson correlation cut-off of
$0.96 was applied, resulting in 617 of the 621 probes being
incorporated into the graph, which consisted of 617 nodes and
44,168 edges. These data were used to generate the network
graph, and an MCL inflation value of 2.1 was applied to cluster
probes by their expression profiles across the time course of
infestation with P. ovis. Five of the 617 probes failed to cluster at
the selected MCL inflation value and were excluded from further
analysis, leaving 612 probes. Two distinct sub-networks were
identified within the network graph (Figure 2 a), each consisting of
three gene clusters with distinct temporal patterns of expression
over time. Graph 1 contained three clusters representing genes
whose transcription levels were up-regulated over the time-course
of infestation (Clusters 1, 2 and 5), whilst Graph 2 contained three
clusters representing genes whose transcription levels were down-
regulated with time (Clusters 3, 4 and 6); the details of each cluster
are presented in Table 1. The genes clustered discretely based on
their expression profiles across the time course of infestation
(Figure 2 b). For example genes in Cluster 1 showed increased
expression across the time course, peaking at 6 wpi. Genes in
Cluster 2 showed peak expression by 3 wpi, which then began to
decline by 6 wpi, whilst the expression levels of those in Cluster 5
Figure 1. Profile plot of significantly differentially expressed genes in circulating leukocytes following infestation with P. ovis. Geneexpression profiles for differentially expressed genes over the time course of infestation with P. ovis. Control (Time = 0), 1 week, 3 weeks and 6 weekspost infestation. Each line represents a single gene, colour coded by log normalised intensity values.doi:10.1371/journal.pone.0042778.g001
Systemic Response to Infestation with P. ovis
PLoS ONE | www.plosone.org 4 August 2012 | Volume 7 | Issue 8 | e42778
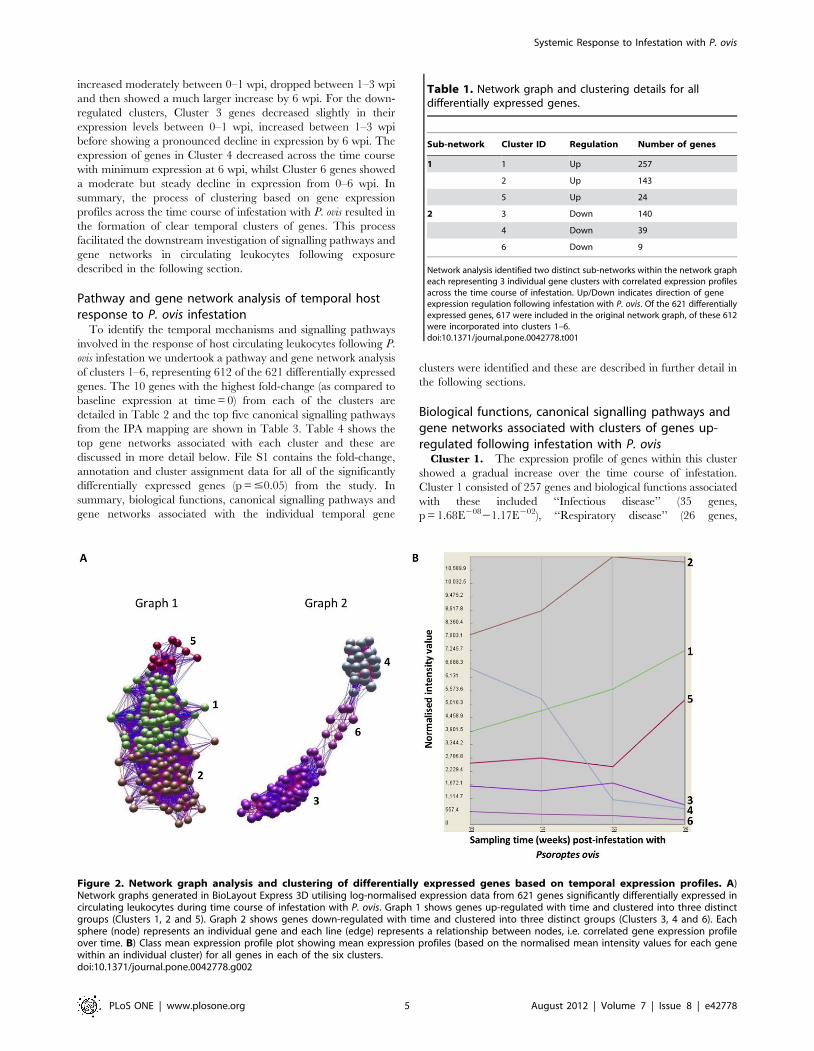
increased moderately between 0–1 wpi, dropped between 1–3 wpi
and then showed a much larger increase by 6 wpi. For the down-
regulated clusters, Cluster 3 genes decreased slightly in their
expression levels between 0–1 wpi, increased between 1–3 wpi
before showing a pronounced decline in expression by 6 wpi. The
expression of genes in Cluster 4 decreased across the time course
with minimum expression at 6 wpi, whilst Cluster 6 genes showed
a moderate but steady decline in expression from 0–6 wpi. In
summary, the process of clustering based on gene expression
profiles across the time course of infestation with P. ovis resulted in
the formation of clear temporal clusters of genes. This process
facilitated the downstream investigation of signalling pathways and
gene networks in circulating leukocytes following exposure
described in the following section.
Pathway and gene network analysis of temporal hostresponse to P. ovis infestation
To identify the temporal mechanisms and signalling pathways
involved in the response of host circulating leukocytes following P.
ovis infestation we undertook a pathway and gene network analysis
of clusters 1–6, representing 612 of the 621 differentially expressed
genes. The 10 genes with the highest fold-change (as compared to
baseline expression at time = 0) from each of the clusters are
detailed in Table 2 and the top five canonical signalling pathways
from the IPA mapping are shown in Table 3. Table 4 shows the
top gene networks associated with each cluster and these are
discussed in more detail below. File S1 contains the fold-change,
annotation and cluster assignment data for all of the significantly
differentially expressed genes (p = #0.05) from the study. In
summary, biological functions, canonical signalling pathways and
gene networks associated with the individual temporal gene
clusters were identified and these are described in further detail in
the following sections.
Biological functions, canonical signalling pathways andgene networks associated with clusters of genes up-regulated following infestation with P. ovis
Cluster 1. The expression profile of genes within this cluster
showed a gradual increase over the time course of infestation.
Cluster 1 consisted of 257 genes and biological functions associated
with these included ‘‘Infectious disease’’ (35 genes,
p = 1.68E20821.17E202), ‘‘Respiratory disease’’ (26 genes,
Figure 2. Network graph analysis and clustering of differentially expressed genes based on temporal expression profiles. A)Network graphs generated in BioLayout Express 3D utilising log-normalised expression data from 621 genes significantly differentially expressed incirculating leukocytes during time course of infestation with P. ovis. Graph 1 shows genes up-regulated with time and clustered into three distinctgroups (Clusters 1, 2 and 5). Graph 2 shows genes down-regulated with time and clustered into three distinct groups (Clusters 3, 4 and 6). Eachsphere (node) represents an individual gene and each line (edge) represents a relationship between nodes, i.e. correlated gene expression profileover time. B) Class mean expression profile plot showing mean expression profiles (based on the normalised mean intensity values for each genewithin an individual cluster) for all genes in each of the six clusters.doi:10.1371/journal.pone.0042778.g002
Table 1. Network graph and clustering details for alldifferentially expressed genes.
Sub-network Cluster ID Regulation Number of genes
1 1 Up 257
2 Up 143
5 Up 24
2 3 Down 140
4 Down 39
6 Down 9
Network analysis identified two distinct sub-networks within the network grapheach representing 3 individual gene clusters with correlated expression profilesacross the time course of infestation. Up/Down indicates direction of geneexpression regulation following infestation with P. ovis. Of the 621 differentiallyexpressed genes, 617 were included in the original network graph, of these 612were incorporated into clusters 1–6.doi:10.1371/journal.pone.0042778.t001
Systemic Response to Infestation with P. ovis
PLoS ONE | www.plosone.org 5 August 2012 | Volume 7 | Issue 8 | e42778
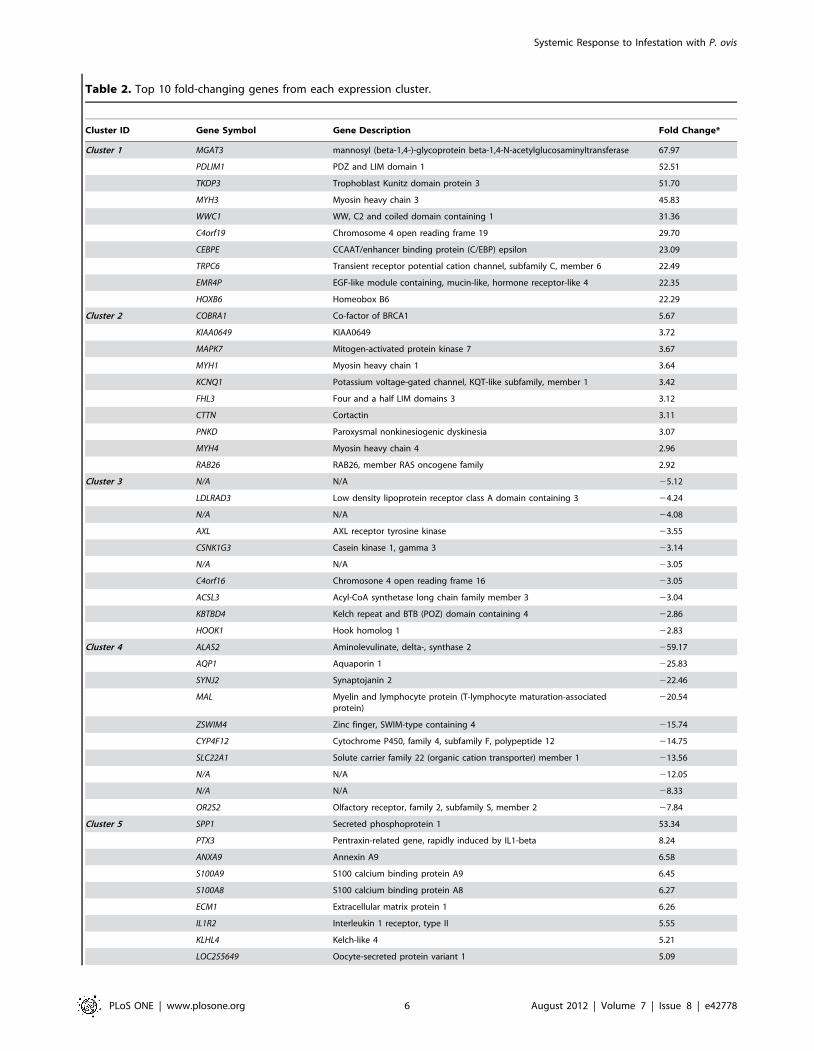
Table 2. Top 10 fold-changing genes from each expression cluster.
Cluster ID Gene Symbol Gene Description Fold Change*
Cluster 1 MGAT3 mannosyl (beta-1,4-)-glycoprotein beta-1,4-N-acetylglucosaminyltransferase 67.97
PDLIM1 PDZ and LIM domain 1 52.51
TKDP3 Trophoblast Kunitz domain protein 3 51.70
MYH3 Myosin heavy chain 3 45.83
WWC1 WW, C2 and coiled domain containing 1 31.36
C4orf19 Chromosome 4 open reading frame 19 29.70
CEBPE CCAAT/enhancer binding protein (C/EBP) epsilon 23.09
TRPC6 Transient receptor potential cation channel, subfamily C, member 6 22.49
EMR4P EGF-like module containing, mucin-like, hormone receptor-like 4 22.35
HOXB6 Homeobox B6 22.29
Cluster 2 COBRA1 Co-factor of BRCA1 5.67
KIAA0649 KIAA0649 3.72
MAPK7 Mitogen-activated protein kinase 7 3.67
MYH1 Myosin heavy chain 1 3.64
KCNQ1 Potassium voltage-gated channel, KQT-like subfamily, member 1 3.42
FHL3 Four and a half LIM domains 3 3.12
CTTN Cortactin 3.11
PNKD Paroxysmal nonkinesiogenic dyskinesia 3.07
MYH4 Myosin heavy chain 4 2.96
RAB26 RAB26, member RAS oncogene family 2.92
Cluster 3 N/A N/A 25.12
LDLRAD3 Low density lipoprotein receptor class A domain containing 3 24.24
N/A N/A 24.08
AXL AXL receptor tyrosine kinase 23.55
CSNK1G3 Casein kinase 1, gamma 3 23.14
N/A N/A 23.05
C4orf16 Chromosone 4 open reading frame 16 23.05
ACSL3 Acyl-CoA synthetase long chain family member 3 23.04
KBTBD4 Kelch repeat and BTB (POZ) domain containing 4 22.86
HOOK1 Hook homolog 1 22.83
Cluster 4 ALAS2 Aminolevulinate, delta-, synthase 2 259.17
AQP1 Aquaporin 1 225.83
SYNJ2 Synaptojanin 2 222.46
MAL Myelin and lymphocyte protein (T-lymphocyte maturation-associatedprotein)
220.54
ZSWIM4 Zinc finger, SWIM-type containing 4 215.74
CYP4F12 Cytochrome P450, family 4, subfamily F, polypeptide 12 214.75
SLC22A1 Solute carrier family 22 (organic cation transporter) member 1 213.56
N/A N/A 212.05
N/A N/A 28.33
OR2S2 Olfactory receptor, family 2, subfamily S, member 2 27.84
Cluster 5 SPP1 Secreted phosphoprotein 1 53.34
PTX3 Pentraxin-related gene, rapidly induced by IL1-beta 8.24
ANXA9 Annexin A9 6.58
S100A9 S100 calcium binding protein A9 6.45
S100A8 S100 calcium binding protein A8 6.27
ECM1 Extracellular matrix protein 1 6.26
IL1R2 Interleukin 1 receptor, type II 5.55
KLHL4 Kelch-like 4 5.21
LOC255649 Oocyte-secreted protein variant 1 5.09
Systemic Response to Infestation with P. ovis
PLoS ONE | www.plosone.org 6 August 2012 | Volume 7 | Issue 8 | e42778
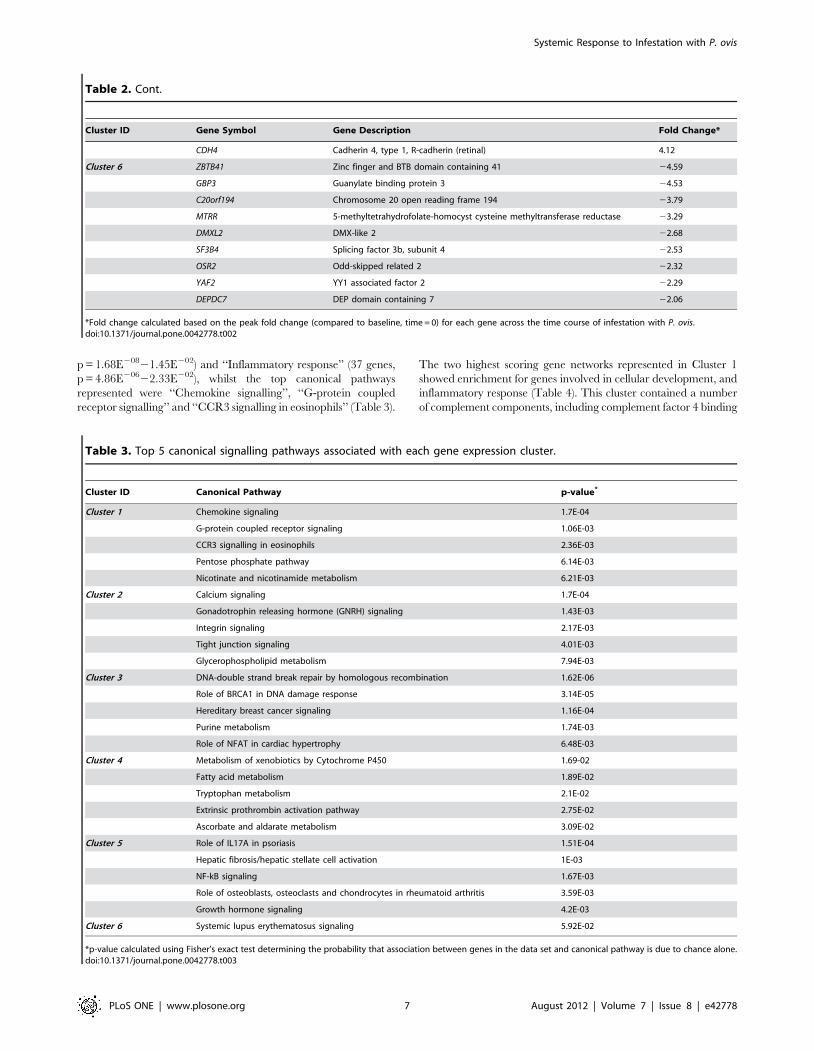
p = 1.68E20821.45E202) and ‘‘Inflammatory response’’ (37 genes,
p = 4.86E20622.33E202), whilst the top canonical pathways
represented were ‘‘Chemokine signalling’’, ‘‘G-protein coupled
receptor signalling’’ and ‘‘CCR3 signalling in eosinophils’’ (Table 3).
The two highest scoring gene networks represented in Cluster 1
showed enrichment for genes involved in cellular development, and
inflammatory response (Table 4). This cluster contained a number
of complement components, including complement factor 4 binding
Table 3. Top 5 canonical signalling pathways associated with each gene expression cluster.
Cluster ID Canonical Pathway p-value*
Cluster 1 Chemokine signaling 1.7E-04
G-protein coupled receptor signaling 1.06E-03
CCR3 signalling in eosinophils 2.36E-03
Pentose phosphate pathway 6.14E-03
Nicotinate and nicotinamide metabolism 6.21E-03
Cluster 2 Calcium signaling 1.7E-04
Gonadotrophin releasing hormone (GNRH) signaling 1.43E-03
Integrin signaling 2.17E-03
Tight junction signaling 4.01E-03
Glycerophospholipid metabolism 7.94E-03
Cluster 3 DNA-double strand break repair by homologous recombination 1.62E-06
Role of BRCA1 in DNA damage response 3.14E-05
Hereditary breast cancer signaling 1.16E-04
Purine metabolism 1.74E-03
Role of NFAT in cardiac hypertrophy 6.48E-03
Cluster 4 Metabolism of xenobiotics by Cytochrome P450 1.69-02
Fatty acid metabolism 1.89E-02
Tryptophan metabolism 2.1E-02
Extrinsic prothrombin activation pathway 2.75E-02
Ascorbate and aldarate metabolism 3.09E-02
Cluster 5 Role of IL17A in psoriasis 1.51E-04
Hepatic fibrosis/hepatic stellate cell activation 1E-03
NF-kB signaling 1.67E-03
Role of osteoblasts, osteoclasts and chondrocytes in rheumatoid arthritis 3.59E-03
Growth hormone signaling 4.2E-03
Cluster 6 Systemic lupus erythematosus signaling 5.92E-02
*p-value calculated using Fisher’s exact test determining the probability that association between genes in the data set and canonical pathway is due to chance alone.doi:10.1371/journal.pone.0042778.t003
Table 2. Cont.
Cluster ID Gene Symbol Gene Description Fold Change*
CDH4 Cadherin 4, type 1, R-cadherin (retinal) 4.12
Cluster 6 ZBTB41 Zinc finger and BTB domain containing 41 24.59
GBP3 Guanylate binding protein 3 24.53
C20orf194 Chromosome 20 open reading frame 194 23.79
MTRR 5-methyltetrahydrofolate-homocyst cysteine methyltransferase reductase 23.29
DMXL2 DMX-like 2 22.68
SF3B4 Splicing factor 3b, subunit 4 22.53
OSR2 Odd-skipped related 2 22.32
YAF2 YY1 associated factor 2 22.29
DEPDC7 DEP domain containing 7 22.06
*Fold change calculated based on the peak fold change (compared to baseline, time = 0) for each gene across the time course of infestation with P. ovis.doi:10.1371/journal.pone.0042778.t002
Systemic Response to Infestation with P. ovis
PLoS ONE | www.plosone.org 7 August 2012 | Volume 7 | Issue 8 | e42778
protein-alpha [C4BPA (6.5-fold up by 6 wpi), C4BPB (12-fold up by
6 wpi), complement component 3a receptor 1[C3AR1 (6.3-fold up
by 6 wpi)] and complement factor properdin (CFP (3-fold up by 6
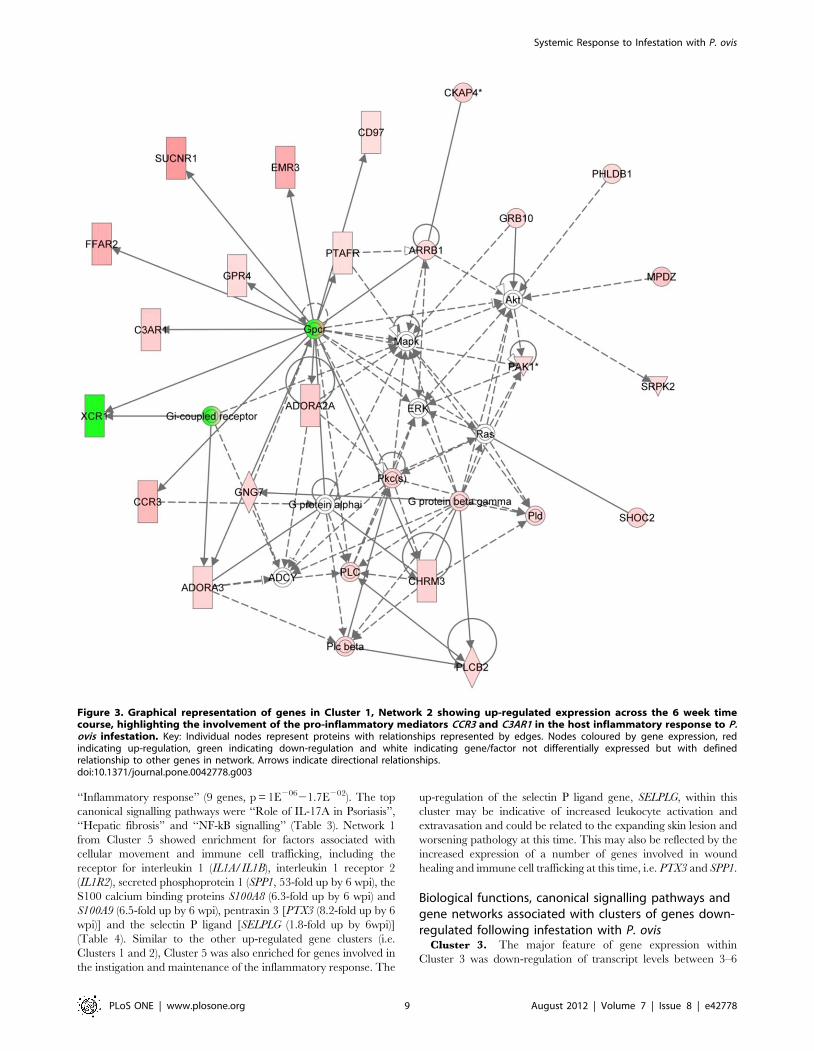
wpi)]. An exemplar network from this cluster is shown in Figure 3
(Cluster 1, Network 2, also see Table 4). This network was enriched
for the following biological functions, inflammatory response, cell
signalling and inflammatory disease and highlighted the up-
regulation at the transcription level of a number of genes involved
in the instigation of the inflammatory response, including CCR3
(7.6-fold up by 6 wpi) and C3AR1 (6.3-fold up by 6 wpi). As such
Cluster 1 showed enrichment for a number of factors involved in the
innate immune response. In particular, genes involved in the
instigation and development of a pro-inflammatory response were
enriched within this cluster, including roles for eosinophil recruit-
ment and complement activation, the expression of which increased
as disease signs and the subsequent inflammatory response
intensified.
Cluster 2. The genes within this cluster showed an initial
increase in expression levels which then began to decline in
magnitude between 3–6 weeks post-infestation. Cluster 2 con-
tained 143 genes and the top biological functions represented were
‘‘Infectious disease’’ (26 genes, p = 1.24E20422.55E202), ‘‘Inflam-
matory response’’ (23 genes, p = 2.37E20422.12E202) and ‘‘Re-
spiratory disease’’ (13 genes, p = 8.45E20422E202), with the top
canonical pathways being ‘‘Calcium signalling’’, ‘‘Gonadotrophin
releasing hormone (GNRH) signalling’’, ‘‘Integrin signalling’’ and
‘‘Tight junction signalling’’ (Table 3). Networks represented within
Cluster 2 were enriched for genes associated with cellular assembly
and organisation, cellular function and maintenance and skeletal
and muscular system development. In particular, Networks 1 and
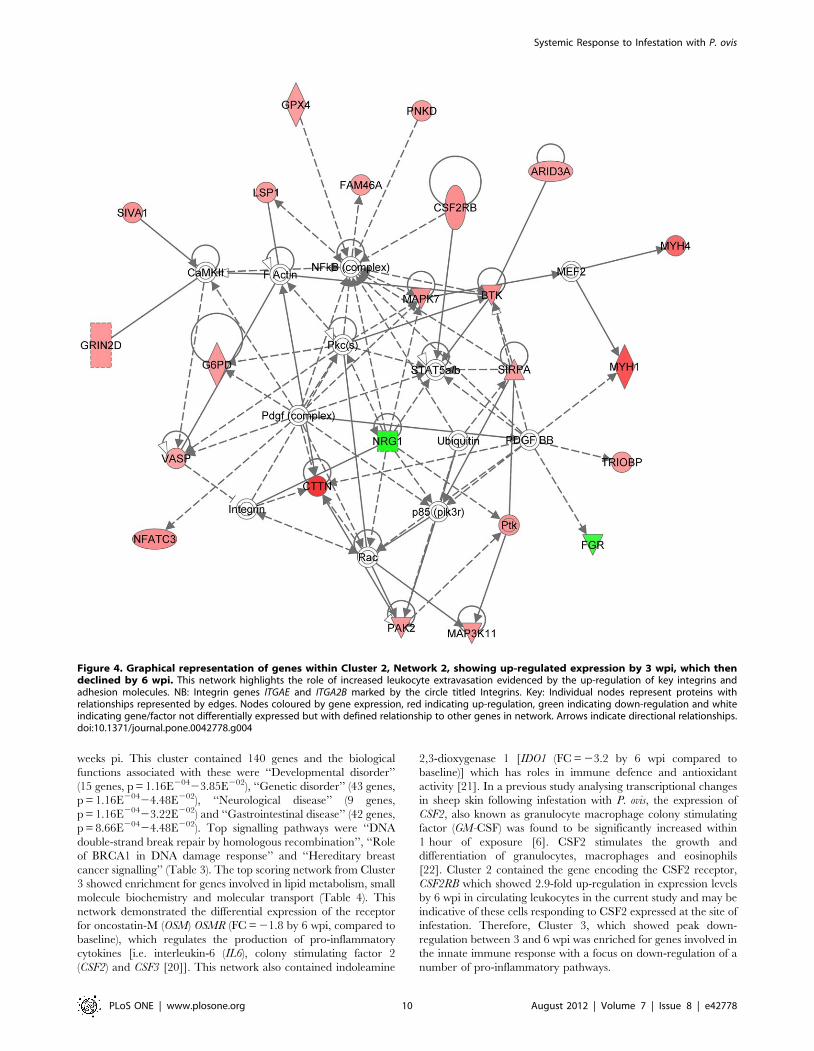
2 [Figure 4 (Showing Cluster 2, Network 2) and Table 4] contain a
number of genes involved in cell migration and adhesion; integrin
alpha E [CD103 (ITGAE) (2.1-fold up regulated by 6 wpi)],
ITGA2B (2.2-fold up by 6 wpi) shown by the group icon ‘Integrin’
in Figure 4, lymphocyte specific protein 1 [LSP1 (1.9-fold by 6
wpi)], ICAM3 (2.9-fold up by 6 wpi), cortactin [CTTN (3.1-fold up
by 6 wpi)], signal regulatory protein alpha [SIRPA (2.1-fold up by 6
wpi)], drebrin 1 [DBN1 (2.3-fold up by 6 wpi)] and calponin 2
[CNN2 (1.8-fold up by 6 wpi)]. Cluster 2 also contained the gene
encoding the plasminogen activator, urokinase (PLAU, 6.3-fold by
6 wpi) which has been shown to expressed by activated leukocytes.
Therefore, Cluster 2 showed enrichment for a number of factors
induced during the pro-inflammatory response with roles in the
activation of leukocytes and triggering their subsequent extrava-
sation into the site of tissue inflammation. The expression of these
genes were up-regulated early on in the infestation, followed by a
subsequent decline between 3 and 6 wpi.
Cluster 5. Genes within this cluster showed a distinct increase
in expression levels between 3 and 6 weeks pi. Cluster 5 consisted of
24 genes and the top biological functions associated with these genes
included ‘‘Cancer’’ (17 genes, p = 2.42E20721.7E202), ‘‘Repro-
ductive system disease’’ (13 genes, p = 8.07E20721.28E202) and
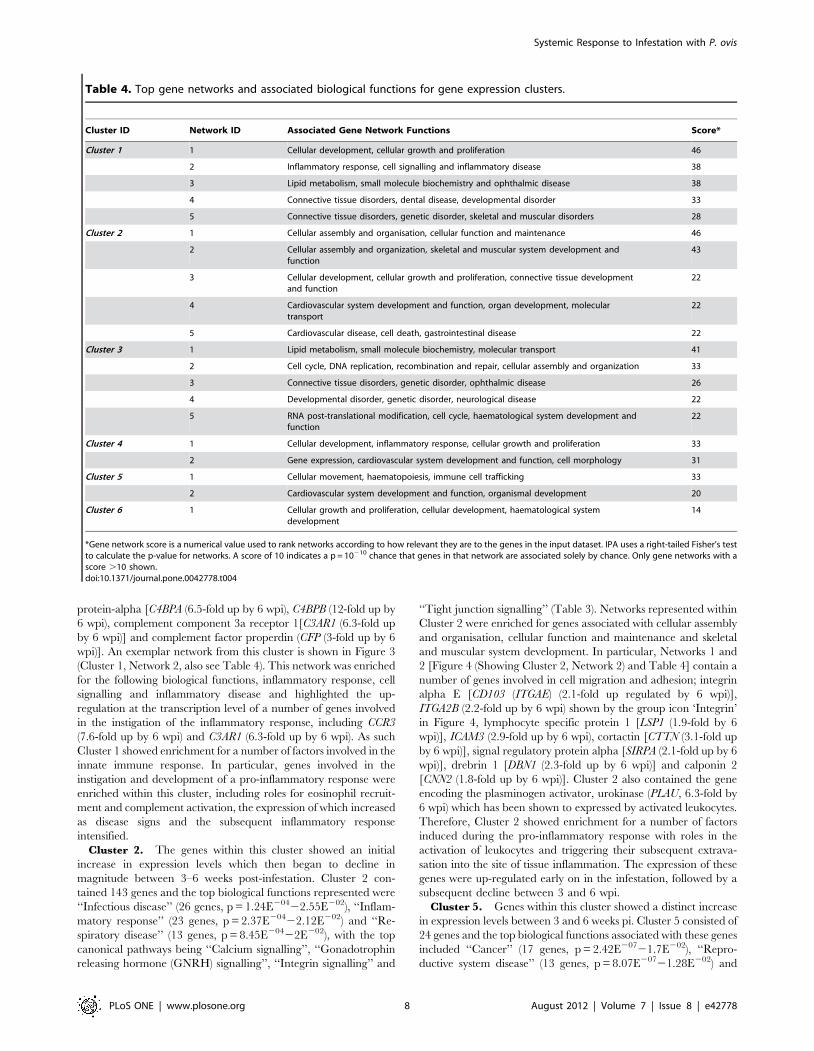
Table 4. Top gene networks and associated biological functions for gene expression clusters.
Cluster ID Network ID Associated Gene Network Functions Score*
Cluster 1 1 Cellular development, cellular growth and proliferation 46
2 Inflammatory response, cell signalling and inflammatory disease 38
3 Lipid metabolism, small molecule biochemistry and ophthalmic disease 38
4 Connective tissue disorders, dental disease, developmental disorder 33
5 Connective tissue disorders, genetic disorder, skeletal and muscular disorders 28
Cluster 2 1 Cellular assembly and organisation, cellular function and maintenance 46
2 Cellular assembly and organization, skeletal and muscular system development andfunction
43
3 Cellular development, cellular growth and proliferation, connective tissue developmentand function
22
4 Cardiovascular system development and function, organ development, moleculartransport
22
5 Cardiovascular disease, cell death, gastrointestinal disease 22
Cluster 3 1 Lipid metabolism, small molecule biochemistry, molecular transport 41
2 Cell cycle, DNA replication, recombination and repair, cellular assembly and organization 33
3 Connective tissue disorders, genetic disorder, ophthalmic disease 26
4 Developmental disorder, genetic disorder, neurological disease 22
5 RNA post-translational modification, cell cycle, haematological system development andfunction
22
Cluster 4 1 Cellular development, inflammatory response, cellular growth and proliferation 33
2 Gene expression, cardiovascular system development and function, cell morphology 31
Cluster 5 1 Cellular movement, haematopoiesis, immune cell trafficking 33
2 Cardiovascular system development and function, organismal development 20
Cluster 6 1 Cellular growth and proliferation, cellular development, haematological systemdevelopment
14
*Gene network score is a numerical value used to rank networks according to how relevant they are to the genes in the input dataset. IPA uses a right-tailed Fisher’s testto calculate the p-value for networks. A score of 10 indicates a p = 10210 chance that genes in that network are associated solely by chance. Only gene networks with ascore .10 shown.doi:10.1371/journal.pone.0042778.t004
Systemic Response to Infestation with P. ovis
PLoS ONE | www.plosone.org 8 August 2012 | Volume 7 | Issue 8 | e42778
‘‘Inflammatory response’’ (9 genes, p = 1E20621.7E202). The top
canonical signalling pathways were ‘‘Role of IL-17A in Psoriasis’’,
‘‘Hepatic fibrosis’’ and ‘‘NF-kB signalling’’ (Table 3). Network 1
from Cluster 5 showed enrichment for factors associated with
cellular movement and immune cell trafficking, including the
receptor for interleukin 1 (IL1A/IL1B), interleukin 1 receptor 2
(IL1R2), secreted phosphoprotein 1 (SPP1, 53-fold up by 6 wpi), the
S100 calcium binding proteins S100A8 (6.3-fold up by 6 wpi) and
S100A9 (6.5-fold up by 6 wpi), pentraxin 3 [PTX3 (8.2-fold up by 6
wpi)] and the selectin P ligand [SELPLG (1.8-fold up by 6wpi)]
(Table 4). Similar to the other up-regulated gene clusters (i.e.
Clusters 1 and 2), Cluster 5 was also enriched for genes involved in
the instigation and maintenance of the inflammatory response. The
up-regulation of the selectin P ligand gene, SELPLG, within this
cluster may be indicative of increased leukocyte activation and
extravasation and could be related to the expanding skin lesion and
worsening pathology at this time. This may also be reflected by the
increased expression of a number of genes involved in wound
healing and immune cell trafficking at this time, i.e. PTX3 and SPP1.
Biological functions, canonical signalling pathways andgene networks associated with clusters of genes down-regulated following infestation with P. ovis
Cluster 3. The major feature of gene expression within
Cluster 3 was down-regulation of transcript levels between 3–6
Figure 3. Graphical representation of genes in Cluster 1, Network 2 showing up-regulated expression across the 6 week timecourse, highlighting the involvement of the pro-inflammatory mediators CCR3 and C3AR1 in the host inflammatory response to P.ovis infestation. Key: Individual nodes represent proteins with relationships represented by edges. Nodes coloured by gene expression, redindicating up-regulation, green indicating down-regulation and white indicating gene/factor not differentially expressed but with definedrelationship to other genes in network. Arrows indicate directional relationships.doi:10.1371/journal.pone.0042778.g003
Systemic Response to Infestation with P. ovis
PLoS ONE | www.plosone.org 9 August 2012 | Volume 7 | Issue 8 | e42778
weeks pi. This cluster contained 140 genes and the biological
functions associated with these were ‘‘Developmental disorder’’
(15 genes, p = 1.16E20423.85E202), ‘‘Genetic disorder’’ (43 genes,
p = 1.16E20424.48E202), ‘‘Neurological disease’’ (9 genes,
p = 1.16E20423.22E202) and ‘‘Gastrointestinal disease’’ (42 genes,
p = 8.66E20424.48E202). Top signalling pathways were ‘‘DNA
double-strand break repair by homologous recombination’’, ‘‘Role
of BRCA1 in DNA damage response’’ and ‘‘Hereditary breast
cancer signalling’’ (Table 3). The top scoring network from Cluster
3 showed enrichment for genes involved in lipid metabolism, small
molecule biochemistry and molecular transport (Table 4). This
network demonstrated the differential expression of the receptor
for oncostatin-M (OSM) OSMR (FC = 21.8 by 6 wpi, compared to
baseline), which regulates the production of pro-inflammatory
cytokines [i.e. interleukin-6 (IL6), colony stimulating factor 2
(CSF2) and CSF3 [20]]. This network also contained indoleamine
2,3-dioxygenase 1 [IDO1 (FC = 23.2 by 6 wpi compared to
baseline)] which has roles in immune defence and antioxidant
activity [21]. In a previous study analysing transcriptional changes
in sheep skin following infestation with P. ovis, the expression of
CSF2, also known as granulocyte macrophage colony stimulating
factor (GM-CSF) was found to be significantly increased within
1 hour of exposure [6]. CSF2 stimulates the growth and
differentiation of granulocytes, macrophages and eosinophils
[22]. Cluster 2 contained the gene encoding the CSF2 receptor,
CSF2RB which showed 2.9-fold up-regulation in expression levels
by 6 wpi in circulating leukocytes in the current study and may be
indicative of these cells responding to CSF2 expressed at the site of
infestation. Therefore, Cluster 3, which showed peak down-
regulation between 3 and 6 wpi was enriched for genes involved in
the innate immune response with a focus on down-regulation of a
number of pro-inflammatory pathways.
Figure 4. Graphical representation of genes within Cluster 2, Network 2, showing up-regulated expression by 3 wpi, which thendeclined by 6 wpi. This network highlights the role of increased leukocyte extravasation evidenced by the up-regulation of key integrins andadhesion molecules. NB: Integrin genes ITGAE and ITGA2B marked by the circle titled Integrins. Key: Individual nodes represent proteins withrelationships represented by edges. Nodes coloured by gene expression, red indicating up-regulation, green indicating down-regulation and whiteindicating gene/factor not differentially expressed but with defined relationship to other genes in network. Arrows indicate directional relationships.doi:10.1371/journal.pone.0042778.g004
Systemic Response to Infestation with P. ovis
PLoS ONE | www.plosone.org 10 August 2012 | Volume 7 | Issue 8 | e42778
Cluster 4. The expression of genes in Cluster 4 was reduced
between 0 and 1 wpi (Figure 2 b). This reduction was accentuated
between weeks 1 and 3 post-infestation and expression levels
remained low and declining between weeks 3 and 6 pi. Cluster 4
consisted of 39 genes and the top biological functions associated
with these genes were ‘‘Dermatological disease and conditions’’ (2
genes, p = 6.09E20521.74E203), ‘‘Genetic disorder’’ (20 genes,
p = 6.09E20522.92E202) and ‘‘Inflammatory disorder’’ (7 genes,
p = 2E20423.96E202), whilst the top signalling pathways were
‘‘Metabolism of xenobiotics by Cytochrome P450’’, ‘‘Fatty acid
metabolism’’ and ‘‘Tryptophan metabolism’’ (Table 3). Two
significant gene networks were identified from Cluster 4 (Networks
1 and 2) and were associated with genes involved in cellular
development, inflammatory response, cellular growth and prolif-
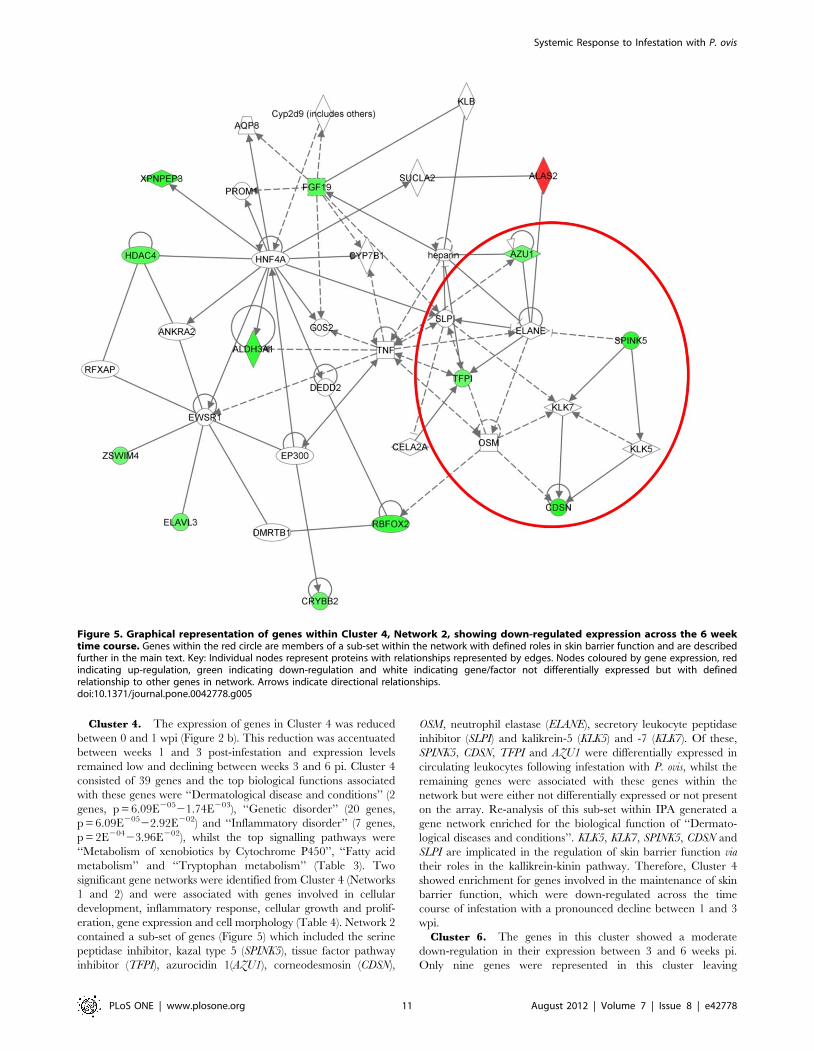
eration, gene expression and cell morphology (Table 4). Network 2
contained a sub-set of genes (Figure 5) which included the serine
peptidase inhibitor, kazal type 5 (SPINK5), tissue factor pathway
inhibitor (TFPI), azurocidin 1(AZU1), corneodesmosin (CDSN),
OSM, neutrophil elastase (ELANE), secretory leukocyte peptidase
inhibitor (SLPI) and kalikrein-5 (KLK5) and -7 (KLK7). Of these,
SPINK5, CDSN, TFPI and AZU1 were differentially expressed in
circulating leukocytes following infestation with P. ovis, whilst the
remaining genes were associated with these genes within the
network but were either not differentially expressed or not present
on the array. Re-analysis of this sub-set within IPA generated a
gene network enriched for the biological function of ‘‘Dermato-
logical diseases and conditions’’. KLK5, KLK7, SPINK5, CDSN and
SLPI are implicated in the regulation of skin barrier function via
their roles in the kallikrein-kinin pathway. Therefore, Cluster 4
showed enrichment for genes involved in the maintenance of skin
barrier function, which were down-regulated across the time
course of infestation with a pronounced decline between 1 and 3
wpi.
Cluster 6. The genes in this cluster showed a moderate
down-regulation in their expression between 3 and 6 weeks pi.
Only nine genes were represented in this cluster leaving
Figure 5. Graphical representation of genes within Cluster 4, Network 2, showing down-regulated expression across the 6 weektime course. Genes within the red circle are members of a sub-set within the network with defined roles in skin barrier function and are describedfurther in the main text. Key: Individual nodes represent proteins with relationships represented by edges. Nodes coloured by gene expression, redindicating up-regulation, green indicating down-regulation and white indicating gene/factor not differentially expressed but with definedrelationship to other genes in network. Arrows indicate directional relationships.doi:10.1371/journal.pone.0042778.g005
Systemic Response to Infestation with P. ovis
PLoS ONE | www.plosone.org 11 August 2012 | Volume 7 | Issue 8 | e42778
insufficient data for effective pathway mapping. One signalling
pathway was associated with these genes ‘‘Systemic lupus
erythematosus signalling’’ (Table 3). However, no significant
networks were associated with this cluster.
qPCR validation of microarray dataqPCR confirmation of the microarray results was undertaken
for 10 putatively differentially expressed genes. qPCR assays were
based on bovine transcripts and performed with ovine circulating
leukocyte cDNA generated from the same RNA samples used for
the microarray study. Overall the fold change data showed a mean
correlation co-efficient of 0.82 between the microarray and qPCR
datasets (Data not shown). The differential expression of the
selected genes was considered to be validated as the qPCR
expression profile over the time course of infestation for the
majority of these genes mirrored that of the microarray data.
Discussion
This study had two main aims: i) to examine the systemic
inflammatory response in a production animal using an econom-
ically-important host:pathogen model and, ii) to establish whether
circulating leukocytes in sheep could act as remote ‘sentinels’ of the
cutaneous inflammatory response characteristic of infestation with
P. ovis. To achieve these aims we investigated the whole population
of circulating leukocytes over a time course of infestation rather
than fractionating samples into distinct cell sub-sets prior to
analysis. This approach was followed to give a global picture of
gene expression profiles in circulating leucocytes but also allowed
us to avoid a prolonged period between sampling blood and the
subsequent RNA stabilisation and extraction, which can lead to
significant ex vivo changes in gene expression profiles [23]. In
addition, by fractionating and isolating leukocytes from whole
blood prior to RNA extraction we were able to limit contamina-
tion with globin transcripts, which can represent up to 70% of total
mRNA and lead to significant skewing of gene expression data
[24,25]. One limitation of this approach is that, as blood is a
relatively heterogenous tissue comprised of multiple cell types and
sub-sets, it does not allow discrimination between differential gene
expression due to changes in cell sub-set proportions over time and
changes in sub-set specific gene expression. As such, increased
gene expression may equally represent an increase in the number
of a particular cell sub-set in circulation, i.e. neutrophils, or
increased expression by individual cells. The use of differential cell
counts may have aided in further elucidation of these responses, in
particular with cell sub-set specific expression patterns, i.e. CCR3
in eosinophils and basophils, but the main focus here was the
elucidation of expression changes in the whole leukocyte
population as a ‘sentinel’ of local tissue events. In addition, as
the clustering analysis highlighted the presence of a range of
different gene expression patterns across the time course of
infestation it is unlikely that all of these were attributable to cell
sub-set specific expression/expansion. At the instigation of this
study no suitable ovine microarray platforms were available; as
such we opted to perform a cross-species microarray analysis using
the Agilent bovine gene expression microarray. Cattle and sheep
orthologues share a mean transcript sequence identity of 97%
[26,27,28] and previous studies have successfully used bovine
microarrays for the analysis of ovine samples, further supporting
the use of this type of analysis [29,30,31].
Infestation of sheep with P. ovis results in a cutaneous pro-
inflammatory response within minutes of contact [6]. However,
the timing and nature of the systemic inflammatory response is
unknown so we conducted our analyses over a 6 week time course
of infestation, during which the characteristic skin lesion develops.
The process of clustering genes based on their expression profiles
following infestation represented a successful method of grouping
genes and facilitated further investigation of the signalling events
in circulating leukocytes following exposure. A clearer picture is
now emerging of the molecular events in these circulating cells
following infestation, characterised by the up-regulated expression
of genes involved in a number of biological pathways including
complement activation, chemokine signalling, integrin and tight
junction signalling and calcium activation. In addition, repressed
pathways included those involved in the regulation of skin barrier
function and certain aspects of the inflammatory response which
occur later in the course of infestation. These events and pathways
are discussed in further detail below in the context of their
temporal regulation during infestation with P. ovis.
Pro-inflammatory response factorsOne of the main implications of the local pro-inflammatory
cascade following infestation with P. ovis is activation and
recruitment of circulating leukocytes. Those found to be promi-
nent at the site of infestation within the first few hours post-
infestation are neutrophils and eosinophils [5], for which IL8
represents a powerful chemoattractant [32]. These cells react to
the presence of pro-inflammatory cytokines through the expression
of receptors [33] and, of particular interest in the present study
because of their roles in the activation of immune cells, were the
increased expression of CCR3 and C3AR1 within Cluster 1, and
the IL4 receptor (IL4R, 1.8-fold up by 6 wpi) within Cluster 2.
CCR3 acts as a receptor for a range of chemokines including,
chemokine (C-C motif) ligand 11 (CCL11 or eotaxin), (CCL26
(eotaxin-3), CCL5 (RANTES), CCL7 [Monocyte chemoattractant
protein 3 (MCP-3)] and CCL13 (MCP-4), a number of which have
previously been shown to be up-regulated in sheep skin within a
few hours of exposure to P. ovis [6]. C3AR1 is a receptor for the
pro-inflammatory anaphylatoxin C3a and stimulates chemotaxis,
mast cell degranulation and production of superoxide anions [34].
CCR3 expression was also shown previously to be increased in
sheep skin following infestation with P. ovis and may be indicative
of eosinophil and/or basophil activation (CCR3) and also
complement activation (C3AR1) in response to infestation [6,35].
In addition, the increased expression levels of IL4R in circulating
leukocytes may indicate immune cell responses to the presence of
locally produced IL4 and IL13, both of which play prominent roles
in the development of a pro-allergic, Th2 biased, immune
response and have also been shown to be up-regulated in P. ovis
infested sheep skin [6,36,37]. We have demonstrated that a
number of pro-inflammatory genes and signalling pathways are
involved during the early stages of a P. ovis infestation. The
temporal nature of this response was reflected by the enrichment
of these pathways across both Clusters 1 and 2, representing up-
regulated gene expression between 0–1 and 1–3 wpi, respectively.
Leukocyte extravasation and activationOnce activated, immune mediator cells express ligands and
receptors which aid binding to the endothelial lining, initiating
leukocyte extravasation and immune cell infiltration [38,39,40,41].
We have demonstrated previously the increased expression of
transcripts representing selectins, integrins and other adhesion
molecules including selectin-E (SELE), -P (SELP), -L (SELL),
integrin beta 2 (ITGB2), ITGB6, intercellular adhesion molecule 1
(ICAM1) and ICAM3 in sheep skin following infestation with P. ovis
[6]. In the present study, analysing gene expression in circulating
leukocytes in response to P. ovis infestation, Cluster 2 was enriched
for genes involved in the canonical pathways ‘‘Integrin signalling’’
Systemic Response to Infestation with P. ovis
PLoS ONE | www.plosone.org 12 August 2012 | Volume 7 | Issue 8 | e42778
and ‘‘Tight junction signalling’’ and amongst the up-regulated
genes in this cluster were those encoding ITGAE and ITGA2B,
LSP1 and ICAM3, which acts as a ligand for ITGB2; also
previously shown to be up-regulated in P. ovis infested sheep skin
[6,42]. In Cluster 5, increased expression of SELPLG was
observed, which acts as a receptor for the selectin molecules
(SELE, SELP and SELL) expressed on the endothelial surface
during an inflammatory reaction [43]. This receptor-ligand
interaction is critical in the initial capture of circulating leukocytes
and SELPLG also mediates the rolling of leukocytes, preparing
these cells for extravasation into inflamed tissue [43]. Once
activated circulating leukocytes bind to specific ligands/receptors
on epithelial cells, slowing their progress and encouraging the
leukocytes to begin rolling along the epithelial surface. At this
point their morphology changes and the cells become flattened in
preparation for the process of extravasating across the epithelial
surface to the site of inflamed tissue. This process is reflected in a
temporal manner with enrichment for genes involved in leukocyte
activation and extravasation across both Clusters 2 and 5,
representing up-regulated gene expression between 1–3 and 3–6
wpi.
Pro-inflammatory mediator releaseIn addition to triggering cell extravasation, the activation of
immune mediator cells also acts as a signal for the release of pro-
inflammatory molecules and Cluster 5 contained a number of key
pro-inflammatory mediators, i.e. PTX3, S100A8, S100A9, SPP1
and myeloperoxidase (MPO) which forms the major component of
neutrophil azurophilic granules [44] (2.7-fold up between 3–6
wpi). Together, S100A8 and S100A9 represent up to 60% of the
cytosolic protein in neutrophils and are also released by
keratinocytes [45,46,47]. Previous analysis of the skin response
to P. ovis infestation demonstrated an increase in the expression of
S100A9 [6] and the putative conserved roles of S100A8 and
S100A9 in contact dermatitis [48] and sheep scab have been
discussed previously [6]. Importantly, S100A8 and S100A9 have
been shown to regulate vascular inflammation and to promote
recruitment of leukocytes to local tissue sites [49]. The release of
these factors by activated keratinocytes has been implicated in the
development of skin disease and may initiate immune mediator
invasion, which could be exacerbated further by release from
circulating neutrophils as implied from the analysis described
herein [47]. SPP1 has roles in the migration and recruitment of
neutrophils and has been implicated in the development of allergic
contact dermatitis - as such it may also play an important role in
sheep scab pathogenesis [50].
Skin barrier disruptionA sub-set was identified within Cluster 4, network 2, enriched
for genes involved in ‘‘Dermatological diseases and conditions’’.
This sub-set included a number of genes including KLK5, KLK7,
SPINK5, CDSN and SLPI with decreased expression levels
following infestation and with functions in the regulation of skin
barrier function. The protease inhibitors SPINK5 and SLPI have
anti-inflammatory roles that contribute to the integrity of the skin
barrier by protecting epithelial surfaces from the action of pro-
inflammatory proteases [51,52]. The maintenance of an effective
skin barrier plays a crucial role in the prevention of allergen
sensitisation and previous analysis of the skin response to P. ovis
infestation demonstrated the down-regulation of a number of
genes involved in the process of epidermal differentiation, i.e.
filaggrin, loricrin and involucrin [6]. It has also been demonstrated
that a Th2 response, particularly involving the increased
expression of IL4 and IL13, as demonstrated in sheep scab
infestation [6], can affect skin barrier integrity by down-regulating
expression of these genes [53,54].
Complement system and systemic inflammatoryresponse
The complement system forms an integral arm of innate
immunity and plays a crucial role in targeting pathogens and other
foreign entities through opsonisation, cell lysis and immune cell
recruitment [55]. Activation of complement has previously been
described in the host response to P. ovis in sheep and in the
response of humans to the scabies mite Sarcoptes scabiei and house
dust mite (HDM) allergens [6,56,57]. Complement factor I (CFI)
present in Cluster 5, displayed increased levels of expression
following infestation. In addition, Cluster 1 contained a number of
up-regulated complement factor genes, including C4BPA, C4BPB,
C3AR1 and CFP. C4BPA and C4BPB control activation of the
classical complement pathway, whilst C3AR1 is the receptor for
complement component 3a (C3a), produced from C3 (along with
C3b) following proteolytic cleavage by C3 convertase [58]. Taken
together these findings suggest activation of complement at the
systemic level, in circulating leukocytes, following infestation with
P. ovis, the outcome of which is likely to be the targeting of mites
and/or mite antigens by the host immune response. Previous
analysis of the cutaneous response to infestation with P. ovis
demonstrated increased expression levels of CFP, CFI, CFB,
C4BPA and also C5AR1 [6]. In addition, previous studies have
shown that the HDM allergen Der p 3 [for which a P. ovis
homologue, Pso o 3 exists, (S.T.G. Burgess, Unpublished data)]
has been shown to be capable of cleaving both C3 and C5,
producing the anaphylatoxins C3a and C5a, respectively [56].
These factors trigger the release of histamine from mast cells and
also act as chemoattractants for circulating leukocytes, i.e.
neutrophils and their release may therefore further contribute to
the pathogenesis of inflammatory and allergic disease [56]. Studies
involving S. scabiei have shown that these mites produce a
repertoire of inactivated serine proteases termed scabies mite
inactivated protease paralogs (SMIPPs), which inhibit comple-
ment, protecting mites from complement-mediated damage [57].
To date, no P. ovis homologues of the S. scabiei SMIPPs have been
identified, although P. ovis genomic and transcriptomic sequence
data remains limited. A second mechanism through which
complement may be activated in response to P. ovis is via the
clotting cascade following local tissue injury [59]. This cascade
produces the vasoactive peptides killidin and bradykinin which
increase vascular permeability at the site of injury [59]. The HDM
serine protease Der p 3 has been shown to activate this cascade,
resulting in the generation of bradykinin and instigation of an
inflammatory response [60,61]. Cluster 2 also contained PLAU
which is expressed by activated leukocytes and acts to enhance cell
adhesion [62]. PLAU cleaves plasminogen, releasing plasmin and
triggering the process of fibrinolysis, which acts as a counter
balance to the clotting cascade by lysing fibrin and preventing
blood clot formation [63]. Analysis of P. ovis protease activity
demonstrated that mite extracts were capable of digesting
fibronectin, indicating a possible role for the fibronectin pathway
in lesion development [64].
Based on the observations herein we propose that contact with
sheep scab mite allergens may trigger the release of pro-
inflammatory cytokines and activation of the complement
pathway, these factors then act as chemotactic agents for the
recruitment of neutrophils to the site of infestation and the
induction of an acute phase response. In addition, the anaphyl-
atoxins C3a and C5a, either produced locally by complement
activation, or following cleavage by mite derived proteases, induce
Systemic Response to Infestation with P. ovis
PLoS ONE | www.plosone.org 13 August 2012 | Volume 7 | Issue 8 | e42778
local mast cell degranulation and release of histamine, leading to
vasodilation and contraction of smooth muscle. The subsequent
increase in vascular permeability and leukocyte extravasation,
triggered by cytokine activated epithelium and leukocyte activa-
tion induces further inflammation at the site of infestation, leading
to the worsening of disease symptoms, i.e. the inflamed skin and
exudate characteristic of the sheep scab lesion. Here we used
circulating leukocyte responses to assess the systemic effects of P.
ovis infestation. Whilst this analysis has provided key insights into
the broader inflammatory response to infestation, these cells have
also acted as a proxy of events occurring in the skin, providing
novel insights into the mechanisms by which a local allergen-
induced inflammatory response may be controlled.
Supporting Information
File S1 Contains the fold-change, annotation and clus-ter assignment data for all of the significantly differen-
tially expressed genes (p = #0.05) in circulating leuko-cyte RNA following infestation with P. ovis.
(XLSX)
Acknowledgments
The authors would like to express their gratitude to the Division of
Pathway Medicine, University of Edinburgh, UK for their help with
microarray scanning. We would also like to thank our colleagues at
Moredun Bioservices and in the Division of Parasitology for their
continued help and expertise.
Author Contributions
Conceived and designed the experiments: STGB AJN JFH. Performed the
experiments: STGB AG DF BW EJM. Analyzed the data: STGB EJM
BW. Contributed reagents/materials/analysis tools: AG. Wrote the paper:
STGB AJN JFH.
References
1. Kirkwood AC (1986) History, biology and control of sheep scab. Parasitol Today
2: 302–307.
2. Nisbet AJ, Huntley JF (2006) Progress and opportunities in the development of
vaccines against mites, fleas and myiasis-causing flies of veterinary importance.
Parasite Immunol 28: 165–172.
3. van den Broek AH, Huntley JF (2003) Sheep scab: the disease, pathogenesis and
control. J Comp Pathol 128: 79–91.
4. van den Broek AH, Else RW, Huntley JF, Machell J, Taylor MA, et al. (2004)
Early innate and longer-term adaptive cutaneous immunoinflammatory
responses during primary infestation with the sheep scab mite, Psoroptes ovis.
J Comp Pathol 131: 318–329.
5. van den Broek AH, Huntley JF, MacHell J, Taylor M, Bates P, et al. (2000)
Cutaneous and systemic responses during primary and challenge infestations of
sheep with the sheep scab mite, Psoroptes ovis. Parasite Immunol 22: 407–414.
6. Burgess ST, Frew D, Nunn F, Watkins CA, McNeilly TN, et al. (2010)
Transcriptomic analysis of the temporal host response to skin infestation with the
ectoparasitic mite Psoroptes ovis. BMC Genomics 11: 624.
7. Nau GJ, Richmond JF, Schlesinger A, Jennings EG, Lander ES, et al. (2002)
Human macrophage activation programs induced by bacterial pathogens. Proc
Natl Acad Sci U S A 99: 1503–1508.
8. Huang Q, Liu D, Majewski P, Schulte LC, Korn JM, et al. (2001) The plasticity
of dendritic cell responses to pathogens and their components. Science 294: 870–
875.
9. Alberts B, Johnson A, Lewis J, Raff M, Roberts K, et al. (2007) Molecular
Biology of the Cell. New York: Garland Science.
10. Luster AD (1998) Chemokines–chemotactic cytokines that mediate inflamma-
tion. N Engl J Med 338: 436–445.
11. Liew CC, Ma J, Tang HC, Zheng R, Dempsey AA (2006) The peripheral blood
transcriptome dynamically reflects system wide biology: a potential diagnostic
tool. J Lab Clin Med 147: 126–132.
12. Ramilo O, Allman W, Chung W, Mejias A, Ardura M, et al. (2007) Gene
expression patterns in blood leukocytes discriminate patients with acute
infections. Blood 109: 2066–2077.
13. Wu K, Miyada G, Martin J, Finkelstein D (2007) Globin reduction protocol: a
method for processing whole blood RNA samples for improved array results.
Affymetrix Technical Note. Available at: http://mediaaffymetrixcom:80/
support/technical/technotes/blood2_technotepdf.
14. Schroeder A, Mueller O, Stocker S, Salowsky R, Leiber M, et al. (2006) The
RIN: an RNA integrity number for assigning integrity values to RNA
measurements. BMC Mol Biol 7: 3.
15. Benjamini Y, Hochberg Y (1995) Controlling the false discovery rate: a practical
and powerful approach to multiple testing. Journal of the Royal Statistical
Society Series B 57: 289–300.
16. Theocharidis A, van Dongen S, Enright AJ, Freeman TC (2009) Network
visualization and analysis of gene expression data using BioLayout Express(3D).
Nat Protoc 4: 1535–1550.
17. van Dongen S (2000) Graph clustering by flow simulation. [PhD dissertation]
Utercht (The Netherlands): University of Utrecht: 169.
18. Livak KJ, Schmittgen TD (2001) Analysis of relative gene expression data using
real-time quantitative PCR and the 2(2Delta Delta C(T)) Method. Methods 25:
402–408.
19. Schmittgen TD, Livak KJ (2008) Analyzing real-time PCR data by the
comparative C(T) method. Nat Protoc 3: 1101–1108.
20. Rose TM, Bruce AG (1991) Oncostatin M is a member of a cytokine family that
includes leukemia-inhibitory factor, granulocyte colony-stimulating factor, and
interleukin 6. Proc Natl Acad Sci U S A 88: 8641–8645.
21. Prendergast GC, Chang MY, Mandik-Nayak L, Metz R, Muller AJ (2011)
Indoleamine 2,3-dioxygenase as a modifier of pathogenic inflammation in
cancer and other inflammation-associated diseases. Curr Med Chem 18: 2257–
2262.
22. Hamilton JA, Anderson GP (2004) GM-CSF Biology. Growth Factors 22: 225–
231.
23. Pahl A, Brune K (2002) Gene expression changes in blood after phlebotomy:
implications for gene expression profiling. Blood 100: 1094–1095.
24. Raghavachari N, Xu X, Munson PJ, Gladwin MT (2009) Characterization of
whole blood gene expression profiles as a sequel to globin mRNA reduction in
patients with sickle cell disease. PLoS One 4: e6484.
25. Min JL, Barrett A, Watts T, Pettersson FH, Lockstone HE, et al. (2010)
Variability of gene expression profiles in human blood and lymphoblastoid cell
lines. BMC Genomics 11: 96.
26. Ji S, Willis GM, Scott RR, Spurlock ME (1998) Partial cloning and expression of
the bovine leptin gene. Anim Biotechnol 9: 1–14.
27. Liu W, Brayton KA, Lagerquist J, Foreyt WJ, Srikumaran S (2006) Cloning and
comparison of bighorn sheep CD18 with that of domestic sheep, goats, cattle,
humans and mice. Vet Immunol Immunopathol 110: 11–16.
28. Menzies M, Ingham A (2006) Identification and expression of Toll-like receptors
1–10 in selected bovine and ovine tissues. Vet Immunol Immunopathol 109: 23–
30.
29. Vuocolo T, Byrne K, White J, McWilliam S, Reverter A, et al. (2007)
Identification of a gene network contributing to hypertrophy in callipyge skeletal
muscle. Physiol Genomics 28: 253–272.
30. Fleming-Waddell JN, Wilson LM, Olbricht GR, Vuocolo T, Byrne K, et al.
(2007) Analysis of gene expression during the onset of muscle hypertrophy in
callipyge lambs. Anim Genet 38: 28–36.
31. Kijas JW, Menzies M, Ingham A (2006) Sequence diversity and rates of
molecular evolution between sheep and cattle genes. Anim Genet 37: 171–174.
32. Seow HF, Yoshimura T, Wood PR, Colditz IG (1994) Cloning, sequencing,
expression and inflammatory activity in skin of ovine interleukin-8. Immunol
Cell Biol 72: 398–405.
33. Kitayama J, Mackay CR, Ponath PD, Springer TA (1998) The C-C chemokine
receptor CCR3 participates in stimulation of eosinophil arrest on inflammatory
endothelium in shear flow. J Clin Invest 101: 2017–2024.
34. Peng Q, Li K, Sacks SH, Zhou W (2009) The role of anaphylatoxins C3a and
C5a in regulating innate and adaptive immune responses. Inflamm Allergy Drug
Targets 8: 236–246.
35. Daffern PJ, Pfeifer PH, Ember JA, Hugli TE (1995) C3a is a chemotaxin for
human eosinophils but not for neutrophils. I. C3a stimulation of neutrophils is
secondary to eosinophil activation. J Exp Med 181: 2119–2127.
36. Wills-Karp M, Luyimbazi J, Xu X, Schofield B, Neben TY, et al. (1998)
Interleukin-13: central mediator of allergic asthma. Science 282: 2258–2261.
37. Sokol CL, Barton GM, Farr AG, Medzhitov R (2008) A mechanism for the
initiation of allergen-induced T helper type 2 responses. Nat Immunol 9: 310–
318.
38. Springer TA (1995) Traffic signals on endothelium for lymphocyte recirculation
and leukocyte emigration. Annu Rev Physiol 57: 827–872.
39. Springer TA (1994) Traffic signals for lymphocyte recirculation and leukocyte
emigration: the multistep paradigm. Cell 76: 301–314.
40. Butcher EC (1991) Leukocyte-endothelial cell recognition: three (or more) steps
to specificity and diversity. Cell 67: 1033–1036.
41. Lewinsohn DM, Bargatze RF, Butcher EC (1987) Leukocyte-endothelial cell
recognition: evidence of a common molecular mechanism shared by neutrophils,
lymphocytes, and other leukocytes. J Immunol 138: 4313–4321.
Systemic Response to Infestation with P. ovis
PLoS ONE | www.plosone.org 14 August 2012 | Volume 7 | Issue 8 | e42778
42. Fawcett J, Holness CL, Needham LA, Turley H, Gatter KC, et al. (1992)
Molecular cloning of ICAM-3, a third ligand for LFA-1, constitutively expressedon resting leukocytes. Nature 360: 481–484.
43. Guyer DA, Moore KL, Lynam EB, Schammel CM, Rogelj S, et al. (1996) P-
selectin glycoprotein ligand-1 (PSGL-1) is a ligand for L-selectin in neutrophilaggregation. Blood 88: 2415–2421.
44. Lau D, Baldus S (2006) Myeloperoxidase and its contributory role ininflammatory vascular disease. Pharmacol Ther 111: 16–26.
45. Eckert RL, Broome AM, Ruse M, Robinson N, Ryan D, et al. (2004) S100
proteins in the epidermis. J Invest Dermatol 123: 23–33.46. Foell D, Roth J (2004) Proinflammatory S100 proteins in arthritis and
autoimmune disease. Arthritis Rheum 50: 3762–3771.47. Nacken W, Roth J, Sorg C, Kerkhoff C (2003) S100A9/S100A8: Myeloid
representatives of the S100 protein family as prominent players in innateimmunity. Microsc Res Tech 60: 569–580.
48. Roth J, Sunderkotter C, Goebeler M, Gutwald J, Sorg C (1992) Expression of
the calcium-binding proteins MRP8 and MRP14 by early infiltrating cells inexperimental contact dermatitis. Int Arch Allergy Immunol 98: 140–145.
49. Croce K, Gao H, Wang Y, Mooroka T, Sakuma M, et al. (2009) Myeloid-related protein-8/14 is critical for the biological response to vascular injury.
Circulation 120: 427–436.
50. Samitas K, Zervas E, Vittorakis S, Semitekolou M, Alissafi T, et al. (2011)Osteopontin expression and relation to disease severity in human asthma. Eur
Respir J 37: 331–341.51. Stetler G, Brewer MT, Thompson RC (1986) Isolation and sequence of a human
gene encoding a potent inhibitor of leukocyte proteases. Nucleic Acids Res 14:7883–7896.
52. Mitsudo K, Jayakumar A, Henderson Y, Frederick MJ, Kang Y, et al. (2003)
Inhibition of serine proteinases plasmin, trypsin, subtilisin A, cathepsin G, andelastase by LEKTI: a kinetic analysis. Biochemistry 42: 3874–3881.
53. Howell MD, Kim BE, Gao P, Grant AV, Boguniewicz M, et al. (2009) Cytokinemodulation of atopic dermatitis filaggrin skin expression. J Allergy Clin Immunol
124: R7–R12.
54. Kim BE, Leung DY, Boguniewicz M, Howell MD (2008) Loricrin and
involucrin expression is down-regulated by Th2 cytokines through STAT-6. Clin
Immunol 126: 332–337.
55. Rus H, Cudrici C, Niculescu F (2005) The role of the complement system in
innate immunity. Immunol Res 33: 103–112.
56. Maruo K, Akaike T, Ono T, Okamoto T, Maeda H (1997) Generation of
anaphylatoxins through proteolytic processing of C3 and C5 by house dust mite
protease. J Allergy Clin Immunol 100: 253–260.
57. Bergstrom FC, Reynolds S, Johnstone M, Pike RN, Buckle AM, et al. (2009)
Scabies mite inactivated serine protease paralogs inhibit the human complement
system. J Immunol 182: 7809–7817.
58. Zipfel PF, Skerka C (2009) Complement regulators and inhibitory proteins. Nat
Rev Immunol 9: 729–740.
59. Cochrane CG, Griffin JH (1982) The biochemistry and pathophysiology of the
contact system of plasma. Adv Immunol 33: 241–306.
60. Maruo K, Akaike T, Inada Y, Ohkubo I, Ono T, et al. (1993) Effect of microbial
and mite proteases on low and high molecular weight kininogens. Generation of
kinin and inactivation of thiol protease inhibitory activity. J Biol Chem 268:
17711–17715.
61. Maruo K, Akaike T, Matsumura Y, Kohmoto S, Inada Y, et al. (1991)
Triggering of the vascular permeability reaction by activation of the Hageman
factor-prekallikrein system by house dust mite proteinase. Biochim Biophys Acta
1074: 62–68.
62. Nusrat AR, Chapman HA, Jr. (1991) An autocrine role for urokinase in
phorbol ester-mediated differentiation of myeloid cell lines. J Clin Invest 87:
1091–1097.
63. Plow EF, Herren T, Redlitz A, Miles LA, Hoover-Plow JL (1995) The cell
biology of the plasminogen system. FASEB J 9: 939–945.
64. Kenyon F, Knox D (2002) The proteinases of Psoroptes ovis, the sheep scab
mite–their diversity and substrate specificity. Vet Parasitol 105: 317–325.
Systemic Response to Infestation with P. ovis
PLoS ONE | www.plosone.org 15 August 2012 | Volume 7 | Issue 8 | e42778