Transcriptome-wide noise controls lineage choice in...
49
Nature manuscript 2007-10-11129A Huang_article_text_FINAL.doc Transcriptome-wide noise controls lineage choice in mammalian progenitor cells Hannah H. Chang 1,2,3 , Martin Hemberg 4* , Mauricio Barahona 4 , Donald E. Ingber 1 , and Sui Huang 1† 1 Vascular Biology Program, Department of Pathology and Surgery, Children’s Hospital and Harvard Medical School, Boston, Massachusetts 02115, USA 2 Program in Biophysics, Harvard University, Boston, Massachusetts 02115, USA 3 MD-PhD Program, Harvard Medical School, Boston, Massachusetts 02115, USA 4 Department of Bioengineering and Institute for Mathematical Sciences, Imperial College London, South Kensington Campus, London SW7 2AZ, United Kingdom * Present address: Department of Ophthalmology, Children’s Hospital Boston, Boston, Massachusetts 02215, USA. † Present address: Institute for Biocomplexity and Informatics, University of Calgary, Calgary, Alberta T2N 1N4, Canada Phenotypic cell-to-cell variability within clonal populations may be a manifestation of “gene expression noise” 1-6 , or it may reflect stable phenotypic variants 7 . Such “non-genetic cell individuality” 7 can arise from the slow fluctuations of protein levels 8 in mammalian cells. These fluctuations produce persistent cell individuality, thereby rendering a clonal population heterogeneous. However, it remains unknown whether this heterogeneity may account for the stochasticity of cell fate decisions in stem cells. Here we show that in clonal populations of hematopoietic progenitor cells, spontaneous “outlier” cells with either extremely high or low expression levels of the stem cell marker Sca-1 9 reconstitute the parental distribution of Sca-1 but do so only after more than one week. This slow relaxation is described by a Gaussian- Mixture Model (GMM) that incorporates noise-driven transitions between discrete subpopulations, suggesting hidden multi-stability within one cell type. Despite clonality, the Sca-1 outliers had distinct transcriptomes. Although their unique gene expression profiles eventually reversed to that of the median cells, revealing an attractor state, they lasted long enough to confer a greatly different proclivity for choosing either the erythroid or myeloid lineages. Preference in lineage choice was associated with elevated expression of lineage-specific transcription factors, such as a > 200-fold increase in GATA1 10 among the erythroid-prone cells, or > 15-fold 1
Transcript of Transcriptome-wide noise controls lineage choice in...

Nature manuscript 2007-10-11129A Huang_article_text_FINAL.doc
Transcriptome-wide noise controls lineage choice in mammalian progenitor cells Hannah H. Chang1,2,3, Martin Hemberg4*, Mauricio Barahona4, Donald E. Ingber1, and Sui Huang1†
1Vascular Biology Program, Department of Pathology and Surgery, Children’s Hospital and Harvard Medical School, Boston, Massachusetts 02115, USA 2Program in Biophysics, Harvard University, Boston, Massachusetts 02115, USA 3MD-PhD Program, Harvard Medical School, Boston, Massachusetts 02115, USA 4Department of Bioengineering and Institute for Mathematical Sciences, Imperial College London, South Kensington Campus, London SW7 2AZ, United Kingdom * Present address: Department of Ophthalmology, Children’s Hospital Boston, Boston, Massachusetts 02215, USA. † Present address: Institute for Biocomplexity and Informatics, University of Calgary, Calgary, Alberta T2N 1N4, Canada Phenotypic cell-to-cell variability within clonal populations may be a manifestation
of “gene expression noise”1-6, or it may reflect stable phenotypic variants7. Such
“non-genetic cell individuality”7 can arise from the slow fluctuations of protein
levels8 in mammalian cells. These fluctuations produce persistent cell individuality,
thereby rendering a clonal population heterogeneous. However, it remains unknown
whether this heterogeneity may account for the stochasticity of cell fate decisions in
stem cells. Here we show that in clonal populations of hematopoietic progenitor
cells, spontaneous “outlier” cells with either extremely high or low expression levels
of the stem cell marker Sca-19 reconstitute the parental distribution of Sca-1 but do
so only after more than one week. This slow relaxation is described by a Gaussian-
Mixture Model (GMM) that incorporates noise-driven transitions between discrete
subpopulations, suggesting hidden multi-stability within one cell type. Despite
clonality, the Sca-1 outliers had distinct transcriptomes. Although their unique gene
expression profiles eventually reversed to that of the median cells, revealing an
attractor state, they lasted long enough to confer a greatly different proclivity for
choosing either the erythroid or myeloid lineages. Preference in lineage choice was
associated with elevated expression of lineage-specific transcription factors, such as
a > 200-fold increase in GATA110 among the erythroid-prone cells, or > 15-fold
1

Nature manuscript 2007-10-11129A Huang_article_text_FINAL.doc
increased PU.111 expression among myeloid-prone cell. Thus, clonal heterogeneity of
gene expression level is not due to independent noise in the expression of individual
genes, but reflects metastable states of a slowly fluctuating transcriptome that is
distinct in individual cells and may govern the reversible, stochastic priming of
multipotent progenitor cells in cell fate decision.
Cell-to-cell variability can be quantified by analyzing the dispersion of expression levels
of a phenotypic marker within a cell population. Flow cytometric analysis of EML cells,
a multipotent murine hematopoietic cell line12, revealed an approximately 1000-fold
range in the level of the constitutively expressed stem cell surface marker Sca-1 among
individual cells within one newly-derived clonal cell population (Fig. 1a). The
heterogeneity of Sca-1 expression in this clonal population was highly consistent between
measurements (Fig. 1c) and could not be attributed to measurement noise (Fig. 1b).
Moreover, cell-cycle dependent cell size variation contributed only 1% to the observed
variability of Sca-1 levels per cell (Supplementary Discussion and Supplementary Fig. 1).
To characterize the dynamics by which population heterogeneity arises, cells with the
highest, middle, and lowest ~15% Sca-1 expression level (denoted henceforth as Sca-
1Low, Sca-1Mid, and Sca-1High fractions) were isolated from one clonal population using
fluorescence activated cell sorting (FACS). Cells were stripped free of the staining
antibody immediately after isolation and cultured in standard growth medium. Within
hours, all three fractions showed broadening of the narrow Sca-1 histograms obtained
immediately after sorting (Fig. 2a) but more than 9 days elapsed before the three fractions
regenerated Sca-1 histograms similar to that of the parental (unsorted) population (Fig.
2a). Therefore, the restoration of the wide range of Sca-1 surface expression levels is a
slow process (requiring > 12 cell doublings) that is independent of initial Sca-1
expression-levels. Clonal heterogeneity was also regenerated from subclones derived
from randomly selected individual cells that had varying initial mean Sca-1 levels
(Supplementary Fig. 2).
2
Nature manuscript 2007-10-11129A Huang_article_text_FINAL.doc
What drives the regeneration of the parental “bell-shaped” histogram from the three
sorted population fractions (Fig. 2a)? Although a variety of mechanisms may in principle
underlie this behavior (Supplementary Discussion and Supplementary Fig. 3 and 4), we
consider here a general theoretical stochastic formulation. Because the genetic circuitry
governing the expression of Sca-1 is poorly understood13, modeling the process explicitly
with genetic circuits subjected to stochastic dynamics14 is not feasible. Instead, we took a
phenomenological approach to determine the model class of stochastic processes which
describes the observed behaviour. The simplest model is an elementary mean-reverting
(Ornstein-Uhlenbeck, O-U) process15 that includes both noise-driven diffusion (capturing
the generation of cell-cell variability) and a drift towards the deterministic equilibrium
(representing relaxation to the parental distribution mean) (Supplementary Theoretical
Methods). However, a simple O-U process describes the data only poorly, since it fails to
recapitulate the growth of the long left tail (e.g., 100-fold range for the Sca-1High fraction)
in the histogram.
An alternative explanation is that the relaxation process is complicated by slow dynamics
on a rugged potential landscape that consists of multiple quasi-discrete state transitions
whose stochastic nature produces an additional source of variability16. Recent analysis of
human myeloid progenitor cells has provided experimental evidence for the existence of
multiple metastable states17, consistent with the dynamics of complex gene regulatory
networks that control mammalian cell fates17. We thus extended the simple O-U model to
include transitions between distinct states (virtual subpopulations) using a Gaussian-
Mixture Model (GMM) as a first approximation to a multimodal system. As quantified by
the Akaike Information Criterion (Supplementary Theoretical Methods), the data can be
described by a minimal GMM model comprised of only two distinct states, each
described as a Gaussian, the parameters of which were obtained from the observed
histograms in the stationary phase (time ! 9 days).
Our GMM model allowed us to partition cells in every measured histogram (time point)
into two “virtual subpopulations” (blue = subpopulation 1 and red = subpopulation 2 in
Fig. 2a) based on the expression values of the individual cells, thus providing the time
3
Nature manuscript 2007-10-11129A Huang_article_text_FINAL.doc
evolution of the mean !i and the relative abundance (weight) wi for each subpopulation i
=1, 2 (Fig. 2b and 2c and Supplementary Theoretical Methods). Interestingly, this
theoretical description suggests that the asymmetric broadening of the truncated
histograms, as partially reflected in the changes in ! for the two subpopulations (Fig. 2b),
only accounts for a fraction of the restoration of the equilibrium heterogeneity. In
contrast, stochastic transitions between the subpopulations, as reflected by the evolution
of the weights wi, played a dominant role in the later relaxation to equilibrium.
Importantly, for the Sca-1Mid and Sca-1High fractions, changes in wi were initially
negligible until 96 h, at which point the wi exhibited a steep change before eventually
reaching a plateau (Fig. 2c).
In summary, our results suggest that the observed clonal population heterogeneity of
protein expression is not simply the manifestation of noise around a single, deterministic
equilibrium (attractor) state described by an O-U model. Instead it is likely the result of
processes involving stochastic state transitions in a multi-stable system17, which may
explain the slow regeneration of the parental heterogeneity.
These results suggest that whole population averaging of the level of Sca-1 may not
appropriately characterize its biological function. Instead, because of the slowness of
relaxation to the mean values, momentary levels of Sca-1 within individual cells may
reflect distinct, enduring functional states with different biological consequences. Thus,
we asked whether clonal heterogeneity in Sca-1 expression correlates with heterogeneity
of the differentiation potential of these cells. Indeed, among the secondary clones
generated from the parental population, the rate of commitment to pro-erythrocytes in
response to Erythropoietin (Epo) (Methods, and Supplementary Fig. 5) was inversely
correlated to the baseline mean Sca-1 expression of each clone (Supplementary Fig. 6).
Similarly, for the three sorted fractions (Fig. 3a), the relative erythroid differentiation
rates were distinct, with Sca-1Low cells differentiating the fastest, followed by Sca-1Mid
and Sca-1High (Fig. 3b). Importantly, although the Sca-1Low fraction differentiated into the
erythroid lineage at a rate 7-fold higher than the Sca-1High fraction (Fig 3b), the Sca-1Low
fraction was not composed of spontaneously and irreversibly pre-committed pro-
4

Nature manuscript 2007-10-11129A Huang_article_text_FINAL.doc
erythrocytes. Instead, these cells were still undifferentiated as evidenced by expression of
the stem cell marker c-kit, their normal proliferation capacity (Supplementary Fig. 7) and
their ability to reconstitute the parental histogram (Fig. 2a).
When we stimulated erythroid differentiation at later time points after sorting on 7, 14,
and 21 days (as the Sca-1 histograms became more similar to each other while restoring
the parental distribution), the difference in the erythroid differentiation rate between the
Sca-1Low versus Sca-1High fractions was gradually lost (Fig. 3b-e). Surprisingly, despite
the near complete convergence of the Sca-1 histograms at 7 days, variability in
differentiation kinetics was consistently detectable beyond 14 days after sorting (Fig. 3d).
This suggests that clonal heterogeneity in Sca-1 expression controls differentiation
potential but constitutes only a one-dimensional projection of separate states in the high-
dimensional space of gene expression levels17. To reveal additional dimensions, we
looked for correlated heterogeneity in other proteins and investigated whether expression
of the erythroid-fate determining transcription factor GATA110 differed among the Sca-1
fractions. Real-time PCR revealed significantly higher GATA1 mRNA levels in the
erythroid differentiation-prone Sca-1Low progenitor cells (260-fold increase over Sca-1High
fraction), followed by the Sca-1Mid (2.7-fold increase over Sca-1High fraction) and Sca-
1High fractions (Fig. 3g), and these differences were paralleled by GATA1 protein levels
(Fig. 3i). Importantly, GATA1 mRNA expression among the three sorted fractions at 5
and 14 days after sorting (Supplementary Fig. 8) mirrored the gradual loss of variability
observed in the differentiation kinetics for the erythroid lineage (Fig. 3b-e).
GATA1 plays an antagonistic role in lineage determination with the myeloid-fate
determining transcription factor PU.1, and these two transcription factors mutually inhibit
each other to regulate the erythroid versus myeloid fate decision18. Thus, we
hypothesized that cells that are least prone to erythroid differentiation and exhibit low
GATA1 expression may have high PU.1 levels, and thus be predisposed to the myeloid
lineage. Indeed, real-time PCR revealed the highest PU.1 mRNA levels among the Sca-
1High progenitor cells (17-fold increase over Sca-1Low fraction), followed by the Sca-1Mid
(3.6-fold increase over Sca-1Low fraction) and Sca-1Low fractions (Fig. 3h). These
5

Nature manuscript 2007-10-11129A Huang_article_text_FINAL.doc
differences were paralleled by PU.1 protein levels (Fig. 3j). Furthermore, myeloid
differentiation rate was the highest among Sca-1High cells, followed by Sca-1Mid and Sca-
1Low (Fig. 3f) in response to GM-CSF and IL-3 (Methods and Supplementary Fig. 5).
These results show that within a clonal population of multipotent progenitor cells,
spontaneous non-genetic population heterogeneity primes the cells for different lineage
choices.
Since both GATA1 and PU.1 are pivotal lineage-specific transcription factors, we asked
whether the dramatic up-regulation of GATA1 and associated down-regulation of PU.1 in
the most erythroid-prone Sca-1Low cells reflect a particular cellular state in terms of
genome-wide gene expression. Microarray-based mRNA expression profiling on Sca-
1Low (L), Sca-1Mid (M), and Sca-1High (H) fractions immediately after sorting revealed that
these three fractions differed considerably in their transcriptomes (Fig. 4). Replicate
microarray measurements showed that the observed transcriptome differences could not
be attributed solely to experimental error (Supplementary Fig. 9). Significance Analysis
of Microarrays (SAM)19 revealed >3900 genes that were differentially expressed between
the Sca-1Low and Sca-1High fractions at a stringent False Detection Rate (FDR) of 1.5%.
The distinct global gene expression profiles of the three fractions converged to a common
pattern within 6 days after sorting, a progression that can be quantified by the inter-
sample distance metric D = 1-R, where R is the Pearson correlation coefficient. The
distances between the three profiles decreased from D (L - M) 0 days = 0.027 to D (L - M) 6
days = 0.009 and from D (M - H)0 days = 0.061 to D (M - H)6 day =0.012 (Fig. 4 and
Supplementary Table 1). Thus, the outlier populations reconstituted the traits of the
parental population not only with respect to their distribution of Sca-1 expression (Fig.
2a) and differentiation rates (Fig. 3b-e), but also with respect to their gene expression
profiles across thousands of genes. This global relaxation from both ends of the parental
spectrum towards the center is predicted by the model in which a stable cell phenotype,
such as the progenitor state here, is a high-dimensional attractor state20. It also confirms
that the Sca-1 outlier cells were not already irreversibly committed. Nevertheless, Sca-
1Low cells exhibited a transcriptome that was clearly more similar than the Sca-1High cells
to the maximally differentiated (unsorted) cells (Fig. 4) that were cultured in the presence
6

Nature manuscript 2007-10-11129A Huang_article_text_FINAL.doc
of Epo for 7 days (D (L - 7d_Epo) = 0.079 versus D (H - 7d_Epo) = 0.158,
Supplementary Table 1), a remarkable feat given the spontaneity and stochasticity of the
process that generated these differentiation-prone outlier cells. In fact, with respect to 200
“differentiation marker genes” (Methods), only the Sca-1Low cells were statistically
similar to the Epo-treated cells (p < 3"10-14, pair-wise t-test), whereas the Sca-1Mid (p
>0.8) and Sca-1High (p > 0.6) cells were not, further confirming the transcriptome
similarity between the Sca-1Low and Epo-treated cells, which may be related to their
elevated GATA1 levels.
Our results demonstrate the robust nature of cell-to-cell variability that underlies the
heterogeneity of gene expression in a clonal population of mammalian progenitor cells.
While the source of the heterogeneity and the molecular mechanisms responsible for its
slow restoration remain to be elucidated, our experiments and general theoretical
considerations point to discrete transitions in a dynamical system exhibiting multistability
as one source of this behavior. Independent of the specific mechanism, we show that
biological function in metazoan cells is not necessarily determined by the ensemble
average of a nominally homogenous cell population, and that outliers in a heterogeneous
cell population do not simply represent irrelevant, short-lived phenotypic states caused by
random fluctuations in the expression of a single gene. Instead, the departure from the
average state is characterized by slowly fluctuating transcriptome-wide noise that has
significant biological functionality in the priming of cell fate commitment. This finding
helps unite two old dualisms: between plasticity and heterogeneity in explaining
multipotency21,22, and between instructive and selective regulation in explaining cell fate
decisions18. Exploiting the spontaneous, transient yet enduring cell individuality in
differentiation potential resulting from clonal heterogeneity also could be of practical
value in attempts to steer lineage choice in stem cells for therapeutic applications.
7

Nature manuscript 2007-10-11129A Huang_article_text_FINAL.doc
Methods Summary Creation of single-cell derived subclones
Single-cell derived subclones of EML cells were generated in three weeks by
methylcellulose-plating at low cell densities, isolation of resulting colonies by hand with
microscopic guidance, and expansion in liquid culture.
Flow cytometry and Bead calibration
Cell surface protein immunostaining and flow cytometry measurements were performed
using standard methods. For cells that were recultured after FACS, the staining antibody
was removed as previously reported 17. Quantum PE Molecules of Equivalent Soluble
Fluorochrome (MESF) beads (Bangs Laboratories) were used to correct for daily
fluctuations in flow cytometer sensitivity.
Gene expression profiling with microarrays
The MouseWG-6v1.1 Illumina microbead chips were used to perform gene expression
profiling on total RNA extracted from FACS sorted, or unsorted cell populations.
Data analysis
Flow cytometry data were analyzed using the software package FlowJo 2.2.2. Theoretical
modeling and filtering of microarray data were performed with custom software written
in Matlab 7.2. Statistical significance analysis of the microarray data was performed with
the Significance Analysis of Microarrays19 (SAM) algorithm and self-organizing maps
generated with the Gene Expression Dynamics Inspector (GEDI) software23.
Full methods accompany this paper.
8

Nature manuscript 2007-10-11129A Huang_article_text_FINAL.doc
References
1. Blake, W. J. et al. Noise in eukaryotic gene expression. Nature 422, 633-637 (2003).
2. Elowitz, M. B. et al. Stochastic gene expression in a single cell. Science 297, 1183-1186 (2002).
3. Pedraza, J. M. and van Oudenaarden, A. Noise propagation in gene networks. Science 307, 1965-1969 (2005).
4. Raser, J. M. and O'Shea, E. K. Control of stochasticity in eukaryotic gene expression. Science 304, 1811-1814 (2004).
5. Rosenfeld, N. et al. Gene regulation at the single-cell level. Science 307, 1962-1965 (2005).
6. Kaern, M. et al. Stochasticity in gene expression: from theories to phenotypes. Nat Rev Genet 6, 451-464 (2005).
7. Spudich, J. L. and Koshland, D. E., Jr. Non-genetic individuality: chance in the single cell. Nature 262, 467-471 (1976).
8. Sigal, A. et al. Variability and memory of protein levels in human cells. Nature 444, 643-646 (2006).
9. van de Rijn, M. et al. Mouse hematopoietic stem-cell antigen Sca-1 is a member of the Ly-6 antigen family. Proc Natl Acad Sci U S A 86, 4634-4638 (1989).
10. Cantor, A. B., Katz, S. G., and Orkin, S. H. Distinct domains of the GATA-1 cofactor FOG-1 differentially influence erythroid versus megakaryocytic maturation. Mol Cell Biol 22, 4268-4279 (2002).
11. Koschmieder, S. et al. Role of transcription factors C/EBPalpha and PU.1 in normal hematopoiesis and leukemia. Int J Hematol 81, 368-377 (2005).
12. Tsai, S. et al. Lymphohematopoietic progenitors immortalized by a retroviral vector harboring a dominant-negative retinoic acid receptor can recapitulate lymphoid, myeloid, and erythroid development. Genes Dev 8, 2831-2841 (1994).
13. Holmes, C. and Stanford, W. L. Concise review: stem cell antigen-1: expression, function, and enigma. Stem Cells 25, 1339-1347 (2007).
14. Guido, N. J. et al. A bottom-up approach to gene regulation. Nature 439, 856-860 (2006).
15. Uhlenbeck, G.E. and Ornstein, L.S. On the theory of Brownian Motion. Phys. Rev. 36, 823-841 (1930).
16. Kurchan, J. and Laloux, L. Phase space geometry and slow dynamics. Journal Of Physics A-Mathematical And General 29, 1929-1948 (1996).
17. Chang, H. H. et al. Multistable and multistep dynamics in neutrophil differentiation. BMC Cell Biol 7, 11 (2006).
18. Huang, S. et al. Bifurcation dynamics in lineage-commitment in bipotent progenitor cells. Dev Biol 305, 695-713 (2007).
19. Tusher, V. G., Tibshirani, R., and Chu, G. Significance analysis of microarrays applied to the ionizing radiation response. Proc Natl Acad Sci U S A 98, 5116-5121 (2001).
9

Nature manuscript 2007-10-11129A Huang_article_text_FINAL.doc
20. Huang, S. et al. Cell fates as high-dimensional attractor states of a complex gene regulatory network. Phys Rev Lett 94, 128701 (2005).
21. Enver, T., Heyworth, C. M., and Dexter, T. M. Do stem cells play dice? Blood 92, 348-351; discussion 352 (1998).
22. Orkin, S. H. and Zon, L. I. Hematopoiesis and stem cells: plasticity versus developmental heterogeneity. Nat Immunol 3, 323-328 (2002).
23. Eichler, G. S., Huang, S., and Ingber, D. E. Gene Expression Dynamics Inspector (GEDI): for integrative analysis of expression profiles. Bioinformatics 19, 2321-2322 (2003).
24. Zenger, V. E. et al. Quantitative flow cytometry: inter-laboratory variation. Cytometry 33, 138-145 (1998).
10

Nature manuscript 2007-10-11129A Huang_article_text_FINAL.doc
Supplementary Information is linked to the online version of the paper at
www.nature.coom/nature.
Acknowledgements This work was funded by grants to S.H. from the Air Force Office
of Scientific Research and in part, the National Institutes of Health. H.H.C. is partially
supported by the Presidential Scholarship and the Ashford Fellowship of Harvard
University. M.H. and M.B. are supported by the Life Sciences Interface and Mathematics
panels of the Engineering and Physical Sciences Research Council of the UK. D.E.I. is
supported by the National Health Institutes and the Army Research Office. We would
like to thank K. Orford, P. Zhang, A. Mammoto, J. Daley, J. Pendse, and M. Shakya for
experimental assistance, and W. Press and K. Farh for useful discussions. The data
discussed in this publication have been deposited in NCBIs Gene Expression Omnibus
(GEO, http://www.ncbi.nlm.nih.gov/geo/) and are accessible through GEO Series
accession number GSE10772.
Author Contributions H.H.C. designed the study, performed the experiments, analyzed
the data, participated in the theoretical analysis and drafted the manuscript. M.H.
constructed the theoretical model and performed the theoretical analysis. M.B.
constructed the model, supervised the work, and revised the manuscript. D.E.I.
supervised the work and revised the manuscript. S.H. conceived of the study, supervised
the work, participated in the experimental and theoretical analysis, and drafted the
manuscript. All authors read and approved the final manuscript.
Author Information Reprints and permissions information is available at
www.nature.com/reprints. The authors declare no competing financial interests.
Correspondence and requests for materials should be addressed to S.H.
11
Nature manuscript 2007-10-11129A Huang_article_text_FINAL.doc
Figure Legends
Figure 1. Robust clonal heterogeneity. a, b, Heterogeneity in Sca-1 expression among
clonal cells (a) was significantly larger than the resolution limit of flow cytometry
approximated by measurement of reference MESF24 beads (b). c, Stability of clonal
heterogeneity in Sca-1 over 3 weeks.
Figure 2. Restoration of heterogeneity from sorted cell fractions. a, Clonal cells with
the highest (Sca-1High), middle (Sca-1Mid) and lowest (Sca-1Low) 15% Sca-1 expression
independently re-established the parental extent of clonal heterogeneity after 216 h in
separate culture. As an example, each cell in the Sca-1High experiment was theoretically
partitioned into one of two GMM-subpopulations (blue and red). b, c, The temporal
evolution of the means !#$%&&(b) and weights w1,2 (c) for the Sca-1High GMM
subpopulations 1 and 2. The evolution of the weights was fitted to a sigmoidal function
(c, dotted curves). Black dotted dash lines, equilibrium values for !' and wi.
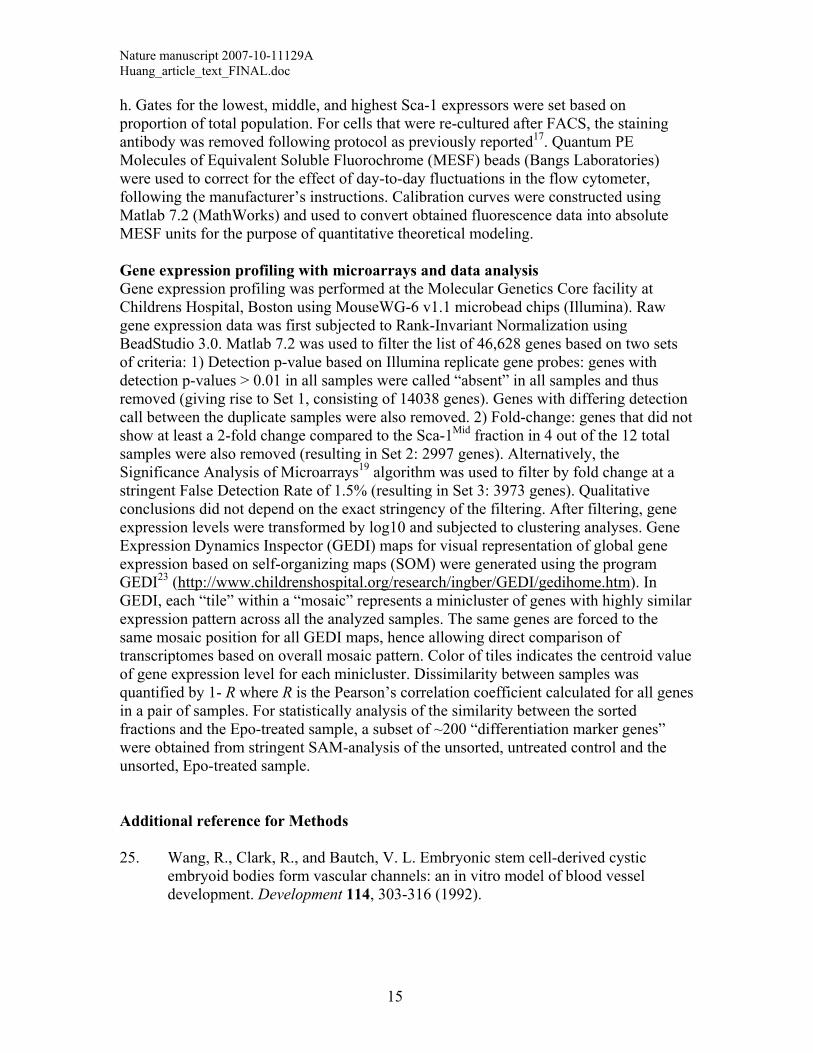
Figure 3. Clonal heterogeneity governs differentiation potential. a-f, Sca-1Low (Low,
black), Sca-1Mid (Mid, grey), and Sca-1High (High, white) fractions (a) stimulated by Epo
(b) and GM-CSF (f) immediately after isolation showed variable differentiation rates into
the erythroid and myeloid lineages, respectively. Upon 7, 14, and 21 days (d) of post-sort
culture, Epo- treated cells showed convergence in both pre-stimulation, baseline Sca-1
expression (Fig. 2a) and relative differentiation rates (b-e). Asterisk, p < 0.001 (two-
tailed normal-theory test). g, h, qRT-PCR analysis of GATA1 (g) and PU.1 (h) mRNA
levels in Sca-1 sorted fractions. Means ± s.e.m. of triplicates shown; triple asterisk p <
10-5, double asterisk p < 0.0002, asterisk p < 0.003 (one-tail Student’s t-test). i, j, Western
blot analysis of GATA1 (i) and PU.1 (j) protein levels in Sca-1 fractions (lanes 3-5) and
mock-sorted cells (lane 6). MEL cell line (lane 1), positive control; G1E and 503 (lane 2)
cell lines, negative controls for GATA1 and PU.1, respectively. GAPDH, loading control.
12

Nature manuscript 2007-10-11129A Huang_article_text_FINAL.doc
Figure 4. Clonal heterogeneity of Sca-1 expression reflects transcriptome-wide
noise. Self-organizing maps of global gene expression for a subset of 2997 genes
visualized with the GEDI23 program for Sca-1Low (L), Sca-1Mid (M), Sca-1High (H)
fractions at 0 and 6 days (d) after FACS isolation and for a differentiated erythroid
culture (7d Epo) and an untreated (Untreated) control sample. Pixels in the same location
within each GEDI map contain the same minicluster of genes. Color of pixels indicates
centroid value of gene expression level for each minicluster in log10 units of signal.
Dissimilarity between transcriptomes indicated above "##". GATA1-containing pixel
boxed in white.
13

Nature manuscript 2007-10-11129A Huang_article_text_FINAL.doc
Methods Culture of EML cells, creation of single-cell derived subclones and differentiation into erythroid and myeloid cells EML cells (gift from Keith Orford/David Scadden) were maintained in growth medium (GM) containing Iscove's Modified Dulbecco's Medium (IMDM) + 20% Horse Serum + 12-15% (v/v) BHK/MKL-conditioned medium (CM) + 1% glutamine /penicillin/streptomycin. To obtain single-cell derived subclones, cells were plated into 60 mm plates at 500-2000 cell/ml density in 1% methylcellulose (Methocult M3134) containing GM and incubated without disturbance for ten days. Individual well-demarcated colonies were hand-picked with Pasteur pipettes under microscopic guidance and transferred to liquid cultures in microwell plates. Typical subclones required ~18 days in culture to expand to a sufficiently large population for experiment. To differentiate EML cells into the erythroid lineage, previously reported differentiation protocol12 was adapted. Briefly, on day 1, cells were cultured in GM + 10 ng/ml of mouse recombinant Erythropoietin (Sigma-Aldrich) at 250,000 cells/ml density. On day 3, cells are spun down and re-suspended into IMDM + 20% Horse Serum + 2% BHK/MKL – CM + 10 ng/ml of mouse recombinant Erythropoietin at 125,000 cells/ml density to give resulting erythroid cells a growth advantage. One day 6, an additional 10 ng/ml of Epo is added. Typically, seven days of Erythropoietin (Epo) treatment generated ~40-60% (of total) pro-erythrocytes that were benzidine stain positive and Sca-1/c-kit double negative (Supplementary Fig. 5). Benzidine staining was performed following reported protocol25 and examined by microscopy after cytospin. To differentiate EML cells into myeloid cells, previously reported differentiation protocol12 was adapted. Briefly, on day 1, cells were cultured in GM + 10 ng/ml of mouse recombinant IL-3 (Peprotech) + 10-5 M retinoic acid (Sigma-Aldrich) at 300,000 cells/ml density. On day 4, cells were thoroughly washed with PBS to remove remaining SCF from the growth medium and cultured in IMDM + 20% Horse Serum + 2% BHK/MKL – CM + 10 ng/ml of mouse recombinant granulocyte macrophage colony-stimulating factor (GM-CSF, R&D Systems) + 10-5 M retinoic acid (Sigma-Aldrich) at 200,000 cells/ml density. On day 6, an additional 10ng/ml of GM-CSF is added. After 7-9 days, differentiated myeloid cells dominate the culture and show Mac-1 and Gr-1 expression by flow cytometry. Flow cytometry, Fluorescence Activated Cell Sorting (FACS), and Bead calibration For direct cell surface protein immunostaining the antibodies Sca-1-PE (Caltag) and c-Kit-FITC (BD Pharmingen) antibodies were used at 1:1000 dilutions in ice-cold PBS + 1% fetal calf serum with (flow cytometry) or without (FACS) 0.01% NaN3. Appropriate isotype control antibodies (BD Pharmingen) were used to establish background signal due to non-specific antibody binding. Propidium iodide (PI) staining was correlated with lower forward scatter (FSC) among EML cells (Supplementary Fig.10). Thus, dead cells with positive PI staining were easily removed from all analysis by gating out the low FSC population. Flow cytometry was performed on a Becton Dickinson FACSCaliber analyzer and FACS with either a Becton Dickinson FACSAria or AriaSpecial Sorter UV laser system at the Dana Farber Cancer Institute Flow Cytometry Core. Computational data analysis was done with FlowJo 2.2.2. For cell sorting, input cell number ranged from 60 - 100 x 106 cells. Cells were sorted into ice-cold medium for a maximal duration of 3
14
Nature manuscript 2007-10-11129A Huang_article_text_FINAL.doc
15
h. Gates for the lowest, middle, and highest Sca-1 expressors were set based on proportion of total population. For cells that were re-cultured after FACS, the staining antibody was removed following protocol as previously reported17. Quantum PE Molecules of Equivalent Soluble Fluorochrome (MESF) beads (Bangs Laboratories) were used to correct for the effect of day-to-day fluctuations in the flow cytometer, following the manufacturer’s instructions. Calibration curves were constructed using Matlab 7.2 (MathWorks) and used to convert obtained fluorescence data into absolute MESF units for the purpose of quantitative theoretical modeling. Gene expression profiling with microarrays and data analysis Gene expression profiling was performed at the Molecular Genetics Core facility at Childrens Hospital, Boston using MouseWG-6 v1.1 microbead chips (Illumina). Raw gene expression data was first subjected to Rank-Invariant Normalization using BeadStudio 3.0. Matlab 7.2 was used to filter the list of 46,628 genes based on two sets of criteria: 1) Detection p-value based on Illumina replicate gene probes: genes with detection p-values > 0.01 in all samples were called “absent” in all samples and thus removed (giving rise to Set 1, consisting of 14038 genes). Genes with differing detection call between the duplicate samples were also removed. 2) Fold-change: genes that did not show at least a 2-fold change compared to the Sca-1Mid fraction in 4 out of the 12 total samples were also removed (resulting in Set 2: 2997 genes). Alternatively, the Significance Analysis of Microarrays19 algorithm was used to filter by fold change at a stringent False Detection Rate of 1.5% (resulting in Set 3: 3973 genes). Qualitative conclusions did not depend on the exact stringency of the filtering. After filtering, gene expression levels were transformed by log10 and subjected to clustering analyses. Gene Expression Dynamics Inspector (GEDI) maps for visual representation of global gene expression based on self-organizing maps (SOM) were generated using the program GEDI23 (http://www.childrenshospital.org/research/ingber/GEDI/gedihome.htm). In GEDI, each “tile” within a “mosaic” represents a minicluster of genes with highly similar expression pattern across all the analyzed samples. The same genes are forced to the same mosaic position for all GEDI maps, hence allowing direct comparison of transcriptomes based on overall mosaic pattern. Color of tiles indicates the centroid value of gene expression level for each minicluster. Dissimilarity between samples was quantified by 1- R where R is the Pearson’s correlation coefficient calculated for all genes in a pair of samples. For statistically analysis of the similarity between the sorted fractions and the Epo-treated sample, a subset of ~200 “differentiation marker genes” were obtained from stringent SAM-analysis of the unsorted, untreated control and the unsorted, Epo-treated sample. Additional reference for Methods 25. Wang, R., Clark, R., and Bautch, V. L. Embryonic stem cell-derived cystic
embryoid bodies form vascular channels: an in vitro model of blood vessel development. Development 114, 303-316 (1992).


Nature manuscript 2007-10-11129A Huang_Supplement_FINAL.pdf
Supplementary Information Transcriptome-wide noise controls lineage choice in mammalian progenitor cells Hannah H. Chang1,2,3, Martin Hemberg4*, Mauricio Barahona4, Donald E. Ingber1, and Sui Huang1†
1Vascular Biology Program, Department of Pathology and Surgery, Children’s Hospital and Harvard Medical School, Boston, Massachusetts 02115, USA 2Program in Biophysics, Harvard University, Boston, Massachusetts 02115, USA 3MD-PhD Program, Harvard Medical School, Boston, Massachusetts 02115, USA 4Department of Bioengineering and Institute for Mathematical Sciences, Imperial College London, South Kensington Campus, London SW7 2AZ, United Kingdom * Present address: Department of Ophthalmology, Children’s Hospital Boston, Boston, Massachusetts 02215, USA. † Present address: Institute for Biocomplexity and Informatics, University of Calgary, Calgary, Alberta T2N 1N4, Canada Contents S1. Supplementary Methods 2 S2. Supplementary Discussion 4 S3. Supplementary Figures and Legends 6 S4. Supplementary Table 15 S5. Theoretical Methods 16 S5.A. Fitting of Fluorescence Histograms 16 S5.B. Partitioning the Fluorescence Data Based on the GMM 18 S5.C. Time Evolution of the Subpopulations 20 (a) Linear Model (b) Nonlinear Model (c) Fast relaxation within sub-populations S6. Supplementary Notes 30
1

Nature manuscript 2007-10-11129A Huang_Supplement_FINAL.pdf
S1. Supplementary Methods Cell cycle arrest and cell cycle analysis Cells were treated with a 24 h pulse of 40 !M Lovastatin (Sigma-Aldrich) to deplete cells in S phase1. To analysize cell cycle status, a combined BrdU-incorporation and PI staining protocol was used, following manufacturer’s instruction. Briefly, cells were pulsed for 1 h with 10 !M BrdU (Sigma-Aldrich) and then fixed with cold 70% v/v ethanol. After washing with PBS + 0.5% BSA, cells were denatured with 2M HCl for 20 min, neutralized with 0.1 M sodium borate, then labeled with anti-BrdU-FITC monoclonal antibody (Becton Dickinson) and 10ug/ml Propidium Iodide stain, and analyzed by flow cytometry. Analysis of cell cycle status in live cells was performed with Hoerchst 33342 (Invitrogen) stain at 5!g/ml final concentration and analyzed with a UV-laser equipped flow cytometer. Cell cycle data was then analyzed using the FlowJo 2.2.2. software package (Tree Star) to determine the relative proportions of cells in G0/G1, S, and G2/M cell cycles. Quantitative real-time reverse transcription (RT) PCR Total RNA was isolated from 8 – 20 x 106 cells by using the RNeasy Mini RNA isolation kit (Qiagen). RNA was reverse-transcribed with Omniscript RT-PCR kit (Quiagen) in accordance with the manufacturer's protocol and used to test primer activity. Real-time PCR was performed on ~250 ng of total RNA/sample with the QuantiTect SYBR Green PCR kit (Qiagen) in accordance with the manufacturer's instructions. Amplification conditions were as follows: 40 cycles of denaturation at 94 °C for 15 s, annealing at 55°C for 30 s, and extension at 72 °C for 30 s using the Mx4000 (Stratagene) or 7300 (Applied Biosystems) realtime-PCR machines (Stratagene). Primers for GATA1 were (Right: CAGGGCAGAATCCACAAACT, Left: TCCTCTGCATCAACAAGCC), Sca-1 (Right: GGTTCTTTAGGCTGGCAGTG, Left: GGGAAGTTTCCATGGTGAAG) (from the qPrimerDepot database http://mouseprimerdepot.nci.nih.gov/), PU.1 (Right: TGACTACTACTCCTTCGTGG, Left: GATAAGGGAAGCACATCCGG), and GAPDH (right: ACCACAGTCCATGCCATCAC, Left: TCCACCACCCTGTTGCTGTA). Specificity was verified by melt-curve analysis and agarose-gel electrophoresis. Results are standardized for GAPDH expression levels and are expressed as fold induction compared with the levels (set to 1) detected in the sample with the lowest expression. Western Blot analysis 1 – 5 x 10⁶ cells were pelleted and homogenized with the appropriate volume of RIPA buffer (Boston BioProducts) containing 50mM Tris-HCl, 150 mM Nacl, 1% NP-40, 0.5% Sodium deoxycholat, and 0.1% SDS, and protease-inhibitor cocktail (Roche) and sheared with multiple passages through a syringe. After measurement of protein yield using the Dc Protein Assay (Bio-Rad), whole-cell lysates were boiled for 5 min at 95"C with 20% sample-loading buffer. 30-40 !g of total cell lysate were subjected to electrophoresis on 4-20% SDS-polyacrylamide gradient gels (Bio-Rad) and transferred to nitrocellulose membranes. Following blocking with 5% milk/PBST (phosphate buffered saline with 0.1% Tween 20), the membrane was probed either with a 1:200 dilution of anti GATA1-N6 antibody (Santa Cruz sc-265) or a 1:1000 dilution of anti PU.1 antibody (Santa Cruz sc-352). Antibody binding was detected with a 1:10000 dilution of peroxidase labeled
2

Nature manuscript 2007-10-11129A Huang_Supplement_FINAL.pdf
anti-rat IgG (Santa Cruz) or anti-rabbit IgG (Vector) and luminescence was detected with Supersignal West Dura Signal reagents (Pierce).
3

Nature manuscript 2007-10-11129A Huang_Supplement_FINAL.pdf
S2. Supplementary Discussion 1. What other factors could contribute to the observed level of heterogeneity in Sca-1 within one clonal population (Fig. 1 in the main text)?
Before studying clonal heterogeneity as an intrinsic phenomenon with potential biological function, we experimentally considered the following possible (trivial) sources for the observed variability:
(1) Measurement noise (flow cytometry): the upper bound of the error due to fluctuations in the measurement process (e.g., machine noise) is given by the spread of the signal obtained from standardized MESF2 beads that have uniform amount of fluorescence on each bead (within manufacturing error). This error was 2-fold (Fig. 1b in the main text).
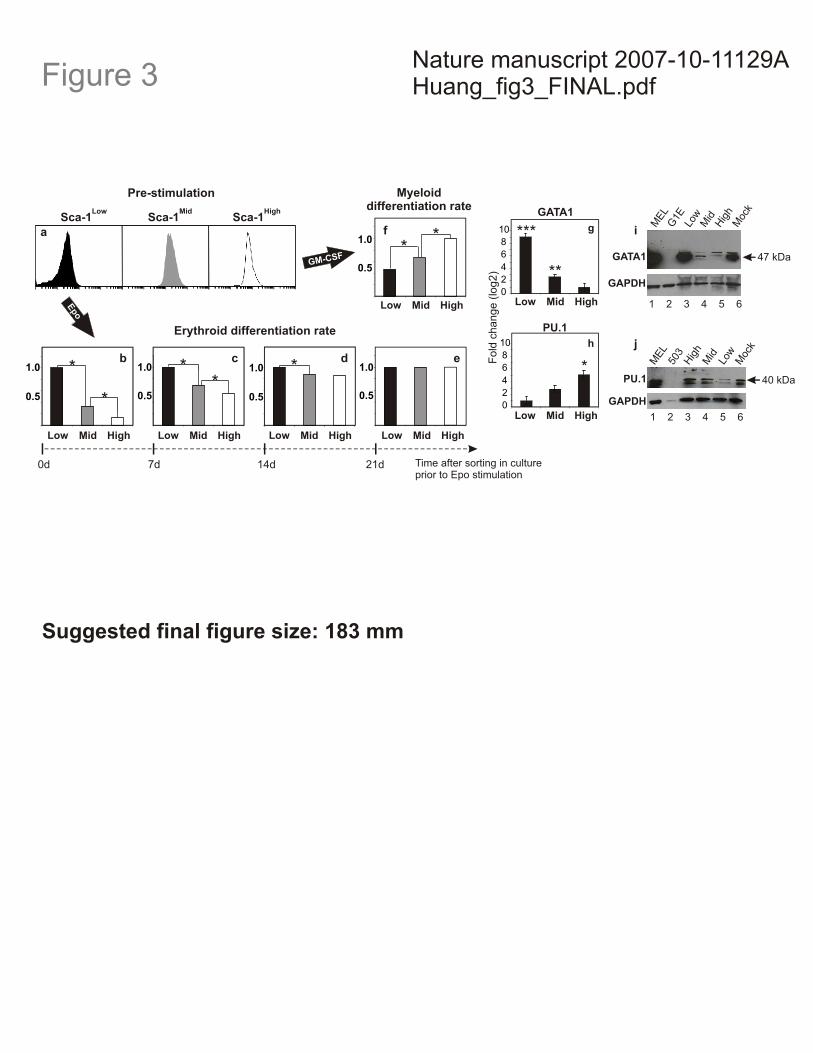
(2) Cell size and cell cycle: Because absolute gene expression levels are affected by cell size3, we examined whether the observed variability in Sca-1 levels reflects cell size variations. The projected area of clonal EML cells ranged over 1.5-fold, which was associated with a 1.7-fold difference in mean Sca-1 expression (Supplementary Fig.1a). Taken together, this would only account for less than 1% of the total Sca-1 heterogeneity we observed. Since some proteins exhibit cell cycle dependence even without an explicit role in cell division4, cell cycle asynchrony in populations of clonal cells could also be a source of Sca-1 clonal heterogeneity. However, clonal cells in the G0/G1 and G2/M cell phases independently showed greater than 500-fold range in Sca-1 expression, differing less than 2-fold in mean Sca-1 expression (Supplementary Fig.1b), again a result that cannot explain the observed Sca-1 heterogeneity.
Thus, the variation in Sca-1 expression in clonal EML cells cannot be trivially attributed to measurement noise, variation of cell size, or asynchrony in cell cycle. 2. What biological process may drive the (re)generation of the parental Sca-1 distribution from the three sorted, more homogeneous population fractions?
Here we present experiments or arguments suggesting that some commonly assumed mechanisms are unlikely to provide complete explanations for the dispersion of Sca-1 and the slow relaxation to the parental distribution, although their partial contribution cannot be excluded.
(1) Shift of cell population demography by overgrowth of a subfraction of cells with the appropriate Sca-1 expression level: The sorted fractions could be contaminated by a few residual cells from other fractions that outgrow more slowly dividing cells, thereby restoring the missing populations. Because the Sca-1Low outlier fraction must accumulate cells with higher Sca-1 levels to reconstitute the original histogram (and accordingly, the Sca-1High fraction must accumulate low expressors), Sca-1Mid cells would be the common “contaminant” that could override both outlier fractions. However, the growth rate of the Sca-1Mid fraction was not higher than that of the outlier fractions (Supplementary Fig. 3). Moreover, greater than 98% purity was obtained for all sorted fractions as obtained by reanalysis of sorted samples.
(2) Mutations affecting Sca-1 expression distribution. Genetic mutations may in principle be responsible for the heterogeneity and slow changes in Sca-1 expression level
4

Nature manuscript 2007-10-11129A Huang_Supplement_FINAL.pdf
distribution. However, this is unlikely since thousands of diverse mutations would have to be generated within less than 9 days (~ 12 cell divisions), each of which would have to confer both a robust growth advantage and a distinct, stable level of Sca-1 surface expression to collectively cover a greater than 10-fold range of population variability.
(3) “Gene expression noise” as basis for dispersion. Propagation of noise from gene transcription5 to the protein level as a source of clonal heterogeneity can be ruled out because there was no statistically significant difference in the Sca-1 mRNA levels of the Sca-1Low, Sca-1Mid, and Sca-1High fractions, as determined by real-time PCR (Supplementary Fig. 4). However, random fluctuations at later stages in Sca-1 surface expression (translation, membrane localization via GPI anchor, trafficking) may play a role.
(4) Uneven partitioning of Sca-1 proteins in cell division. The uneven distribution of cellular molecules to the daughter cells during cell division has long been suggested to be a mechanism that generates population heterogeneity6. Here we do not explicitly study this mechanism. However, we observed that the width (spread) of the histogram of Sca-1 expression levels increased significantly within 24 hr. The rate of cell division is much slower (Supplementary Fig. 3a) such that only a fraction of cells would have undergone cell division in 24 hrs. Thus, while uneven partitioning may still be a source of Sca-1 heterogeneity in long-term cell cultures, it is unlikely to be the sole driving force behind the restoration of the parental distribution from a narrow distribution.
While here we do not establish the driving force for the diversification of Sca-1 levels and the mechanisms that slow the underlying kinetic, it is possible that they result from the joint effect of several processes including the ones discussed above.
5
Nature manuscript 2007-10-11129A Huang_Supplement_FINAL.pdf
S3. Supplementary Figures
Supplementary Figure 1. Robust clonal heterogeneity. a, Weak correlation between cellular Sca-1 expression and cell size (projection area) revealed by Fluorescence Intensity – Forward Scatter dot plot. b, Clonal cells in G0/G1 (blue), G2/M (red) and combined cell cycle phases (black), distinguished by Hoechst stain (inset) showed minor differences in overall range and mean Sca-1 expression.
6

Nature manuscript 2007-10-11129A Huang_Supplement_FINAL.pdf
Supplementary Figure 2. Clonal heterogeneity in Sca-1 expression among single-cell-derived subclones converged towards that of the original parental clone. Population distribution of non-stimulated, baseline Sca-1 expression for four single-cell derived subclones (purple, brown, green, blue solid lines) represented by flow cytometry histograms exhibited convergence towards the parental clone histogram (red) over eight weeks (Wk) in normal growth culture despite one cycle of freeze/thaw after week 5.
7

Nature manuscript 2007-10-11129A Huang_Supplement_FINAL.pdf
Supplementary Figure 3. Growth rates of sorted fractions. a, The growth rates of the Sca-1Low (blue diamonds), Sca-1Mid (magenta squares), Sca-1High (green triangles) sorted fractions, and a mock-sorted control (black circles) were calculated as the fold difference between two daily measurements. b, The three sorted fractions had comparable growth rates overall, as shown by the mean and standard deviation of growth rates over all 11 times points in a.
Supplementary Figure 4. Sca-1 mRNA levels in sorted fractions. Sca-1 mRNA levels in the Sca-1Low, Sca-1Mid, and Sca-1High fractions analyzed by quantitative RT-PCR did not differ significantly. Results represent the mean and standard errors from quadruplicate measurements. Each value has been standardized for GAPDH expression levels and is expressed as fold induction compared with the levels (set to 1) detected in the Sca-1Low sample. (Sca-1Low vs. Sca-1Mid, p-value > 0.4, Sca-1Mid vs. Sca-1High, p-value > 0.5 by Student's t-test.)
8

Nature manuscript 2007-10-11129A Huang_Supplement_FINAL.pdf
Supplementary Figure 5. Differentiation of EML cells into pro-erythrocytes and myelocytes. a, EML cells are positive for the stem-cell markers c-kit and Sca-1 without stimulation ('0d') as monitored by flow cytometry. Cells tracked over seven days (d) of Epo treatment showed loss of Sca-1 and c-kit expressions ('1d', '3d', '5d', and '7d'). b, Seven days of Epo stimulation ('7 Day Epo') results in positive benzidine staining (black arrow) as compared to the absence of staining in the un-stimulated cells ('Unstimulated'). Phase contrast images taken at 20x. c, EML cells stimulated with IL-3 and GM-CSF showed gain of expression for the myeloid-lineage specific markers Mac-1 and Gr-1 within seven days.
9

Nature manuscript 2007-10-11129A Huang_Supplement_FINAL.pdf
Supplementary Figure 6. Sca-1 clonal heterogeneity governs differentiation potential among individual subclones. Mean baseline Sca-1 expressions (histograms on the right) for four representative subclones (CL6_17, CL6_10, CL6_14, CL6_5) and the parental clone (CL 6) were inversely proportional to the rate of commitment to pro-erythrocytes upon stimulation with Epo (left). Subclones were generated by expansion of randomly-selected cells from the parental population. Burgundy diamonds, CL6_17; grey triangles, CL6_10; magenta squares, CL6_15; green circles, CL6_20; yellow triangles, CL6_14; black circles, CL6 and blue diamonds, CL6_5. Rank-order of differentiation kinetics for individual subclones is preserved across all four time points, p < 10-6 (permutation test).
10

Nature manuscript 2007-10-11129A Huang_Supplement_FINAL.pdf
Supplementary Figure 7. Sca-1Low cells are not spontaneously differentiated pro-erythrocytes. a, Sca-1Low cells (red) showed positive c-kit expression compared to differentiated pro-erythocytes (orange) and isotype control (light grey) as do the Sca-1Mid (green), Sca-1High (blue), and parental populations (black). b, Distribution of cells in the G0/G1 (light grey), S (white), and G2/M (dark grey) cell cycle phases among the Sca-1Low fraction (solid bars) and a mock-sorted whole population control (dashed bars) are similar at 0, 42, and 192 hours (h) after FACS isolation.
11

Nature manuscript 2007-10-11129A Huang_Supplement_FINAL.pdf
Supplementary Figure 8. GATA1 mRNA expression among sorted Sca-1 fractions. Quantitative RT-PCR analysis of GATA1 mRNA levels in Sca-1 sorted fractions after 5 or 14 days (d) of regular culture. Means ± standard error of triplicates shown.
Supplementary Figure 9. Global gene expression analysis showed high duplicate accuracy. Hybridization duplicates for global gene expression analysis using Illumina microbead chips for the Sca-1Low, Sca-1Mid, and Sca-1High cell fractions showed nearly identical GEDI maps, while the transcriptome dissimilarities between the cell fractions was recapitulated. Pearson’s correlation coefficient were > 99.0% for all three pairs of duplicates.
12
Nature manuscript 2007-10-11129A Huang_Supplement_FINAL.pdf
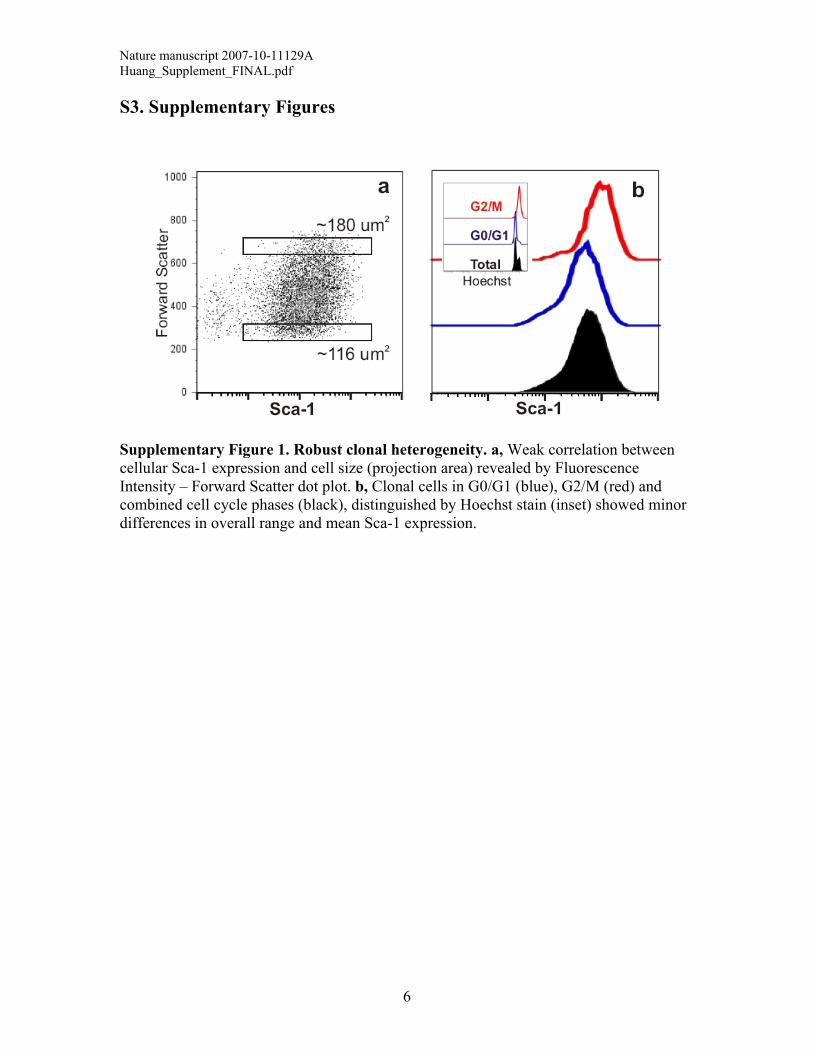
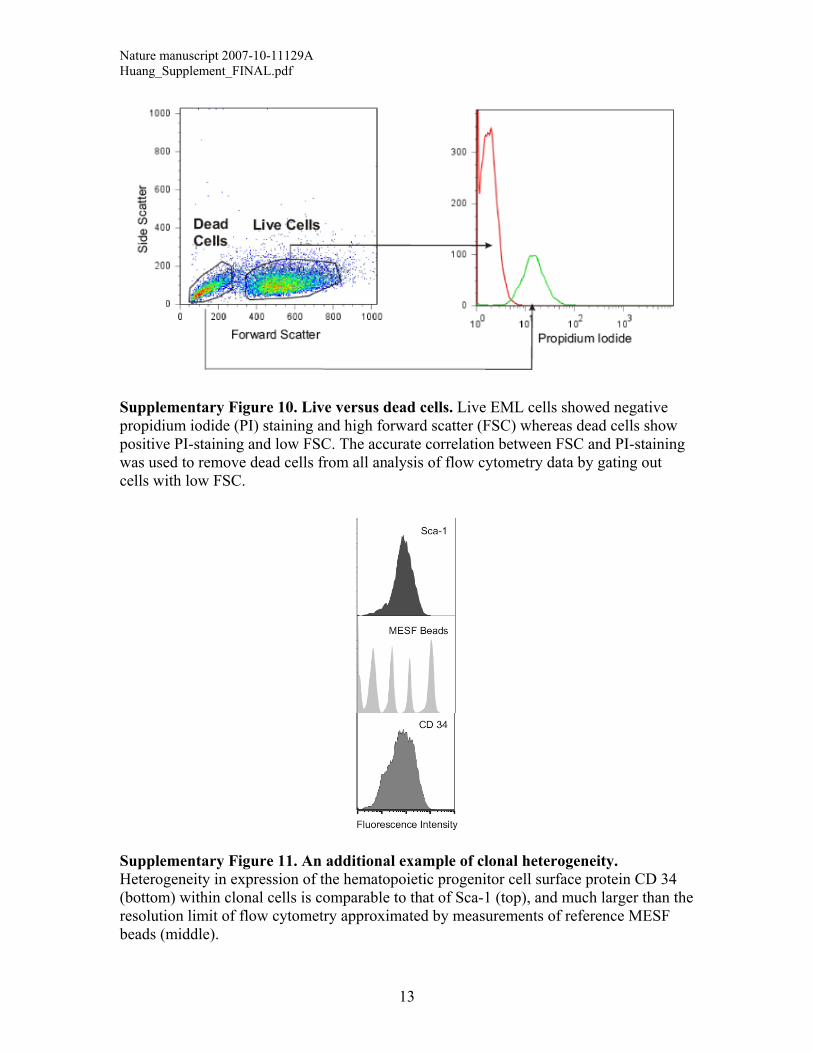
Supplementary Figure 10. Live versus dead cells. Live EML cells showed negative propidium iodide (PI) staining and high forward scatter (FSC) whereas dead cells show positive PI-staining and low FSC. The accurate correlation between FSC and PI-staining was used to remove dead cells from all analysis of flow cytometry data by gating out cells with low FSC.
Supplementary Figure 11. An additional example of clonal heterogeneity. Heterogeneity in expression of the hematopoietic progenitor cell surface protein CD 34 (bottom) within clonal cells is comparable to that of Sca-1 (top), and much larger than the resolution limit of flow cytometry approximated by measurements of reference MESF beads (middle).
13

Nature manuscript 2007-10-11129A Huang_Supplement_FINAL.pdf
Supplementary Figure 12. Additional analysis: Restoration of heterogeneity from sorted “extreme Sca-1 expressors”. Clonal cells with the highest (Sca-1Extreme High in blue) and lowest (Sca-1Extreme Low in red) 2% Sca-1 expression (rather than 15% as in the main text) also re-established the parental extent of clonal heterogeneity (grey) in separate cultures. However, the rate of restoration was very slow and the process incomplete even after 408 hrs. Interestingly, a spontaneously differentiating subpopulation is observed among the Sca-1Extreme Low fraction, which generated a new population of Sca-1neg cells. This gave rise to the familiar bimodal distribution indicative of fate commitment through a discontinuous, “all-or-none” switching process (see reference Chang et al in the main text). Notably, cells that did not spontaneously differentiate in the Sca-1Extreme Low fraction were capable of regenerating the parental distribution, but with a very slow rate.
14
Nature manuscript 2007-10-11129A Huang_Supplement_FINAL.pdf
S4. Supplementary Table Low-0d Mid-0d High-0d Low-6d Mid-6d High-6d Epo-7d
Low-0d 0.0266 ±
0.006 0.0548 ± 0.011
0.0791 ± 0.0215
Mid-0d 0.0614 ±
0.010 0.0844 ± 0.0267
High-0d 0.1578 ± 0.0323
Low-6d 0.0095 ±
0.002 0.0066 ± 0.0018
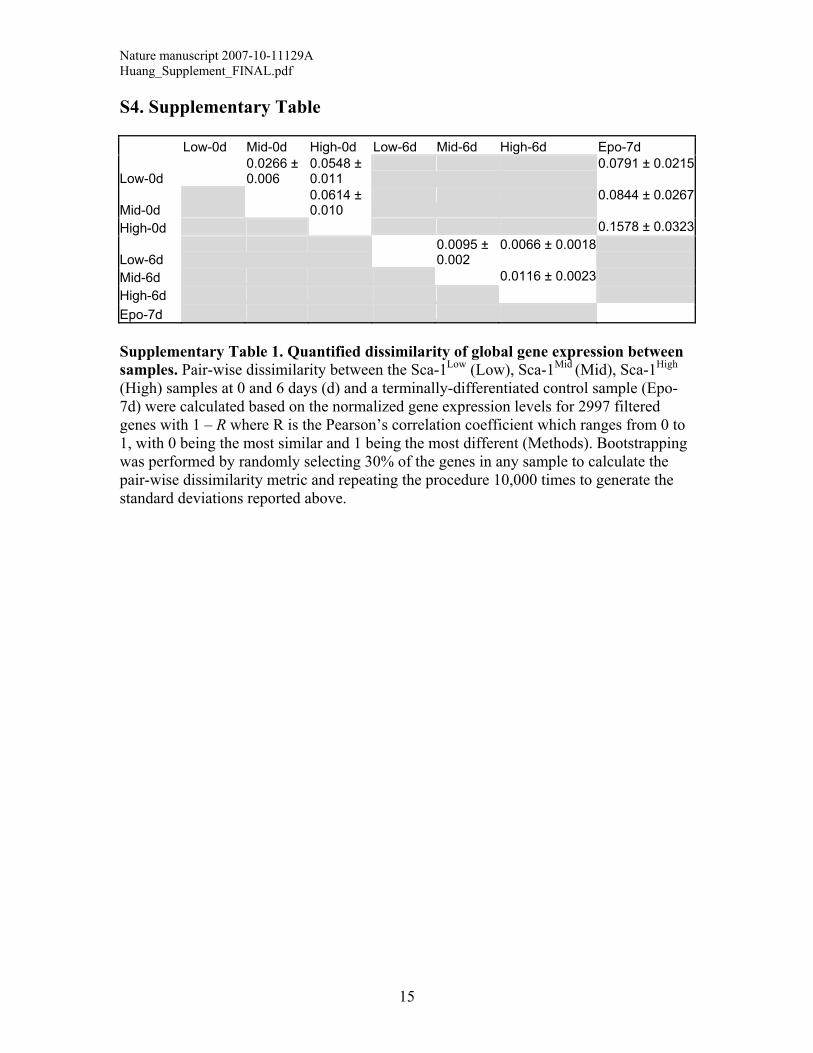
Mid-6d 0.0116 ± 0.0023 High-6d Epo-7d Supplementary Table 1. Quantified dissimilarity of global gene expression between samples. Pair-wise dissimilarity between the Sca-1Low (Low), Sca-1Mid (Mid), Sca-1High (High) samples at 0 and 6 days (d) and a terminally-differentiated control sample (Epo-7d) were calculated based on the normalized gene expression levels for 2997 filtered genes with 1 – R where R is the Pearson’s correlation coefficient which ranges from 0 to 1, with 0 being the most similar and 1 being the most different (Methods). Bootstrapping was performed by randomly selecting 30% of the genes in any sample to calculate the pair-wise dissimilarity metric and repeating the procedure 10,000 times to generate the standard deviations reported above.
15

Nature manuscript 2007-10-11129A Huang_Supplement_FINAL.pdf
S5. Theoretical Methods
As motivated in the main text, the temporal evolution of the distribution of cellular Sca-1 abundance (log fluorescence intensity values) cannot be fitted to a model consisting of a single Gaussian. Single-Gaussian fits for the Sca-1 distributions at the stationary time points were poor (p<10-50, Kolmogorov-Smirnov test). This is also evident from the hump in the long left tail occurring at different time points, a signature of multimodality. These features suggest that the restoration of the parental distribution is not a simple noise-driven, mean-reverting, equilibrium-seeking process in a smooth potential, such as an Ornstein-Uhlenbeck process. Taken together, this led to the hypothesis that the multi-modal character stems from the fact that the cell population is discretely heterogeneous, consisting of two (or more) distinct but overlapping subpopulations. Such a behavior may result from complex regulatory processes that involve multi-stability.
The purpose of the modeling and analysis presented below is to corroborate the notion of multiple subpopulations with respect to Sca-1 steady-state expression by testing whether the data can be better fitted to a multi-rather than single Gaussian distribution, without making assumptions concerning the unknown underlying molecular circuitries. The results show that a two-Gaussian model best fits the observed histogram evolution, and that the restoration of the parental distribution was predominantly driven by state transitions between the subpopulations. S5.A. Fitting of fluorescence histograms
The experiments show that the stationary distribution of the log-fluorescence intensity value of the cell population presents multimodal features. Moreover, after sufficient time, the stationary distribution is reconstituted from all three sorted fractions: Sca-1High, Sca-1Mid, and Sca-1Low. Therefore, the stationary distribution can be used to determine basic parameter values for a model of the distributions.
As a first approximation, the multimodal character of the data can be captured by a linear combination of n Gaussian distributions with different means and variances. The underlying assumption is that there are n subpopulations, where each subpopulation in isolation has a log-normal fluorescence distribution with different mean and variance. This leads to a Gaussian mixture model (GMM) with probability density function (PDF) given by
!1
( ) , ,n
i ii
P x w x "i# $ %&
&' (1)
where #(is the density of the ordinary Gaussian distribution with mean $i and standard deviation %i and wi is the weight of the ith component (subpopulation). The weights must
satisfy the constraints and . 1
1n
ii
w&
&' 0iw )
At long times, the histograms of the three sorted fractions converge and the parental population is reconstituted. To represent the observed multimodal stationary distribution we use a GMM, which is obtained by using the expectation-maximization (EM) algorithm7 to fit a total of 15 histograms corresponding to the last five time points
16

Nature manuscript 2007-10-11129A Huang_Supplement_FINAL.pdf
of each of the three time course experiments (Sca-1High, Sca-1Mid, and Sca-1Low).
Supplementary Figure 13. Number of components in GMM: selection through the Akaike Information Criterion (2). The AIC was calculated from the likelihood of the fits provided by the EM-algorithm and is minimal for n = 2 in most cases (Sca-1Low
at t = 216h and t = 432h; Sca-1Mid
at t = 216h, 264h and 432h; Sca-1High at t = 216h, 264h and 432h). The application of another
model selection criterion8 also selects n = 2 in almost all cases. In some cases, AIC is higher for n =2 than n =1 because the fluctuations make the bimodality less apparent.
The number of Gaussians, n, to be fitted to the data is a user-specified parameter in the EM algorithm. To compare GMM’s with different choices of n, we use Akaike’s information criterion (AIC)9,10 2 log 2 pAIC L n! " # (2) where L is the maximum likelihood of the model, np is the number of independently adjusted parameters within the model. When comparing different models, the one which minimizes Equation (2) provides the best combination of descriptive power and
17

Nature manuscript 2007-10-11129A Huang_Supplement_FINAL.pdf
parsimony. Supplementary Fig. 13 confirms that the GMM with n = 2 is the best choice based on the AIC. A similar model-selection framework8, which integrates the EM algorithm with an information criterion based on the Fisher information matrix, also came out in favor of the n = 2 model. The average parameter values found for the GMM with two Gaussians are given in Supplementary Fig. 14. These parameter values are used for the partitioning of the cells in the populations of the individual measurement points.
Supplementary Figure 14. The GMM obtained from the stationary time points. The dash-dotted black line shows the PDF for the GMM and the solid lines for the two components (to the left in blue) and (to the right in red). The parameters for the two virtual subpopulations were obtained from the last five time points and are given in the figure. The numerical error of the EM algorithm for the parameter values is 10-3 and thus too small to be shown.
1G
2G
S5.B. Partitioning the fluorescence data based on the GMM
In order to describe the dynamics by which the parental population is reconstituted from the individual sorted experiments (Fig. 2a in main text) the GMM binning algorithm was developed. The objective of the algorithm is to partition the cells of each measured population into the two overlapping Gaussian distributions (Supplementary Fig. 14) that constitute the stationary GMM obtained in Section S5.A. The GMM binning algorithm sorts the cells at time t according to their fluorescence value by assigning a probability that each cell belongs to subpopulation
( )N t( )jc t
:i ji ! ( ),j i iG P c t ",# $ %& . Each cell is then assigned randomly to the Gaussian based
on the normalized probability
( )jc t
/ji iP jiP' , as performed by the following pseudo-code:
18

Nature manuscript 2007-10-11129A Huang_Supplement_FINAL.pdf
Supplementary Figure 15. Results for the GMM binning algorithm for the data in Fig. 2a in the main text. From the top, partitions for t = 0, 9, 48, 96, 144, 216 h for the Sca-1Low (left), Sca-1Mid (center), and Sca-1High (right) time course. For each panel, the sum of the red and blue histograms is equivalent to the data in Fig. 2a in the main text. The probabilistic nature of the binning algorithm means that the two inferred subpopulations overlap. For all panels, x-axis is the log fluorescence and the y-axis is cell number.
19

Nature manuscript 2007-10-11129A Huang_Supplement_FINAL.pdf
Algorithm 1 (GMM binning algorithm) for each time t do
for each cell do ( )jc t ! " ! "( ), , , 1,...ji i j i iP t c t i n# $ %& &
! "iG t 'Assign ! "/ji jiiP P(
end for ! " ! " ! "/i iw t N t N t& ! " ( ) / ( )i jit c t N$ &( i
! " ! " ! "22 ( ) ( ) / ( ) 1i ji i it c t t N t% $& )(t
)
end for
The function Assign uses a random to decide to which subpopulation the sample cell should be assigned. The weights can then be calculated as
, where is the number of cells assigned to subpopulation i. The
mean, , and variance, , for each subpopulation
iG( )jc t
! " /t N
"! " ! "i iw t N t&
!i t$! "iN t
! "2i t% ! "iG t can also be calculated.
Because of the large number of cells in each sample, the algorithm is extremely robust and repeated runs give nearly identical results for the parameters (data not shown). The resulting histograms for the time points in Fig. 2a in the main text are shown in Supplementary Fig. 15. Due to the probabilistic nature of the binning algorithm, the two inferred subpopulations overlap.
S5.C. time evolution of the subpopulations
The separation of the fluorescence data into two subpopulations for each time point makes it possible to track the evolution of the relative weights of the subpopulations, as shown in Supplementary Fig. 16. We have considered two models to describe the temporal evolution of the , which we describe below.
iw
iw(a) Lineage Model A simple model of two interacting and growing subpopulations with linear first
order kinetics (Supplementary Fig. 17) leads to the following equations for the size ix of subpopulation i:
1 1 1 1 2
2 2 1 1 2
2
2
x rx k x k xx rx k x k x& ) *& * )
!!
(3)
where the dot denotes differentiation with respect to time, is the transition rate from 1k 1x to 2x and vice versa for . Since the cells are in a culture where there is a steady supply 2k
20

Nature manuscript 2007-10-11129A Huang_Supplement_FINAL.pdf
Supplementary Figure 16. Time evolution of the weights for the two subpopulations as inferred by the GMM binning algorithm from the data. Symbols represent the weights for (circles) and (triangles). The linear model is shown as a dotted line and the quadratic model as a solid line. The standard error for the weights obtained using Algorithm 1 is on the order of 10-3 and error bars are not shown. The dash-dotted black lines denote the stationary values of the weights (Supplementary Fig. 14). See also the caption of Fig. 2 in the main text for further discussion.
( )iw t
1G 2G
21

Nature manuscript 2007-10-11129A Huang_Supplement_FINAL.pdf
of nutrients, we assume that both subpopulations grow at the same rate . This assumption is supported by the data in Supplementary Fig. 3, which indicates that cells grow at the same rate regardless of their Sca-1 levels.
r
Supplementary Figure 17. Linear model for two interacting and growing populations. The two subpopulations interact and cells transition from 1x to 2x at rate and vice versa at rate . 1k 2k
The fluorescence intensity value is proportional to the relative fractions of the subpopulations. Therefore Equation (3) must be rewritten in terms of the relative populations. The evolution of the total population 1 2y x x! " is giving by . y ry!!Let and . From Equation 1 1 /w x y! 2 2 /w x y! (3), the evolution of can be written as iw
1 11 12
x y x yw k wy 1 2 2k w#
! ! # "! !!
whence we obtain 1 2 1 2( )w k k k w1! # "! (4) The solution for this equation is
$ % 1 2( )21 1
1 2 1 2
(0)k k tkw t e wk k k k
# " & '! " #(" ") *
2k + (5)
The rates and and the integration constant 1k 2k $ %1 0w can be fitted to the data. The obtained fits are shown in Supplementary Table 2.
Note that the linear model does not capture two important features of the data. First, the asymptotic behavior of $ %1w , and $ %2w , is clearly different from the stationary w values in Supplementary Fig. 14. Second, Supplementary Fig. 16 shows that the linear model fails to capture the sigmoidal character of the growth for the earlier time points ( t 96) in the cases of the Sca-1Mid
and Sca-1High population fractions. -
22

Nature manuscript 2007-10-11129A Huang_Supplement_FINAL.pdf
Sca-1Low Sca-1Mid Sca-1High
11k h!" #$ % .0010 .0027 .0009
12k h!"$ #% .0006 .0011 .0007
1(0)w .17 .0001 .0001
1( )w & .38 .30 .43
2 ( )w & .62 .70 .57 Supplementary Table 2. Parameters for the linear model for given by Equation 1w (5). The first three lines show the fitted parameters from the data. The last two lines show the asymptotic values calculated from the model.
(b) Nonlinear model
To better capture the asymptotic behavior and to explain the sigmoidal increase of the for the Sca-1Mid
and Sca-1High fractions, a simple non-linear model was
introduced. The linear model in Equation ' (w t
(3) predicts an exponential behavior of the weights, compatible with a probabilistic (first-order) transition of individual cells from subpopulations to . The sigmoidal departure from this exponential time evolution suggests a deviation from first order kinetics. In the simplest case, this can be caused by interaction between the cells. Cell differentiation and other discrete phenotypic state switches are often controlled by autocrine mechanisms that establish an autocatalytic loop that influences the rate of the state transition11-13. If, for instance, cells in one of the two states secrete a factor that promotes the switch to that state, this would cause the switching rate to depend on the ratio of the two subpopulations, resulting in sigmoidal rather than exponential kinetics.
2G 1G
As illustrated in Supplementary Fig. 18, the simplest model that captures this non cell-autonomous process contains two additional nonlinear (quadratic) terms that represent second order interactions between the two subpopulations. These terms model the effect of switching between the subpopulations mediated by the diffusion of a soluble signaling molecule. Assuming rapid diffusion, a simplified mean field model can be obtained in which the switching rate is proportional to the number of cells in a given state (subpopulation) in the culture.
23

Nature manuscript 2007-10-11129A Huang_Supplement_FINAL.pdf
Supplementary Figure 18. Nonlinear model of two interacting and growing populations. As in Supplementary Fig. 17, the two subpopulations interact and cells transition from to at rate and vice versa at rate . In addition, the transition rates are increased by the terms representing the diffusive signaling interactions
1G 2G
1k 2k
3 2 3 2/k x y k w! and , where 4 1 4/k x y k! 1w
1 2y x! " x is the total population. The equations governing the growth of the two subpopulations will then be:
# $# $
1 1 1 1 2 2 3 2 1 4 1
2 2 1 1 2 2 3 2 1 4 1
2
2
x rx k x k x k w x k w x
x rx k x k x k w x k w x
! % " % "
! " % " %
!
! (6)
where and are parameters determining the signal-induced switching rate. Rewriting in terms of the relative fraction as before, the growth is determined by
3k 4k
1w (7) 2
1 2 1 2 1( )w k k k k w kw! " % % %! 1
3
where . This equation has the solution 4k k k! %
1 21
1( ) tan2 2 2 2k kw t t ck k
& &" '! % % %() *
0+, (8)
where 2
1 2 1 2(2 2 ) ( )k k k k k k& ! % % % " and # $- .0 1 2 1arctan 2 (0) /c k k k kw &! " % " . The parameters obtained from fitting the data are shown in Supplementary Table 3. Note that for the Sca-1Mid and Sca-1High experiments, . If we make 2k k" 1 2 0k ! , Equation (7) becomes a standard logistic equation14 with solution
11
1 1
(0)( )(0) ( (0)) at
aww tkw k aw e%
!" %
(9)
where . 1a k k! %
24
Nature manuscript 2007-10-11129A Huang_Supplement_FINAL.pdf
As shown in Supplementary Table 3 and Supplementary Fig. 16, the nonlinear model has the expected asymptotic behavior. Moreover, it captures the sigmoidal kinetics for the Sca-1Mid
and Sca-1High
datasets, with plateaus for both the early and late time
points, with the correct asymptotic behavior.
Sca-1Low Sca-1Mid Sca-1High
11k h!" #$ % .12 .09 .06
12k h!"$ #% .012 81 10!& .0002
1k h!" #$ % .084 .11 .08
1(0)w .17 .005 62 10!&
1( )w ' .20 .23 .21
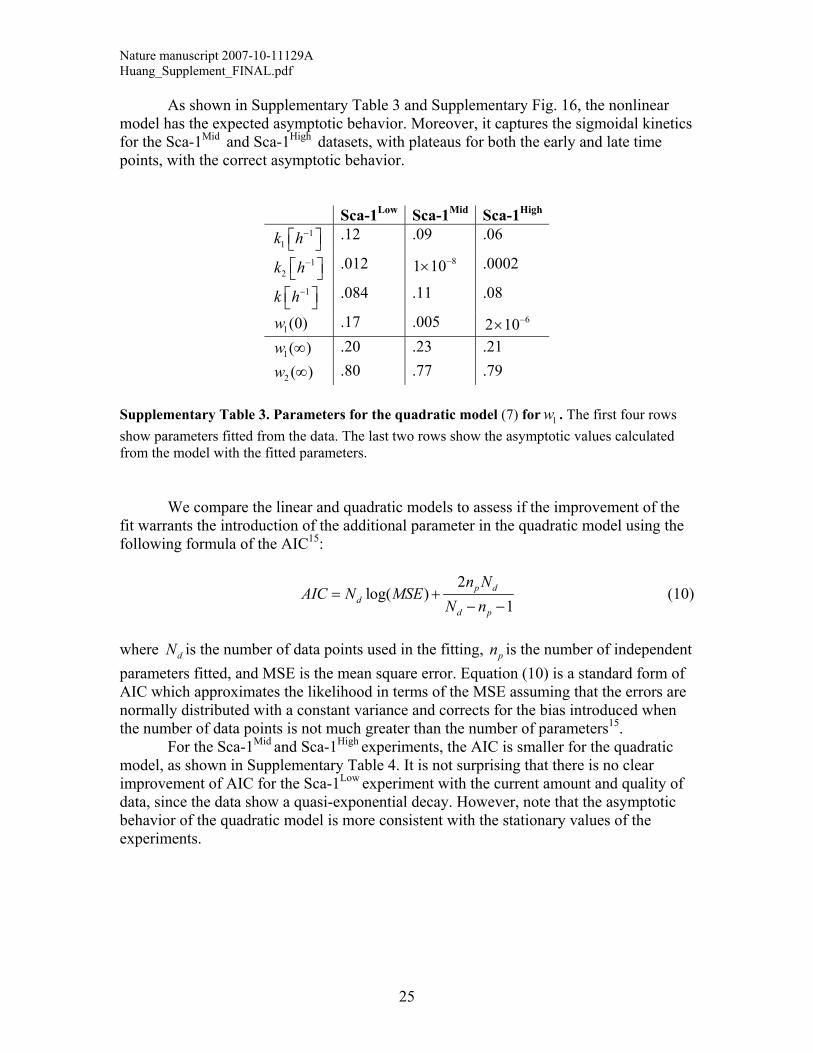
2 ( )w ' .80 .77 .79 Supplementary Table 3. Parameters for the quadratic model (7) for . The first four rows show parameters fitted from the data. The last two rows show the asymptotic values calculated from the model with the fitted parameters.
1w
We compare the linear and quadratic models to assess if the improvement of the fit warrants the introduction of the additional parameter in the quadratic model using the following formula of the AIC15:
2
log( )1
p dd
d p
n NAIC N MSE
N n( )
! ! (10)
where is the number of data points used in the fitting, is the number of independent parameters fitted, and MSE is the mean square error. Equation
dN pn(10) is a standard form of
AIC which approximates the likelihood in terms of the MSE assuming that the errors are normally distributed with a constant variance and corrects for the bias introduced when the number of data points is not much greater than the number of parameters15. For the Sca-1Mid
and Sca-1High experiments, the AIC is smaller for the quadratic
model, as shown in Supplementary Table 4. It is not surprising that there is no clear improvement of AIC for the Sca-1Low
experiment with the current amount and quality of data, since the data show a quasi-exponential decay. However, note that the asymptotic behavior of the quadratic model is more consistent with the stationary values of the experiments.
25

Nature manuscript 2007-10-11129A Huang_Supplement_FINAL.pdf
Sca-1Low Sca-1Mid Sca-1High
Linear -70.2 -82.8 -88.5
Non-linear -69.6 -86.0 -93.0 Supplementary Table 4. AIC for the linear and quadratic models. AIC values for the linear (5) and quadratic (7) models obtained from Equation (10) using the MSE calculated for the fitted functions with respect to the data. The values of the AIC indicate that for the Sca-1Mid and Sca-1High experiments, the improvement of the fit is large enough to warrant the introduction of the additional parameter in the quadratic model. Although the decay observed in the Sca-1Low experiment is quasi-exponential, and can thus be fitted well by both models, the asymptotic value of the quadratic model is more consistent with the stationary data (Supplementary Tables 2 and 3). Note that comparing AIC values is only meaningful for related models and the absolute value of AIC does not carry any meaning. It is normal for AIC values to be either positive (Supplementary Fig. 13) or negative15, as in this table. Clearly, other nonlinear terms governing the switching could be considered to explain the features. However, due to our limited knowledge of the detailed genetic circuitry involved in this process, more elaborate models would be highly speculative. Equation (6) has the virtue of modeling a typical cell interaction (autocrine regulation) and making minimal assumptions about the nature of the interactions, while its parameters carry a distinct biological interpretation.
(c) Fast relaxation within subpopulations The application of the GMM binning algorithm to the data provides us with an
empirical decomposition into two (virtual) subpopulations for all times. Thus, it is possible to obtain the time evolution of the mean, variance and higher moments of these empirical sub-histograms. Supplementary Fig. 19 shows the time evolution of the means of the two Gaussians, i! , while Supplementary Fig. 20 shows the time evolution of the skewness of the distributions. For all three experiments, the cells spread out and repopulate the full width of over the first 24-48 hours after the sorting, as shown by the rapid disappearance of the skewness in Supplementary Fig. 20. The means of the Sca-1Mid
and Sca-1High
experiments exhibit decay towards the stationary value with a relaxation occurring on the order of around two days. This drift in mean fluorescence is due to the approach towards the stationary distribution from initial histograms that are not fully populated (Supplementary Fig. 15). The fluctuations in the means of the unsorted Sca-1 controls (Supplementary Fig. 19d) reveal an overall decay pattern reflecting procedural noise. No such pattern is visible in the evolution of the skewness which indicates that the problem is due to an overall shift of the histogram between different time-points.
2G
The salient feature of the fluorescence histograms is that the changes of the relative heights of the peaks (the relative sizes of the two subpopulations) are much more significant than the changes of the width and locations of the two peaks. This is also in
26

Nature manuscript 2007-10-11129A Huang_Supplement_FINAL.pdf
agreement with the variability in the parameters of our GMM fits. As shown in Supplementary Fig. 19, the process of relaxation within the subpopulations is much faster than the slow process of balancing the weights to reconstitute the original distribution. This is in agreement with a model in which the restoration of the parental population distribution involves a more complex process with at least one discrete state transition rather than a simple mean-reverting process.
27
Nature manuscript 2007-10-11129A Huang_Supplement_FINAL.pdf
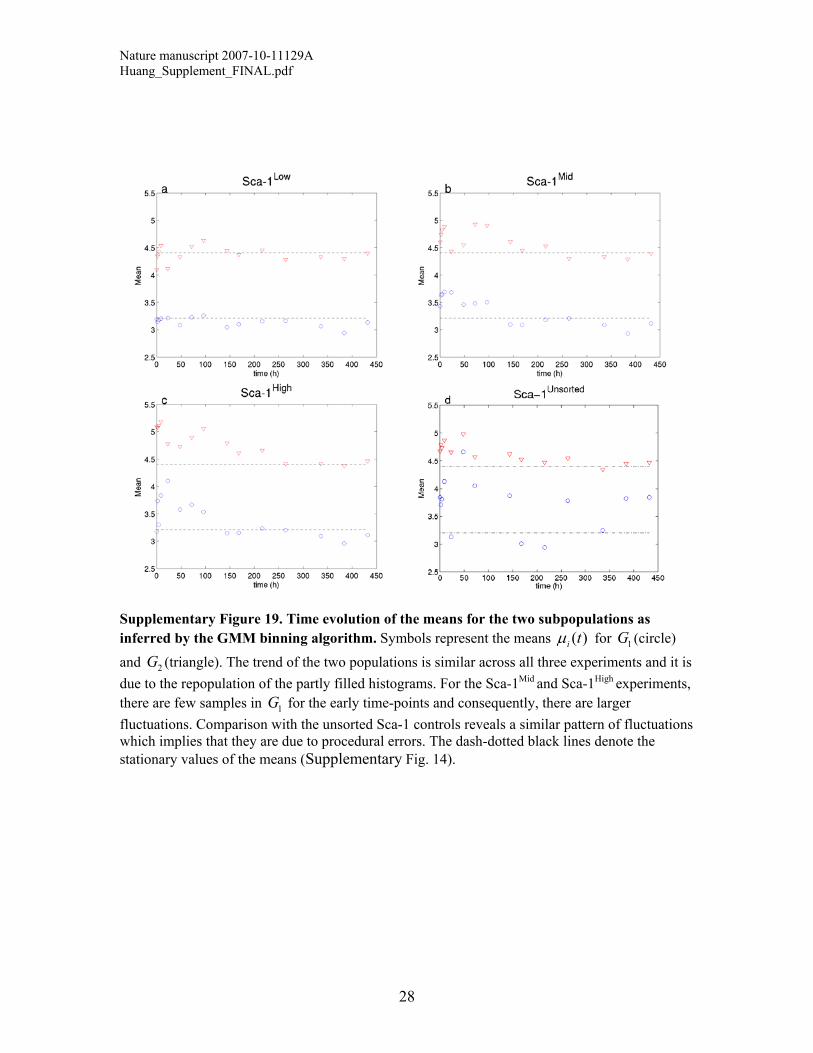
Supplementary Figure 19. Time evolution of the means for the two subpopulations as inferred by the GMM binning algorithm. Symbols represent the means ( )i t! for (circle) and (triangle). The trend of the two populations is similar across all three experiments and it is due to the repopulation of the partly filled histograms. For the Sca-1Mid
and Sca-1High experiments,
there are few samples in for the early time-points and consequently, there are larger fluctuations. Comparison with the unsorted Sca-1 controls reveals a similar pattern of fluctuations which implies that they are due to procedural errors. The dash-dotted black lines denote the stationary values of the means (Supplementary Fig. 14).
1G
2G
1G
28

Nature manuscript 2007-10-11129A Huang_Supplement_FINAL.pdf
Supplementary Figure 20. Time evolution of the skewness for the two subpopulations as inferred by the GMM binning algorithm. Symbols represent the skewness for (circle) and
(triangle). The skewness, (i.e., the normalized third central moment of the distribution) measures the asymmetry of the distribution. A value of zero indicates perfect symmetry. After FACS sorting, the starting subpopulations are non-Gaussian but they rapidly become symmetric. The process of balancing the relative weights to reconstitute the parental population occurs at a much slower timescale, as shown in Supplementary Fig. 16. For the Sca-1Mid
and Sca-1High
experiments, there are few samples in for the early time-points and consequently, there are larger fluctuations.
1G
2G
1G
29

Nature manuscript 2007-10-11129A Huang_Supplement_FINAL.pdf
30
S6. Supplementary Notes 1. Keyomarsi, K. et al. Synchronization of tumor and normal cells from G1 to
multiple cell cycles by lovastatin. Cancer Res 51, 3602-3609 (1991). 2. Zenger, V. E. et al. Quantitative flow cytometry: inter-laboratory variation.
Cytometry 33, 138-145 (1998). 3. Di Talia, S. et al. The effects of molecular noise and size control on variability in
the budding yeast cell cycle. Nature 448, 947-951 (2007). 4. Whitfield, M. L. et al. Identification of genes periodically expressed in the human
cell cycle and their expression in tumors. Mol Biol Cell 13, 1977-2000 (2002). 5. Pedraza, J. M. and van Oudenaarden, A. Noise propagation in gene networks.
Science 307, 1965-1969 (2005). 6. Mantzaris, N. V. From single-cell genetic architecture to cell population
dynamics: quantitatively decomposing the effects of different population heterogeneity sources for a genetic network with positive feedback architecture. Biophys J 92, 4271-4288 (2007).
7. Moon, T. K. The expectation-maximization algorithm. Signal processing magazine, IEEE 13, 47-60 (1996).
8. Figueiredo, M. A. T. and Jain, A. K. Unsupervised learning of finite mixture models. IEEE Transactions on Pattern Analysis and Machine Intelligence 24, 381-396 (2002).
9. Akaike, H. A new look at the statistical model identification. IEEE Transactions on automatic control 19, 716-723 (1974).
10. Wedel, M. and Desarbo, W. S. A Mixture Likelihood Approach for Generalized Linear-Models. Journal of Classification 12, 21-55 (1995).
11. Chitu, V. and Stanley, E. R. Colony-stimulating factor-1 in immunity and inflammation. Curr Opin Immunol 18, 39-48 (2006).
12. Ruscetti, F. W., Akel, S., and Bartelmez, S. H. Autocrine transforming growth factor-beta regulation of hematopoiesis: many outcomes that depend on the context. Oncogene 24, 5751-5763 (2005).
13. Whyatt, D. et al. An intrinsic but cell-nonautonomous defect in GATA-1-overexpressing mouse erythroid cells. Nature 406, 519-524 (2000).
14. Verhulst, P.F. Notice sur la loi que la population suit dans son accroissement. Curr. Math. Phys. 10, 113 (1838).
15. Burnham, Kenneth P. and Anderson, David R., Model Selection and Multimodel Inference: A Practical Information - Theoretical Approach. (Springer, 2002).