Transcriptome Assembly Quality Evaluation- Compare assembly2/reference to assembly1 using tblastn -...
12
Transcriptome Assembly Quality Evaluation
Transcript of Transcriptome Assembly Quality Evaluation- Compare assembly2/reference to assembly1 using tblastn -...
Transcriptome Assembly Quality Evaluation
Transcriptome Assembly Quality Evaluation
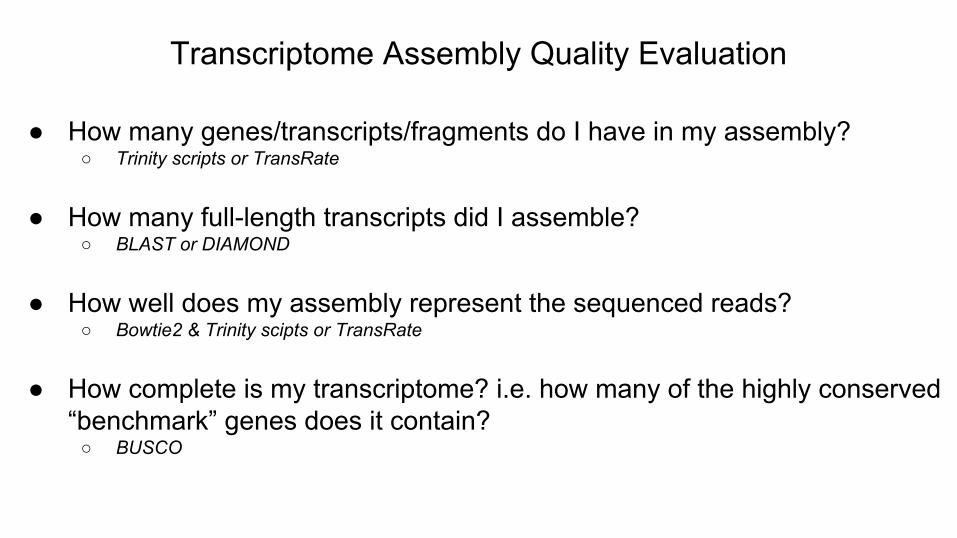
● How many genes/transcripts/fragments do I have in my assembly?○ Trinity scripts or TransRate
● How many full-length transcripts did I assemble?○ BLAST or DIAMOND
● How well does my assembly represent the sequenced reads?○ Bowtie2 & Trinity scipts or TransRate
● How complete is my transcriptome? i.e. how many of the highly conserved “benchmark” genes does it contain?
○ BUSCO

Assembly QC
● How many transcripts do I have?
$TRINITY_HOME/util/TrinityStats.pl <assembly.fa>
#########################Counts of transcripts, etc.#########################Total trinity 'genes': 333939Total trinity transcripts: 480312Percent GC: 48.76
TransRate gives more information
###############################Stats based on ALL transcript contigs:###############################
Contig N10: 8379Contig N20: 6325Contig N30: 4969Contig N40: 3944Contig N50: 3062
Median contig length: 439Average contig: 1213.23Total assembled bases: 582728498

● How well does my assembly represent the sequencing reads I put in?
$ bowtie2-build assembly.fa assembly.fa $ bowtie2 -p 10 -q -x assembly.fa -1 left.fq -2 right.fq
2>&1 1> /dev/null | tee align_stats.txt
374663449 reads; of these: 374663449 (100.00%) were paired; of these: 87397904 (23.33%) aligned concordantly 0 times 71727817 (19.14%) aligned concordantly exactly 1 time 215537728 (57.53%) aligned concordantly >1 times ---- 87397904 pairs aligned concordantly 0 times; of these: 7264984 (8.31%) aligned discordantly 1 time ---- 80132920 pairs aligned 0 times concordantly or discordantly; of these: 160265840 mates make up the pairs; of these: 48961820 (30.55%) aligned 0 times 23974234 (14.96%) aligned exactly 1 time 87329786 (54.49%) aligned >1 times93.47% overall alignment rate
Assembly QC
Ideally >80%
Or TransRate
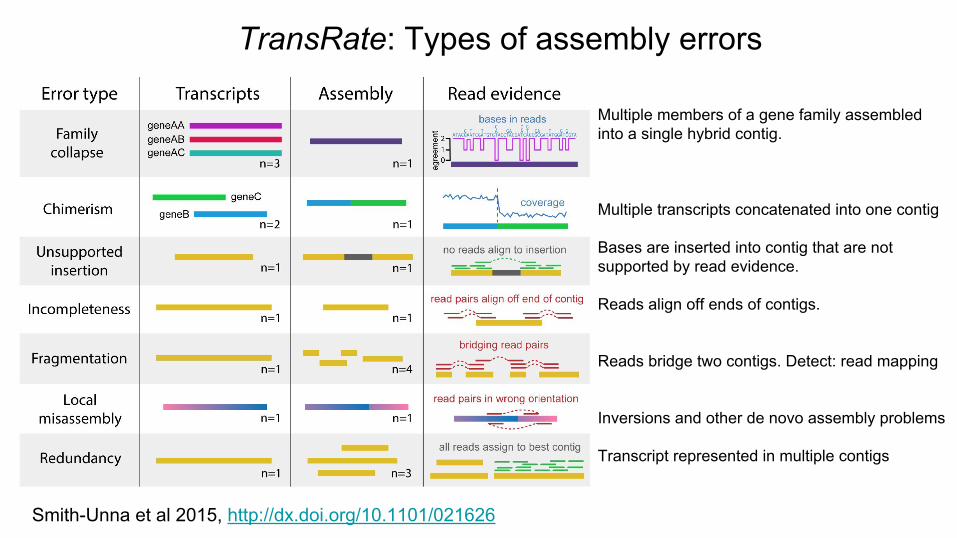
TransRate: Types of assembly errors
Multiple members of a gene family assembled into a single hybrid contig.
Multiple transcripts concatenated into one contig
Bases are inserted into contig that are not supported by read evidence.
Reads align off ends of contigs.
Reads bridge two contigs. Detect: read mapping
Inversions and other de novo assembly problems
Transcript represented in multiple contigs
Smith-Unna et al 2015, http://dx.doi.org/10.1101/021626
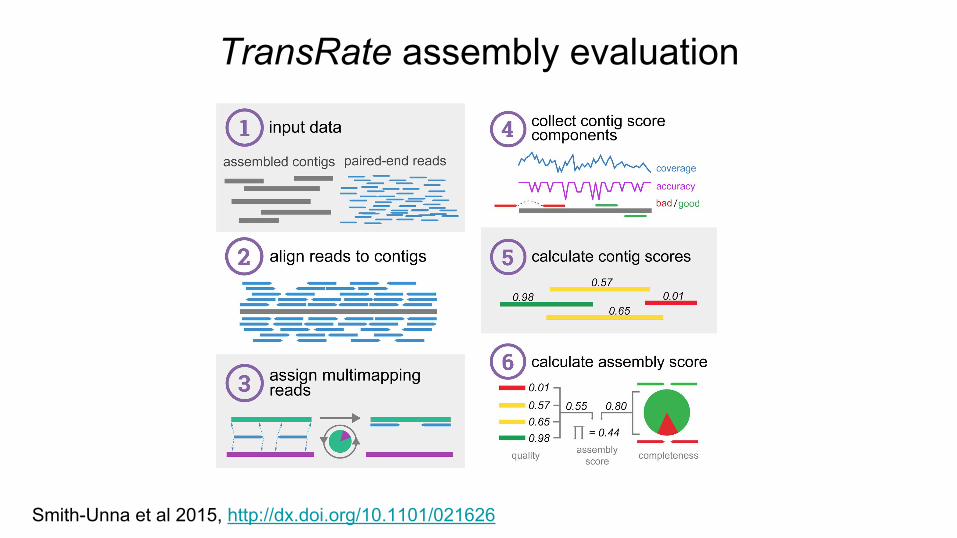
TransRate assembly evaluation
Smith-Unna et al 2015, http://dx.doi.org/10.1101/021626
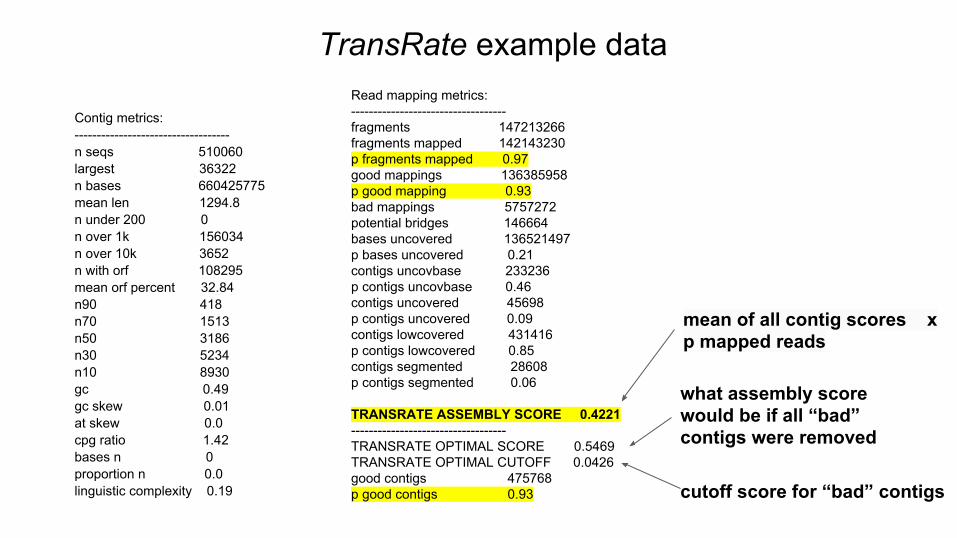
TransRate example data
Contig metrics:-----------------------------------n seqs 510060largest 36322n bases 660425775mean len 1294.8n under 200 0n over 1k 156034n over 10k 3652n with orf 108295mean orf percent 32.84n90 418n70 1513n50 3186n30 5234n10 8930gc 0.49gc skew 0.01at skew 0.0cpg ratio 1.42bases n 0proportion n 0.0linguistic complexity 0.19
Read mapping metrics:-----------------------------------fragments 147213266fragments mapped 142143230p fragments mapped 0.97good mappings 136385958p good mapping 0.93bad mappings 5757272potential bridges 146664bases uncovered 136521497p bases uncovered 0.21contigs uncovbase 233236p contigs uncovbase 0.46contigs uncovered 45698p contigs uncovered 0.09contigs lowcovered 431416p contigs lowcovered 0.85contigs segmented 28608p contigs segmented 0.06
TRANSRATE ASSEMBLY SCORE 0.4221 -----------------------------------TRANSRATE OPTIMAL SCORE 0.5469TRANSRATE OPTIMAL CUTOFF 0.0426good contigs 475768p good contigs 0.93 cutoff score for “bad” contigs
what assembly score would be if all “bad” contigs were removed
mean of all contig scores x p mapped reads
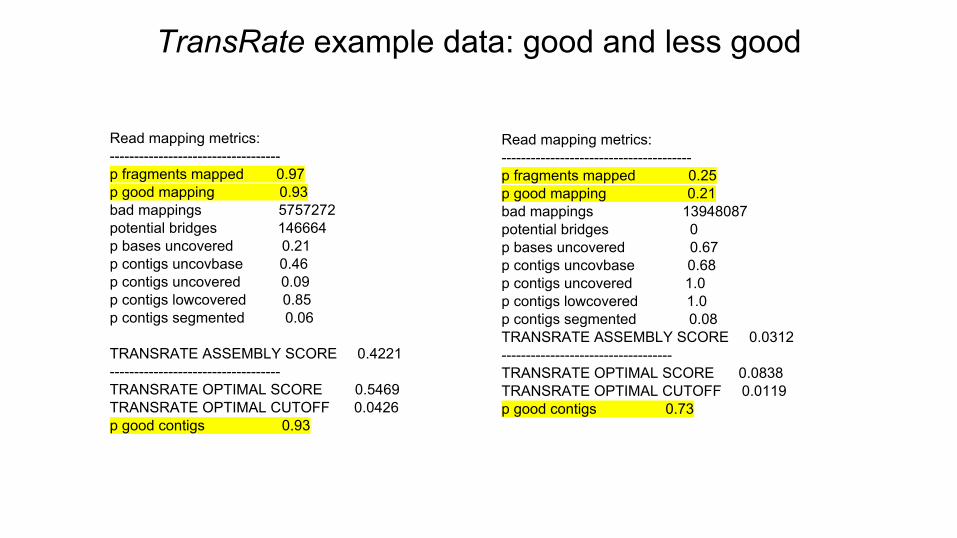
TransRate example data: good and less good
Read mapping metrics:-----------------------------------p fragments mapped 0.97p good mapping 0.93bad mappings 5757272potential bridges 146664p bases uncovered 0.21p contigs uncovbase 0.46p contigs uncovered 0.09p contigs lowcovered 0.85p contigs segmented 0.06
TRANSRATE ASSEMBLY SCORE 0.4221 -----------------------------------TRANSRATE OPTIMAL SCORE 0.5469TRANSRATE OPTIMAL CUTOFF 0.0426p good contigs 0.93
Read mapping metrics:---------------------------------------p fragments mapped 0.25p good mapping 0.21bad mappings 13948087potential bridges 0p bases uncovered 0.67p contigs uncovbase 0.68p contigs uncovered 1.0p contigs lowcovered 1.0p contigs segmented 0.08TRANSRATE ASSEMBLY SCORE 0.0312-----------------------------------TRANSRATE OPTIMAL SCORE 0.0838TRANSRATE OPTIMAL CUTOFF 0.0119p good contigs 0.73

Comparing assemblies using TransRate
- Looks for similarities between 2 assemblies using CRBB (Conditional Reciprocal Best BLAST)
- Conservative method for finding orthologs for annotation- Compare assembly1 to assembly2/reference using blastx- Compare assembly2/reference to assembly1 using tblastn- Conditional = e-value (similarity) cutoff is not user-defined- Learned by algorithm, accounting for sequence length and
overall “relatedness” of the 2 datasets
- Tells you about relative completeness of assemblies- How much of assembly1 has hits to assembly2/reference & vice
versa
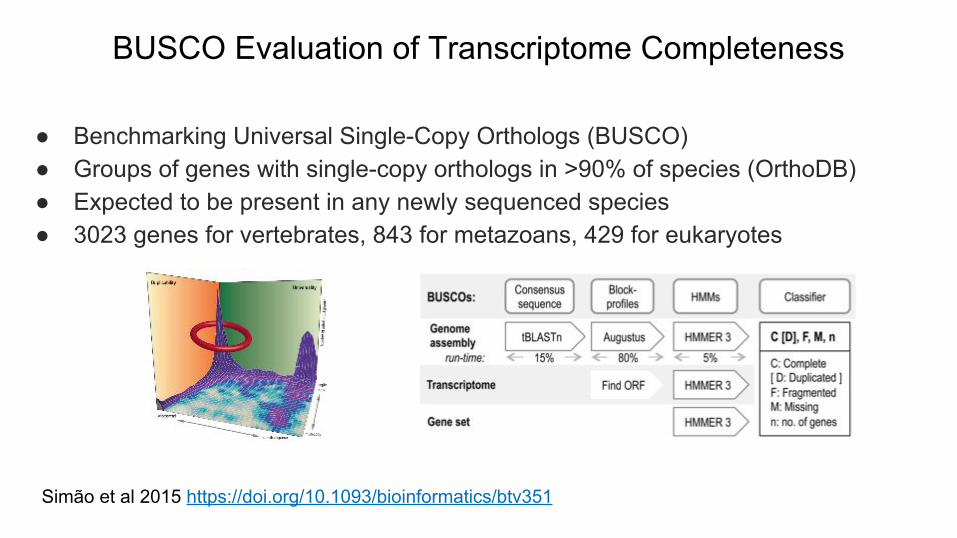
BUSCO Evaluation of Transcriptome Completeness
● Benchmarking Universal Single-Copy Orthologs (BUSCO)● Groups of genes with single-copy orthologs in >90% of species (OrthoDB)● Expected to be present in any newly sequenced species● 3023 genes for vertebrates, 843 for metazoans, 429 for eukaryotes
Simão et al 2015 https://doi.org/10.1093/bioinformatics/btv351
BUSCO Evaluation of Transcriptome Completeness
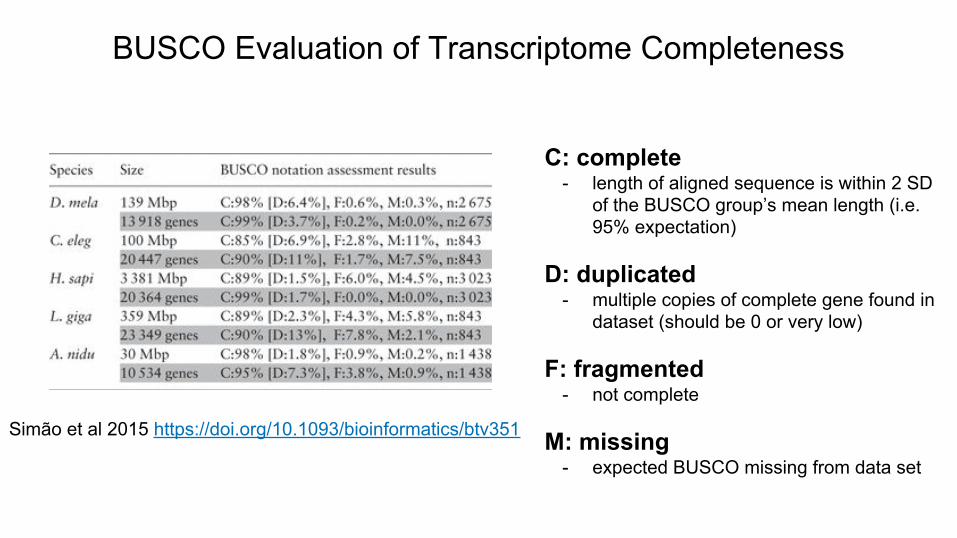
C: complete - length of aligned sequence is within 2 SD
of the BUSCO group’s mean length (i.e. 95% expectation)
D: duplicated- multiple copies of complete gene found in
dataset (should be 0 or very low)
F: fragmented- not complete
M: missing- expected BUSCO missing from data set
Simão et al 2015 https://doi.org/10.1093/bioinformatics/btv351

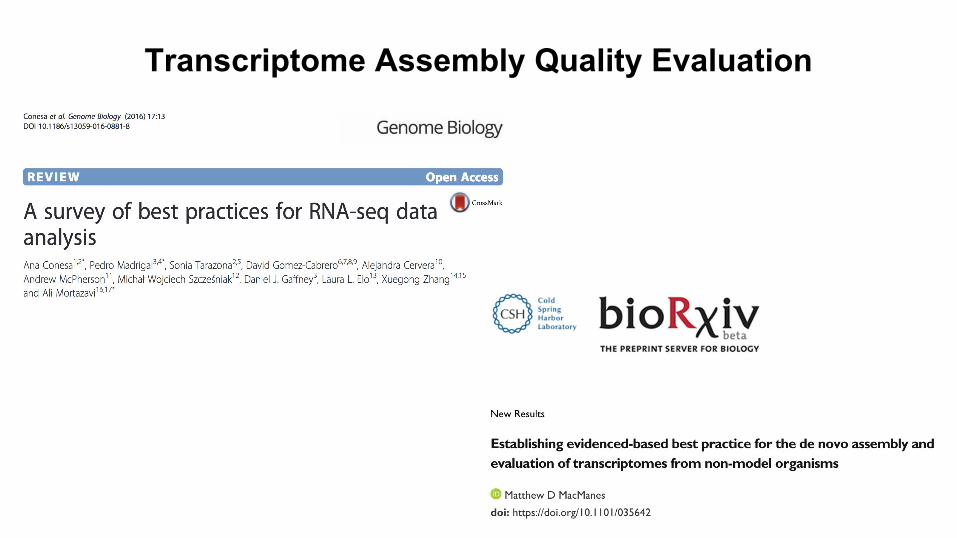
MacManes 2016, doi: https://doi.org/10.1101/035642
More example assembly stats
Assemblies made from larger # of biological reps have lower TransRate scores due to higher polymorphism but recover more BUSCOs.
![Identification and Characterization of Maize oury4 …Identification and Characterization of Maizefloury4 as a Novel Semidominant Opaque Mutant That Disrupts Protein Body Assembly1[W][OPEN]](https://static.fdocuments.us/doc/165x107/5e4a4e7897d31144b35737e6/identiication-and-characterization-of-maize-oury4-identiication-and-characterization.jpg)