
Transcriptional Regulation Patterns Revealed by High Resolution
14
Transcriptional Regulation Patterns Revealed by High Resolution Chromatin Immunoprecipitation during Cardiac Hypertrophy * □ S Received for publication, October 19, 2012, and in revised form, November 18, 2012 Published, JBC Papers in Press, December 10, 2012, DOI 10.1074/jbc.M112.429449 Danish Sayed ‡ , Minzhen He ‡ , Zhi Yang ‡ , Lin Lin § , and Maha Abdellatif ‡1 From the ‡ Cardiovascular Research Institute, Department of Cell Biology and Molecular Medicine, University of Medicine and Dentistry of New Jersey, Newark, New Jersey 07103 and the § Boston Children’s Hospital, Boston, Massachusetts 02115 Background: Transcriptional regulation plays an essential role in the development of cardiac hypertrophy. Results: Pol II and H3K9-acetyl chromatin immunoprecipitation reveal unique transcriptional patterns in the heart. Conclusion: Both de novo recruitment and promoter-pausing of pol II play critical roles in regulating specialized and house- keeping genes, respectively. Significance: Understanding transcriptional regulation helps in deciphering the mechanisms underlying hypertrophy. Cardiac hypertrophy is characterized by a generalized increase in gene expression that is commensurate with the increase in myocyte size and mass, on which is superimposed more robust changes in the expression of specialized genes. Both transcriptional and posttranscriptional mechanisms play fundamental roles in these processes; however, genome-wide characterization of the transcriptional changes has not been investigated. Our goal was to identify the extent and modes, RNA polymerase II (pol II) pausing versus recruitment, of tran- scriptional regulation underlying cardiac hypertrophy. We used anti-pol II and anti-histone H3K9-acetyl (H3K9ac) chromatin immunoprecipitation-deep sequencing to determine the extent of pol II recruitment and pausing, and the underlying epigenetic modifications, respectively, during cardiac growth. The data uniquely reveal two mutually exclusive modes of transcriptional regulation. One involves an incremental increase (30 –50%) in the elongational activity of preassembled, promoter-paused, pol II, and encompasses 25% of expressed genes that are essential/ housekeeping genes (e.g. RNA synthesis and splicing). Another involves a more robust activation via de novo pol II recruitment, encompassing 5% of specialized genes (e.g. contractile and extracellular matrix). Moreover, the latter subset has relatively shorter 3-UTRs with fewer predicted targeting miRNA, whereas most miRNA targets fall in the former category, under- scoring the significance of posttranscriptional regulation by miRNA. The results, for the first time, demonstrate that pro- moter-paused pol II plays a role in incrementally increasing housekeeping genes, proportionate to the increase in heart size. Additionally, the data distinguish between the roles of posttran- scriptional versus transcriptional regulation of specific genes. The regulation of gene expression is fundamental to organo- genesis and pathogenesis, including cardiac hypertrophy. Dur- ing hypertrophy there are two distinct transcriptional events that occur, a generalized increase in total RNA synthesis that underlies the 30 –50% increase in cell volume (1–3), on which is superimposed a more dramatic change in the expression of spe- cific genes, such as atrial natriuretic factor (ANF) and -skeletal actin (SkAc) (4, 5). The latter mode of transcription has been studied in more detail with regard to its regulation by specific transcription factors and enhancers (6, 7). However, the mech- anisms involved in the generalized increase in total cellular pro- tein commensurate with the increase in cell size remain poorly characterized. The changes in gene expression during cardiac development or disease have been commonly assessed by cDNA microarrays, or more recently by deep sequencing, which measure the rela- tive changes in mRNA levels in the heart (8 –10). Although the methods used do not distinguish between transcriptional and posttranscriptional mechanisms that underlie the changes in mRNA levels, the preconceived assumption is that they are pre- dominantly transcriptional in nature. However, after the dis- covery of miRNA 2 and the extent to which they posttranscrip- tionally regulate gene expression (11), the challenging question now is: to what extent does transcriptional versus posttran- scriptional regulation contribute to the changes in gene expres- sion in the heart?, which is in part what we have attempted to address in this study. The central dogma that has dominated until recently sug- gests that transcription of most genes is mainly initiated by the recruitment of RNA polymerase II (pol II) and the preinitiation complex to the transcription start site (TSS), whereas the pre- assembly of paused pol II is reserved for only select genes (12). With the advent of chromatin immunoprecipitation (ChIP) and ChIP-Sequencing (Seq) and quantitative in situ hybridiza- * This work was supported, in whole or in part, by National Institutes of Health Grants HL057970 and HL104115 (to M. A.). This work was also supported by American Heart Association Scientist Development Grant 12SDG8820011 (to D. S.). □ S This article contains supplemental Figs. 1S–13S, Tables 1S– 8S, and addi- tional references. 1 To whom correspondence should be addressed. Tel.: 973-972-1254; Fax: 973-972-7489; E-mail: [email protected]. 2 The abbreviations used are: miRNA, micro RNA; ChIP, chromatin immuno- precipitation; H3K9ac, H3 histone lysine 9 acetylated; IGB, Integrated Genome Browser; pol II, RNA polymerase II; qPCR, quantitative PCR; Seq, sequencing; TAC, transverse aortic constriction; TSS, transcription start site. THE JOURNAL OF BIOLOGICAL CHEMISTRY VOL. 288, NO. 4, pp. 2546 –2558, January 25, 2013 © 2013 by The American Society for Biochemistry and Molecular Biology, Inc. Published in the U.S.A. 2546 JOURNAL OF BIOLOGICAL CHEMISTRY VOLUME 288 • NUMBER 4 • JANUARY 25, 2013 by guest on April 4, 2019 http://www.jbc.org/ Downloaded from
Transcript of Transcriptional Regulation Patterns Revealed by High Resolution
Transcriptional Regulation Patterns Revealed by HighResolution Chromatin Immunoprecipitation during CardiacHypertrophy*□S
Received for publication, October 19, 2012, and in revised form, November 18, 2012 Published, JBC Papers in Press, December 10, 2012, DOI 10.1074/jbc.M112.429449
Danish Sayed‡, Minzhen He‡, Zhi Yang‡, Lin Lin§, and Maha Abdellatif‡1
From the ‡Cardiovascular Research Institute, Department of Cell Biology and Molecular Medicine, University of Medicine andDentistry of New Jersey, Newark, New Jersey 07103 and the §Boston Children’s Hospital, Boston, Massachusetts 02115
Background: Transcriptional regulation plays an essential role in the development of cardiac hypertrophy.Results: Pol II and H3K9-acetyl chromatin immunoprecipitation reveal unique transcriptional patterns in the heart.Conclusion: Both de novo recruitment and promoter-pausing of pol II play critical roles in regulating specialized and house-keeping genes, respectively.Significance: Understanding transcriptional regulation helps in deciphering the mechanisms underlying hypertrophy.
Cardiac hypertrophy is characterized by a generalizedincrease in gene expression that is commensurate with theincrease in myocyte size and mass, on which is superimposedmore robust changes in the expression of specialized genes.Both transcriptional and posttranscriptional mechanisms playfundamental roles in these processes; however, genome-widecharacterization of the transcriptional changes has not beeninvestigated. Our goal was to identify the extent and modes,RNA polymerase II (pol II) pausing versus recruitment, of tran-scriptional regulation underlying cardiac hypertrophy.We usedanti-pol II and anti-histone H3K9-acetyl (H3K9ac) chromatinimmunoprecipitation-deep sequencing to determine the extentof pol II recruitment and pausing, and the underlying epigeneticmodifications, respectively, during cardiac growth. The datauniquely reveal twomutually exclusivemodes of transcriptionalregulation. One involves an incremental increase (30–50%) inthe elongational activity of preassembled, promoter-paused, polII, and encompasses�25%of expressed genes that are essential/housekeeping genes (e.g. RNA synthesis and splicing). Anotherinvolves amore robust activation via de novo pol II recruitment,encompassing �5% of specialized genes (e.g. contractile andextracellular matrix). Moreover, the latter subset has relativelyshorter 3�-UTRs with fewer predicted targeting miRNA,whereasmostmiRNA targets fall in the former category, under-scoring the significance of posttranscriptional regulation bymiRNA. The results, for the first time, demonstrate that pro-moter-paused pol II plays a role in incrementally increasinghousekeeping genes, proportionate to the increase in heart size.Additionally, the data distinguish between the roles of posttran-scriptional versus transcriptional regulation of specific genes.
The regulation of gene expression is fundamental to organo-genesis and pathogenesis, including cardiac hypertrophy. Dur-ing hypertrophy there are two distinct transcriptional eventsthat occur, a generalized increase in total RNA synthesis thatunderlies the 30–50% increase in cell volume (1–3), onwhich issuperimposed amore dramatic change in the expression of spe-cific genes, such as atrial natriuretic factor (ANF) and�-skeletalactin (�SkAc) (4, 5). The latter mode of transcription has beenstudied in more detail with regard to its regulation by specifictranscription factors and enhancers (6, 7). However, the mech-anisms involved in the generalized increase in total cellular pro-tein commensurate with the increase in cell size remain poorlycharacterized.The changes in gene expression during cardiac development
or disease have been commonly assessed by cDNAmicroarrays,or more recently by deep sequencing, which measure the rela-tive changes in mRNA levels in the heart (8–10). Although themethods used do not distinguish between transcriptional andposttranscriptional mechanisms that underlie the changes inmRNA levels, the preconceived assumption is that they are pre-dominantly transcriptional in nature. However, after the dis-covery of miRNA2 and the extent to which they posttranscrip-tionally regulate gene expression (11), the challenging questionnow is: to what extent does transcriptional versus posttran-scriptional regulation contribute to the changes in gene expres-sion in the heart?, which is in part what we have attempted toaddress in this study.The central dogma that has dominated until recently sug-
gests that transcription of most genes is mainly initiated by therecruitment of RNA polymerase II (pol II) and the preinitiationcomplex to the transcription start site (TSS), whereas the pre-assembly of paused pol II is reserved for only select genes (12).With the advent of chromatin immunoprecipitation (ChIP)and ChIP-Sequencing (Seq) and quantitative in situ hybridiza-* This work was supported, in whole or in part, by National Institutes of Health
Grants HL057970 and HL104115 (to M. A.). This work was also supported byAmerican Heart Association Scientist Development Grant 12SDG8820011(to D. S.).
□S This article contains supplemental Figs. 1S–13S, Tables 1S– 8S, and addi-tional references.
1 To whom correspondence should be addressed. Tel.: 973-972-1254; Fax:973-972-7489; E-mail: [email protected].
2 The abbreviations used are: miRNA, micro RNA; ChIP, chromatin immuno-precipitation; H3K9ac, H3 histone lysine 9 acetylated; IGB, IntegratedGenome Browser; pol II, RNA polymerase II; qPCR, quantitative PCR; Seq,sequencing; TAC, transverse aortic constriction; TSS, transcription startsite.
THE JOURNAL OF BIOLOGICAL CHEMISTRY VOL. 288, NO. 4, pp. 2546 –2558, January 25, 2013© 2013 by The American Society for Biochemistry and Molecular Biology, Inc. Published in the U.S.A.
2546 JOURNAL OF BIOLOGICAL CHEMISTRY VOLUME 288 • NUMBER 4 • JANUARY 25, 2013
by guest on April 4, 2019
http://ww
w.jbc.org/
Dow
nloaded from
tion technologies, we are starting to realize that promoter-proximal pol II pausing ismorewidespread thanwas previouslythought, as identified in theDrosophila genome (13–15). How-ever, until now we did not know whether this phenomenon isinvolved in gene regulation in any mammalian organ duringdevelopment or disease. In this study our ChIP-Seq datarevealed unprecedented details of transcriptional regulationduring cardiac hypertrophy.
EXPERIMENTAL PROCEDURES
Animals
The work was done in accordance with US National Insti-tutes of Health Guidelines for the Care and Use of LaboratoryAnimals (No. 85-23). All animal protocols were approved bythe Institutional Animal Care and Use Committee at the NewJersey Medical School.
Transverse Aortic Constriction
Twelve-week-old C57BL/6 mice were anesthetized intra-peritoneally with a mixture of ketamine (65 mg/kg), xylazine(13 mg/kg), and acepromazine (2 mg/kg). The adequacy of theanestheticwas confirmedby the loss of tongue retraction reflex.The transverse thoracic aorta between the innominate arteryand the left common carotid artery was dissected free, and a 7-0braided polyester suture was tied around the aorta against a28-gauge needle with the aid of an operating microscope. Theneedle was removed, the chest closed, and the mice were extu-bated and allowed to recover in a Thermocare unit (tempera-ture 88 °F or 31 °C; humidity 30–50%; oxygen 1–2 ml/min, lowflow range). Postoperative buprenorphine (0.01–0.05 mg/kg)was administered subcutaneously every 12 h, as needed. Thesham operation involved the same procedure, except the aortawas not constricted.
ChIP-Seq of Sham, TAC-induced Hypertrophy, and NeonatalHearts
The hearts were isolated from 12–13-week-old C57BL/6mice 4 days after transverse aortic constriction (TAC, n� 3) ora sham operation (n � 2), or from normal mice (n � 1), andfrom two litters of 1-day-oldC57BL/6 neonate pubs. The heartsfrom the TAC, sham/normal, and neonatal hearts were pooledand subjected to RNA pol II and H3K9ac ChIP-Seq (Genpath-way, now a part of ActiveMotif, Inc). Immunoprecipitation wasperformed using anti-RNA pol II CTD (Abcam; ab5095) andanti-H3K9ac (ActiveMotif; 39918), followed by high through-put Illumina sequencing using Illumina Genome Analyzer 2.Sequencing of input DNA taken before immunoprecipitationserved as control for normalization and eliminating back-ground noise.
ChIP-Seq Analysis
The following analysis was performed by ActiveMotif Inc.Sequence Analysis—36 nucleotides of the sequencing reads
(tags, �10 million) with no more than 2 mismatches werealigned to the genome using ELAND algorithm.Determination of Fragment Density—Tags were extended
(110–200 bp) at their 3� end in silico. The genome was divided
into 32-nucleotide bins, and the density of the fragments(extended tags) in each bin was determined. The results of thisare stored in a binary analysis results file.Peak Finding (Intervals)—Intervals are defined genomic
regions that represent the fragment density peaks. It must havethree consecutive bins with fragment densities greater than thethreshold (usually 10–20).Active Regions—For the purpose of comparison between
samples, regions with overlapping intervals are grouped intoactive regions.Annotation—The locations and proximities to gene annota-
tions of intervals and active regions were defined and compiledin Excel spreadsheets, which include average and peak frag-ment densities.
Quantitative Polymerase Chain Reaction (qPCR)
Total RNA was reversed transcribed to cDNA using a HighCapacity cDNA Reverse Transcription Kit (Applied Biosci-ences) according to the manufacturer’s protocol. QuantitativePCR was performed using TaqMan gene expression assays(primer/probe sets) on Applied Biosystems 7500 Real-TimePCR system for the following genes: 18S (Mm03928990_g1),GAPDH (Mm99999915_g1), Nppa (Mm01255747_g1),Ankrd1 (Mm00496512_m1), Vdac1 (Mm00834272_m1),Pnn (Mm00447098_m1), and Calm1 (Mm01336281_g1).
Western Blotting
Ten-�g protein samples were subjected to electrophoresison 4–15% SDS-PAGE (Criterion gels; Bio-Rad). The antibodiesused for Western blot analysis included anti-ANKRD1 (SantaCruz), anti-CDK9 (Santa Cruz), anti-myosin, slow (Sigma),anti-TFIIB (Millipore), anti-GAPDH (Chemicon), anti-Vdac1(Genscript), anti-GFP (BD Biosciences), anti-luciferase (NovusBiologicals), anti-BNIP3 (Genscript), and anti-Nelf-A (SantaCruzBiotechnology). The signalwas detected and quantified bythe Odyssey Imaging System (LI-COR).
Statistics
Calculation of significance between two groups was per-formed using an unpaired, two-tailed Student’s t test (Excelsoftware). p � 0.05 was considered significant.
RESULTS
Anti-Pol II and Anti-H3K9ac ChIP-Seq Reveal WidespreadPromoter-Proximal Pausing of Pol II in the Quiescent AdultHeart and Its Incremental Release during Active Growth—Todetermine which genes are regulated by changes in the tran-scription levels, as well as, to understand how the expression ofessential/housekeeping genes parallels the increase in myocytesize and mass during hypertrophy, we applied anti-pol II andanti-H3K9ac ChIP-Seq to the mouse heart undergoing eitherpostnatal or pressure-induced hypertrophy. This approachmeasures the genome-wide levels of pol II associatedwith genesas a direct reflection of their transcriptional activity. In parallel,hyperacetylation of H3K9 is associated with promoter activa-tion (16, 17). This approach also reveals the level of promoterpausing of pol II and its release under different conditions. Aspreviously noted, the expression of paused genes is not
RNA Polymerase II Pausing Regulates Cardiac Hypertrophy
JANUARY 25, 2013 • VOLUME 288 • NUMBER 4 JOURNAL OF BIOLOGICAL CHEMISTRY 2547
by guest on April 4, 2019
http://ww
w.jbc.org/
Dow
nloaded from
completely halted, but proceeds at a relatively low level (18).One predicted function of pausing is that it may fine tune theexpression of a gene; however, until now the functional rel-evance of pausing during development or disease has notbeen identified.Specifically, we applied anti-pol II and anti-H3K9ac ChIP-
Seq to 1-day-old neonatal, 12-week adult, and pressure over-load-induced mice hearts. The results show that 51, 31, and
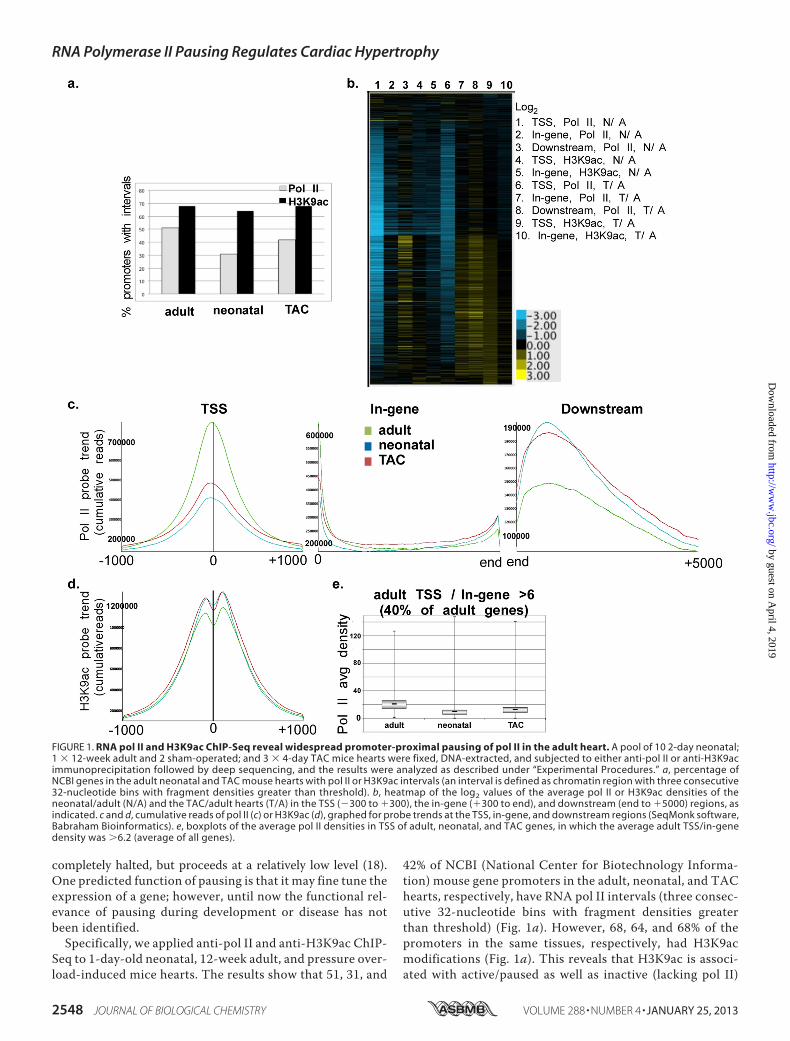
42% of NCBI (National Center for Biotechnology Informa-tion) mouse gene promoters in the adult, neonatal, and TAChearts, respectively, have RNA pol II intervals (three consec-utive 32-nucleotide bins with fragment densities greaterthan threshold) (Fig. 1a). However, 68, 64, and 68% of thepromoters in the same tissues, respectively, had H3K9acmodifications (Fig. 1a). This reveals that H3K9ac is associ-ated with active/paused as well as inactive (lacking pol II)
FIGURE 1. RNA pol II and H3K9ac ChIP-Seq reveal widespread promoter-proximal pausing of pol II in the adult heart. A pool of 10 2-day neonatal;1 � 12-week adult and 2 sham-operated; and 3 � 4-day TAC mice hearts were fixed, DNA-extracted, and subjected to either anti-pol II or anti-H3K9acimmunoprecipitation followed by deep sequencing, and the results were analyzed as described under “Experimental Procedures.” a, percentage ofNCBI genes in the adult neonatal and TAC mouse hearts with pol II or H3K9ac intervals (an interval is defined as chromatin region with three consecutive32-nucleotide bins with fragment densities greater than threshold). b, heatmap of the log2 values of the average pol II or H3K9ac densities of theneonatal/adult (N/A) and the TAC/adult hearts (T/A) in the TSS (�300 to �300), the in-gene (�300 to end), and downstream (end to �5000) regions, asindicated. c and d, cumulative reads of pol II (c) or H3K9ac (d), graphed for probe trends at the TSS, in-gene, and downstream regions (SeqMonk software,Babraham Bioinformatics). e, boxplots of the average pol II densities in TSS of adult, neonatal, and TAC genes, in which the average adult TSS/in-genedensity was �6.2 (average of all genes).
RNA Polymerase II Pausing Regulates Cardiac Hypertrophy
2548 JOURNAL OF BIOLOGICAL CHEMISTRY VOLUME 288 • NUMBER 4 • JANUARY 25, 2013
by guest on April 4, 2019
http://ww
w.jbc.org/
Dow
nloaded from
promoters (e.g. klf5 and Fzd3, supplemental Fig. 1S). In con-trast, all promoters that were occupied by pol II wereH3K9-acetylated.To view the pol II binding pattern relative to changes in
H3K9 acetylation during neonatal or TAC-induced hyper-trophic growth of the heart, we generated a heatmap of the log2values of average pol II densities of neonatal/adult (N/A) andTAC/adult (T/A) at the TSS (�300 to �300), in-gene (�300 to3� boundary), and downstream (3� boundary to �5000) andsimilarly for theH3K9ac densities at the TSS (�1000 to�1000)and the in-gene region. The data reveal that the majority of theexpressed genes (�80%) exhibit a reduction (log2 �0) in pol IIdensity at the TSS in the growing hearts relative to the adult(Fig. 1b, lanes 1 and 6). Most of these genes are accompanied bynone, or little, change in in-gene pol II (Fig. 1b, lanes 2 and 7).However, the decrease in promoter pol II, accompanied bynone or little increase in in-gene pol II, is associated with anincrease (log2 �0) in downstream pol II in 50% of those genes(Fig. 1b, lanes 3 and 8). The results indicated a generalized,synchronous, and incremental increase in promoter clearanceof paused pol II with little or no de novo recruitment. Thisinterpretation was validated by the commensurate incrementalincrease in promoter H3K9 acetylation (an indicator of pro-moter activation, lanes 4, 5, 9, and 10). On the other hand, 4 and23% of genes in the TAC and neonatal hearts, respectively,exhibited reduced (log2 �0) TSS, in-gene, and downstream polII that was associated with reduced promoter H3K9ac content,denoting lower transcriptional activity. A much smaller frac-tion of genes (�5%) in either the neonatal or the TAC-inducedheart exhibited a generalized increase in pol II and H3K9 con-tent (Fig. 1b).A graphical representation of the cumulative pol II density in
the TSS, in-gene, or downstream regions confirms that theoverall trend in pol II distribution across the genome reveals 60and 50% reduction inTSSpol II in the neonatal andTAChearts,respectively, relative to the adult heart, with little change in thein-gene pol II, accompanied by an equivalent increase in down-stream accumulated pol II in both, reflecting the widespreadrelease of promoter-proximal pol II pausing during cardiacgrowth (Fig. 1c). Consistently, H3K9ac modification isincreased, confirming an increase in the activation status ofthese promoters (Fig. 1d). The incremental (10%) nature of thischange reflects the incremental increase in transcriptioninduced by this type of regulation. The boxplot in Fig. 1e showsthe mean, minimum, maximum, first and third quartiles of theaverage pol II density at the TSS of paused genes (40%) in theadult heart (paused genes cutoff (pausing index): TSS/in-gene � 6.2, which is the average TSS/in-gene for all genes)compared with their neonatal and TAC counterparts. Notably,TAC-induced hypertrophy recapitulates postnatal cardiacgrowth.Anti-Pol II and Anti-H3K9ac ChIP-Seq in the Neonatal,
Adult, and TAC Hearts Reveal Four Distinct TranscriptionalPatterns—According to the patterns of pol II binding andH3K9acmodification at theTSS (promoter-proximal), in-gene,and downstream regions that were observed in the neonataland TAC hearts versus the adult heart, we could categorizetranscriptional regulation during cardiac growth into four dis-
tinct groups. The upper graphs in Fig. 2 (Fig. 2, a, c, e, and g)show the log2 values of the average pol II (P) and theH3K9ac (A)densities of TAC/adult (T/A) and of neonatal/adult (N/A) inthe promoter (Pr), in-gene (I), and downstream (D) regions.The lower graphs (Fig. 2, a, c, e, and g) represent the average polII andH3K9ac densities in the same regions. Fig. 2, b, d, f, and h,shows Integrated Genome Browser (IGB) images of two repre-sentative genes from each of the transcriptional patternsdescribed in each group (Fig. 2, b, d, f, and h). The most preva-lent, as noted in Fig. 1, is a group of genes that exhibit lower TSSpol II during neonatal or TAC-induced growth versus adult(log2 PrP T/A or N/A �0) and a consistent, albeit modest(�10%), increase in H3K9ac (log2 PrA T/A or N/A �0), whichare associated with an incremental increase in the downstreampol II (log2 DP T/A or N/A �0, Fig. 2a). This characterizesgenes that are exhibiting synchronous and incrementalincreases in promoter clearance of pol II (26.7 and 17.8% of theTAC and neonatal genes, respectively, Fig. 2i), and which fallmainly in the category of essential/housekeeping genes (e.g.aminoacyl-tRNAbiosynthesis and ubiquitin-mediated proteol-ysis, Table 1 and supplemental Tables 1S and 2S and Figs. 2Sand 3S). Notably, there were few differences between the neo-natal and TAC-induced growth in this functional group ofgenes. Shown as examples for this group are the IGB images forpinin (Pnn) and voltage-dependent anion channel 1 (Vdac1,Fig. 2b).The second group of regulated genes also exhibits a reduc-
tion in TSS pol II during neonatal or TAC-induced growth ver-sus adult (log2 PrP T/A or N/A �0) associated with an increasein the downstream pol II (log2 DPT/A orN/A�0) andH3K9ac(log2 PrA T/A or N/A �0) (Fig. 2c). Superimposed on thesefeatures, the group exhibits an increase in the in-gene pol II�1.6� (log2 IP T/A or N/A �0.75). This characterizes genesthat are exhibiting an increase in pol II promoter clearancecombinedwithde novopol II recruitment (3.3 and 3.5%of the ofthe TAC and neonatal genes, respectively, Fig. 2i). Functionalpathways representing this category include cancer signalingand fatty acid metabolism pathways (Database for Annotation,Visualization, and Integrated Discovery (DAVID), supplemen-tal Tables 1S–4S and Fig. 4S–6S). Shown as examples for thisgroup are the IGB images forT-box protein 20 (Tbx20) andWDrepeat 1 (Wrd1) genes (Fig. 2d).The third category of growth-regulated genes is character-
ized by a uniform increase in pol II throughout a gene (log2 PrP,IP, and DP T/A or N/A �0.75) accompanied by an increase inH3K9 acetylation (log2 PrA and IA T/A or N/A �0) in the TSSand in-gene (Fig. 2e). This group does not exhibit pol II pausingat the TSS and is, thus, strictly regulated by de novo recruitmentof pol II (3.5% and 2.6% of TAC and neonatal genes, respec-tively, Fig. 2i). Functional pathways representing this categoryinclude cardiomyopathy and extracellular matrix proteins(Table 2 and supplemental Tables 5S and 6S and Figs. 7S–9S).Shown as examples for this group are the IGB images forankyrin repeat domain 1 (Ankrd1), B-type natriuretic peptide(Nppb), and atrial natriuretic peptide (Nppa, Fig. 2f).The functional pathways listed in Table 2 include two of the
major differences known between postnatal hypertrophicgrowth and TAC-induced pathological hypertrophy. These
RNA Polymerase II Pausing Regulates Cardiac Hypertrophy
JANUARY 25, 2013 • VOLUME 288 • NUMBER 4 JOURNAL OF BIOLOGICAL CHEMISTRY 2549
by guest on April 4, 2019
http://ww
w.jbc.org/
Dow
nloaded from

include genes involved in extracellularmatrix-receptor interac-tion, and chemokine signaling and systemic lupus erythemato-sis (an autoimmune disease) pathways that are involved inpathological hypertrophy, which contribute to the contractiledysfunction that eventually ensues in these hearts (8, 19, 20).Some of these genes, including collagen (col1a1, col1a2, and
col3a1), cyclooxygenase 2 (PTGS2), and chemokine (C-Cmotif) ligand 12 (Ccl12), are shown in supplemental Fig. 13S. Inaddition to these functional categories, other differencesinclude some sarcomeric and cytoskeletal genes, such as skele-tal �-actin (Acta1, Fig. 13S) (21) and Xirp2 (22) (cardiomyopa-thy-associated protein 3, Fig. 2).
RNA Polymerase II Pausing Regulates Cardiac Hypertrophy
2550 JOURNAL OF BIOLOGICAL CHEMISTRY VOLUME 288 • NUMBER 4 • JANUARY 25, 2013
by guest on April 4, 2019
http://ww
w.jbc.org/
Dow
nloaded from

The fourth category of growth-regulated genes is character-ized by a decrease in pol II throughout a gene (log2 PrP, IP, andDP T/A or N/A �0.75), accompanied by a decrease in H3K9acetylation (log2 PrA and IA T/A or N/A �0) in the TSS andin-gene (Fig. 2g). This group is, thus, regulated by inhibition ofpol II recruitment and includes 2.6 and 15% of TAC and neo-natal genes, respectively (Fig. 2i). Functional pathways repre-senting this category include drug and xenobiotics metabolismpathways (DAVID, supplemental Tables 7S and 8S and Figs.10S–12S). Shown as examples for this group are the IGB imagesfor flavo-containing monooxygenase (FMO) 1 and 2 and Bcl2/adenovirus E1B 19-kDa-interacting protein 3 (Bnip3, Fig. 2h).Quantitative PCR andWestern blotting (Fig. 2, j and k) confirmthat these four groups of RNApol II-binding andH3K9acmod-ification result in either incremental increases (30–50%, group
1), robust increases (1.6–20-fold, groups 2 and 3), or decreases(40–90%, group 4) in gene expression.We also noted other important regulatory features in the
ChIP-Seq data. First, H3K9 acetylation is not restricted to pro-moters and enhancers as currently perceived and as observed inour data at TSSs that exhibit pol II pausing (Fig. 2b), but is alsopresent in the in-gene region of genes regulated via de novo polII recruitment (Fig. 2f). Second, although the extent of changein H3K9ac positively correlates with the extent of change intranscriptional activity, the absolute levels of H3K9ac do notcorrelate with the absolute levels of pol II bound at the pro-moter. For example, in Fig. 2b, promoter-bound pol IIdecreases while promoter H3K9ac increases, as the down-stream pol II and mRNA increase, indicative of reduced pol IIpausing versus reduced transcription. This contrasts with genes
FIGURE 2. Pol II and H3K9ac ChIP-Seq in the neonatal, adult, and TAC hearts reveal four distinct transcriptional patterns. Pol II (P)- and H3K9ac(A)-positive genes were grouped into four categories, and the log2 values of TAC/adult (T/A) and neonatal/adult (N/A) of the pol II in promoter proximal (PrP,�300 to �300), the in-gene (IP, �300 to end), and the downstream (DP, end to �5000), and of the H3K9ac in promoter proximal (PrA, �1000 to �1000), thein-gene (IA, �1000 to end) region, were plotted. a, upper, plot of average log2 values of average pol II or H3K9ac densities of T/A or N/A in the different generegions, of a group of genes with log2 of T/A or N/A average densities at the promoter region which is �0 for pol II and �0 for H3K9ac. a, lower, plot of theaverage densities for the same sample. b, d, f, and h, binary analysis results files of the data viewed in an Affimetrix IGB, which shows the fragments densities ofpol II and H3K9ac (y axis) aligned in 32-nucleotide bins along the coordinates (x axis) for the individual genes listed. c, upper, plot of average log2 values ofaverage pol II or H3K9ac densities of T/A or N/A in the different gene regions, of a group of genes with log2 of T/A or N/A average pol II densities which is �0at the promoter region and �0.75 in the in-gene. c, lower, plot of the average densities for the same sample. e, upper, plot of average log2 values of average polII or H3K9ac densities of T/A or N/A in the different gene regions, of a group of genes with log2 of T/A or N/A average pol II which is �0.75 in-gene. e, lower, plotof the average densities for the same sample. g, upper, plot of average log2 values of average pol II or H3K9ac densities of T/A or N/A in the different generegions, of a group of genes with log2 of T/A or N/A average pol II which is less than �0.75 in-gene. g, lower, plot of the average densities for the same sample.i, bar graph showing the percentage of genes that are present in each of the four groups (a– d) listed above. j, mRNA extracted from 12-week-old adult, 2-dayneonatal, sham, and 4-day TAC mice hearts and analyzed by qPCR. The fold change in the values for T/A and N/A were calculated and graphed. Error barsrepresent S.E. *, p � 0.05. k, protein extracted from the same samples as in i and analyzed by Western blotting. Each of the duplicates is an independent sample.
FIGURE 2—continued
RNA Polymerase II Pausing Regulates Cardiac Hypertrophy
JANUARY 25, 2013 • VOLUME 288 • NUMBER 4 JOURNAL OF BIOLOGICAL CHEMISTRY 2551
by guest on April 4, 2019
http://ww
w.jbc.org/
Dow
nloaded from
in Fig. 2h, where reduced promoter-bound pol II is accompa-nied by reduced H3K9ac and mRNA, reflecting reduced pro-moter activity. Third, we also observed that H3K9ac is highestat TSSs with paused pol II relative to promoters that are acti-vated by de novo pol II recruitment (Fig. 2, b versus f). Fourth,the decrease in promoter-paused pol II was widespread andunidirectional during hypertrophic growth, as no genes exhib-ited an increase in pol II pausing. This suggested that this modeof transcriptional regulation is governed by a general factor andnot regulated on a gene-by-gene basis.Genes Regulated via de Novo Pol II Recruitment Are Less
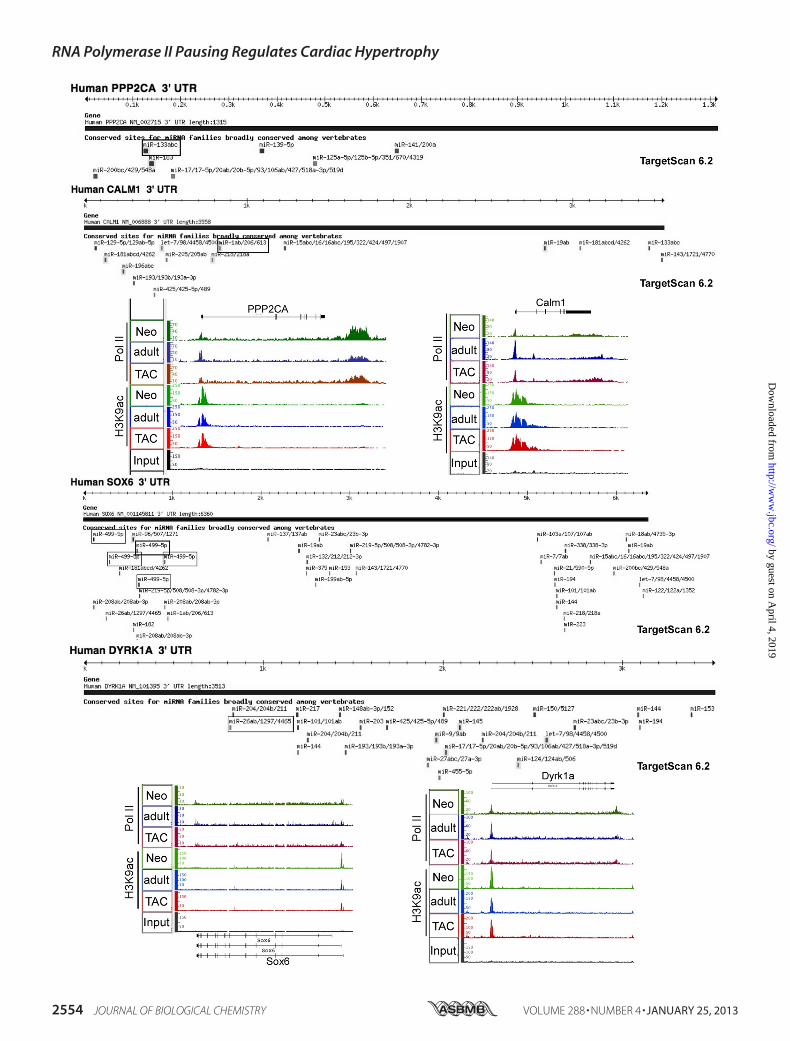
Likely to Be Targeted by miRNA—One of the issues we investi-gated is whether genes that are robustly regulated via increased denovopol II recruitment and increased transcriptionhave any addi-tional requirement for regulation via miRNA. To address that weexamined the3�-UTRof thegenes thatexhibiteda�2.5� increaseinpol II recruitmentduringhypertrophy.Fig.3 shows fourof thosegenes (xirp2, Tnnt2, Tnnc1, and CSRP3) and their 3�-UTRs asdepicted by TargetScan (23–25) after screening for conservedmiRNA sites. As shown, the 3�-UTRs of these genes ranged from0.19 to0.7kbwithnopredictedconservedmiRNAtarget sites (Fig.
3). This feature also applies to the genes displayed in Fig. 2f(Ankrd1,Nppa, andNppb); however, there were a few exceptions(Fig. 3b).This contrastedwithmostof thevalidated targetsofmiR-NAs that have been identified in cardiac hypertrophy. PPP2CA(targeted bymiR-133),Calm1 (targeted bymiR-1), Sox6 (targetedby miR-499), and Dyrk1a (targeted by miR-199a) did not exhibitany de novo pol II recruitment but were regulated by a modestrelease of paused pol II (10–40%) and had 3�-UTRs that rangedfrom 3.5 to 6.3 kb (Fig. 4). We calculated the mean, minimum,maximum, and first and third quartiles of the 3�-UTR lengths forboth groups of genes, which is displayed in a boxplot in Fig. 3b. Ingeneral, thedata suggest that genes that are strongly inducedat thetranscriptional levels are not targeted by miRNA, whereas geneswhose expression is only incrementally regulated by pol II pausingand release are also subject to posttranscriptional fine tuning bymiRNA. In support, the former grouphas relatively short 3�-UTRs(mean, 766; first quartile, � 337; third quartile, 1667) comparedwith themuch longer3�-UTRsofmiRNAtargets (mean,1558; firstquartile, 1203; third quartile, 3653). The data also emphasize thesignificance of posttranscriptional regulation via miRNA.
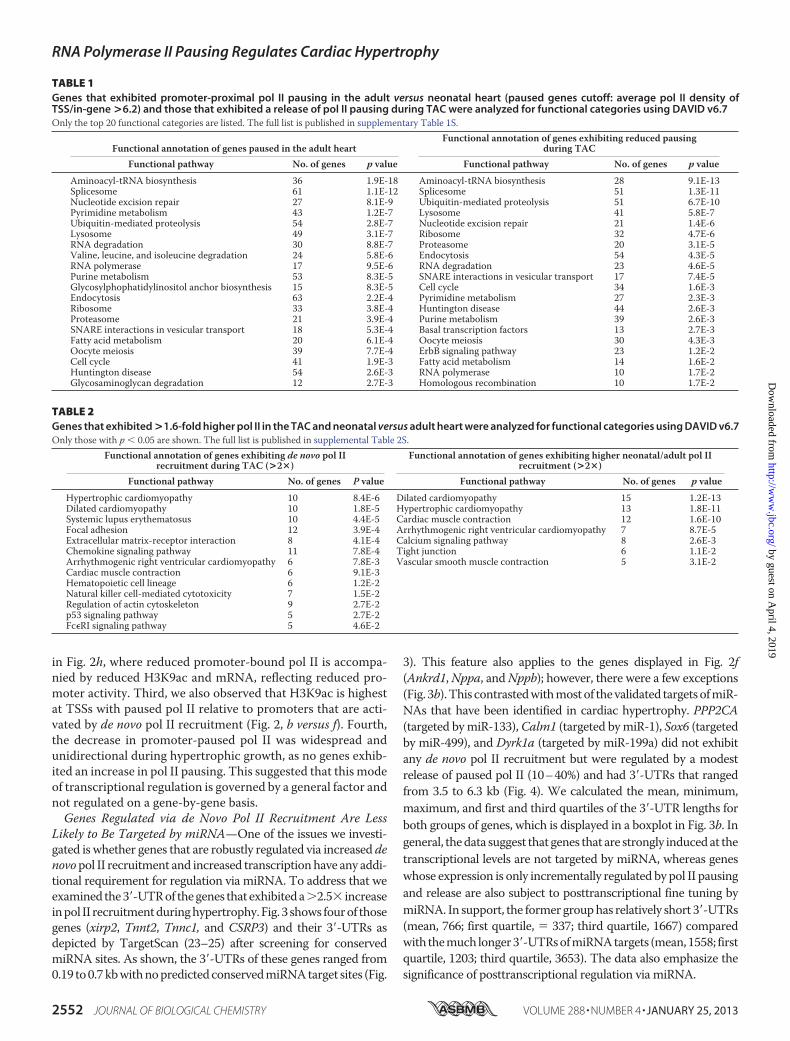
TABLE 1Genes that exhibited promoter-proximal pol II pausing in the adult versus neonatal heart (paused genes cutoff: average pol II density ofTSS/in-gene >6.2) and those that exhibited a release of pol II pausing during TAC were analyzed for functional categories using DAVID v6.7Only the top 20 functional categories are listed. The full list is published in supplementary Table 1S.
Functional annotation of genes paused in the adult heartFunctional annotation of genes exhibiting reduced pausing
during TACFunctional pathway No. of genes p value Functional pathway No. of genes p value
Aminoacyl-tRNA biosynthesis 36 1.9E-18 Aminoacyl-tRNA biosynthesis 28 9.1E-13Splicesome 61 1.1E-12 Splicesome 51 1.3E-11Nucleotide excision repair 27 8.1E-9 Ubiquitin-mediated proteolysis 51 6.7E-10Pyrimidine metabolism 43 1.2E-7 Lysosome 41 5.8E-7Ubiquitin-mediated proteolysis 54 2.8E-7 Nucleotide excision repair 21 1.4E-6Lysosome 49 3.1E-7 Ribosome 32 4.7E-6RNA degradation 30 8.8E-7 Proteasome 20 3.1E-5Valine, leucine, and isoleucine degradation 24 5.8E-6 Endocytosis 54 4.3E-5RNA polymerase 17 9.5E-6 RNA degradation 23 4.6E-5Purine metabolism 53 8.3E-5 SNARE interactions in vesicular transport 17 7.4E-5Glycosylphophatidylinositol anchor biosynthesis 15 8.3E-5 Cell cycle 34 1.6E-3Endocytosis 63 2.2E-4 Pyrimidine metabolism 27 2.3E-3Ribosome 33 3.8E-4 Huntington disease 44 2.6E-3Proteasome 21 3.9E-4 Purine metabolism 39 2.6E-3SNARE interactions in vesicular transport 18 5.3E-4 Basal transcription factors 13 2.7E-3Fatty acid metabolism 20 6.1E-4 Oocyte meiosis 30 4.3E-3Oocyte meiosis 39 7.7E-4 ErbB signaling pathway 23 1.2E-2Cell cycle 41 1.9E-3 Fatty acid metabolism 14 1.6E-2Huntington disease 54 2.6E-3 RNA polymerase 10 1.7E-2Glycosaminoglycan degradation 12 2.7E-3 Homologous recombination 10 1.7E-2
TABLE 2Genes that exhibited >1.6-fold higher pol II in the TAC and neonatal versus adult heart were analyzed for functional categories using DAVID v6.7Only those with p � 0.05 are shown. The full list is published in supplemental Table 2S.
Functional annotation of genes exhibiting de novo pol IIrecruitment during TAC (>2�)
Functional annotation of genes exhibiting higher neonatal/adult pol IIrecruitment (>2�)
Functional pathway No. of genes P value Functional pathway No. of genes p value
Hypertrophic cardiomyopathy 10 8.4E-6 Dilated cardiomyopathy 15 1.2E-13Dilated cardiomyopathy 10 1.8E-5 Hypertrophic cardiomyopathy 13 1.8E-11Systemic lupus erythematosus 10 4.4E-5 Cardiac muscle contraction 12 1.6E-10Focal adhesion 12 3.9E-4 Arrhythmogenic right ventricular cardiomyopathy 7 8.7E-5Extracellular matrix-receptor interaction 8 4.1E-4 Calcium signaling pathway 8 2.6E-3Chemokine signaling pathway 11 7.8E-4 Tight junction 6 1.1E-2Arrhythmogenic right ventricular cardiomyopathy 6 7.8E-3 Vascular smooth muscle contraction 5 3.1E-2Cardiac muscle contraction 6 9.1E-3Hematopoietic cell lineage 6 1.2E-2Natural killer cell-mediated cytotoxicity 7 1.5E-2Regulation of actin cytoskeleton 9 2.7E-2p53 signaling pathway 5 2.7E-2Fc�RI signaling pathway 5 4.6E-2
RNA Polymerase II Pausing Regulates Cardiac Hypertrophy
2552 JOURNAL OF BIOLOGICAL CHEMISTRY VOLUME 288 • NUMBER 4 • JANUARY 25, 2013
by guest on April 4, 2019
http://ww
w.jbc.org/
Dow
nloaded from

Anti-Pol II and Anti-H3K9ac ChIP-Seq in the Neonatal,Adult, and TAC Hearts Identify Transcriptional Units ofmiRNA Genes—We and others have previously identifiedmiRNA in the heart using either microarrays or sequencing
approaches (11). Now, our ChIP-Seq analysis allows us toexamine the transcriptional status of thesemiRNAs during car-diac growth. In addition, it allows us to delineate the transcrip-tional unit of some miRNA genes that remain undefined. The
FIGURE 3. Genes that are regulated by de novo pol II recruitment have shorter 3�-UTR and are less likely to be targeted by miRNA. a, TargetScan-depicted 3�-UTRs of xirp2, Tnnt2, Tnnc1, and CSRP3 screened for highly conserved miRNA targets. The results of the anti-pol II and anti-H3K9ac ChIP-Seq for eachof the genes are displayed by IGB where pol II and H3K9ac fragment density (y axis) is aligned in 32-nucleotide bins along the chromosome coordinate (x axis).b, boxplot of the mean, minimum, maximum, and first and third quartiles of the 3�-UTR lengths of validated miRNA targets in hypertrophy and genes that areregulated by de novo pol II recruitment (� 2.5-fold).
RNA Polymerase II Pausing Regulates Cardiac Hypertrophy
JANUARY 25, 2013 • VOLUME 288 • NUMBER 4 JOURNAL OF BIOLOGICAL CHEMISTRY 2553
by guest on April 4, 2019
http://ww
w.jbc.org/
Dow
nloaded from
RNA Polymerase II Pausing Regulates Cardiac Hypertrophy
2554 JOURNAL OF BIOLOGICAL CHEMISTRY VOLUME 288 • NUMBER 4 • JANUARY 25, 2013
by guest on April 4, 2019
http://ww
w.jbc.org/
Dow
nloaded from
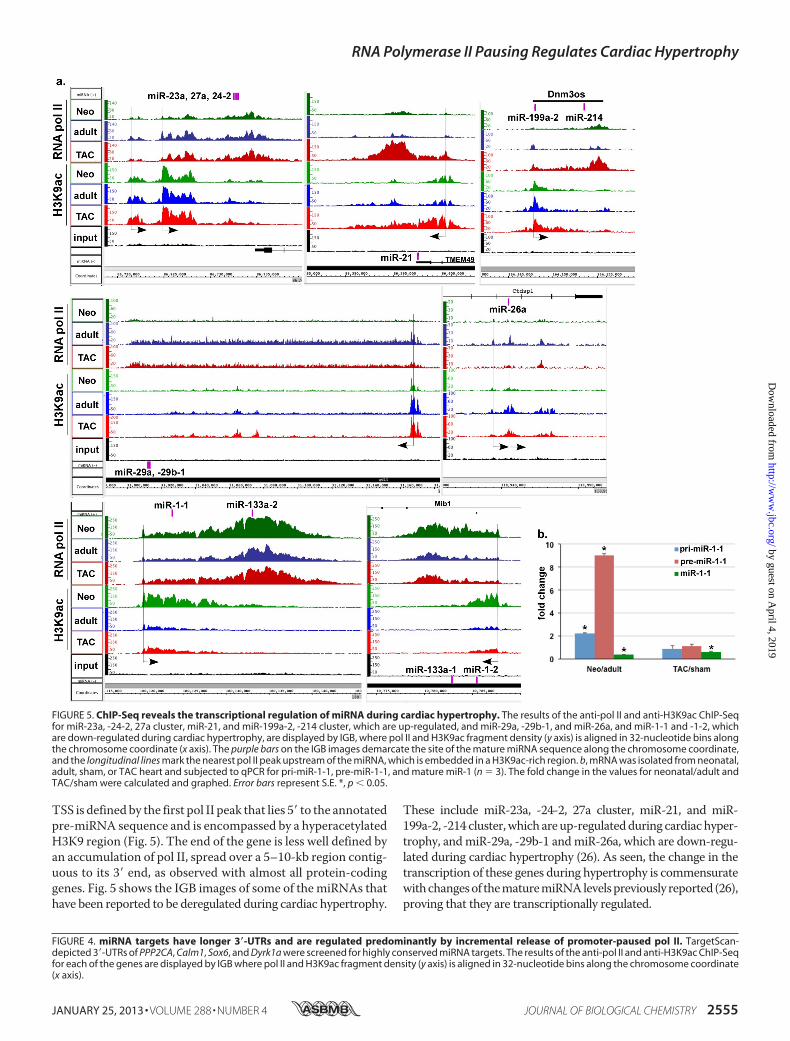
TSS is defined by the first pol II peak that lies 5� to the annotatedpre-miRNA sequence and is encompassed by a hyperacetylatedH3K9 region (Fig. 5). The end of the gene is less well defined byan accumulation of pol II, spread over a 5–10-kb region contig-uous to its 3� end, as observed with almost all protein-codinggenes. Fig. 5 shows the IGB images of some of the miRNAs thathave been reported to be deregulated during cardiac hypertrophy.
These include miR-23a, -24-2, 27a cluster, miR-21, and miR-199a-2, -214 cluster,which areup-regulatedduring cardiachyper-trophy, andmiR-29a, -29b-1 andmiR-26a, which are down-regu-lated during cardiac hypertrophy (26). As seen, the change in thetranscription of these genes during hypertrophy is commensuratewithchangesof thematuremiRNAlevelspreviously reported (26),proving that they are transcriptionally regulated.
FIGURE 4. miRNA targets have longer 3�-UTRs and are regulated predominantly by incremental release of promoter-paused pol II. TargetScan-depicted 3�-UTRs of PPP2CA, Calm1, Sox6, and Dyrk1a were screened for highly conserved miRNA targets. The results of the anti-pol II and anti-H3K9ac ChIP-Seqfor each of the genes are displayed by IGB where pol II and H3K9ac fragment density (y axis) is aligned in 32-nucleotide bins along the chromosome coordinate(x axis).
FIGURE 5. ChIP-Seq reveals the transcriptional regulation of miRNA during cardiac hypertrophy. The results of the anti-pol II and anti-H3K9ac ChIP-Seqfor miR-23a, -24-2, 27a cluster, miR-21, and miR-199a-2, -214 cluster, which are up-regulated, and miR-29a, -29b-1, and miR-26a, and miR-1-1 and -1-2, whichare down-regulated during cardiac hypertrophy, are displayed by IGB, where pol II and H3K9ac fragment density (y axis) is aligned in 32-nucleotide bins alongthe chromosome coordinate (x axis). The purple bars on the IGB images demarcate the site of the mature miRNA sequence along the chromosome coordinate,and the longitudinal lines mark the nearest pol II peak upstream of the miRNA, which is embedded in a H3K9ac-rich region. b, mRNA was isolated from neonatal,adult, sham, or TAC heart and subjected to qPCR for pri-miR-1-1, pre-miR-1-1, and mature miR-1 (n � 3). The fold change in the values for neonatal/adult andTAC/sham were calculated and graphed. Error bars represent S.E. *, p � 0.05.
RNA Polymerase II Pausing Regulates Cardiac Hypertrophy
JANUARY 25, 2013 • VOLUME 288 • NUMBER 4 JOURNAL OF BIOLOGICAL CHEMISTRY 2555
by guest on April 4, 2019
http://ww
w.jbc.org/
Dow
nloaded from

Weand others have also reported lower levels ofmiR-1 in theneonatal versus adult hearts and its down-regulation duringhypertrophy in both mouse and human disease models (27–31). We have also shown that the decrease in miR-1 occursprior to the development of TAC-induced hypertrophy in amouse model, suggesting that it may be posttranscriptionallyregulated (27). Indeed, Rau et al. have recently described theposttranscriptional regulation of miR-1 by MBLN1 and LIN28(32). Interestingly, we show here for the first time that the tran-scription levels of miR-1 are higher in the neonatal versus adulthearts and are slightly increased during hypertrophy, which isthe inverse of what has been reported of the mature miR-1levels (27–31), and which we further confirmed by qPCR usingthe same ChIP-Seq samples (Fig. 5b). This indicates that miR-1is mainly regulated by a posttranscriptional mechanism duringcardiac growth. This is also supportive of the idea that down-regulation of miR-1 is one of the earlier changes during hyper-trophy that occurs prior to the triggering ofmodifications in thetranscriptionalmachinery. Thus, the results uniquely reveal thetranscriptional regulation ofmiRNA and help define their tran-scriptional units. However, it should be noted that assessmentof the transcription of some intragenic miRNA was precludedby the high levels of transcription of the host gene (e.g.miR-208within the myosin genes).
DISCUSSION
This study is the first to demonstrate the full spectrum of thegenes regulated by transcription during cardiac hypertrophy.Most importantly, it reveals distinct modes of transcriptionthat differentially regulate specialized and essential/house-keeping genes. In particular, we showhere that promoter-prox-imal pausing of pol II plays a role in reducing the rate of tran-scription of �25% of expressed genes, which predominantlyinclude essential/housekeeping genes, as postnatal growth ofthe heart transitions into the quiescent adult phenotype and,thence, its reversal upon induction of pressure overload hyper-trophy. It should be noted that in this form of regulation thelevel of pol II associatedwith theTSS, in-gene, and downstreamregions remains relatively constant, as pol II travels from oneend to the other (Fig. 2, a and b). The decrease or increase inpromoter pausing of pol II is paralleled by a reciprocal inversechange in the level of H3K9 acetylation, which is a hallmark ofactive promoters. This is an important independent indicatorthat proves that a decrease in pol II at the TSS is indeed a resultof an equivalent increase in pol II promoter clearance and tran-script elongation. This is further corroborated by the equivalentaccumulation of pol II beyond the 3� gene boundary.RNA pol II ChIP-Seq has its limitations though; while it does
measure the density of pol II that is bound to chromatin, it doesnot assess its activity. So as we observe the increase anddecrease of accumulation of poll II at the TSS during cardiacgrowth and TAC-induced hypertrophy, we have no directmeasurement of its transcript elongation activity. Accordingly,there are two plausible explanations for a reduction in promot-er-paused pol II peaks. First, it may reflect a decrease in pol IIrecruitment, or second, it may be a result of enhanced pol IIelongational activity and reduced pausing. Because of the incre-mental nature of the reduction in pausing and relatively long
interval between the time points used in our experiments(1-day neonatal versus 12-week adult and 12-week adult versus4-day TAC), the changes in in-gene pol II density that wouldresult from an increase in elongational activity were not detect-able. However, what was evident in all genes that exhibited polII pausing at theTSSwas a reduction in the paused peaks duringgrowth, whichwas associatedwith an equivalent increase in polII accumulation immediately downstream of the gene 3�boundary. This supported the idea that a decrease in the pausedpeaks reflects a decrease in pausing versus recruitment of pol II.However, a more direct approach that quantifies transcription-ally active pol II is lacking in this study. We are currentlyattempting to utilize the global run-on sequencing (Gro-Seq)assay that has been developed byCore et al. (33), to quantify polII activity and have a more complete assessment of the tran-scriptional changes that underlie cardiac growth.In general, active promoters are associated with hyperacety-
lation of H3, as well as, hypermethylation of H3K4 (34). In par-ticular, genome-wide analysis shows that H3K4me2 and me3,H3K9ac, and H3K79me2, increase in parallel with pol II that isrecruited to genes, which are induced during differentiation oferythroid progenitors (16). Likewise, Ernst et al. compared his-tone modifications in nine human cells lines, which showedhigher H3K27ac and H3K9ac content in active versus inactive/paused promoter (17). It should be noted, though, that theseactivation markers are not exclusively associated with activepromoters. For example, wherein in human lung fibroblast 99%of active promoters are associated with H3 acetylation and 97%with H3K4 methylation, 95% of pol II-paused promoters and20–30% of inactive promoters were also associated with thesemodifications (35). Similarly, in stem cells it was reported thatH3K4me3 andH3K9,14ac, alongwith pol II, are present inmostactively transcribed or paused protein-coding genes (36). Theresults provide evidence that these modifications are a prereq-uisite for promoter activation; however, they are neitherrestricted to active promoters nor sufficient for pol II recruit-ment. On the other hand, an increase or decrease in the extentof these modifications positively correlates with a change inpromoter activity. Our data are in agreement with these obser-vations, as we find that H3K9ac demarcates promoters with orwithout bound pol II (Fig. 1a and supplemental Figs. 1S and 9S).Conversely, the extent of change in the level of this modifica-tion positively correlates with the change in pol II recruitmentor the reduction in pausing (Fig. 2). Noteworthy, one of theunique observations in our ChIP-Seq data is that in some genesH3K9ac modification extended several kilobases beyond thepromoter region, in particular, within genes that exhibited denovo pol II recruitment during TAC (Figs. 2f and 5a). This sug-gests that there are more facets to H3K9ac functionality thanwe currently know.The recent report by Gilchrist et al. suggested that pausing
may function in fine tuning basal gene expression (18). This isindeed what we observed, as widespread pol II pausing in theadult heart is incrementally (10–60%) released during cardiachypertrophy. This mode of transcriptional regulation encom-passes the largest change in gene transcription during normaland pathological hypertrophy alike and included most of thegenes that are critical for the basic normal functionality of the
RNA Polymerase II Pausing Regulates Cardiac Hypertrophy
2556 JOURNAL OF BIOLOGICAL CHEMISTRY VOLUME 288 • NUMBER 4 • JANUARY 25, 2013
by guest on April 4, 2019
http://ww
w.jbc.org/
Dow
nloaded from

cell. Some of these include the genes involved in ubiquitination,DNA excision repair, RNAdegradation, splicing, tRNA biosyn-thesis, and more (Table 1). Important characteristics of thismode of regulation are that (i) it is synchronous, (ii) unidirec-tional, (iii) incremental, (iv) does not require de novo pol IIrecruitment, and (v) is accompanied by an incremental increasein H3K9ac. For the first time these data explain how the essen-tial/housekeeping genes are regulated during hypertrophicgrowth in an incremental fashion that parallels the increase incell size. Because it recapitulates the neonatal pattern, we con-clude that this aspect of cardiac growth is physiological innature and allows the heart to compensate for the increase inworkload.In contrast to our data, in Toll10bDrosophila embryos (2–4 h
after fertilization), pol II promoter pausing was detected in 12%of all genes, enriched for those known to function in develop-ment, whereas genes that are constitutively expressed exhibiteduniform binding of pol II (37). Similarly, inDrosophila S2 cells,RNA pol II pausing was widespread and involved genes thatfunction in development, differentiation, and cell communica-tion (13). In agreement with our data, in situ hybridization ofthe Drosophila embryo revealed two patterns of gene expres-sion, stochastic and synchronous, the latter of which seemed toinvolve the release of promoter-proximal paused pol II at thedorso-ventral patterning genes (15). Pausing has also beenobserved in�4.5% of genes in a human fetal lung fibroblast cellline (35). Our results are the first to showhowwidespread paus-ing at essential/housekeeping genes is dynamically regulatedduring physiological and pathological growth of an organ.Phosphorylation of the pol II C-terminal domain by Cdk9
enhances promoter-proximal clearance of paused pol II (38).Cdk9 function, however, is not required by all genes; but thescope or nature of those that do require it remain undefined.Cdk9 has been known to play critical roles in both cardiachypertrophy and cancer and is, thus, being tested as a therapeu-tic target. During cardiac hypertrophy, Cdk9 activity and pol IIphosphorylation increase, whereas inhibition of Cdk9 sup-presses endothelin-1-induced myocyte hypertrophy (39). Con-versely, overexpression of the cyclin partner, ofCdk9, cyclinT1,in the heart was sufficient for inducing cardiac hypertrophy(39). This suggests that Cdk9 is either involved in the regulationof a major trigger(s) of hypertrophy or that itself increasesglobal cellular gene expression, which underlies the increase incardiacmass.However, until presently, we had no knowledge ofwhich genes in the heart are regulated by pol II pausing/stalling,or when, or their requirement for Cdk9 activity. Our ChIP-Seqresults uncovered, for the first time, that pausing increases inthe adult mouse heart relative to the neonatal and occursmainly at essential/housekeeping genes (Table 1), which con-stitute �40% of the expressed genes. These data, combinedwith our previous report showing that themain regulator of polII elongational activity, Cdk9, is sufficient for inducing cardiachypertrophy, supports the conclusion that the release of pro-moter-paused pol II is a cause rather than an effect ofhypertrophy.In contrast to the modest increases in transcriptional elon-
gation that is tightly regulated through pol II pausing, theChIP-Seq data show that more robust changes in transcription occur
through an increase in de novo pol II recruitment (Fig. 2, group3). This mode of transcriptional regulation is associated with amuch smaller fraction of expressed genes (�5%) that is func-tionally distinct from the former set (Table 2). Interesting, thisgroup appears to have evolved to avoid miRNA targeting viashortening of the 3�-UTR (40). For the first time these findingshighlight the distinction between transcriptional versus post-transcriptional regulation, their influence on the extent ofmod-ulating expression of a gene, and the nature of the genes that areregulated by either mechanism during cardiac hypertrophy.
Acknowledgments—We thank Dr. Junichi Sadoshima, Chairman ofthe Department of Cell Biology and Molecular Medicine, Universityof Medicine and Dentristy of New Jersey, for his support.
REFERENCES1. Cutilletta, A. F., Rudnik, M., and Zak, R. (1978) Muscle and non-muscle
cell RNA polymerase activity during the development of myocardial hy-pertrophy. J. Mol. Cell. Cardiol. 10, 677–687
2. Kamala, J., Mariappan, M., and Rajamanickam, C. (1986) Changes associ-ated with rat heart chromatin during cardiac hypertrophy. Biochem. Int.13, 271–286
3. Abdellatif, M., Packer, S. E., Michael, L. H., Zhang, D., Charng, M. J., andSchneider, M. D. (1998) A Ras-dependent pathway regulates RNA poly-merase II phosphorylation in cardiac myocytes: implications for cardiachypertrophy.Mol. Cell. Biol. 18, 6729–6736
4. Simpson, P. C., Long, C. S., Waspe, L. E., Henrich, C. J., and Ordahl, C. P.(1989) Transcription of early developmental isogenes in cardiac myocytehypertrophy. J. Mol. Cell Cardiol 21, 79–89
5. Feldman, A. M.,Weinberg, E. O., Ray, P. E., and Lorell, B. H. (1993) Selec-tive changes in cardiac gene expression during compensated hypertrophyand the transition to cardiac decompensation in rats with chronic aorticbanding. Circ. Res. 73, 184–192
6. Schneider, M. D., McLellan, W. R., Black, F. M., and Parker, T. G. (1992)Growth factors, growth factor response elements, and the cardiac pheno-type. Basic Res. Cardiol 87, 33–48
7. Paradis, P., MacLellan, W. R., Belaguli, N. S., Schwartz, R. J., and Schnei-der,M.D. (1996) Serum response factormediates AP-1-dependent induc-tion of the skeletal �-actin promoter in ventricular myocytes. J. Biol.Chem. 271, 10827–10833
8. Kong, S. W., Bodyak, N., Yue, P., Liu, Z., Brown, J., Izumo, S., and Kang,P. M. (2005) Genetic expression profiles during physiological and patho-logical cardiac hypertrophy and heart failure in rats. Physiol. Genomics 21,34–42
9. Strøm, C. C., Aplin, M., Ploug, T., Christoffersen, T. E., Langfort, J., Viese,M., Galbo, H., Haunsø, S., and Sheikh, S. P. (2005) Expression profilingreveals differences in metabolic gene expression between exercise-in-duced cardiac effects and maladaptive cardiac hypertrophy. FEBS J. 272,2684–2695
10. Rajan, S., Williams, S. S., Jagatheesan, G., Ahmed, R. P., Fuller-Bicer, G.,Schwartz, A., Aronow, B. J., andWieczorek, D. F. (2006) Microarray anal-ysis of gene expression during early stages of mild and severe cardiachypertrophy. Physiol. Genomics 27, 309–317
11. Sayed, D., and Abdellatif, M. (2011) MicroRNAs in development and dis-ease. Physiol. Rev. 91, 827–887
12. Nechaev, S., and Adelman, K. (2008) Promoter-proximal pol II: whenstalling speeds things up. Cell Cycle 7, 1539–1544
13. Muse, G. W., Gilchrist, D. A., Nechaev, S., Shah, R., Parker, J. S., Grissom,S. F., Zeitlinger, J., and Adelman, K. (2007) RNA polymerase is poised foractivation across the genome. Nat. Genet. 39, 1507–1511
14. Core, L. J., and Lis, J. T. (2008) Transcription regulation through promot-er-proximal pausing of RNA polymerase II. Science 319, 1791–1792
15. Boettiger, A. N., and Levine, M. (2009) Synchronous and stochastic pat-terns of gene activation in the Drosophila embryo. Science 325, 471–473
RNA Polymerase II Pausing Regulates Cardiac Hypertrophy
JANUARY 25, 2013 • VOLUME 288 • NUMBER 4 JOURNAL OF BIOLOGICAL CHEMISTRY 2557
by guest on April 4, 2019
http://ww
w.jbc.org/
Dow
nloaded from
16. Wong, P., Hattangadi, S.M., Cheng, A.W., Frampton, G.M., Young, R. A.,and Lodish, H. F. (2011) Gene induction and repression during terminalerythropoiesis are mediated by distinct epigenetic changes. Blood 118,e128–138
17. Ernst, J., Kheradpour, P., Mikkelsen, T. S., Shoresh, N., Ward, L. D., Ep-stein, C. B., Zhang, X.,Wang, L., Issner, R., Coyne,M., Ku,M., Durham, T.,Kellis, M., and Bernstein, B. E. (2011) Mapping and analysis of chromatinstate dynamics in nine human cell types. Nature 473, 43–49
18. Gilchrist, D. A., Dos Santos, G., Fargo, D. C., Xie, B., Gao, Y., Li, L., andAdelman, K. (2010) Pausing of RNA polymerase II disrupts DNA-speci-fied nucleosome organization to enable precise gene regulation. Cell 143,540–551
19. Carey, R. A., Natarjan, G., Bove, A. A., Santamore, W. P., and Spann, J. F.(1980) Elevated collagen content in volume overload induced cardiac hy-pertrophy. J. Mol. Cell. Cardiol. 12, 929–936
20. Kania, G., Blyszczuk, P., and Eriksson, U. (2009) Mechanisms of cardiacfibrosis in inflammatory heart disease. Trends Cardiovasc. Med. 19,247–252
21. Schwartz, K., de la Bastie, D., Bouveret, P., Oliviéro, P., Alonso, S., andBuckingham, M. (1986) �-Skeletal muscle actin mRNAs accumulate inhypertrophied adult rat hearts. Circ. Res. 59, 551–555
22. McCalmon, S. A., Desjardins, D. M., Ahmad, S., Davidoff, K. S., Snyder,C. M., Sato, K., Ohashi, K., Kielbasa, O. M., Mathew, M., Ewen, E. P.,Walsh, K., Gavras, H., and Naya, F. J. (2010) Modulation of angiotensinII-mediated cardiac remodeling by the MEF2A target gene Xirp2. Circ.Res. 106, 952–960
23. Lewis, B. P., Burge, C. B., and Bartel, D. P. (2005) Conserved seed pairing,often flanked by adenosines, indicates that thousands of human genes aremicroRNA targets. Cell 120, 15–20
24. Grimson, A., Farh, K. K., Johnston, W. K., Garrett-Engele, P., Lim, L. P.,and Bartel, D. P. (2007) MicroRNA targeting specificity in mammals: de-terminants beyond seed pairing.Mol. Cell 27, 91–105
25. Friedman, R. C., Farh, K. K., Burge, C. B., and Bartel, D. P. (2009) Mostmammalian mRNAs are conserved targets of microRNAs. Genome Res.19, 92–105
26. Abdellatif, M. (2012) Differential expression of microRNAs in differentdisease states. Circ. Res. 110, 638–650
27. Sayed, D., Hong, C., Chen, I. Y., Lypowy, J., and Abdellatif, M. (2007)MicroRNAs play an essential role in the development of cardiac hypertro-phy. Circ. Res. 100, 416–424
28. Ikeda, S., He,A., Kong, S.W., Lu, J., Bejar, R., Bodyak,N., Lee, K.H.,Ma,Q.,Kang, P. M., Golub, T. R., and Pu, W. T. (2009) MicroRNA-1 negativelyregulates expression of the hypertrophy-associated calmodulin andMef2agenes.Mol. Cell. Biol. 29, 2193–2204
29. Carè, A., Catalucci, D., Felicetti, F., Bonci, D., Addario, A., Gallo, P., Bang,
M. L., Segnalini, P., Gu, Y., Dalton, N. D., Elia, L., Latronico,M. V., Høydal,M., Autore, C., Russo,M.A., Dorn,G.W., 2nd, Ellingsen,O., Ruiz-Lozano,P., Peterson, K. L., Croce, C. M., Peschle, C., and Condorelli, G. (2007)MicroRNA-133 controls cardiac hypertrophy. Nat. Med. 13, 613–618
30. Elia, L., Contu, R., Quintavalle,M., Varrone, F., Chimenti, C., Russo,M.A.,Cimino, V., De Marinis, L., Frustaci, A., Catalucci, D., and Condorelli, G.(2009) Reciprocal regulation of microRNA-1 and insulin-like growth fac-tor-1 signal transduction cascade in cardiac and skeletal muscle in physi-ological and pathological conditions. Circulation 120, 2377–2385
31. Ikeda, S., Kong, S. W., Lu, J., Bisping, E., Zhang, H., Allen, P. D., Golub,T. R., Pieske, B., and Pu, W. T. (2007) Altered microRNA expression inhuman heart disease. Physiol. Genomics 31, 367–373
32. Rau, F., Freyermuth, F., Fugier, C., Villemin, J. P., Fischer, M. C., Jost, B.,Dembele, D., Gourdon, G., Nicole, A., Duboc, D., Wahbi, K., Day, J. W.,Fujimura, H., Takahashi, M. P., Auboeuf, D., Dreumont, N., Furling, D.,and Charlet-Berguerand, N. (2011) Misregulation of miR-1 processing isassociated with heart defects in myotonic dystrophy. Nat. Struct. Mol.Biol. 18, 840–845
33. Core, L. J., Waterfall, J. J., and Lis, J. T. (2008) Nascent RNA sequencingreveals widespread pausing and divergent initiation at human promoters.Science 322, 1845–1848
34. Schübeler, D., MacAlpine, D. M., Scalzo, D., Wirbelauer, C., Kooperberg,C., van Leeuwen, F., Gottschling, D. E., O’Neill, L. P., Turner, B. M., Del-row, J., Bell, S. P., and Groudine, M. (2004) The histone modificationpattern of active genes revealed through genome-wide chromatin analysisof a higher eukaryote. Genes Dev. 18, 1263–1271
35. Kim, T. H., Barrera, L. O., Zheng, M., Qu, C., Singer, M. A., Richmond,T. A., Wu, Y., Green, R. D., and Ren, B. (2005) A high-resolution map ofactive promoters in the human genome. Nature 436, 876–880
36. Guenther, M. G., Levine, S. S., Boyer, L. A., Jaenisch, R., and Young, R. A.(2007) A chromatin landmark and transcription initiation at most pro-moters in human cells. Cell 130, 77–88
37. Zeitlinger, J., Stark, A., Kellis, M., Hong, J. W., Nechaev, S., Adelman, K.,Levine, M., and Young, R. A. (2007) RNA polymerase stalling at develop-mental control genes in theDrosophila melanogaster embryo.Nat. Genet.39, 1512–1516
38. Lis, J. T., Mason, P., Peng, J., Price, D. H., and Werner, J. (2000) P-TEFbkinase recruitment and function at heat shock loci. Genes Dev. 14,792–803
39. Sano, M., and Schneider, M. D. (2004) Cyclin-dependent kinase-9: anRNAPII kinase at the nexus of cardiac growth and death cascades. Circ.Res. 95, 867–876
40. Bartel, D. P. (2009) MicroRNAs: target recognition and regulatory func-tions. Cell 136, 215–233
RNA Polymerase II Pausing Regulates Cardiac Hypertrophy
2558 JOURNAL OF BIOLOGICAL CHEMISTRY VOLUME 288 • NUMBER 4 • JANUARY 25, 2013
by guest on April 4, 2019
http://ww
w.jbc.org/
Dow
nloaded from
Danish Sayed, Minzhen He, Zhi Yang, Lin Lin and Maha AbdellatifImmunoprecipitation during Cardiac Hypertrophy
Transcriptional Regulation Patterns Revealed by High Resolution Chromatin
doi: 10.1074/jbc.M112.429449 originally published online December 10, 20122013, 288:2546-2558.J. Biol. Chem.
10.1074/jbc.M112.429449Access the most updated version of this article at doi:
Alerts:
When a correction for this article is posted•
When this article is cited•
to choose from all of JBC's e-mail alertsClick here
Supplemental material:
http://www.jbc.org/content/suppl/2012/12/10/M112.429449.DC1
http://www.jbc.org/content/288/4/2546.full.html#ref-list-1
This article cites 40 references, 17 of which can be accessed free at
by guest on April 4, 2019
http://ww
w.jbc.org/
Dow
nloaded from


![[VI]. Post-Transcriptional Processing and Post-Transcriptional Control of Gene Expression](https://static.fdocuments.us/doc/165x107/56815a87550346895dc7f921/vi-post-transcriptional-processing-and-post-transcriptional-control-of-gene.jpg)