Transcription of the human plasma prekallikrein gene ... · and to the protein level. Therefore, as...
145
Lehrstuhl für Organische Chemie und Biochemie der Technischen Universität München Transcription of the human plasma prekallikrein gene: demonstration of alternative promoters, multiple initiation sites, and alternative splicing and identification of cis-acting DNA elements Viktoryia Sidarovich Vollständiger Abdruck der von der Fakultät für Chemie der Technischen Universität München zur Erlangung des akademischen Grades eines Doktors der Naturwissenschaften genehmigten Dissertation. Vorsitzende: Univ.-Prof. Dr. S. Weinkauf Prüfer der Dissertation: 1. Univ.-Prof. Dr. Dr. A. Bacher, i.R. 2. Univ.-Prof. Dr. E. Fink, Ludwig-Maximilians-Universität München 3. Univ.-Prof. Dr. M. Groll Die Dissertation wurde am 21.02.2008 bei der Technischen Universität München eingereicht und durch die Fakultät für Chemie am 07.05.2008 angenommen.
Transcript of Transcription of the human plasma prekallikrein gene ... · and to the protein level. Therefore, as...

Lehrstuhl für Organische Chemie und Biochemie
der Technischen Universität München
Transcription of the human plasma prekallikrein gene:
demonstration of alternative promoters,
multiple initiation sites, and alternative splicing
and identification of cis-acting DNA elements
Viktoryia Sidarovich
Vollständiger Abdruck der von der Fakultät für Chemie der Technischen Universität München
zur Erlangung des akademischen Grades eines
Doktors der Naturwissenschaften genehmigten Dissertation.
Vorsitzende: Univ.-Prof. Dr. S. Weinkauf
Prüfer der Dissertation: 1. Univ.-Prof. Dr. Dr. A. Bacher, i.R.
2. Univ.-Prof. Dr. E. Fink,
Ludwig-Maximilians-Universität München
3. Univ.-Prof. Dr. M. Groll
Die Dissertation wurde am 21.02.2008 bei der Technischen Universität München eingereicht und
durch die Fakultät für Chemie am 07.05.2008 angenommen.

����

Dedicated to mum and Andrei


CONTENTS i
CONTENTS
Abbreviations...........................................................................................................................v
A SUMMARY.............................................................................................................................1
B INTRODUCTION ...................................................................................................................8
B.1 The plasma kallikrein in the kallikrein-kinin cascade....................................................8
B.1.1 The kallikrein-kinin system................................................................................8
B.1.2 Properties of plasma kallikrein.........................................................................10
B.1.3 Sites of synthesis of plasma prekallikrein ........................................................11
B.1.4 Activation of the plasma prekallikrein .............................................................11
B.1.5 Biological functions .........................................................................................12
B.1.6 Involvement in pathologic disorders ................................................................14
B.1.7 Plasma kallikrein inhibitors for therapeutic use ...............................................15
B.2 Insights into the transcriptional control network..........................................................15
B.2.1 Transcription initiation by RNA polymerase II ...............................................16
B.2.1.1 The general transcription machinery ................................................16
B.2.1.2 Core promoter architecture ...............................................................16
B.2.2 Regulatory promoters and enhancers ...............................................................18
B.2.3 Chromatin structure in transcriptional control .................................................19
B.2.4 Regulatory proteins ..........................................................................................19
B.3 Aims of the work..........................................................................................................20
C MATERIALS AND METHODS ..........................................................................................23
C.1 Materials.......................................................................................................................23
C.1.1 Equipment ........................................................................................................23
C.1.2 Chemicals and materials...................................................................................24
C.1.3 Strains and cell lines.........................................................................................26
C.1.3.1 E. coli strains.....................................................................................26
C.1.3.2 Mammalian cell lines........................................................................27
C.1.4 Vectors..............................................................................................................28
C.1.4.1 pSEAP2-Basic ..................................................................................28
C.1.4.2 pSEAP2-Control ...............................................................................28
C.1.4.3 pCR4-TOPO vector ..........................................................................29
C.1.4.4 Flp-In expression system ..................................................................31
C.1.4.5 NF1 expression vectors.....................................................................33
C.1.5 Computer programs..........................................................................................33

CONTENTS ii
C.2 Methods........................................................................................................................ 34
C.2.1 Molecular biological methods.......................................................................... 34
C.2.1.1 Polymerase chain reaction ................................................................ 34
C.2.1.2 Design of PPK promoter constructs ................................................. 34
C.2.1.3 Amplification of novel exons in the 5'-UTR of the human PPK gene .................................................................................................. 39
C.2.1.4 Site-directed mutagenesis ................................................................. 40
C.2.1.5 DNA cleavage with restriction endonucleases ................................. 43
C.2.1.6 Agarose gel electrophoresis.............................................................. 44
C.2.1.7 Extraction of DNA fragments from low-melting agarose gel .......... 44
C.2.1.8 Ligation of DNA fragments.............................................................. 45
C.2.1.9 TOPO TA cloning system ................................................................ 45
C.2.1.10 Preparation of E. coli competent cells .............................................. 45
C.2.1.11 Culture of E. coli strains ................................................................... 45
C.2.1.12 Transformation of E. coli.................................................................. 46
C.2.1.13 PCR screening of E. coli clones ....................................................... 46
C.2.1.14 Plasmid preparation from E. coli ...................................................... 47
C.2.1.15 Determination of DNA and RNA concentration .............................. 47
C.2.2 Cell culture methods ........................................................................................ 48
C.2.2.1 Culture of mammalian cells.............................................................. 48
C.2.2.2 Cell freezing and thawing................................................................. 48
C.2.2.3 Transient transfection of cells........................................................... 49
C.2.2.4 Stable transfection of HEK-293 cells ............................................... 49
C.2.2.5 siRNA transfection of HepG2 cells .................................................. 50
C.2.3 Chemiluminescent assays ................................................................................ 50
C.2.3.1 SEAP assay....................................................................................... 50
C.2.3.2 Luminescent �-galactosidase assay .................................................. 51
C.2.4 Isolation of total RNA...................................................................................... 52
C.2.5 cDNA synthesis................................................................................................ 52
C.2.6 RNA ligase-mediated amplification of 5'-cDNA ends (RLM-RACE) ............ 53
C.2.7 Quantitative real-time PCR.............................................................................. 56
C.2.8 DNA pull-down method................................................................................... 59
C.2.8.1 Preparation of DNA affinity beads ................................................... 59
C.2.8.2 Purification of transcription factors by DNA affinity beads ............ 60
C.2.9 TranSignal Protein/DNA Array ....................................................................... 61

CONTENTS iii
C.2.10 Electrophoretic mobility shift assay .................................................................62
C.2.10.1 Nuclear extract preparation...............................................................62
C.2.10.2 Preparation of radiolabeled DNA probes..........................................63
C.2.10.3 Protein-DNA binding reaction and electrophoresis of protein-DNA complexes ...................................................................66
C.2.11 Chromatin immunoprecipitation ......................................................................67
C.2.12 Western blotting ...............................................................................................69
C.2.13 Bioinformatic tools...........................................................................................70
D Utilization of multiple transcription start sites and alternative promoters for the PPK gene expression............................................................................................................71
D.1 RESULTS.....................................................................................................................71
D.1.1 Identification of two distal exons and splice variants of the human PPK gene ..........................................................................................................71
D.1.2 The human PPK gene utilizes transcription initiation sites analogous to mouse and vice versa....................................................................................74
D.1.3 Identification of alternative promoters for the human PPK gene.....................76
D.2 DISCUSSION ..............................................................................................................79
E Role of the nuclear factor 1 transcription factor for the expression of the human PPK gene....................................................................................................................84
E.1 RESULTS.....................................................................................................................84
E.1.1 Site-directed mutagenesis of the Prox promoter delineates three regions of critical cis-acting elements ..............................................................84
E.1.2 Multiple DNA-binding proteins interact with regions 1 and 3 of the basic control region ................................................................................85
E.1.3 Nuclear factor 1 binds in vitro and in vivo to the region 2 of critical cis-acting elements of the Prox promoter ............................................87
E.1.4 NF1-B expression elevates the level of human PPK mRNA ...........................90
E.1.5 NF1-C and NF1-X are involved in negative and positive regulation of the human PPK gene expression.................................................91
E.2 DISCUSSION ..............................................................................................................93
F Identification of a 13-bp segment at the 3'-end of intron 1 of the human PPK gene that causes recruitment of alternative promoters ...................................................................99
F.1 RESULTS.....................................................................................................................99
F.1.1 E1i1E2 causes TSS displacement in HepG2 and IHKE1 cells ........................99
F.1.2 The proximal upstream region of the PPK gene does not prevent the TSS displacing effect................................................................................100
F.1.3 The TSS displacement effect is also observed in stably transfected cells......101

CONTENTS iv
F.1.4 Deletion-mutation analysis defined a minimal sequence with transcriptional and TSS displacing activity.................................................... 105
F.1.5 Identification of critical basepairs of the 13-bp segment ............................... 108
F.2 DISCUSSION ............................................................................................................ 109
G OUTLOOK.......................................................................................................................... 111
H APPENDIX ......................................................................................................................... 112
H.1 The importance of examining the plasmid DNA quality in promoter studies ........... 112
H.2 Inadequacy of a protein/DNA array analysis for identification of transcription factors binding to a promoter region of interest......................................................... 115
I REFERENCES.................................................................................................................... 120
ACKNOWLEDGEMENTS........................................................................................................ 132
CURRICULUM VITAE............................................................................................................. 134
LIST OF PUBLICATIONS AND PRESENTATIONS.............................................................. 135

ABBREVIATIONS v
ABBREVIATIONS
AP4 activator protein 4
BK bradykinin
BSA bovine serum albumin
CAGE cap-analysis gene expression
ChIP chromatin immunoprecipitation
CIP calf intestinal phosphatase
CMV cytomegalovirus
DMSO dimethylsulfoxid
E4BP4 E4 binding protein 4
EB elution buffer
EMSA electrophoretic mobility shift assay
ENCODE encyclopedia of DNA Elements
FXII(a) coagulation factor XII (activated)
FCS fetal calf serum
FRT Flp recombinase target
GAPDH glyceraldehyde-3-phosphate dehydrogenase
HA hemagglutinin
HEK cells human embryonic kidney cells
HK high molecular weight kininogen
HRP horse radish peroxidase
HSP90 heat shock protein 90
IHKE cells immortalized human kidney epithelial cells
Inr initiator
LCR locus control region
LNA locked nucleic acid
MCS multiple cloning site
NF1 nuclear factor 1
NFY nuclear factor Y
NKXH Nkx-homeodomain family
ORF open reading frame
PBS phosphate buffered saline
PCR polymerase chain reaction
PIC preinitiation complex

ABBREVIATIONS vi
PK plasma kallikrein
PPK (h/m) plasma prekallikrein (human/mouse)
PRCP prolylcarboxypeptidase
RLM-RACE RNA ligase-mediated amplification of 5'-cDNA ends
RNApolII RNA polymerase II
RT room temperature
SDS-PAGE sodium dodecyl sulfate polyacrylamide gel electrophoresis
SEAP secreted form of the placental alkaline phosphatase
siRNA small interfering RNA
SV simian virus 40
TAF TBP-associated factor
TAP tobacco acid pyrophosphatase
TB transcription blocker
TBP TATA-binding protein
TF transcription factor
TGIF thymine guanine interacting factor
TSS transcription start site
UTR untranslated region

A SUMMARY 1
A SUMMARY
The gene KLKB1 encodes the zymogen plasma prekallikrein (PPK) which is synthesized as a
single chain glycoprotein in hepatocytes and secreted into the blood where its activated form, the
protease plasma kallikrein (PK), participates in the surface-dependent activation of blood
coagulation, fibrinolysis, kinin generation and inflammation. Recently it was demonstrated that
the PPK gene is transcribed and the PPK protein synthesized not only in the liver, but in non-
hepatic tissues as well. Since PPK in the blood originates essentially or totally from the liver, the
extrahepatically synthesized PPK is believed not to contribute to the PPK plasma pool, but to
have special functions at or near the site of its synthesis. Involvement of PPK in various cellular
events and pathways reported over the last years fits this concept. Therefore, it is reasonable to
conclude that all steps from transcription of the PPK gene to synthesis of the proenzyme and its
activation are under careful temporal and tissue-/cell-specific control. Up to now all
investigations on the control of PPK/PK function have been limited to those in the circulation
and to the protein level. Therefore, as a part of the long-term project to unravel the physiological
and pathophysiological role of the extrahepatically synthesized PPK, the studies for this thesis
focused on the investigation of the molecular mechanisms of the transcriptional control of the
human PPK (hPPK) gene.
At the time when the experimental work was started, comparison of the genomic and mRNA
sequences of the mouse PPK gene had just revealed that the sequence segment formerly
identified as exon 1 consists of three exons (mE1a, mE1b, mE1c), with intervening sequences of
1271 and 11852 bp, respectively. A subsequent alignment of these newly identified first three
mouse exons to human chromosome 4 revealed that also in human a PPK gene transcript might
exist initiating at a distant upstream start site and containing two additional upstream exons with
sequences homologous to mE1a and mE1b. Up to that moment, transcription start sites of the
hPPK gene had been found in liver, pancreas, kidney and testis at or near the position +1 of the
known mRNA (proximal start sites) and, in addition, in kidney and testis within intron 1 and
exon 2 (intronic start sites).
In the studies for this thesis the presence of two distal exons hE1a and hE1b analogous to
mouse was verified by PCR for hPPK mRNA from liver, kidney, and testis (Figure A-1). In
addition, the experiments demonstrated that by alternative splicing of the region between hE1a
and the conventional hE1 transcripts with two to five exons in different combinations and
lengths are produced. Subsequent transcription start determination revealed that transcription of
the PPK gene in human and mouse tissues can be initiated in exon E1a and even further
upstream yielding transcripts with one or two additional exons, E1a-1 and E1a-2 (distal start

A SUMMARY 2
sites). Conversely, also in mouse short transcripts were detected starting with mE1c which is
analogous to human E1 (Figure A-1). In both human and mouse tissues the proximal start sites
were highly preferred over the distal ones.
Figure A-1. Organization of the 5'-region of the human PPK gene. The 5'-upstream region of the hPPK gene is drawn to scale. Boxes represent exons and lines introns. Exons undergoing alternative splicing are against a shaded background. The boxes above the map line represent regions with putative promoter activity.
Altogether, transcription start determination demonstrated that transcription of the hPPK gene
can be initiated not only in the proximal region (Prox), but also in three distal regions (Dist1,
Dist2, Dist3) and the intronic region (E1i1E2) (Figure A-1). Examination of these regions for
promoter activity by reporter-gene analysis in the cell lines HepG2 (hepatocytes) and IHKE1
(kidney epithelial cells) demonstrated the functionality of Prox, E1i1E2 and Dist3. The Prox
promoter showed the highest activity in HepG2, whereas E1i1E2 was most active in IHKE1 cells
indicating a cell-type dependent utilization of these two promoters for the transcription of the
hPPK gene. The Dist3 promoter was active in both cell lines, whereas Dist1 and Dist2 were
inactive.
The Prox promoter being the principal promoter utilized for the hPPK gene transcription in
hepatocytes (primary site of PPK synthesis) was further examined to identify important cis-
acting elements. Screening of the 3'-terminal 150 bp of the Prox promoter by substitution
mutations revealed a series of important control elements. The most critical sequence segments,
namely those resulting in reduction of promoter activity to less than 25 % when mutated, were
grouped to three regions, regions 1, 2, and 3. Examination of the three regions for binding sites
of known transcription factors led to the identification of a TATA-box motive in region 1 and a
binding site for nuclear factor 1 (NF1) in region 2. EMSA experiments with oligonucleotides
encompassing the region 1 rejected however a specific binding of the TATA-box binding protein
to this region indicating that the Prox promoter is TATA-less. In contrast, EMSA experiments
with oligonucleotides encompassing the region 2 demonstrated that NF1 proteins interact with
this region in vitro. Subsequently performed ChIP assays confirmed association of NF1 with the
Prox promoter in vivo. Mammalian NF1 proteins include the NF1-A, NF1-B, NF1-C, and NF1-X
isoforms. Therefore it was investigated by overexpression and downregulation which isoforms

A SUMMARY 3
are important for hPPK gene transcription. Overexpression of NF1-B substantially induced
whereas overexpression of NF1-A and NF1-X led to a slight increase of the hPPK mRNA level,
and NF1-C overexpression had no effect. Down-regulation of NF1 factors by RNA interference
revealed negative and positive contributions of the NF1-C and NF1-X proteins to the expression
of the hPPK gene, respectively. Thus, the highly homologous members of the NF1 family
display functional diversity regarding regulation of the hPPK gene transcription.
In order to study the transcription of the hPPK gene starting with TSSs localized in intron 1
and exon 2 it was envisaged to analyze the putative promoter region E1i1E2. This region,
spanning exon 1, intron 1 and exon 2 of the hPPK gene, showed significant promoter activity in
reporter gene assays. Surprisingly, determination of the transcription start sites (TSSs) recruited
by the E1i1E2 promoter for transcription of the reporter gene revealed that only a small number
of transcripts initiated within the insert, whereas the majority of TSSs was located in the vector
sequence up to about 2000 bp upstream of the insert, indicating that E1i1E2 causes TSS
displacement by recruiting alternative upstream promoters. Deletion of exons 1 and 2 and
progressive 5'-deletions of intron 1 confined both the transcription promoting and TSS
displacement activity of E1i1E2 to the 3'-terminal 13 bp of intron 1. The results demonstrated
that an up to now not described 13-bp cis-acting element can aid TSS displacement/alternative
promoter recruitment.
Taken together, a multitude of transcripts of the human plasma prekallikrein gene is produced
in the various tissues resulting from recruitment of alternative, distantly apart promoters, from a
variation in the initiation sites utilized by each promoter, and from alternative splicing. Such
generation of numerous transcripts of a single gene occurs in the majority of mammalian genes
as has become evident from recent large scale studies. It has been concluded that this
phenomenon reflects the need of fine-tuned temporal and spatial control of the expression of a
gene. Thus, the finding that numerous alternative transcripts of the PPK gene are generated
argues for the concept that plasma kallikrein plays divers functional roles at various
developmental stages and/or in various tissues and cell types. Exploration of the molecular
mechanisms underlying the transcription of the hPPK gene from each of the alternative
promoters and the splicing of the different transcript types will contribute to unraveling the
precise roles of PPK synthesized in the various tissues.

A ZUSAMMENFASSUNG 4
A ZUSAMMENFASSUNG
Das Zymogen Plasmapräkallikrein (PPK), kodiert durch das Gen KLKB1, wird in den
Hepatocyten als einkettiges Glycoprotein synthetisiert und in den Blutkreislauf sezerniert. Im
Blut ist das aktivierte Enzym, die Protease Plasmakallikrein (PK), beteiligt an der Kontakt-
phasenaktivierung der Blutgerinnung, der Fibrinolyse, der Kinin-Freisetzung und an
Entzündungsvorgängen. Vor kurzem wurde gezeigt, dass die Transkription des PPK-Gens und
die Synthese des PPK-Proteins nicht nur in der Leber, sondern auch in nicht-hepatischen
Geweben erfolgen kann. Da das PPK im Blut vorwiegend oder ausschließlich aus der Leber
stammt ist anzunehmen, dass extrahepatisch synthetisiertes PPK nicht zum PPK-Plasmapool
beiträgt, sondern dass es spezielle Funktionen am Synthesort oder in dessen unmittelbaren
Nachbarschaft erfüllt. Die Richtigkeit dieses Konzepts wird unterstützt durch mehrfache
Berichte der letzten Jahre über die Beteiligung des PPK an zellulären Reaktionen und
Reaktionswegen in unterschiedlichen Geweben und Zellen. Demnach ist zu folgern, dass alle
Schritte von der Transkription des Gens bis hin zur Synthese des Zymogens und seiner
Aktivierung einer präzisen zeitlichen und Gewebs- bzw. Zelltyp-spezifischen Kontrolle
unterliegen. Bisher konzentrierten sich die Untersuchungen über die Kontrolle von PPK/PK-
Funktionen vor allem auf die im Blutkreislauf und somit auf die Proteinebene. Als Teil des
langfristigen Projekts, die physiologische und pathophysiologische Funktion des extrahepatisch
gebildeten PPK aufzuklären, sollten daher in der vorliegenden Doktorarbeit die molekularen
Mechanismen der Transkriptionskontrolle des humanen PPK-Gens untersucht werden.
Kurz vor dem Beginn der experimentellen Arbeiten hatte bei der Maus ein Vergleich der
PPK-mRNA-Sequenz mit der genomischen DNA gezeigt, dass der mRNA-Sequenzabschnitt, der
als Exon 1 betrachtet wurde, tatsächlich aus drei Exons (mE1a, mE1b, mE1c) besteht, die durch
Introns von 1271 bp und 11852 bp voneinander getrennt sind. Ein nachfolgender Vergleich der
Sequenzen der drei neu identifizierten PPK-Exons der Maus mit der Sequenz des humanen
Chromosoms 4 hatte zeigte, dass es auch beim Menschen Transkripte mit Transkriptionsstarts
stromauf des bekannten Exons 1 geben könnte, die zwei zusätzliche Exons analog zu E1a und
E1b der Maus enthalten. Bis zu diesem Zeitpunkt waren für humanes PPK (hPPK) nur
Transkriptionsstarts im Bereich der Position +1 der bekannten mRNA identifiziert worden, und
zwar in Leber, Pancreas, Niere und Testis (proximale Startpunkte), außerdem in Niere und Testis
in Intron 1 und in Exon 2 (intronische Startpunkte).
In den Untersuchungen zur vorliegenden Doktorarbeit wurde für hPPK die Existenz zweier
distaler Exons, hE1a und hE1b, analog denen der Maus durch PCR-Experimente mit mRNA aus
Leber, Niere und Testis bestätigt (Abbildung A-1). Zusätzlich zeigten die Experimente, dass

A ZUSAMMENFASSUNG 5
durch alternatives Spleißen der Region zwischen hE1a und dem konventionellen hE1 Transkripte
mit weiteren zwei bis fünf Exons in unterschiedlicher Kombination und Länge entstehen.
Nachfolgende Bestimmung der Transkriptionsstarts in humanem und in Mausgewebe erbrachte,
dass die Transkription des PPK-Gens in Exon E1a und außerdem weiter stromauf initiiert
werden kann, wobei Transkripte mit einem oder zwei weitere Exons, E1a-1 und E1a-2 (distale
Startpunkte) entstehen. Umgekehrt wurden auch bei der Maus verkürzte Transkripte gefunden,
die im Bereich analog dem des menschlichen Exons 1 (Abbildung A-1) beginnen. Bei beiden
Spezies sind die proximalen Transkriptionsstarts gegenüber den distalen stark bevorzugt.
Abbildung A-1. Organisation der 5'-Region des humanen PPK-Gens. Exons sind durch Rechtecke, Introns durch Linien dargestellt. Die Region, in der alternatives Spleißen gefunden wurde, ist hellgrau unterlegt. Dist3, Dist2, Dist1, Prox und E1i1E2 geben die hinsichtlich Promoteraktivität untersuchten Bereiche an. Die Darstellung ist maßstabsgerecht.
Insgesamt zeigten die Bestimmungen der Transkriptionsstarts, dass die Transkription des
hPPK-Gens nicht nur in der proximalen Region (Prox), sondern auch in drei distalen Regionen
(Dist1, Dist2, Dist3) und in einer intronischen Region (E1i1E2) initiiert werden kann (Abbildung
A-1). Durch Reportergen-Analyse in den Zelllinien HepG2 (Hepatocyten) und IHKE1
(Nierenepithelzellen) konnte für die potentiellen Promotoren Prox, E1i1E2 und Dist3
signifikante Aktivität nachgewiesen werden. Der Promotor Prox war am aktivsten in HepG2-,
E1i1E2 dagegen in IHKE1-Zellen, ein Befund, der eine Zelltyp- (Gewebe-) abhängige Aktivität
dieser beiden Promotoren anzeigt. Der Promotorbereich Dist3 war in beiden Zelllinien aktiv,
während Dist1 und Dist2 jeweils inaktiv waren.
In Hepatocyten, dem Hauptsyntheseort des hPPK, ist in erster Linie der Promotor Prox für die
Transkription des hPPK-Gens verantwortlich. Er wurde daher eingehender untersucht mit dem
Ziel, wichtige cis-aktive Elemente zu identifizieren. Die Analyse der 3'-terminalen 150 bp des
Prox-Promotors durch Substitutionsmutationen zeigte, dass in diesem Abschnitt eine Reihe
maßgeblich wirksamer Kontrollelemente vorhanden sind. Die funktionell wirksamsten
Sequenzabschnitte, nämlich jene, deren Mutation die Promotoraktivität auf unter 25 %
reduzierte, waren in drei Bereichen lokalisiert, Region 1, 2 und 3. Bei der Suche nach
Konsensussequenzen für Transkriptionsfaktoren in den drei Regionen wurden ein TATA-Box-
Motiv in Region 1 und eine Bindungsstelle für NF1 (Nuclear Factor 1) in Region 2 identifiziert.

A ZUSAMMENFASSUNG 6
EMSA-Experimente mit Oligonucleotiden der Region 1 schlossen jedoch eine spezifische
Bindung des TATA-Box-bindenden Proteins an diese Region aus, Prox ist somit ein „TATA-
freier“ Promotor. Im Gegensatz dazu ergaben EMSA-Experimente mit Region-2-
Oligonucleotiden, dass NF1-Proteine in vitro mit Region 2 interagieren. Nachfolgende ChIP-
Experimente bestätigten dann diese Wechselwirkung auch in vivo. Da NF1 in vier Isoformen
vorkommt, NF1-A, NF1-B, NF1-C und NF1-X, wurde durch Überexpression sowie
Herabregulierung der Synthese untersucht, welche der Isoformen an der Regulation der
Expression des hPPK-Gens beteiligt sind. Überexpression der einzelnen NF1-Isoformen in
HepG2-Zellen zeigte unterschiedliche Wirkungen auf die Expression von hPPK-mRNA. Für
NF1-B ergab sich eine beträchtliche und für NF1-A und NF1-X eine geringfügige Erhöhung der
PPK-mRNA-Expression, während bei NF1-C-Überexpression kein Effekt zu beobachten war.
Herabregulierung der Synthese der NF1-Isoformen durch RNA-Interferenz führte bei NF1-C zu
negativen, bei NF1-X zu positiven Effekten auf die Expression des hPPK-Gens. Insgesamt zeigte
sich somit, dass die einzelnen NF1-Isoformen trotz ihrer ausgeprägten Homologie die
Transkription des hPPK-Gens in funktionell unterschiedlicher Weise regulieren.
Mit dem Ziel, die mit Transkriptionsstartpunkten in Intron 1 und Exon 2 beginnende
Transkription des hPPK-Gens zu untersuchen, sollte die potentielle Promotorregion E1i1E2
analysiert werden. Die Region E1i1E2, die den Bereich Exon 1, Intron 1 und Exon 2 des hPPK-
Gens umfasst, wies in Reportergenanalysen starke Promotoraktivität auf. Überraschenderweise
zeigte sich bei der Bestimmung der Transkriptionsstartpunkte, die bei der Expression des
Reportergens rekrutiert werden, dass diese nur bei wenigen der Transkripte innerhalb des
inserierten E1i1E2-Fragments lagen, während die Mehrzahl der Startpunkte in der Sequenz des
Vektors bis zu etwa 2000 bp stromauf des Inserts gefunden wurde. Es ergab sich somit, dass die
E1i1E2-Region eine Dislozierung des Transkriptionsstarts durch Rekrutierung eines alternativen,
stromauf gelegenen Promotors bewirkt. Deletion von Exon 1 und 2 sowie schrittweise Deletion
des 5'-Bereichs von Intron 1 zeigten, dass sowohl die signifikante Promotoraktivität wie auch der
Effekt der Dislozierung des Transkriptionsstarts dem 3'-terminalen 13-bp-Segment des Introns 1
zuzuschreiben sind. Offenbar kann ein bisher nicht beschriebenes, 13 bp langes cis-aktives
Element eine Transkriptionsstart-Dislozierung bzw. Rekrutierung eines alternativen Promotors
bewirken.
Insgesamt wurde gezeigt, dass in den verschiedenen Geweben eine Vielfalt an Transkripten
des humanen Präkallikrein-Gens gebildet wird, was auf die Rekrutierung alternativer, weit
auseinander liegender Promotoren, auf die von den einzelnen Promotoren benützten
unterschiedlichen Transkriptionsstarts sowie auf alternatives Spleißen zurückzuführen ist. Die

A ZUSAMMENFASSUNG 7
Generierung einer derartigen Vielfalt an Transkripten eines einzelnen Gens tritt bei der Mehrzahl
der Gene der Mammalia auf wie vor kurzem in groß angelegten Studien gezeigt wurde. Daraus
wurde geschlossen, dass dieses Phänomen die Notwendigkeit der zeitlich und räumlich exakt
regulierten Expression eines Gens widerspiegelt. Somit spricht der Nachweis der vielfältigen
alternativen Transkripte des PPK-Gens für die Richtigkeit des Konzepts, dass Plasmakallikrein
bei diversen physiologischen Vorgängen in unterschiedlichen Entwicklungsstadien und/oder
Geweben und Zelltypen eine Rolle spielt. Die Erforschung der molekularen Mechanismen, die
der Transkription des hPPK-Gens durch die einzelnen alternativen Promotoren und dem
Spleißen der unterschiedlichen Transkript-Typen zugrunde liegen, sollte dazu beitragen, die
genauen Funktionen des in den unterschiedlichen Geweben gebildeten Plasmakallikreins
aufzuklären.

B INTRODUCTION 8
B INTRODUCTION
B.1 The plasma kallikrein in the kallikrein-kinin cascade
B.1.1 The kallikrein-kinin system
The discovery of the kallikrein-kinin system can be traced back to 1909 when two French
surgeons observed hypotension upon intravenous injection of an alcohol-insoluble fraction of
human urine into anesthetized dogs (Webster, 1970). In 1926, Frey and coworkers confirmed
this first observation by injection of human urine into dogs and subsequently attributed the
hypotensive effect to a bioactive substance which they isolated from human urine and named
F-substance (Werle, 1970). Looking for a presumed producing gland, Kraut et al. (1930) found
large amounts of F-substance in pancreas and named the substance “kallikrein” after the Greek
synonym kallikreas for pancreas. Later the kallikrein found in urine was identified as a glandular
kallikrein mainly derived from the kidney (Webster, 1970). Today, the substance is known as
tissue kallikrein. In 1937 Werle disclosed that kallikrein liberates a labile vasoactive decapeptide
kallidin from an inactive precursor in plasma termed kininogen (Werle et al., 1937). Ten years
later Rocha e Silva et al. (1949) identified another bioactive nonapeptide bradykinin (BK)
released from kininogen by trypsin. A kinin-liberating enzyme from blood originally thought to
be identical with pancreatic kallikrein (Kraut et al., 1928, 1933) was ultimately identified as a
separate entity, namely, plasma kallikrein, the active form of its precursor plasma prekallikrein
(reviewed by Movat, 1979). Finally, the characterization of the first kinin degrading enzymes
kininase I (Erdös et al., 1963) and kininase II (Erdös & Yang, 1967; Yang & Erdös, 1967) and
later additional kininases completed the system.
The kallikrein-kinin system consists of four major components: the kallikreins (plasma or
tissue kallikrein), the kininogens (low and high molecular weight), the kinins, and the kininases.
The interplay of these components is summarized in Figure B-1. The serine peptidases plasma
and tissue kallikrein are activated through proteolytic cleavage of the zymogens plasma
prekallikrein (by the coagulation factor XII or prolylcarboxypeptidase) and tissue prekallikrein
(by an as yet unknown peptidase), respectively. The activity of the two kallikreins is tightly
controlled by various inhibitors (C1-inhibitor, �2-macroglobulin, antithrombin III, kallistatin, �1-
antitrypsin). Plasma and tissue kallikreins liberate kinins (BK and kallidin) from high and low
molecular weight kininogen. Kinins and the modified forms desArg-kinins exert their biological
activities by binding to the cellular receptors B1 and B2 before being metabolized by various
peptidases.

B INTRODUCTION 9
Figure B-1. Schematic representation of the kallikrein-kinin system. HK, high molecular weight kininogen; LK, low molecular weight kininogen; BK, bradykinin; KD, kallidin; B1R, B1 receptor; B2R, B2 receptor; CPN, carboxypeptidase N; CPM, carboxypeptidase M; APN, aminopeptidase N.
Plasma and tissue kallikreins share the name kallikrein because of their characteristic kinin-
liberating activity, but are basically different molecules: they release different types of kinins and
differ significantly in gene structure, amino acid sequence, substrate specificity, and
physiological functions. Plasma kallikrein is encoded by a single gene on chromosome 4q35 (Yu
et al., 2000), tissue kallikrein by a gene on chromosome 19q13.3 (Evans et al., 1988). In contrast
to the multidomain structure of plasma kallikrein (Chung et al., 1986; cf. B.1.2), tissue kallikrein
is composed of a protease domain alone (Fukushima et al., 1985). The degree of sequence
identity of tissue kallikrein and the protease domain of plasma kallikrein is about 34 %. Finally,
plasma kallikrein acts only upon high molecular weight kininogen (HK) and releases the
nanopeptide BK, whereas tissue kallikrein liberates kallidin (Lys-BK) from both high and low
molecular weight kininogen.
Recently 14 closely related serine proteases encoded by a tightly clustered multigene family
around the human tissue kallikrein locus on chromosome 19q13.3-19q13.4 have been identified
and became known as tissue kallikrein family (Paliouras & Diamandis, 2006). However, one has
to discriminate between the “real” tissue kallikrein (or kallikrein 1 according to the new
nomenclature) and the related serine proteases (kallikrein 1-related peptidases), since the latter
are known to display no kinin-releasing activity (Lundwall et al., 2006).

B INTRODUCTION 10
B.1.2 Properties of plasma kallikrein
Plasma prekallikrein (PPK), the zymogen of the serine protease plasma kallikrein (PK, EC
3.4.21.34), is synthesized as a single chain glycoprotein. It is encoded by the gene KLKB1 of
about 31 kb in length composed of 15 exons and 14 introns (Yu et al., 2000).
The human PPK mRNA codes for a signal peptide of 19 amino acids and a mature
polypeptide chain of 619 amino acids (Figure B-2) (Chung et al., 1986). The PPK synthesized in
hepatocytes is secreted into the bloodstream where it exists in two forms with molecular masses
of 85 and 88 kDa due to different carbohydrate content. The concentration is in the range of 35-
50 mg/l (Colman & Schmaier, 1997) and at least 75 % of PPK circulates in blood as an
equimolar complex with the non-enzymatic HK (Mandle et al., 1976).
Figure B-2. Representation of the primary structure of PPK. A1 through A4 indicate the apple domains of plasma prekallikrein’s heavy chain. The arrow between arginine 371 and isoleucine 372 indicates the activation cleavage site. Histidine 415, aspartic acid 464, and serine 559 form the catalytic triad of the light chain. The sequence of the signal peptide is indicated by shaded circles. (Figure adapted from Colman & Schmaier, 1997.)
Conversion of PPK to PK occurs through cleavage of the peptide bond Arg371-Ile372,
producing a two-chain protein with a heavy and a light chain, held together by a disulfide bond
between Cys364 and Cys484 (McMullen et al., 1991). The C-terminal light chain represents the

B INTRODUCTION 11
peptidase domain with the catalytic triad of His-415, Asp-464, and Ser-559 (Mandle & Kaplan,
1977; van der Graaf et al., 1982). The amino-terminal heavy chain comprises 4 tandem apple
domains of 90 or 91 residues followed by a short connecting region of 9 amino acids (Chung et
al., 1986). The apple domain A2 and two flanking sequence segments of A1 and A4 form a
discontinuous binding platform for HK (Page et al., 1994; Renne et al., 1999), whereas apple
domains 3 and 4 are involved in binding to the coagulation factor XII (FXII).
Both the light and heavy chains are glycosylated. PK from human blood has 15 %
carbohydrate by weight and five potential sites for N-glycosylation including three in the light
and two in the heavy chain (Chung et al., 1986). Because of heterogeneity in the carbohydrate
moiety, the light chain can exist as 36- and 33-kDa isoforms. The N-linked glycosylation does
not affect the enzymatic activity of PK and its detailed function is still unknown (Tang et al.,
2005).
B.1.3 Sites of synthesis of plasma prekallikrein
It had been accepted for several decades that PPK is synthesized exclusively in the liver and
secreted into the bloodstream. Investigations by Ciechanowicz et al. (1993) and Hermann et al.
(1996, 1999) revealed that PPK mRNA is not only expressed in the liver but also in several non-
hepatic tissues and cells. Recently, expression of the mRNA of PPK has been determined
quantitatively in liver and 15 non-hepatic human tissues; the highest mRNA levels were detected
in pancreas (68 % compared to liver), kidney (24.6 %), and testis (9.5 %) (Neth et al., 2001;
Neth, 2002). In addition, evidence that the protein is also produced extrahepatically was
provided recently by immunocytochemical studies where PK/PPK has been specifically
visualized in several human tissues such as pancreas, kidney, testis, stomach and others (Fink et
al., 2007).
B.1.4 Activation of the plasma prekallikrein
Contact activation. The concept of contact activation was originally developed based on the
observation that contact of plasma with artificial negatively charged surfaces resulted in
coagulation. Three proteins are involved in contact activation, the zymogens FXII and PPK as
well as the non-enzymatic HK (Colman, 1998). Both FXII and HK bind with high affinity to
negatively charged surfaces such as kaolin, dextran sulfate or bacterial membranes. Upon
binding to a negatively charged surface, the HK-PPK complex circulating in plasma positions
the zymogen in proximity to surface-bound FXII. Surface-bound FXII is thought to go through
conformational changes resulting in the expression of endogenous activity sufficient to activate a
small number of PPK molecules through cleavage of the peptide bond Arg371-Ile372. In a

B INTRODUCTION 12
feedback activation loop, the PK formed activates surface-bound FXII to FXIIa, thus triggering
the intrinsic pathway of blood coagulation (reviewed by Joseph & Kaplan, 2005). In addition,
upon activation, PK releases BK from HK by cleaving two peptide bonds.
Activation on endothelial cells. The concept of contact activation has been accepted in the
plasma kallikrein/kinin field for the last several decades. Recently, alternative pathways for PPK
activation in vivo have been found, which operate independently of FXII. It was observed that
when the PPK-HK complex assembles on endothelial cells, the PPK is rapidly converted to the
active form (Shariat-Madar et al., 2002a). A major PPK activating enzyme on cultured
endothelial cells was identified to be the serine protease prolylcarboxypeptidase (PRCP)
(Shariat-Madar et al., 2002b, 2004). However, the mechanism of PRCP-mediated PPK activation
is not fully understood. Overexpression of human PRCP increases the endogenous PPK
activation, and there is an absolute requirement for HK to serve as an adapter molecule for PPK
to be activated by PRCP (Shariat-Madar et al., 2005). It is not known yet if the actual PPK
activation peptide bond for PRCP is identical to the Arg-Ile bond that FXIIa is cleaving.
Additionally, heat shock protein 90 (HSP90) was shown in vitro to have the potency to
activate PPK in solution independently of FXII (Joseph et al., 2002). Similar to PRCP, HSP90
requires the presence of native HK and zinc ions. Although the cytoplasmic HSP90 binds to HK,
the surface exposure of HSP90 on intact cells is still a matter of discussion. Though HSP90 has
been shown to be secreted from cells in response to oxidative stress, the mechanism, by which
the intracellular protein that lacks a signal peptide sequence is secreted, remains unknown (Liao
et al., 2000). Besides, HSP90 is not known to possess proteolytic activity, therefore the
mechanism by which it activates PPK remains an open question.
B.1.5 Biological functions
The biological effects of PK to a great extent ensue from cleavage of the two principal
substrates, HK and FXII, resulting in liberation of BK and formation of activated FXII,
respectively.
Bradykinin. Cellular effects of BK are mediated via kinin B1 and B2 receptors, members of
G-protein coupled receptor family. BK is a pharmacologically highly active nonapeptide that
exerts its cellular actions by releasing cytokines (e.g., interleukin 1, tumor necrosis factor) and
many second-generation mediators, for example, platelet-activating factor, leukotrienes,
prostaglandins, substance P, calcitonin gene-related peptide, acetylcholine, noradrenaline, etc
(Bhoola et al., 1992). BK can cause vasodilatation, enhanced vascular permeability, constriction
of smooth muscles, activation of phospholipase A2 to liberate arachidonic acid (Joseph &
Kaplan, 2005). BK contributes to vasodilatation by elevating plasma prostacyclin (Hong, 1980),

B INTRODUCTION 13
inducing the release of nitric oxide by endothelial cells via the B2 receptor (Palmer et al., 1987;
Zhao et al., 2001), stimulating superoxide formation (Holland et al., 1990). BK is also a powerful
mediator involved in the pain response mainly through two mechanisms: by the direct
stimulation of sensory neurons (likely A�- and C-fibers) and by sensitization of nociceptors to
physical and chemical stimuli (Couture et al., 2001). BK can also work as an anti-inflammatory
or neuroprotective mediator within the central nervous system through its effect on glial cells
(Noda et al., 2007). In addition, in the nervous system BK is involved in the central regulation of
blood pressure and increasing sympathetic nervous activity (de Wardener, 2001). BK is a
proangiogenic molecule. It promotes angiogenesis by upregulation of endogenous basic
fibroblast growth factor through the B1 receptor or vascular endothelial growth factor through
the B2 receptor, by increasing vascular permeability or by promoting endothelial cell
proliferation via the B2 receptor (Guo & Colman, 2005).
Activated coagulation factor XII. The physiological relevance of PK-mediated activation of
FXII in blood coagulation pathway had been questionable for a long time, since deficiencies of
both proteins in plasma do not result in a bleeding phenotype. Recently, the biological role of
FXIIa was reevaluated. Although FXIIa contributes little to the initial phase of thrombus
formation, it is essential for thrombus stabilisation (Renne et al., 2005).
Among other biological activities attributed to PK in blood are stimulation of neutrophils to
aggregate and release their lysosomal contents such as elastase, activation of the C3 convertase
of the alternative pathway, participation in fibrinolysis by activating single-chain urokinase
plasminogen activator and subsequent plasminogen activation. Thus, PK circulating in blood has
many important physiological functions, including modulation of blood pressure, complement
activation, mediation of inflammatory responses, and maintenance of the balance between
thrombus stabilization and fibrinolysis.
Novel biological roles. It was shown that PPK in the blood originates essentially or totally
from the liver (Wong et al., 1972; Colman & Wong, 1979); therefore, it has been concluded that
the extrahepatically synthesized PPK does not significantly contribute to the PPK pool in
plasma, but rather that it has special functions at or near the cellular site of its synthesis (Neth et
al., 2001; Fink et al., 2007). Recently, involvement of PK in several cellular events and pathways
fitting into the concept of such local PPK functions has been demonstrated. PK along with other
proteases (tissue kallikreins, trypsin, cathepsin G) activates bradykinin B2 receptor directly,
independent of kinin release, by an as yet unknown mechanism (Hecquet et al., 2000, 2002;
Biyashev et al., 2006). PK is required during adipogenesis; the enzyme mediates a plasminogen
cascade presumably via direct activation of plasminogen, which in turn fosters adipocyte

B INTRODUCTION 14
differentiation by degrading the fibronectin-rich stromal matrix of preadipocytes (Selvarajan et
al., 2001). PK, as well as coagulation factor XI, can activate pro-hepatocyte growth factor and
thus may be involved in the regulation of processes dependent on the hepatocyte growth factor/c-
Met signaling pathway (Peek et al., 2002). PK is involved in impaired liver regeneration by
circulating endotoxin after partial hepatectomy (Akita et al., 2002). The process is triggered by
elevated levels of endotoxin stimulating secretion of tumor necrosis factor �, which in turn
provokes PK-dependent proteolytic activation of latent transforming growth factor � resulting in
inhibited liver regeneration. PK plays a significant role in skin wound healing most likely
through plasminogen-dependent fibrinolysis (Lund et al., 2006). Establishment of an animal
model deficient for PPK may shed light on the exact functions of the extrahepatically
synthesized PPK.
B.1.6 Involvement in pathologic disorders
PPK was identified as the protein whose deficiency is responsible for the autosomal-recessive
Fletcher trait (Hattersley & Hayse, 1970; Saito et al., 1974). PPK deficiency causes significantly
prolonged activated partial thromboplastin time, but despite this fact it is not connected to any
abnormal bleeding tendency.
Involvement of blood PPK in pathological processes are mainly determined by its excess
activation or an imbalance between the active enzyme and its naturally occurring plasma
inhibitors C1-inhibitor, �2-macroglobulin and antithrombin III (Bhoola et al., 1992). C1-inhibitor
together with �2-macroglobulin account for 90 % of the PK inhibitory activity in plasma,
antithrombin III takes over the remainder (Joseph & Kaplan, 2005).
Deficiency of the major physiological inhibitor of PK in plasma, C1-inhibitor, leads to
abnormal PK activity resulting in overproduction of BK. The mechanism is implicated in the
symptoms of hereditary angioedema (reviewed in Davis, 2005; Levy & O'Donnell, 2006).
During acute attacks of this disease, increased levels of bradykinin cause an increase in vascular
permeability and subsequently localized oedema. The symptoms can be suppressed by
replacement therapy with C1-inhibitor or recombinant inhibitor DX-88 (B.1.7).
Septic shock is another pathological state involving plasma kallikrein. In this case, endotoxin-
induced activation of PPK results in the overproduction of BK which is implicated in the
pathogenesis of septic shock through its ability to lower blood pressure (reviewed in Shariat-
Madar & Schmaier, 2004). In addition, PPK is involved in pathogenesis of inflammatory bowel
disease, systemic lupus, rheumatoid arthritis, allergic rhinitis, complications in cardiopulmonary
bypass, and others (Colman, 1999; Isordia-Salas et al., 2005; Stadnicki, 2005).

B INTRODUCTION 15
B.1.7 Plasma kallikrein inhibitors for therapeutic use
Since PK is involved in multiple pathologic disorders, it is regarded as a potential therapeutic
target (B.1.6), and investigations on potent and highly specific inhibitors for PK are continually
carried on. The resulting inhibitors can subsequently contribute to a better understanding of the
physiological and pathophysiological roles of PK in vivo.
Recently a new recombinant inhibitor DX-88 or Ecallantide (Dyax Corp, Cambridge, Mass)
was shown to be highly potent and specific for PK. In contrast to endogenous C1-inhibitor which
has nearly the same inhibitory activity against PK, plasmin, FXIIa, FXIa, and the components of
the complement system C1r and C1s, the inhibitory activity of DX-88 is several orders of
magnitude greater against PK as compared to the other proteinases. DX-88 is currently
undergoing phase III of clinical trials (Levy & O'Donnell, 2006).
The synthetic inhibitor P8720, which has been demonstrated to be potent and reasonably
selective for PK, was used to study PK-mediated inflammatory reactions in rats, but was not
pursued therapeutically because of its toxic effects (Stadnicki et al., 1996, 1998).
Another PK inhibitor was engineered using ecotin, a macromolecular inhibitor of serine
proteases from E. coli, as a scaffold (Stoop & Craik, 2003). The ecotin-PK inhibitor is more
selective for PK by four to seven orders of magnitude when compared with binding to
coagulation factors Xa, XIa, uPA, thrombin and membrane-type serine protease 1. However,
FXIIa demonstrated cross-reactivity with the ecotin-PK inhibitor.
An important step toward the design of inhibitors with enhanced selectivity for PK was
crystallization of the PK catalytic domain and determination of its structure (Tang et al., 2005).
Based on the crystal structure construction of new small molecules inhibitors is ongoing (Young
et al., 2006; Zhang et al., 2006).
B.2 Insights into the transcriptional control network
Transcriptional initiation is a key step at which gene activity is controlled. Regulation of
transcriptional initiation is carried out by a complex network of interactions between cis-acting
DNA elements and DNA-binding transcription factors (TFs). The DNA sequences that specify
the transcriptional program of each gene include several functionally distinct regions: the core
promoter, regulatory promoters, enhancers, silencers, and boundary/insulator elements. Besides,
coordination of chromatin modifications plays an important role for transcription initiation,
mainly through the control of post-translational modifications of histones.

B INTRODUCTION 16
B.2.1 Transcription initiation by RNA polymerase II
The initiation of mRNA synthesis in eukaryotic cells is a complex and highly regulated
process that requires the assembly of the transcription preinitiation complex (PIC) at the core
promoter.
B.2.1.1 The general transcription machinery
Assembly of a PIC usually begins with TFIID, which consist of TATA-binding protein (TBP)
and thirteen TBP-associated factors (TAFs) (Lodish et al., 2003b). Binding of TFIID to the
TATA box, initiator (Inr) element and/or other sites (see below) leads to bending DNA through a
90° angle. This is followed by the entry of other general transcription factors and RNA
polymerase II (RNApolII) through either a sequential assembly or a preassembled RNApolII
holoenzyme pathway. In the sequential assembly pathway binding of TFIID is followed by the
entry of TFIIA and TFIIB that help stabilize promoter-bound TFIID, and the recruitment of a
preformed complex of tetrameric TFIIF and RNApolII. Then TFIIE is recruited, with the
subsequent entry of TFIIH having the helicase activity. In an alternative pathway for PIC
formation TFIID and TFIIA bind first to the core promoter and are thought to facilitate the entry
of RNApolII holoenzyme complex which contains RNApolII, TFIIB, TFIIE, TFIIF, TFIIH, and
some other factors (the latter can vary depending on the methods of purification). Transcription
initiation begins then with phosphorylation of the C-terminal domain of the largest subunit of
RNApolII by TFIIH.
Formation of the stable promoter-bound complex is sufficient for a basal level of transcription
in vitro. However, regulated transcription initiation involves interactions of the PIC with
additional components (the TAFs, the mediator, positive and negative cofactors).
B.2.1.2 Core promoter architecture
The core promoter is defined as the minimal DNA region that is sufficient to direct low levels
of activator-independent transcription by RNApolII in vitro. In vivo, however, in the absence of
regulatory proteins, the core promoter is generally inactive and fails to bind the general
transcription machinery. The core promoter typically extends approximately 35 bp upstream
and/or downstream from the +1 position (Smale & Kadonaga, 2003). It encompasses the
transcription start site (TSS), i.e. the first nucleotide that is copied at the 5' end of the
corresponding mRNA, and several distinct cis-regulatory elements which contribute to proper
assembly and orientation of the PIC.
Studies on promoters of eukaryotic protein-coding genes have thus far identified the
following core promoter elements (Figure B-3): TATA box, Inr element, downstream promoter

B INTRODUCTION 17
element, TFIIB recognition element, downstream core element (reviewed in Smale & Kadonaga,
2003; Gröss & Oelgeschlager, 2006; Thomas & Chiang, 2006), motif ten element (Lim et al.,
2004), X core promoter element 1 (Tokusumi et al., 2007). Each of these motifs is present only
in a subset of core promoters; different elements can co-occur in the same promoter, although
certain combinations are more likely than others, and some patterns complement each other. The
Inr element, TFIIB recognition element, and downstream core element have been shown to
modulate the activity of TATA-containing core promoters, whereas motif ten element and
downstream promoter element function has up to now only been demonstrated in TATA-
independent promoters containing an Inr element.
Figure B-3. Schematic diagram of the core promoter elements. Inr, initiator element; DPE, downstream promoter element; BREu and BREd, TFIIB recognition element (upstream/downstream); XCPE1, X core promoter element 1; MTE, motif ten element; DCE, downstream core element. DCE consists of three discontinuous subelements. It is possible that there are other core promoter elements that remain to be discovered.
The best studied element is the TATA box, an A/T-rich sequence located approximately 24–
31 nucleotides upstream of the TSS. Its consensus sequence, TATA(A/T)AA(A/G), is
recognized by TBP, which is part of the PIC. TATA boxes are associated with strong tissue-
specific promoters. The Inr element is defined by the pyrimidine-rich consensus sequence
PyPyA+1N(A/T)PyPy surrounding the TSS. TAF1/TAF2 components of the general transcription
factor TFIID have been shown to specifically interact with the Inr element. The Inr element can
function independently of the TATA box, although the two can occur together and act
synergistically if separated by no more than 30 bp. So far, only the TATA box and the Inr
element have been shown to be capable of recruiting the PIC and initiate transcription
independent of other core promoter elements (Smale & Kadonaga, 2003; Thomas & Chiang,
2006).
Another widespread characteristic of promoters are CpG islands which represent 0.5-2 kbp
stretches of DNA in which CG dinucleotides are overrepresented (Smale & Kadonaga, 2003). It
has been estimated that 50 % of human promoters are associated with CpG islands. CpG-island-
associated promoters are most often associated with housekeeping genes, although there are
many exceptions. Only a fraction of CpG-associated promoters have TATA-like elements. They
usually lack downstream promoter or Inr elements and are typically characterized by the
presence of multiple TSSs spanning a region of 100 bp or more. The elements that are

B INTRODUCTION 18
responsible for the core promoter function of CpG-associated promoters still remain poorly
defined.
B.2.2 Regulatory promoters and enhancers
The promoter, commonly defined as a region of approximately 500 bp upstream of the TSS,
represents a set of DNA cis-acting elements, i.e., DNA sequences recognized by specific TFs.
These cis-acting elements are typically 6-10 bp in length and are defined by consensus sequences
based on experimentally derived high-affinity recognition sequences for a given TF. However,
the binding sites that are functionally relevant in vivo might diverge substantially from the
known consensus sequences. Binding of activators to the regulatory elements in the promoter, in
cooperation with the core promoter, results in activated transcription. Some of the cis-acting
elements in the promoter interact with TFs that confer tissue-specificity for gene expression
(Delgado & Leon, 2006).
The activity of most promoters in vivo is influenced by more distal sequences classified
operationally as either enhancers, which increase transcription of a linked gene, or silencers,
which repress it. Enhancers/silencers are similar to promoter regions in that they are organized as
a series of regulatory sequences that are bound by TFs. However, they have no promoter activity
on their own. Enhancers/silencers function at a distance (sometimes 50 kb or more) irrespective
of orientation with regard to the gene they control. Thus, enhancers/silencers can be found either
upstream or downstream of the gene or within an intron. Like promoters, many
enhancers/silencers are cell-type specific (Szutorisz et al., 2005; Delgado & Leon, 2006).
Notwithstanding observations that direct interactions between enhancers and linked genes are
important for activation, it is yet unclear how enhancers find their targets. Currently, several
models for enhancer action are proposed (tracking, hopping models), however none of them is
conclusive (Valenzuela & Kamakaka, 2006).
In some instances a single gene or a locus of related genes might spread over 100 kb or more.
In these cases, genes might be under control of complex transcriptional enhancers called locus
control regions (LCRs), which remodel chromatin and control global access of activators over an
extended region. LCRs have strong enhancer activity but are distinguished from enhancers by
their ability to confer position-independent, copy number–dependent expression on a linked
gene. These two criteria are considered by many to be the minimal defining feature of an LRC
(Li et al., 2002).
To focus the action of the enhancer or LCR on the appropriate gene(s) and protect the other
gene(s) from inadvertent regulatory influences by their neighbours, the gene and its regulatory
regions are flanked by insulator (or boundary) elements from both sides. Insulators function in a

B INTRODUCTION 19
position dependent-manner displaying enhancer blocking and barrier activity. Elements with
enhancer blocking activity interfere with enhanced transcription when placed between an
enhancer element and the promoter; barrier elements halt the propagation of silenced chromatin
when positioned between DNA sequences that are packaged in heterochromatin and the gene
promoter vulnerable to silencing (West & Fraser, 2005).
B.2.3 Chromatin structure in transcriptional control
The control of transcription initiation is complicated by the fact that DNA is densely
packaged into chromatin which regulates access to DNA binding sites. Chromatin is composed
of repeating units, the nucleosomes, each consisting of 146 bp of DNA wrapped around an
octamer of histones and linker DNA. The nucleosomes themselves are arranged in fibers that are
further folded into loops. Remodelling and opening of the compact chromatin is fulfilled through
recruitment of co-activators. They are ATP-dependent chromatin-remodelling complexes that
alter the structure, composition and positioning of nucleosomes in a non-covalent manner, thus
regulating the accessibility of DNA. Another class of co-activators, histone-modifying
complexes, adds or removes covalent modifications (acetylation, methylation, phosphorylation,
ubiquitination, and glycosylation) from extending amino-terminal tails of histones. Among such
modifications histone acetylation and demethylation are the most-studied ones. However it is not
simply the overall level of, e.g., histone acetylation that controls the condensation of chromatin.
Rather the precise amino acids in the tails that are acetylated or otherwise modified constitute a
“histone code” that is recognized by specific proteins promoting condensation or decondensation
of chromatin (Delgado & Leon, 2006).
B.2.4 Regulatory proteins
The various cis-acting elements found in promoters and enhancers are the binding sites for
TFs. These regulatory proteins, activators or repressors, are usually present in very small
amounts in a cell, but their levels can increase dramatically in response to environmental stimuli.
Activators stimulate transcription initiation, whereas repressors mediate down-regulation of a
previously active gene.
Transcription factors are modular proteins consisting of a single DNA-binding domain and
one or few activation (for activators) or repression (for repressors) domains. The DNA-binding
domain targets the regulatory protein to a specific cis-acting element in a given promoter or
enhancer. TFs can be grouped into families according to the structural motifs of their DNA-
binding domains. Some common motifs include the homeodomain, zinc-finger, leucine zipper,
basic helix-loop-helix. An activation domain interacts either directly with the general

B INTRODUCTION 20
transcription machinery to recruit it to the promoter or alternatively with coactivators. Similarly,
repression domains function by interacting with other proteins, however, in contrast to activators,
a complex formed inhibits transcription initiation. Activation/repression domains are less
conserved than DNA-binding domains; they often have multiple interaction partners. Some TFs
also include a regulatory domain, which prevents DNA binding under certain conditions (Lodish
et al., 2003a).
Only few TFs have any effect on transcription on their own, first of all, because the affinities
of individual factors for the particular DNA are often too low to form a stable complex with
DNA. The affinity of binding can be greatly enhanced by cooperative interactions with proteins
that recognize adjacent sites. Besides, TFs form homo- or heterodimers, where each monomer
has either equivalent or different DNA-binding specificity. A major advantage of these
combinatorial modes of action is that a given TF can have different effects, depending on what
other proteins are present in the same cell; it also expands the number of DNA sites at which the
factor can affect transcription (Carey & Smale, 2000b).
TFs bound at the distal regulatory sequences transmit their signals to the general
transcriptional machinery via the mediator, a highly conserved complex of approximately 25
proteins (reviewed in Kornberg, 2005). However, some recent observations indicate that the
mediator is not absolutely required for transcription in vivo (Fan et al., 2006).
Thus, assembly of PIC depends on multiple protein-DNA and protein-protein interactions.
Activation of a gene begins with binding of an activator to a transcription-control region (usually
an enhancer). The bound activator recruits chromatin remodeling and histone-modifying
complexes which open the chromatin. Once the chromatin is decondensed, further TFs bind to
proximal cis-acting elements. Subsequently, the mediator complex is recruited to bridge
transcriptional activators with the general transcription factors and RNApolII to form the PIC at
the core promoter (Delgado & Leon, 2006).
B.3 Aims of the work
At the time when the experimental work for this thesis was started both the mRNA sequence
(Chung et al. 1986; NM_000892) and the exon-intron organization (Yu et al., 2000) of the
human PPK (hPPK) gene had been published, for the mouse PPK (mPPK) gene only the mRNA
sequence was known (Seidah et al., 1990; NM_008455). Based on the structure of the hPPK
gene which consists of 15 exons, the mouse mRNA sequence was assumed to have 15 exons as
well. The alignment of the mouse and human PPK mRNAs indicated that the murine exon 1 with
604 bp was 534 bp longer than the human exon 1. This finding evoked the question if the known

B INTRODUCTION 21
human mRNA represented a full-length transcript of the hPPK gene. To examine this aspect, the
transcription start sites were determined with RLM-RACE using mRNA from human liver,
pancreas, kidney, and testis, the four tissues with the highest PPK mRNA expression (Neth et al.,
2001; Neth, 2002). In all four tissues transcription start sites were detected at or near position +1
of the known mRNA, thus proving that the known hPPK represents a full-length transcript
(Table B-1). However, in the kidney and testis additional transcription start sites predominantly
within intron 1 and exon 2 of the hPPK gene were found. This fact indicated that the segment
comprising exon 1, intron 1, and exon 2 might be included in a yet unknown promoter region.
Furthermore, this potential alternative promoter might be utilized in a tissue-dependent manner,
since the downstream TSSs in intron 1 and exon 2 were identified only in kidney and testis.
Table B-1. Transcription start sites in human liver, pancreas, kidney, and testis.
Position of TSS Liver Pancreas Kidney Testis
upstr -127 1 upstr -80 1 upstr -36 1 upstr -27 1 E1 +1 5 3 2 E1 +3 1 E1 +4 1 E1 +6 3 3 1 I1 136 1 I1 243 1 I1 248 1 I1 265 1 I1 325 2 I1 334 1 I1 392 1 I1 436 1 I1 535 1 E2 +75 1 E2 +76 2 E2 +77 1
TSS, transcription start site; upstr, region upstream to the known mRNA; E1, E2, conventional exons 1 and 2; I1, intron 1. The numbering of positions in the upstream region and in exons 1 and 2 is relative to the 5'-end of the known mRNA sequence; in intron 1 the numbering refers to the 5'-end of intron 1. Numbers in columns 3–6 indicate the number of analyzed clones with the respective transcription start site.
When the mouse genomic sequence became available, mapping of the mouse mRNA
sequence to it showed that what was previously regarded as mouse exon 1 consists of three
exons (mE1a, mE1b and mE1c) (Neth et al., 2005). An alignment of the newly identified first
two mouse exons to human chromosome 4 revealed two segments of high similarity (hE1a,

B INTRODUCTION 22
hE1b) upstream of the hPPK gene. This fact raised the assumption that transcripts of the PPK
gene containing two additional upstream exons might also exist in human. Conversely, it seemed
possible that transcription of the mPPK gene can also be initiated within exon mE1c at start sites
analogous to those of human.
Taking into account the versatile functions of PPK synthesized in the various tissues (B.1.5)
one may conclude that all steps from transcription of the PPK gene to synthesis of the enzyme
and its activation are under careful, tissue-specific control. Up to now, investigations on this
issue have been limited to the protein level. Therefore, the principal goal of this work was to get
a deeper insight into the molecular mechanisms of the transcriptional control of the hPPK gene.
In particular, the following questions should be addressed:
� Are the distal TSSs corresponding to those of mouse PPK used for transcription initiation
in human, and are the proximal TSSs corresponding to those of human PPK used for
transcription initiation in mouse?
� Are alternative and/or tissue-specific promoters involved in transcriptional regulation of
the hPPK gene?
� What are critical cis-acting control elements within the main promoter of the hPPK gene?
� Which transcription factors are involved in the transcriptional control of the hPPK gene?
� During the characterization of putative alternative promoters of the hPPK gene it was
found that one of the alternative promoters when cloned into reporter gene plasmid
utilized TSSs within the vector backbone about 2000 bp upstream of the insertion site.
This phenomenon of TSS displacement was further investigated.

C MATERIALS AND METHODS 23
C MATERIALS AND METHODS
C.1 Materials
C.1.1 Equipment
Balances: Analytic Balance, A 120 S (0-12 g range) Sartorius, Göttingen, Germany Top Pan Balance, 1404 004 (0.01-2220 g range) Sartorius, Göttingen, Germany ß-Counter Liquid Scintillation Analyzer, Mod. 2300TR Packard, Meriden, CT ß-�-Counter, LB122 Berthold Technology, Canada CO2-Cell Incubator: Model IG 150 Jouan, Unterhaching, Germany Centrifuges: Eppendorf Centrifuge 5402 (rotor F 45-18-11) Eppendorf, Hamburg, Germany Eppendorf Centrifuge 5415C (rotor F 45-18-11) Eppendorf, Hamburg, Germany Heraeus Sepatech Megafuge 1.0 R (rotor 3360) Heraeus Sepatech, München Kontron Centrikon H-401 (rotors A6.9, A8.24) Kontron Instruments, Eching, Germany Clean Bench: BDK 7419, Mod. UVF 6.18 S BDK, Sonnenbühl-Genkingen, Germany Herasafe type HS18/2 Heraeus Instruments, München, Germany Electroporation System: Gene Pulser® Apparatus, Model No. 1652077 Bio-Rad, Ismaning, Germany Capacitance Extender, Model No. 1652087 Bio-Rad, Ismaning, Germany Pulse Controller, Model No. 1652098 Bio-Rad, Ismaning, Germany Fluorescence Microsocope: Olympus IX50-S8F Olympus Optical Co., Tokyo, Japan Gel Dryer: Gel Stab Dryer (Model 224) Bio-Rad, Ismaning, Germany Refrigerated Condensation Trap (Model KF) Bachofer, Reutlingen, Germany Rotary Vane Pump (Model RE 2) Bachofer, Reutlingen, Germany Hybridization Oven: Mini - Hybi H.Saur Laborbedarf, Reutlingen Germany LightCycler Instrument: LightCyler II Roche, Mannheim, Germany PCR Thermal Cycler: Mastercycler gradient Eppendorf, Hamburg, Germany Phosphorimager: Storm 840 Molecular Dynamics, Sunnyvale, CA Plate Luminometer: Safire2 Tecan, Crailsheim, Germany Power Supply: Phero-Stab. 500 Bachofer, Reutlingen, Germany Pharmacia (Model ECPS 3000/150) Pharmacia LKB Biochrom, Cambridge Protein Transfer Apparatus: Fastblot B43 Biometra, Göttingen, Germany PROTEAN® II xi Cell Bio-Rad, Ismaning, Germany SE 250 Mighty Small II Hoefer, San Francisco, CA Sonifier: Type B12 Branson Sonic Power Company, Danburg Spectrophotometer: GeneQuant, Mod. 80-2103-98 Pharmacia LKB Biochrom, Cambridge

C MATERIALS AND METHODS 24
C.1.2 Chemicals and materials
Chemicals and materials for the molecular biology techniques
Biotin-16-dUTP Roche (Mannheim, Germany) Blue/Orange 6�Loading Dye Promega (Mannheim, Germany) dCTP Roche (Mannheim, Germany) 100bp DNA Ladder Promega (Mannheim, Germany) DNA Molecular Weight Marker VII Roche (Mannheim, Germany) DNA Molecular Weight Marker VIII Roche (Mannheim, Germany) DNA-polymerisation mix Amersham Biosciences (Freiburg, Germany) GeneRacer™ Core kit Invitrogen (Karlsruhe, Germany) GeneRacer™ SuperScript™ III RT Module Invitrogen (Karlsruhe, Germany) LightCycler® TaqMan® Master Roche (Mannheim, Germany) MinElute™ Gel Extraction kit Qiagen (Hilden, Germany) QIAquick® II Gel Extraction kit Qiagen (Hilden, Germany) QIAfilter™ Plasmid Midi kit Qiagen (Hilden, Germany) QIAGEN® Plasmid Mini kit Qiagen (Hilden, Germany) QIAshredder™ Qiagen (Hilden, Germany) QuantiTect® Reverse Transcription kit Qiagen (Hilden, Germany) RNeasy® Mini kit Qiagen (Hilden, Germany) TOPO TA Cloning® kit for Sequencing Invitrogen (Karlsruhe, Germany) Universal Probe #11, #20, #42, #56, #60, #139 Roche (Mannheim, Germany)
Enzymes
Klenow Fragment (3��5� exo�) NE BioLabs (Frankfurt am Main, Germany) Platinum® Taq DNA Polymerase High Fidelity Invitrogen (Karlsruhe, Germany) Platinum® Taq DNA Polymerase Invitrogen (Karlsruhe, Germany) Restrictase BglII NE BioLabs (Frankfurt am Main, Germany) Restrictase EcoRI Roche (Mannheim, Germany) Restrictase MluI NE BioLabs (Frankfurt am Main, Germany) Restrictase NheI NE BioLabs (Frankfurt am Main, Germany) Restrictase NotI NE BioLabs (Frankfurt am Main, Germany) Restrictase SalI NE BioLabs (Frankfurt am Main, Germany) Restrictase XbaI NE BioLabs (Frankfurt am Main, Germany) RNase/DNase free Roche (Mannheim, Germany) T4-DNA Ligase Roche (Mannheim, Germany) T4 Polynucleotide Kinase NE BioLabs (Frankfurt am Main, Germany)
DNA and RNA
Human MTC Panel I BD Biosciences (Heidelberg, Germany) Human MTC Panel II BD Biosciences (Heidelberg, Germany) Human Genomic DNA BD Biosciences (Heidelberg, Germany) Human Liver Total RNA BioCat GmbH (Heidelberg, Germany) Mouse Liver Poly A+ RNA BD Biosciences (Heidelberg, Germany) Mouse Kidney Poly A+ RNA BD Biosciences (Heidelberg, Germany)
Cell culture
Dimethylsulfoxide Merck (Darmstadt, Germany) DPBS PAN Biotech GmbH (Aidenbach, Germany) Dulbecco’s modified Eagle’s medium Biochrom AG (Berlin, Germany) Dulbecco’s modified Eagle’s medium PAA (Cölbe, Germany)

C MATERIALS AND METHODS 25
Epidermal Growth Factor Calbiochem (Darmstadt, Germany) Fetal Bovine Serum PAN Biotech GmbH (Aidenbach, Germany) Insulin-Transferrin-Sodium selenite Sigma (Taufkirchen, Germany) HAM`s F12, with L-Glutamin Gibco (Paisley, Scotland, UK) Hepes-buffer (1M) Biochrom AG (Berlin, Germany) Hydrocortisone Sigma (Taufkirchen, Germany) Hygromycin B PAA (Cölbe, Germany) L-Glutamine PAN Biotech GmbH (Aidenbach, Germany) Penicillin/Streptomycin Gibco (Paisley, Scotland, UK) RPMI 1640 medium PAN Biotech GmbH (Aidenbach, Germany) Trypsin/EDTA PAN Biotech GmbH (Aidenbach, Germany)
Enzyme inhibitors
AEBSF Sigma (Taufkirchen, Germany) Antipain Sigma (Taufkirchen, Germany) Aprotinin Sigma (Taufkirchen, Germany) Benzamidine Sigma (Taufkirchen, Germany) Chymostatin Sigma (Taufkirchen, Germany) Leupeptin Sigma (Taufkirchen, Germany)
Detergents
Deoxycholic acid Sigma (Taufkirchen, Germany) Nonidet P-40 Sigma (Taufkirchen, Germany) SDS Serva (Heidelberg, Germany) Triton X-100 Sigma (Taufkirchen, Germany) Tween 20 Sigma (Taufkirchen, Germany)
Antibodies
NF-1 (H300)X, rabbit polyclonal Santa Cruz (Heidelberg, Germany) Anti-HA high affinity, rat monoclonal Roche (Mannheim, Germany) Anti-rabbit IgG, HRP-linked antibody Cell Signaling Technology (Danvers, MA USA) HRP-labeled rabbit anti-rat antibody DAKO (Glostrup, Denmark) Rabbit Immunoglobulin fraction (normal) DAKO (Glostrup, Denmark)
Radioactive chemicals
��-32P� ATP (>6000 Ci/mmol, 10mCi/ml) Hartmann Analytic (Braunschweig, Germany)
Miscellaneous
Ampicillin Roche (Mannheim, Germany) Bacto-tryptone Difco (Detroit, MI USA) Bacto-yeast extract Difco (Detroit, MI USA) Dynabeads® M-280 Streptavidin Dynal Biotech (Hamburg, Germany) Dynal MPC®-S Dynal Biotech (Hamburg, Germany) Eppendorf UVette Eppendorf (Hamburg, Germany) FuGENE 6 Transfection Reagent Roche (Mannheim, Germany) Glycogen (20mg/ml) Fermentas (St. Leon-Rot, Germany) Great EscAPe� SEAP Detection kit BD Biosciences (Heidelberg, Germany) HiPerFect Transfection Reagent Qiagen (Hilden, Germany) HyperFilm ECL Amersham Biosciences (Freiburg, Germany) Kodak BioMax MS Film (18cm×24cm) FS Medical Imaging GmbH (Jena, Germany)

C MATERIALS AND METHODS 26
LightCycler™ Capillaries Roche (Mannheim, Germany) Lumi-LightPLUS Western Blotting Substrate Roche (Mannheim, Germany) Luminescent �-galactosidase Detection kit II BD Biosciences (Heidelberg, Germany) MACS® MultiStand Miltenyi Biotec (Bergisch Gladbach, Germany) MACS® Separation Columns (� columns) Miltenyi Biotec (Bergisch Gladbach, Germany) �MACS™ Separation Unit Miltenyi Biotec (Bergisch Gladbach, Germany) �MACS Protein A MicroBeads Miltenyi Biotec (Bergisch Gladbach, Germany) Micro BCA™ protein Assay Reagent Pierce (Bonn, Germany) MicroSpin™ G-25 Columns Amersham Biosciences (Freiburg, Germany) MicroSpin™ S-200 HR Columns Amersham Biosciences (Freiburg, Germany) Nitrocellulose Transfer Membrane PROTRAN Schleicher & Schuell (Dassel, Germany) Nuclear Extract kit Active Motif (Rixensart, Belgium) NucTrap Probe Purification Column Stratagene (Amsterdam, The Netherlands) Nunc 96F White Maxisorp MicroWell Plates Nunc (Wiesbaden, Germany) Poly(dI-dC)Poly(dI-dC) Amersham Biosciences (Freiburg, Germany) Precision Plus Protein Kaleidoscope Standards Bio-Rad (Ismaning, Germany) Proteinase K (20mg/ml) Fermentas (St. Leon-Rot, Germany) Push Column Beta Shield Device Stratagene (Amsterdam, The Netherlands) Rotiphorese Gel 40 (37.5:1) Carl Roth GmbH (Karlsruhe, Germany) Streptavidin Sigma (Taufkirchen, Germany) TranSignal™ Protein/DNA Array I, II, III BioCat GmbH (Heidelberg, Germany)
Services
DNA oligonucleotide synthesis MWG (Ebersberg, Germany) DNA sequencing MediGenomix (Martinsried, Germany)
The antibodies that are not listed above were purchased from Santa Cruz (Heidelberg, Germany) and
are summarized in Table C-13.
All other reagents were of analytical grade and are commercially available from Merck, Sigma or
Roth.
For the detailed content of individual reagents and/or solutions in quotes one has to refer to the
respective kit.
C.1.3 Strains and cell lines
C.1.3.1 E. coli strains
E. coli Top10 (Invitrogen)
Genotype: F- mcrA (mrr-hsdRMS-mcrBC) �80lacZM15 lacX74 recA1 araD139
(ara-leu)7697 galU galK rpsL (StrR) endA1 nupG
E. coli B834(DE3) (Novagen)
Genotype: F - ompT hsdS B (r B - m B - ) gal dcm met

C MATERIALS AND METHODS 27
C.1.3.2 Mammalian cell lines
HepG2
Cell type: Human Hepatocellular Carcinoma
Collected from: Deutsche Sammlung von Mikroorganismen und Zellkulturen
DSMZ Nr.: ACC 180
Origin: tumor tissue of a 15-year-old Argentine boy with hepatocellular carcinoma
Cytogenetics: human hyperdiploid karyotype: 52(47-54)<2n>XY, +2, +14, +17, +20,
+2mar, t(1;21) (p22.2;p11-12), i(17q)/der(17)t(17;17)(p11;q11)
Flp-In™ T-RExTM-293 (Invitrogen)
Cell type: Human Embryonic Kidney (HEK) cells
Collected from: American Type Culture Collection
ATCC Nr.: CRL-1573
Origin: 293 human embryonic kidney cells
Cytogenetics: hypotriploid human karyotype: der(1)t(1;15) (q42;q13), der(19)t(3;19)
(q12;q13), der(12)t(8;12) (q22;p13)
This cell line contains a single stably integrated FRT site at a transcriptional active genomic
locus.
IHKE1
Cell type: Immortalized Human Kidney Epithelial
Origin: fetal human kidneys, proximal tubules
Cytogenetics: human triploid karyotype
The IHKE1 cell line (Tveito et al., 1989; Jessen et al., 1994) was kindly provided by Prof. Dr.
Eberhard Schlatter (Münster, Germany).

C MATERIALS AND METHODS 28
C.1.4 Vectors
C.1.4.1 pSEAP2-Basic
pSEAP2-Basic vector (BD Biosciences, Heidelberg, Germany) allows for expression of the
reporter gene secreted alkaline phosphatase (SEAP). This vector lacks eukaryotic promoter and
enhancer sequences and has a multiple cloning site (MCS) that allows putative promoter DNA
fragments to be inserted upstream of the SEAP gene (Figure C-1). Enhancers can be cloned into
either the MCS or unique downstream sites. The SEAP coding sequence is followed by the
simian virus 40 (SV40) late polyadenylation signal to ensure proper, efficient processing of the
SEAP transcript in eukaryotic cells. A synthetic transcription blocker (TB), composed of
adjacent polyadenylation and transcription pause sites, located upstream of the MCS reduces
background transcription. The vector backbone also contains an f1 origin for single-stranded
DNA production, a pUC origin of replication, and an ampicillin resistance gene for propagation
and selection in E. coli. (From instruction manual.)
Figure C-1. Restriction map and multiple cloning site of pSEAP2-Basic. Unique restriction sites are in bold. Multiple cloning site: 1−72 Secreted alkaline phosphatase (SEAP) gene: 75−1636 SV40 late mRNA polyadenylation signal: 1750–1769 pUC plasmid replication origin: 2148–2791 Ampicillin resistance gene: 3869–2942 f1 single-strand DNA origin (packages the coding strand of SEAP): 3931–4386 Transcription blocker: 4517–4670
���������
����������
�����
� ��
���
������
�����������������
�����
���
���
����
�������� �
!"�#�!�$%&'���(��%�)��'*+�
,�
���
!"
��������-�
������ ���
�����.��
����������������������������������������������������������������������������������������������������������������� ��
//!���/�/�!�!!��/�/!/�!�/���///�!�/�/�!�!/��� ���� ���� �������������������������������
� ��
�����������������������������������������������������������������������
/�!�!��/!��/�!!�/��!�/�/��!!�/����������!/�������������������������������
����� ������
�������� ����
� ��
C.1.4.2 pSEAP2-Control
pSEAP2-Control vector (BD Biosciences, Heidelberg, Germany) is a positive control vector.
It has the same backbone as the pSEAP2-Basic vector with the exception of the SV40 early
promoter and the SV40 enhancer that are inserted upstream and downstream of the SEAP gene,

C MATERIALS AND METHODS 29
respectively (Figure C-2). Fusion of the strong viral promoter and the enhancer to the SEAP
reporter gene allows controlling transfection efficiency of cells.
Figure C-2. Restriction map and multiple cloning site of pSEAP2-Control. Unique restriction sites are in bold. Multiple cloning site: 1−41 & 245�264 SV40 early promoter: 37�245 SV40 origin of replication: 95–230 Secreted alkaline phosphatase gene: 267−1828 SV40 late mRNA polyadenylation signal: 1942–1961 SV40 enhancer: 2056–2301 pUC plasmid replication origin: 2586–3229 Ampicillin resistance gene: 4307–3380 f1 single-strand DNA origin (packages the coding strand of SEAP): 4369–4824 Transcription blocker: 4955–5108
��������-��
��������������
������
� ��
���
������
���������
���������
���
���
����
���������
!"�#�!�$%&'���(��%�)��'*+�
,�
���
!"������
�����
������-�-�
�����.���
������������������������������������������������������������������������������������������������������������������ �
//!���/�/�!�!!��/�/!/�!�/���///�!�/�/�!�!�� ���� ���� ������������������������������
� ��
���������������������������������� ���������������������������������������������������������������������
��/�!!�/��!�/�/��!!�/����������!/
������������������������������
����� ������
�������� ����
� ��
���
����+
���
����� .���
���
+%0$%'+�
����+
C.1.4.3 pCR4-TOPO vector
The pCR4-TOPO vector (Invitrogen, Karlsruhe, Germany) allows a highly efficient, 5
minute, one-step cloning strategy for direct insertion of Taq polymerase-amplified PCR products
into plasmid backbone for sequencing. Taq polymerase has a nontemplate-dependent terminal
transferase activity, which adds a single deoxyadenosine (A) to the 3� ends of PCR products. In
its turn, the linearized pCR4-TOPO vector has single, overhanging 3� deoxythymidine (T)
residues (Figure C-3). This allows PCR inserts to ligate efficiently with the vector.
Besides, the pCR4-TOPO (referred to as “activated” vector) contains a covalently bound
topoisomerase. Topoisomerase I from Vaccinia virus binds to duplex DNA at specific sites and
cleaves the phosphodiester backbone after 5�-CCCTT in one strand (Shuman, 1991). The energy
from the broken phosphodiester backbone is conserved by formation of a covalent bond between
the 3� phosphate of the cleaved strand and a tyrosyl residue (Tyr-274) of topoisomerase I. The
phosphor-tyrosyl bond between the DNA and enzyme can subsequently be attacked by the 5�
hydroxyl of the original cleaved strand, reversing the reaction and releasing topoisomerase
(Shuman, 1994). TOPO cloning exploits this reaction to efficiently clone PCR products (Figure
C-4).

C MATERIALS AND METHODS 30
Figure C-3. pCR4-TOPO vector´s sequence surrounding the TOPO cloning site labeled with vector features and restriction sites.
lac promoter region: 2−216 Start of transcription: 179 M13 Reverse priming site: 205�221 LacZ�-ccdB gene fusion: 217�810 T3 priming site: 243�262 TOPO cloning site: 294-295 T7 priming site: 328-347 M13 Forward (-20) priming site: 355-370 Kanamycin promoter: 1021-1070 Kanamycin resistance gene: 1159-1953 Ampicillin (bla) resistance gene: 2309-3061 (c) Ampicillin (bla) promoter: 3062-3158 (c) pUC origin: bases 3159-3832 (c) = complementary strand
1$%$��'�%�
���'����%
������
Finally, pCR4-TOPO allows direct selection of recombinants via disruption of the lethal
E. coli gene, ccdB. The vector contains the ccdB gene fused to the C-terminus of the LacZ�
fragment. Ligation of a PCR product disrupts expression of the lacZ�-ccdB gene fusion
permitting growth of only positive recombinants upon transformation in competent E. coli cells.
Cells that contain non-recombinant vector are killed upon plating; therefore, blue/white
screening is not required. (From instruction manual, modified.)
������
!����&��+�$&+
2
� 23
��4����56'(�����!!
///��///
! !���
�
32
2
������
!����&��+�$&+ Figure C-4. Outline of the TOPO cloning strategy.

C MATERIALS AND METHODS 31
C.1.4.4 Flp-In expression system
The pcDNA5/FRT expression vector and the pOG44 plasmid along with a cell line containing
a single integrated Flp Recombination Target (FRT) site are three main components of the
Flp-In™ system (Invitrogen, Karlsruhe, Germany). The main advantage of this system is the
possibility to generate isogenic, inducible stable cell lines.
Figure C-5. Schematic representation of the pcDNA5/FRT vector. CMV promoter: 232-819 CMV forward priming site: 769-789 T7 promoter/priming site: 863-882 Multiple cloning site: 895-1010 BGH reverse priming site: 1022-1039 BGH polyadenylation signal: 1028-1252 FRT site: 1536-1583 Hygromycin resistance gene (no ATG): 1591-2611 SV40 early polyadenylation signal: 2743-2873 pUC origin: 3256-3929 (complementary strand) Ampicillin resistance gene: 4074-4934
�'78� 9:4!
��)�
����� ���
��� ��� �������
��
The pcDNA5/FRT plasmid (Figure C-5) contains the gene of interest under the control of a
human cytomegalovirus (CMV) promoter. The vector also contains the hygromycin resistance
gene with a FRT site embedded in the 5; coding region. Noticeably, the hygromycin resistance
gene lacks a promoter and the ATG initiation codon. The pOG44 plasmid (Figure C-6)
constitutively expresses the Flp recombinase under the control of the human CMV promoter. Flp
recombinase is a member of the integrase family of recombinases, which mediates a site-specific
recombination reaction between interacting DNA molecules via pairing of interacting FRT sites.
Figure C-6. Schematic representation of the pOG44 vector.
CMV promoter: 234-821 Synthetic intron: 871-1175 FLP gene: 1202-2473 SV40 early polyadenylation signal: 2597-2732 pUC origin: 3327-3993 Ampicillin resistance gene: 4138-4998

C MATERIALS AND METHODS 32
The principle of the method is outlined on the Figure C-7. pOG44 plasmid and the
pcDNA5/FRT vector with a gene of interest are co-transfected into the Flp-In™ T-REx™-293
cell line. Upon cotransfection, the Flp recombinase expressed from pOG44 mediates a
homologous recombination between the FRT sites (integrated into the genome and on
pcDNA5/FRT). As a result the pcDNA5/FRT construct is inserted into the genome at the
integrated FRT site, thus bringing the SV40 promoter and the ATG initiation codon (integrated
in the Flp-In™ cell line) into proximity and frame with the hygromycin resistance gene� Thus,
stable Flp-In™ expression cell lines can be selected for hygromycin resistance.
������
����
�����
��� ������ ��� �������
:��<�%�3�&(��+���=�%+
>��2/��
>��'78� 9:4!
��� ������ ��� �������
:��<�%�3�&(��+���=�%+
���������
!��"##���
�"�$����?�
���
�������
������� ��� �������
�� ���������� ��������%�������� ��� ��?�
@��+&&��%��,�0�A����'�% @��+&&��%��,�$�A+%+��,��%(+�+&(
Figure C-7. Diagram of the Flp-In™ system. pUC ori: replication origin. Ampicillin: ampicillin resistance gene. SV40 pA: simian virus polyadenylation sites. PCMV: cytomegalovirus promoter. GOI: gene of interest. T7: T7 promoter and binding site. BGH pA and SV40 pA: bovine growth hormone and simian virus polyadenylation sites, respectively.

C MATERIALS AND METHODS 33
C.1.4.5 NF1 expression vectors
The NF1 expression vectors were a generous gift from Ph.D. Richard M. Gronostajski, the
State University of New York at Buffalo, New York, USA. The vectors are:
� pCH expressing no protein;
� pCHNFI-A1.1 expressing HA-tagged mouse NF1-A1.1 protein;
� pCHNFI-B2 expressing HA-tagged mouse NF1-B2 protein;
� pCHNFI-C2 expressing HA-tagged mouse NF1-C2 protein;
� pCHNFI-X2 expressing HA-tagged mouse NF1-X2 protein.
The parent pCMV vector from which the beta-gal gene was deleted is from MacGregor and
Caskey (1989). The maps of the sequences can be downloaded from http://elegans.swmed.edu/
Worm_labs/Gronostajski/vectorlink.html.
C.1.5 Computer programs
- Adobe Acrobat Writer 5.0 (Adobe Systems Incorporated)
- Chromas 1.45 (Conor McCarthy)
- Clone Manager Professional Suite 8 Users (Scientific & Educational Software)
- Photoshop 7.0, CS (Adobe Systems Incorporated)
- Prism 3.03 (GraphPad Software Incorporated)
- Reference Manager 10 (ISI ResearchSoft)

C MATERIALS AND METHODS 34
C.2 Methods
C.2.1 Molecular biological methods
C.2.1.1 Polymerase chain reaction
DNA fragments were amplified and mutagenized by polymerase chain reaction (PCR).
Primers were designed by the Clone Manager Professional Suite program. The default criteria
for PCR primer design were: GC content between 40 and 60 %; Tm values between 55 and
80 °C (Freier et al., 1986); runs of less than 4 identical bases or repeats of less than 3
dinucleotide pairs; any dimers and dimers involving the 3' end of a primer less than 7 or 3 bases,
respectively; one or two G's or C's at the 3' end of the primer and the 5' end to be at least 1.2 kcal
more stable than the 3' end (SantaLucia energy parameters) (SantaLucia, 1998). If a search
produced no results, less stringent parameters were used. The designed primers were synthesized
by MWG (Ebersberg, Germany). In all reactions (apart from PCR screening of E. coli clones;
C.2.1.13) Pfu polymerase was used.
C.2.1.2 Design of PPK promoter constructs
Fragments of the putative promoter regions of the PPK gene were generated by nested PCR.
Final constructs – PPK promoter regions in pSEAP2-Basic vector – were named according to
the position of the respective promoter region relative to the published transcription initiation
site: Prox for proximal, Dist for distal, E1i1E2 for exon 1 + intron 1 + exon 2, and Joint for the
joint promoters Prox and E1i1E2.
Prox promoter and its deletion variant D3 were synthesized previously; they correspond to
-668/+22 and -152/+22, respectively, in Neth et al., 2005.
E1i1E2, Joint, Dist1, Dist2, and Dist3 as well as Int1 promoter and its deletion variants
(Int1_D2 – Int1_D9 and Int1_D(1-13)) were amplified by PCR using the respective primer pairs
(Table C-1). Int1_D10 – Int1_D13 and Int1_D13_mut1 – Int1_D13_mut4 fragments were
synthesized as plus and minus DNA strands with overhangs (Table C-1) and then annealed. The
resulting inserts contained 5�- and 3�-protruding ends representing MluI and NheI restriction half
sites.

Table C-1. Primers used to generate PPK promoter constructs.
Promoter
designation Position Size, bp Primers Sequence
E1a-1 of4128 TTCTTCTTTGAAGGGTATTTGATGGA
E1a-or71 GCCAGCAGAGAAGGGCACGTAG
E1a-if-Mlu4569 ACGCGTAGTACCTTGATCCACGTGTTCTTTG Dist1 7904569�7905304 736
E1a-ir-Nhe5304 GCTAGCGCATATGGATGGCGCCCTTG
E1a-1 of4128 TTCTTCTTTGAAGGGTATTTGATGGA
E1a-or71 GCCAGCAGAGAAGGGCACGTAG
E1a-1 if-Mlu4304 ACGCGTTGAAGGGTATTTGATGCGTATTTG Dist2 7904304�7905085 782
E1a-1 ir-Nhe5085 GCTAGCGGTATAGCATACTTACCCACTTCAC
UpE1a-2 of196 TCAAATGGGTGGGAAAGAAGG
UpE1a-2 or1231 ATGCTGCGATGATTAGGAGTG
E(1a-2) if-Mlu321 ACGCGTAGACGCTACGCTGGCGTAAGAC
E(1a-2) ir-Nhe1170 GCTAGCGCACTGTGACTGCAAAC
E(1a-2)-if-SalI GTCGACAGACGCTACGCTGGCGTAAGAC
Dist3 7900321�7901170 850
E(1a-2)-ir-SalI GTCGACGCACTGTGACTGCAAAC
P-I1-of-878 GTTGGCAGAAACCCAAAG
P-I1-or-1776 CCCGAAGCTGTATGTTCA
I1-if-Mlu929 ACGCGTGTGCCACATTAGAACAGC E1i1E2 7923578�7924330 753
I1-ir-Nhe1682 GCTAGCCACTTACCACAGGAAACT
C
MA
TE
RIA
LS A
ND
ME
TH
OD
S 35

Promoter
designation Position Size, bp Primers Sequence
PPK-F-1034 ACGCGTGCTAACGTGGAGGCTAGATAGA Joint 7922920�7924330 1411 I1-ir-Nhe1682 GCTAGCCACTTACCACAGGAAACT
I1-if-start-MluI ACGCGTGTAGCAAATTTTTATTATTCTGATTGT Int1 7923658�7924264 607 I1full-rev-NheI GCTAGCCTAAAAAAGAAAACAATACATAAC
Int1_D2 7923817�7924264 448 I1full-f-23817-MluI ACGCGTGATTTTAAATCAGAAAGAATATTTG
Int1_D3 7923956�7924264 309 I1full-f-23956MluI ACGCGTGAGGTTTCATAATTGTTTACTCTCTCTCTAC
Int1_D4 7924028�7924264 237 I1full-f-24028-MluI ACGCGTGAACAATAAACACAACAGTAG
Int1_D5 7924096�7924264 169 I1full-f-24096-MluI ACGCGTCTCCCTAGACACAAATGTACC
Int1_D6 7924128�7924264 137 I1full-f-24128-MluI ACGCGTCTTGTTTTCTATACCAGTAATTG
Int1_D7 7924164�7924264 102 I1full-f-24164-MluI ACGCGTGCAATTCAGACATTTACAAG
Int1_D8 7924197�7924264 68 I1full-f-24197-MluI ACGCGTCCTTAAATTAAGATTTATGTTAAATG
Int1_D9 7924228�7924264 37 I1full-f-24228-MluI ACGCGTTAAAACCAGCAGAGTTATG
Int1_D10 MluI plus CGCGTCAGCAGAGTTATGTATTGTTTTCTTTTTTAGG Int1_D10 7924234�7924264 31 Int1_D10 NheI minus CTAGCCTAAAAAAGAAAACAATACATAACTCTGCTGA
Int1_D11 MluI plus CGCGTAGTTATGTATTGTTTTCTTTTTTAGG Int1_D11 7924240�7924264 25 Int1_D11 NheI minus CTAGCCTAAAAAAGAAAACAATACATAACTA
Int1_D12 MluI plus CGCGTGTATTGTTTTCTTTTTTAGG Int1_D12 7924246�7924264 19 Int1_D12 NheI minus CTAGCCTAAAAAAGAAAACAATACA
C
MA
TE
RIA
LS A
ND
ME
TH
OD
S 36

Promoter
designation Position Size, bp Primers
Sequence
Int1_D13 MluI plus CGCGTTTTTCTTTTTTAGG Int1_D13 7924252�7924264 13 Int1_D13 NheI minus CTAGCCTAAAAAAGAAAAA
I1-if-start-MluI ACGCGTGTAGCAAATTTTTATTATTCTGATTGT Int1_D(1-13) 7923658�7924251 594 I1-24251-rev-NheI GCTAGCCAATACATAACTCTGCTGGTTTTAGAC
Int1_D13 mut1 plus CGCGTgggTCTTTTTTAGG Int1_D13_mut1 7924252�7924264 13 Int1_D13 mut1 minus CTAGCCTAAAAAAGAcccA
Int1_D13 mut2 plus CGCGTTTTgagTTTTTAGG Int1_D13_mut2 7924252�7924264 13 Int1_D13 mut2 minus CTAGCCTAAAAActcAAAA
Int1_D13 mut3 plus CGCGTTTTTCTgggTTAGG Int1_D13_mut3 7924252�7924264 13 Int1_D13 mut3 minus CTAGCCTAAcccAGAAAAA
Int1_D13 mut4 plus CGCGTTTTTCTTTTggctG Int1_D13_mut4 7924252�7924264 13 Int1_D13 mut4 minus CTAGCagccAAAAGAAAAA
The position numbers for the PPK fragments refer to the contig NT_022792.12. For the Int1_D2 – Int1_D9 constructs only the respective forward primers are indicated; the reverse primer for all mentioned fragments is the same as for Int1, namely, I1full-rev-NheI. The mutated nucleotides are lower case and in bold. Enzyme recognition sequences are italicized and underlined. For the Int1_D10 – Int1_D13 constructs and the mutants of the Int1_D13 construct plus and minus DNA-strand sequences contain five nucleotides of the respective enzyme recognition site at the 5'-end and a single nucleotide of the second enzyme recognition site at the 3'-end so that after annealing these fragments were ready for T4-ligation.
C
MA
TE
RIA
LS A
ND
ME
TH
OD
S 37

C MATERIALS AND METHODS 38
Mixtures for the first and nested PCR were set up according to Table C-2.
Table C-2. Composition of the PCR mixture used to amplify putative promoter regions.
Component Final concentration Volume
“10×PCR Buffer, Minus Mg” 1× 5 �l
10 mM dNTP mixture 0.2 mM 1 �l
50 mM MgSO4 2.0 mM 2 �l
10 µM forward primer 0.2 µM 1 �l
10 µM reverse primer 0.2 µM 1 �l
Platinum® Taq DNA Polymerase 1.0 unit 0.2 �l
Template - 1µl
H2O - 38.8 �l
In the first PCR E1i1E2, Int1, Joint, Dist1, Dist2, and Dist3 regions were amplified using as a
template human genomic DNA (BD Biosciences). In the second PCR 1�l of the respective
1. PCR mixture (1:10 dilution) served as a template. The PCR was carried out using the fol-
lowing thermal profile:
Denaturation 94 °C 2 min
Cycle (35 ×) Denaturation 94 °C 15 sec Annealing Tm � 2 °C (¤) 60 sec Elongation 68 °C 60 sec/1000 bp
Elongation 68 °C 5 min Storage 4 °C �
(¤) Tm refers to the primer with the lowest melting temperature used within a single PCR experiment
Ethanol precipitation of PCR products. Due to regions of high sequence similarity in the
putative distal promoter regions several PCR products were visualized by agarose gel
electrophoresis. To isolate the products with the expected size, two identical reaction mixtures
obtained by PCR were pooled and mixed with 3 M sodium acetate and absolute ethanol in a ratio
of 10:1:25, respectively. After 30 min centrifugation at 14,000 rpm at 4 °C the supernatant was
removed, and the pellet washed with 1 ml of 70 % ethanol followed by a second centrifugation.
The pellet was air-dried for 1-2 minutes and dissolved in 10 µl of the elution buffer (EB) (10
mM Tris-HCl, pH 8.5). The PCR products were visualized by agarose gel electrophoresis
(C.2.1.6) and bands with the expected size extracted from the gel using 10 µl of the EB
(C.2.1.7).

C MATERIALS AND METHODS 39
Int1_D2 – Int1_D9 and Int1_D(1-13) deletion variants were synthesized in a single PCR
according to the same protocol using Int1 fragment cloned into pSEAP2-Basic vector as a
template. 20 µl of each reaction mixture were separated by agarose gel electrophoresis, the PCR
product was extracted from the gel and eluted in 10 µl of the EB (C.2.1.6, C.2.1.7).
Finally, the PCR products were cloned into pCR4-TOPO vector (C.2.1.9) and sequenced.
Inserts with the correct sequence were cut out with MluI and NheI restriction enzymes, purified
and recloned into linearized pSEAP2-Basic vector (C.2.1.5 – C.2.1.8).
Prox_Enh_f, Prox_Enh_r and E1i1E2_Enh_f, E1i1E2_Enh_r constructs represented Prox and
E1i1E2 SEAP-plasmids, respectively, with the Dist3 promoter cloned in forward or reverse
orientation downstream to the SEAP gene. Briefly, SalI cohesive ends were added to the Dist3
promoter in a PCR using E(1a-2)-if-SalI and E(1a-2)-ir-SalI primers and Dist3 in pSEAP2-
vector as a template according to Table C-2. The PCR product was cloned into pCR4-TOPO
vector and sequenced. The Dist3 insert was cut out with SalI enzyme, purified and recloned into
Prox and E1i1E2 SEAP-constructs linearized with SalI. Restriction mapping was employed to
distinguish Prox(E1i1E2)_Enh plasmids with the Dist3 fragment cloned in forward or reverse
orientation (_f and _r, respectively).
Int1_D10 – Int1_D13 fragments and mutants of Int1_D13 were generated by annealing
corresponding plus and minus DNA-strands:
5 �l strand plus (100 pmol/�l)
5 �l strand minus (100 pmol/�l)
5 �l 200 mM Tris-HCl [pH 8.4], 500 mM KCl
35 �l H2O.
The annealing process was started by incubating the mixture for 10 min at 95 °C, then the
temperature was reduced every 15 min by 5 °C to 25 °C, the incubation was continued overnight.
7.5 �l of an annealing mixture were taken for ligation into linearized pSEAP2-Basic vector
(C.2.1.8).
The promoter activity was measured in the SEAP assay (C.2.3.1) after transient transfection
of the respective plasmid into mammalian cells (C.2.2.3).
C.2.1.3 Amplification of novel exons in the 5'-UTR of the human PPK gene
The 5�-end of the human PPK gene was amplified in two rounds of PCR using cDNA from
liver, kidney, testis, and pancreas (Human MTC Panel I and II, BD Bioscience) as templates.
Mixtures for the first and nested PCR were set up according to Table C-2. The following forward
and reverse primers were used in the first and second PCRs, respectively: E1a-f18 (5�-

C MATERIALS AND METHODS 40
CCCGAGAATGCACAAGGG-3�) and E1-r56 (5�-GCTTCTTGGAGGTGAGTCTCTT-3�); E1a-
f44 (5�-ATATGCCTACGTGCCCTTCTC-3�) and E1-r21 (5�-GAACGGTCTTCAAGCTGTTC-
3�). Two additional rounds of PCR were performed using cDNA from liver (BioCat) and the
following forward and reverse primers in the first and nested PCRs, respectively: E1a-f18 and
E1L-ir136 (5�-AACGGTCTTCAAGCTGTTCTAATGTG-3�); E1a-f44 and E1L-ir75 (5�-
GACTTTGGGTTTCTGCCAACAGTTT-3�). The amplified PCR products were cloned into
pCR4-TOPO vector (C.2.1.9); obtained plasmids were propagated in E. coli (C.2.1.12), purified
(C.2.1.14) and eventually sequenced.
C.2.1.4 Site-directed mutagenesis
For the site-directed mutagenesis of the PPK Prox promoter a megaprimer method was
employed (Sambrook & Russel, 2001). This method uses two rounds of PCR with three
oligonucleotide primers and one template cloned into two different vectors. The first round of
PCR is performed with a mutagenic primer containing desired base substitutions and with a
primer 1 that is complementary to the vector 1 flanking sequence, but cannot bind to the vector 2
(Figure C-8A). The product of this PCR – a megaprimer – is purified and used in the second
round of PCR along with a primer 2. Utilization of the template cloned into different vector
(vector 2) and in parallel inclusion of the primer 1 into the reaction mixture leads preferably to
amplification of the newly synthesized mutated DNA over the wild-type template (Figure C-8B).
Figure C-8. The principle of the megaprimer method.
A. Production of a megaprimer. B. Production of a mutated product.

C MATERIALS AND METHODS 41
Table C-3. Primers used in site-directed mutagenesis.
Name Position Sequence (5'����3')
T7 347-328 pCR4-TOPO
TAATACGACTCACTATAGGG
pSEAP _fPr
4648-4669 pSEAP2-Basic
TGCAGGTGCCAGAACATTTCTC
IM01_Pr 7923472-7923433 GCTGTTAAGTATATGCCAGCTTTCAGGGAGTGATGTCAGC
IM02_Pr 7923481-7923441 CCGTGTTCAGCTGTTAATGCGCGTAACTATTTCAGGGAGTG
IM03_Pr 7923486-7923445 CCTATCCGTGTTCAGCGTGGCCGTATATTAACTATTTCAGGG
IM04_Pr 7923496-7923455 CCATGAACATCCTATCCGTGGGACTATGTTAAGTATATTAAC
IM05_Pr 7923496-7923464 CCATGAACATCCTAGAATGTTTCAGCTGTTAAG
IM06_Pr 7923538-7923573 CCCAAAGTCAAGCGTGCCTCCAAGCAAAATATTGCC
IM09_Pr 7923418-7923455 CCTATTCCTATTCTTGCGTCACGCACTCCCTGAAATAG
IM10_Pr 7923424-7923464 CCTATTCTTGCTGACATACAGAACTGAAATAGTTAATATAC
IM11_Pr 7923433-7923472 GCTGACATCACTCCAGTCCCTAGTTAATATACTTAACAGC
IM12_Pr 7923469-7923505 CAGCTGAACACGGAGCTTCGGTTCATGGAATATGTTG
IM13_Pr 7923477-7923510 CACGGATAGGATTGGACGGGAATATGTTGACAGG
IM14_Pr 7923479-7923512 CGGATAGGATGTTCATTTCCGCTGTTGACAGGAC
IM15_Pr 7923485-7923521 GGATGTTCATGGAATAGTGGTCCAGGACAAAAAGTTG
IM16_Pr 7923485-7923527 GGATGTTCATGGAATATGTTGAACTTCAAAAAAGTTGAAACTG
IM17_Pr 7923502-7923532 GTTGACAGGACACCCCTTTGAAACTGTTGGC
IM18_Pr 7923509-7923544 GGACAAAAAGGGTCCCCTGTTGGCAGAAACCCAAAG
IM19_Pr 7923509-7923544 GGACAAAAAGTTGAAAAGTGGTGCAGAAACCCAAAG
IM20_Pr 7923518-7923549 GTTGAAACTGTTGTACTCCACCCAAAGTCAAT
IM21_Pr 7923525-7923561 CTGTTGGCAGAACAAACCAGTCAATATTGAAGCCAAG
IM22_Pr 7923530-7923562 GGCAGAAACCCAACTGACCTATTGAAGCCAAGC
IM23_Pr 7923544-7923580 GTCAATATTGAAGAACCTCAAAATATTGCCTGCAGTG
IM24_Pr 7923553-7923582 GAAGCCAAGACCCCTATTGCCTGCAGTGCC
IM25_Pr 7923553-7923589 GAAGCCAAGCAAAATCGGTAAGGCAGTGCCACATTAG
IM26_Pr 7923557-7923595 CCAAGCAAAATATTGCCTTACTGTACACATTAGAACAGC
IM27_Pr 7923569-7923601 TTGCCTGCAGTGCACACGGAGAACAGCTTGAAG
IM28_Pr 7923578-7923611 GTGCCACATTAGCAAGCGATGAAGACCGTTCAGC
The position numbers for mutagenic primers refer to the contig NT_022792.12 Mutated nucleotides are in bold and underlined.

C MATERIALS AND METHODS 42
The mutagenic primers were 35-40 bases long; and the mutated region, typically 5-7 bases in
length, was located in the middle of the primer (Table C-3). As a general rule, bases were
exchanged according to CBA, GBT, thus each substitution introduced a transversion.
The first PCR with the mutagenic internal primer and the first flanking primer (Table C-3)
was performed according to Table C-4.
Table C-4. Composition of the PCR mixture used for megaprimer production.
Component Final concentration Volume
“10×PCR Buffer, Minus Mg” 1× 5 �l
10 mM dNTP mixture 0.2 mM 1 �l
50 mM MgSO4 2.0 mM 2 �l
10 µM T7 primer 0.2 µM 1 �l
10 µM mutagenic primer 0.2 µM 1 �l
Platinum® Taq DNA Polymerase 1.0 unit 0.2 �l
Prox in pCR4-TOPO 0.5 µg -
H2O - to 50 �l
Thermal cycling program:
Denaturation 94 °C 2 min
Cycle (25 ×) Denaturation 94 °C 30 sec Annealing Tm � 2 °C (¤) 30 sec Elongation 68 °C 60 sec/1000 bp
Elongation 68 °C 5 min Storage 4 °C �
(¤) Tm refers to the primer with the lowest melting temperature used within a single PCR experiment
The product of this PCR - the megaprimer - was purified as described in section C.2.1.7 and
eluted in 10 µl of the EB. The reaction mixture of the PCR 2 was set up according to Table C-5.
The final PCR product containing the desired mutation was purified by agarose gel
electrophoresis (C.2.1.7). 9 µl of the eluted fragment was incubated with MluI and NheI enzymes
overnight (C.2.1.5) again followed by agarose gel separation and DNA extraction. Finally, the
derived fragment with cohesive ends was ligated with linearized pSEAP2-Basic × (MluI/ NheI)
plasmid followed by cloning and sequencing (C.2.1.8 - C.2.1.15).

C MATERIALS AND METHODS 43
Table C-5. Composition of the PCR mixture for mutant production.
Component Final concentration Volume “10×PCR Buffer, Minus Mg” 1× 5 �l 10 mM dNTP mixture 0.2 mM 1 �l 50 mM MgSO4 2.0 mM 2 �l 10 pM T7 primer 0.2 pM 1 �l 10 µM pSEAP_fPr 0.2 µM 1 �l Megaprimer - 5 µl Platinum® Taq DNA Polymerase 1.0 unit 0.2 �l Prox in pSEAP2-Basic 0.5 µg - H2O - to 50 �l
Thermal cycling program:
Denaturation 94 °C 2 min
Cycle (35 ×) Denaturation 94 °C 30 sec Annealing 53 °C 60 sec Elongation 68 °C 70 sec
Elongation 68 °C 5 min Storage 4 °C � Originally, five first mutations (IM01 − IM05) were introduced into D3 construct and
afterwards into the Prox promoter. To minimize the size of the megaprimer for these five
mutants, the first PCR was carried out with the pSEAP_fPr flanking primer as being the closest
to the position of the introduced mutations. Accordingly, in the first PCR the template was D3
(or later Prox) in pSEAP2-Basic and D3 (Prox) in pCR4-TOPO in the second PCR. Therefore,
the respective mutagenic primers had a reverse orientation in comparison with the rest.
The Prox promoter in pSEAP2-Basic vector with an introduced mutation was designated
IM##, where IM stands for the inserted mutation and ## for the number of a respective mutation.
In the case of five mutations within the D3 region the principle was similar: D3_IM0#.
C.2.1.5 DNA cleavage with restriction endonucleases
Plasmids of interest were cleaved by restriction enzymes either to check the size of an insert,
or to cut out a desired DNA fragment, or to linearize a vector. Optimal reaction conditions were
chosen depending on the respective restriction endonuclease according to the supplier’s
information. The reaction mixture was set up on ice according to the general protocol below.

C MATERIALS AND METHODS 44
Depending on the downstream applications DNA was digested at 37 °C for about 2 h or
overnight.
Protocol for DNA restriction DNA 2 - 10 �g Restrictase(s) à 10 units 10�Buffer 2 �l 100�BSA (if needed) 0.2 µl H2O to 20 �l
C.2.1.6 Agarose gel electrophoresis
Agarose was dissolved in TAE buffer (40 mM Tris�acetate, 1 mM EDTA, pH 8.0) in a
microwave oven. The final concentration of agarose was 0.5 – 2.5 % depending on the size of
DNA fragments to be separated. Ethidium bromide was added to a final concentration of 1 µg/ml
for later visualization of the DNA under UV light. To control the separation during the run, the
samples were mixed with 6�Loading Dye (Qiagen) in a 5:1 ratio. Electrophoretic separation was
achieved in TAE buffer at RT for about 1 h at 140 V. Bands were visualized by UV light (312
nm), and the size of the fragments was determined by comparing their mobility with that of DNA
standards. If needed, UV illumination was carried out as short as possible to avoid DNA
degradation.
C.2.1.7 Extraction of DNA fragments from low-melting agarose gel
After separation of the DNA fragments by agarose gel electrophoresis the band corresponding
to the fragment of interest was isolated using either MinElute™ or QIAEX® II gel extraction kits
(for DNA fragments shorter or longer than 4 kbp, respectively). MinElute column uses a
specialized silica-gel membrane, whereas the QIAEX II employs silica-gel particles. In both
protocols the band of interest is cut out with a scalpel from the low-melting agarose gel, and the
gel slice is solubilized by addition of a buffer. The high concentration of chaotropic ions causes
disruption of hydrogen bonds between sugars in the agarose polymer and promotes the
dissociation of DNA binding proteins from the DNA fragments. The DNA fragment is
selectively bound to the silica-gel membrane/particles by shaking for 10 min at 50 °C. A
repeated wash with the first high salt buffer removes residual agarose, and two washes with
ethanol-containing buffer efficiently remove salt contaminants. Any residual ethanol-containing
buffer, which may interfere with subsequent enzymatic reactions, is removed by an additional
centrifugation step. DNA is eluted with the EB, as elution is most efficient under basic
conditions and low salt concentrations.

C MATERIALS AND METHODS 45
C.2.1.8 Ligation of DNA fragments
Typically, the ligation reaction was set up on ice in a final volume of 10 µl. 100 ng (20-50
fmol) of a linearized plasmid was mixed with a 10 molar excess of the insert with appropriate
cohesive ends. Then 1 µl (1 U/µl) of T4 ligase as well as 1 µl of 10× T4 ligase buffer (660 mM
Tris-HCl, 50 mM MgCl2, 10 mM DET, 10 mM ATP, pH 7.5) was added. The ligation mixture
was incubated at 16 °C for 2-3 h in a waterbath.
C.2.1.9 TOPO TA cloning system
The TOPO TA cloning reaction was generally set up according to the following protocol: 2 µl
of a fresh PCR product, 1 µl of 1:4 diluted salt solution (1.2 M NaCl, 0.06 M MgCl2), 1 µl of
pCR4-TOPO vector and 2 µl of H2O to the final volume of 6 µl. In some cases 4 µl of a PCR
product and no water were used. After 10-15 min incubation at RT, the reaction was placed on
ice and immediately used for transformation of competent cells (C.2.1.10)
C.2.1.10 Preparation of E. coli competent cells
The E. coli competent cells were either purchased ready to use (Top10, Invitrogen) or
prepared and stored frozen (B834, Novagen). For preparation of competent cells, a glycerol
stock of the B834 strain was used to inoculate 5 ml of dYT-medium (16 g/l bacto-tryptone,
10 g/l bacto-yeast extract, 5 g/l NaCl). After overnight incubation at 37 °C and 220 rpm shaking,
5 ml of the culture was inoculated into 500 ml of dYT-medium (1:100) in a sterile 2-liter flask.
The cells were further grown at 37 °C under shaking at 220 rpm to an OD600 of 0.5 to 0.7. Then
the cells were chilled on ice for about 15 min and transferred to a prechilled 1-liter centrifuge
bottle. After 20 min centrifugation at 4200 rpm at 4 °C the supernatant was decanted, and the
pellet was washed twice with 250 ml autoclaved ice-cold HPLC water. After the second wash
the pellet was resuspended in 40 ml ice-cold sterile 10 % glycerol, and the suspension was
placed in a 50 ml polypropylene conical tube followed by 10 min centrifugation at 4200 rpm at
4 °C. Finally, the pellet volume (usually ~500 µl from a 500-ml culture) was estimated and an
equal volume of ice-cold 10 % glycerol was added to resuspend the cells (on ice). 50 µl aliquots
of cells were frozen on dry ice and stored at �80 °C.
C.2.1.11 Culture of E. coli strains
dYT growth medium was sterilized by autoclaving for 20 min at a pressure of 1.2 x 10⁵ Pa
and a temperature of 121 °C. The ampicillin stock solution (200 mg/ml in 70 % ethanol) was
aliquoted and stored at �20 °C; it was added to the media to the final concentration 200 µg/ml at
a temperature below 50 oC. For preparation of dYT-plates the media was supplemented with

C MATERIALS AND METHODS 46
15 g/l agar just before autoclaving. For short term storage the strains were spread onto agar
plates containing ampicillin and then stored at 4 °C (for not longer than 4 weeks).
C.2.1.12 Transformation of E. coli
Transformation of E. coli strains was performed by electroporation.
2 µl of the TOPO TA cloning reaction (C.2.1.9) or 1 µl of 1:100 dilution of a T4-ligation
mixture (C.2.1.8) or about 50 ng of a plasmid was added to 50 �l of electrocompetent cells
(E. coli Top10, Invitrogen, or B834, Novagen) and mixed gently (but not by pipetting up and
down). Then the solution was carefully transferred to a 0.1 cm cuvette avoiding formation of
bubbles and electroporated using the following parameters: the pulse controller at 200 C, the
capacitance extender at 250 C, the gene pulser apparatus at 25 µF and 2.5 kV. The observed time
constant typically varied from 3.9 to 4.1. Immediately after 250 µl of room temperature SOC
medium (20 g/l bacto-tryptone, 5 g/l bacto-yeast extract, 10 mM MgCl2, 20 mM glucose, 10 mM
NaCl, 10 mM KCl, pH 7.0) was added. The solution was transferred to a clean 1.5 ml
microcentrifuge tube and shaken for 1 h at 37 °C to allow expression of the ampicillin resistance
gene. After incubation 5 µl and 50 µl from each transformation were spread on a prewarmed
dYT-plate containing 200 µg/ml ampicillin and incubated overnight at 37 °C. Two different
volumes were spread to ensure that at least one plate would have well-spaced colonies.
C.2.1.13 PCR screening of E. coli clones
To check if a chosen cell colony contained an insert of the correct size, PCR screening was
employed. The reaction master mixture with appropriate primers was prepared on ice according
to Table C-6, and aliquots of 12.5 µl were pipetted into 0.2 ml tubes. A small part of each colony
was picked with a plastic tip from the agarose patch plate made the day before and suspended in
the reaction mixture.
Table C-6. Composition of the colony-PCR for one sample.
Component Final concentration Volume
“10×PCR Buffer, Minus Mg” 1× 1.25 �l
10 mM dNTP mixture 0.2 mM 0.25 �l
50 mM MgCl2 1.5 mM 0.375 �l
10 µM forward primer 0.2 µM 0.25 �l
10 µM reverse primer 0.2 µM 0.25 �l
Platinum® Taq DNA Polymerase 0.25 units 0.05 �l
H2O - to 12.5 �l

C MATERIALS AND METHODS 47
The PCR was carried out according to the following thermal cycling program: Denaturation 94 °C 5 min
Cycle (25 ×) Denaturation 94 °C 30 sec Annealing Tm � 2 °C (¤) 30 sec Elongation 72 °C 60 sec/1000 bp
Elongation 72 °C 5 min Storage 4 °C �
(¤) Tm refers to the primer with the lowest melting temperature used within a single PCR experiment
Analysis of the PCR products was performed by agarose gel electrophoresis (C.2.1.6).
C.2.1.14 Plasmid preparation from E. coli
For most purposes, like DNA sequencing, testing recombinant DNA by endonuclease
digestion or transfection of mammalian cells, plasmid DNA was prepared from 6 ml overnight
cultures of transformed E. coli using the QIAGEN Plasmid Mini kit. This kit uses a modified
alkaline lysis procedure protocol based on Birnboim & Doly (1979).
Isolation was performed according to the protocol. Briefly, bacteria were lysed under alkaline
conditions in the presence of RNase A, and the lysate was subsequently neutralized. Separation
of plasmid from chromosomal DNA is based on coprecipitation of the cell wall-bound
chromosomal DNA with the insoluble complexes containing salt, detergent, and protein; plasmid
DNA remains in the clear supernatant. The precipitated debris was removed by high speed
centrifugation and the cleared lysate was loaded onto a pre-equilibrated QIAGEN-tip by gravity
flow. The QIAGEN-tip was then washed four times in order to completely remove any
remaining contaminants, such as traces of RNA and protein, without affecting the binding of the
plasmid DNA. Then the plasmid was eluted from the tip and subsequently desalted and
concentrated by isopropanol precipitation. Finally, the pellet was washed with 70 % ethanol,
briefly air-dried and resuspended in 20 µl of the EB.
For preparing larger amounts of a plasmid transformed E. coli were grown in 25 ml of culture
medium (dYT with 200 µg/ml ampicillin) and isolated by the QIAfilter Plasmid Midi kit. In this
protocol, QIAfilter cartridges are used instead of conventional centrifugation to clear bacterial
lysates more efficiently. The pelleted DNA was resuspended in 100 µl of the EB.
C.2.1.15 Determination of DNA and RNA concentration
The concentration of DNA or RNA was determined spectrophotometrically by measuring the
absorbance at 260 nm. For this purpose 1 �l of a sample was dissolved in 99 �l of water. An OD
of 1 corresponds to ~50 µg/ml for double-stranded DNA, ~40 µg/ml for single-stranded DNA

C MATERIALS AND METHODS 48
and RNA, and ~33 µg/ml for single-stranded oligonucleotides. The final concentration was
calculated by the equation:
CDNA (�g/µl) = COD=1 �g/ml × dilution factor (×100) × OD260,
where COD=1 is the DNA concentration at OD=1. To check the purity of the preparation, the
absorbance of samples was measured at several wavelengths. The OD260/280 ratio should be about
1.8 (1.6 � 2.0), the OD230/260 ratio < 0.6, and OD320 ideally 0.0.
C.2.2 Cell culture methods
C.2.2.1 Culture of mammalian cells
All cell lines were grown as adherent monolayers at 37 °C, 5 % CO2/air. HepG2 and
HEK-293 were cultured in RPMI 1640 (without L-Glutamine, with 2 g/l NaHCO3)
supplemented with 10 % fetal calf serum (FCS) and 10 mM L-glutamine and DMEM (high
glucose with L-glutamine) supplemented with 10 % FCS and 100 Unit·ml-1/100 �g·ml-1 peni-
cillin-streptomycin, respectively. IHKE1 cells were cultured in HAM’s F12 and Dulbecco’s
modified Eagle’s medium 1:1 supplemented with 15 mM HEPES, 100,000 U/l penicillin and
100 mg/l streptomycin, 10 µg/l epidermal growth factor, 36 µg/l hydrocortisone, 1 % FCS,
1.25 g/l NaHCO3, 5 mg/l insulin, 5 mg/l transferrin, 5 µg/l Na+ selenite, 55 mg/l Na+pyruvate
and 2 mM L-glutamine. Culture medium was exchanged twice a week. Cells were normally
subcultured twice a week according to the following procedure: after removing the old medium,
cells were washed with PBS. Subsequently, the appropriate volume of trypsin/EDTA solution
(0.05/0.02 % dissolved in PBS without Ca2+, Mg2+) was added to the culture flasks and the cells
were incubated at 37 C for 3-10 min. Trypsinization was stopped by resuspending the cells in
complete growth media. Cells were spun down at 700 g for 5 min. After removing the old medi-
um the cells were resuspended in fresh medium and plated on cell culture plates for experiments.
C.2.2.2 Cell freezing and thawing
Cells were spun down under sterile conditions for 5 min at 700 g. The cell pellet was
maintained on ice and carefully resuspended in cold freezing medium (1. RPMI with 10 % FCS,
10 mM L-glutamine and 6 % dimethylsulfoxid (DMSO) for HepG2; 2. HAM’s F12/ Dulbecco’s
modified Eagle’s medium (1:1) with 10 % FCS and 10 % DMSO for IHKE1; 3. DMEM with
10 % FCS, penicillin-streptomycin and 7 % DMSO for HEK-293) by pipetting the suspension
repeatedly up and down. 1.5 ml aliquots were quickly dispensed into freezing vials (4 °C). The
cells were slowly frozen at –20 °C for 1 h and then at –80 °C overnight. On the next day they
were transferred to liquid nitrogen.

C MATERIALS AND METHODS 49
In order to thaw cells a freezing vial was removed from liquid nitrogen and put in a waterbath
at 37 °C. The cells were then dispensed in 5 ml of warm complete growth medium and spun
down at 700 g for 5 min. Then the old medium was removed and the cells were resuspended in
fresh medium. The medium was changed once more after 24 h.
C.2.2.3 Transient transfection of cells
After a number of optimization steps the following transient transfection protocol was used
for all types of cells. The cells were grown overnight on 12-well plates at 37 °C to 50–70 %
confluence. On the next morning the medium was replaced by 0.9 ml of the respective fresh
medium supplemented with FCS. 100 µl of the respective serum-free medium, 1 µg of plasmid
of interest, 50 ng of pCMV-�-gal plasmid and 3 µl of the FuGENE 6 reagent were mixed in a 1.5
ml tube. This mixture was incubated at RT for 20 min. Then the mixture was added dropwise
directly to the cells resulting in a total volume of 1 ml. After 48 h cells were processed in the
subsequent experiments.
C.2.2.4 Stable transfection of HEK-293 cells
For stable transfection the Flp-In™ system (Invitrogen) was used (C.1.4.4). The used Flp
expression vector represented a pcDNA5/FRT plasmid with an inserted SEAP gene under
control of the PPK Joint or E1i1E2 promoters instead of the CMV promoter. To obtain this
plasmid, two oligonucleotides 5�-CTAGAGTCGGGGCGGCCGGCCGCTTCGAGCAGACAT
GAGC-3� and 5�-GGCCGCTCATGTCTGCTCGAAGCGGCCGGCCGCCCCGACT-3� were
designed so that by annealing a double stranded oligonucleotide was obtained with 5�- and 3�-
protruding ends, representing XbaI and NotI restriction half sites. The pcDNA5/FRT vector was
digested with MluI and NotI to remove the CMV promoter. The Joint and E1i1E2 promoters
together with SEAP gene were cut out with MluI and XbaI restrictases from the respective SEAP
construct (cf. C.2.1.2). A subsequent ligation of the pcDNA5/FRT � (MluI/NotI) backbone, the
PPK promoter�SEAP � (MluI/XbaI) fragment and the oligonucleotide described above yielded
the desired Flp expression vector.
HEK-293 cells were transfected according to the following protocol: 100 µl of serum-free
medium, 1.6 µg of pOG44, 0.4 µg of the pcDNA/FRT plasmid of interest and 5 µl of the
FuGENE 6 reagent were mixed in a well of a 96-well plate. This mixture was incubated at 37 °C
for 15 min. Then the mixture was added dropwise directly to the cells (with < 60 % confluence)
growing on 12-well plates in complete DMEM supplemented with FCS.
On the next day the cells were trypsinized and transferred to a 100-mm dish. After 2 days
selection of stably transfected cells was started by adding hygromycin B to the medium to obtain

C MATERIALS AND METHODS 50
a final concentration of 250 µg/ml. After 3 days the medium was changed and cells were
incubated without hygromycin.
Approximately 12 days after transfection about 10 clones were observed. The clones were
transferred to a 12-well plate by picking with a plastic tip. When enough cells were available, the
SEAP activity was estimated (C.2.3.1). Clones exhibiting similarly high SEAP activity were
considered to represent a single insertion of the pcDNA5/FRT vector containing the SEAP gene
under control of the respective PPK promoter at the recombinase target site. Cells with twice as
much SEAP activity were presumed to have an additional insertion of the vector (rare), clones
with less SEAP activity were assumed to be inhomogenous and were discarded.
C.2.2.5 siRNA transfection of HepG2 cells
siRNA transfection of HepG2 cells (1�105 cells, 12-well plate format) was performed using
5 �l of HiPerFect transfection reagent (Qiagen, Hilden, Germany) according to the fast protocol
provided by the manufacturer. NF1-A, NF1-B, and NF1-C siRNAs were designed using
GenScript siRNA Target Finder. Potent siRNA was then selected from the list of siRNA
candidate targets using an algorithm developed by Reynolds and colleagues (Reynolds et al.,
2004). NF1 expression was knocked down using 25 nM siRNA specific for the NF1-A,
d(XY)CAAGTGACGCTGACATTAAd(TT), NF1-B, d(XY)GCCAACCATACTATCATGAC
Ad(TT), NF1-C, d(XY)ATGGACAAGTCACCATTC-Ad(TT), and NF1-X (Hs_NFIX_5, Cat.
No. SI03246621, Qiagen). siRNA sense strands are given. A non-silencing 3' Alexa Fluor 488
labeled siRNA (Cat. No. 1022563, Qiagen) was used as control for transfection efficiency as
well as negative control for monitoring the effect of NF1 knock-down. Efficiency of the NF1
silencing and its effect on PPK expression level was quantified by quantitative real-time PCR
(C.2.7).
C.2.3 Chemiluminescent assays
C.2.3.1 SEAP assay
The Great EscAPe system uses SEAP � a secreted form of human placental alkaline
phosphatase � as a reporter molecule to monitor the activity of promoters and enhancers cloned
into the pSEAP2-Basic vector. The SEAP reporter gene encodes a truncated form of the
placental enzyme that lacks the membrane anchoring domain, thereby allowing the protein to be
efficiently secreted from transfected cells. Thus, SEAP activity can be detected directly in the
culture medium without preparation of cell lysates. Another advantage of the enzyme is an

C MATERIALS AND METHODS 51
extreme heat stability; therefore, after heat pretreatment a background from endogenous alkaline
phosphatase is almost absent in the culture medium.
48 hours after transient transfection, 200 µl of conditioned cell culture medium was removed
from each sample and transferred into a 1.5 ml Eppendorf tube. After 5 min centrifugation at
14,000 rpm 150 µl of supernatant were transferred to a fresh tube. Then 15-µl aliquots from each
cell culture supernatant were transferred into the wells of an opaque 96-well microtest plate;
45 µl of 1� “Dilution buffer” was added, and the plate was incubated for 60 min at 65 C to
inactivate endogenous alkaline phosphatase. After cooling, 60 µl of “Assay buffer” and, after
5 min at RT, 60 µl of “CSPD substrate” solution were added. The luminescence was quantified
after 10-20 min using a Tecan Safire2 plate luminometer. Light signals were recorded as 5-
seconds integrals.
Each different construct was transfected and subsequently assayed in triplicate in each single
experiment, 3�5 experiments were performed. Medium from untransfected cells was assayed to
determine background signals associated with the cell culture media; the values obtained were
subtracted from experimental results.
Additionally, a number of controls were included in each experiment. To evaluate the
contribution of the vector itself, the pSEAP2-Basic vector containing the SEAP gene without
any promoter was taken as the negative control. Culture medium from cells transfected with the
pSEAP2-Control vector, which contains the SEAP gene under control of the SV40 promoter and
enhancer, served as the positive control for transfection and expression of exogenous DNA. 1 µl
of the “Positive control placental alkaline phosphatase” mixed with the medium from
untransfected cells served as the positive control for the assay. Finally, as an internal control for
transfection efficiency, 0.05 µg of pCMV-�-gal plasmid was cotransfected with 1 µg of each
expression vector in each experiment and assayed in the �-Gal assay (C.2.3.2).
C.2.3.2 Luminescent &-galactosidase assay
�-galactosidase under the control of the constitutive CMV promoter was cotransfected with
SEAP reporter plasmids when monitoring the SEAP reporter gene expression was the final goal
of the transfection. Levels of the �-galactosidase activity in the cell lysates were used to
normalize levels of SEAP activity in the respective supernatants in order to correct for variations
in the transfection efficiency, thus allowing reliable comparison within each experiment.
After removing 200 µl of the cell supernatant for the SEAP assay the remaining medium was
aspirated and 300 µl of the detergent lysis solution (100 mM potassium phosphate, pH 7.8,
0.2 % Triton X-100, 1 mM DTT) was added into each well. After 5 min incubation at RT lysed
C MATERIALS AND METHODS 52
cells were detached from the plate using a cell scraper and transferred in the lysis solution into
1.5 ml eppendorf tubes. Then cell lysates were centrifuged at 14,000 rpm for 5 min to pellet
debris; supernatants were transferred to fresh microcentrifuge tubes and assayed immediately for
�-galactosidase activity.
10 µl each of individual cell lysates were pipetted into the wells of an opaque 96-well, flat-
bottom microtiter plate and mixed with 100 µl of a mixture consisting of 2 �l of the “Reaction
substrate” and 98 �l of the “Reaction buffer”. The luminescence was quantified after 1 h
incubation using a Tecan Safire2�plate luminometer. Light emission was recorded as 5-seconds
integrals.
The background was determined by assaying three cell lysates from untransfected cells, the
mean value was subtracted from each experimental result. The resulting values of
�-galactosidase activity were used to normalize the SEAP activity for each single well.
C.2.4 Isolation of total RNA
Purification of total RNA from the cultured cells was carried out using RNeasy Mini kit
(Qiagen). Untransfected or stably transfected cells grown to confluence in 75-cm2 flasks and
transiently transfected cells grown in 12-well plates 48 h after transfection were harvested by
trypsination. Samples (maximum 1�107 cells) were disrupted in a highly denaturing guanidine
isothiocyanate containing buffer, which immediately inactivated RNases to ensure isolation of
intact RNA, and then homogenized using QIAshredder spin columns. Ethanol was added to the
lysates creating conditions that promoted selective binding of RNA to the RNeasy silica-gel
membrane. The samples were then applied to the RNeasy mini column. The total RNA bound to
the membrane was washed efficiently, and the RNA was eluted in RNase-free water. All
binding, washing, and elution steps were performed by centrifugation in a microcentrifuge.
Purified RNA was immediately used for cDNA synthesis (C.2.5) or RLM-RACE (C.2.6) and the
rest stored at �80°C.
C.2.5 cDNA synthesis
The QuantiTect Reverse Transcription kit was used for elimination of genomic DNA from
RNA samples and subsequent reverse transcription.
To eliminate the genomic DNA, 0.5 �g of each RNA sample was incubated in “gDNA
Wipeout buffer” for 3 min at 42 °C (end volume 14 �l). After cooling on ice for several minutes,
the RNA sample was taken for reverse transcription using a master mix prepared from
“Quantiscript reverse transcriptase”, 4 �l of 5� “Quantiscript RT buffer”, and 1 �l of “RT primer
mix”. The reaction mixture was incubated for 20 min at 42 °C and then inactivated for 3 min at

C MATERIALS AND METHODS 53
95 °C. The synthesized cDNA was used directly in quantitative real-time PCR (C.2.7) or stored
at -20 °C.
C.2.6 RNA ligase-mediated amplification of 5'-cDNA ends (RLM-RACE)
Transcription start sites were determined by performing RLM-RACE (Invitrogen). The RLM-
RACE technique uses a protocol ensuring that only full-length 5'-ends of mRNA molecules with
an intact cap structure are reverse transcribed and amplified by nested PCR.
The method is outlined in Figure C-9. Total RNA or mRNA is treated with calf intestinal
phosphatase (CIP), which removes the 5' phosphate thus eliminating truncated mRNA and non-
mRNA from subsequent ligation with the RNA adaptor oligonucleotide. Full-length mRNA
which is protected by the cap structure is not affected by CIP. In subsequent steps the cap
structure is removed and replaced with the RNA adaptor oligonucleotide. Firstly, RNA is treated
with tobacco acid pyrophosphatase (TAP), which removes the cap structure from full-length
mRNA. This exposes the 5' phosphate and permits ligation of the RNA adaptor oligonucleotide
by T4 RNA ligase. Then a cDNA template is generated by reverse transcription using
“SuperScript III reverse transcriptase” and random primers. During reverse transcription the
RNA adaptor oligonucleotide is incorporated into the cDNA. Only cDNA that is completely
reversed transcribed will contain this known sequence. PCR is then performed using the
homologous adaptor primer (GR 5' primer) and a gene-specific primer. The resulting PCR
product contains the 5'-full-length cDNA sequence.
RLM-RACE was performed with either 250 ng of poly(A)+ mRNA from human (liver,
pancreas, kidney) and from mouse (liver, kidney) tissues or from 5 µg of total RNA from human
liver or from HepG2, IHKE1 and HEK-293 cells. Nested PCR was used to increase the
specificity and sensitivity. First and second PCRs were set up as described in Table C-7.

C MATERIALS AND METHODS 54
Figure C-9. RLM-RACE outline. m7G-p-p-p, 7-methylguanosine triphosphate (5; cap structure); CIP, calf intestinal phosphatase; TAP, tobacco acid pyrophosphatase; TSS, transcriptional start site; GR 5� (N) Pr, GeneRacer 5� (nested) primer; GSP (N), (nested) gene specific primer.

C MATERIALS AND METHODS 55
Table C-7. Composition of the first and second PCR used to amplify 5'-ends of cDNA.
Component Final concentration Volume
“10×PCR Buffer, Minus Mg” 1× 5 �l
10 mM dNTP mixture 0.2 mM 1 �l
50 mM MgSO4 2.0 mM 2 �l
10 µM GR 5' (nested) primer 0.2 µM 1 �l
10 µM reverse (nested) primer 0.2 µM 1 �l
Platinum® Taq DNA Polymerase 1.0 unit 0.2 �l
H2O - to 49 �l
1 �l of the RACE-ready cDNA served as a template in the first PCR, and 1 �l of the mixture
of the first PCR (1:10 dilution) in the second round. Primers used to amplify the fragment of
interest are listed in Table C-8. The two PCRs were carried out according to the following
thermal cycling program:
Denaturation
94 °C 2 min
Cycle (35 ×) Denaturation 94 °C 15 sec Annealing (1. PCR/2. PCR) 65 °C/ 62 °C 30 sec Elongation
68 °C 60 sec/1000 bp
Elongation 68 °C 10 min Storage 4 °C �
After visualization by agarose gel electrophoresis the PCR products were cloned into
pCR4-TOPO vector. TSSs were determined by sequencing of selected transformants as the first
nucleotide following the adaptor oligo.
Presumably because the copy number of the PPK mRNA in mouse tissues is very low no
bands were visible after nested or booster PCR. Therefore, for every sample with mouse cDNA
as a template two identical reaction mixtures obtained by PCR were pooled and concentrated by
ethanol precipitation (C.2.1.2). The pellet was dissolved in 4 µl of the EB and subsequently
completely used for TOPO TA cloning.

C MATERIALS AND METHODS 56
Table C-8. Primers used in RLM-RACE.
Designation Position Sequence (5'����3') GR 5� primer adaptor CGACTGGAGCACGAGGACACTGA GR 5� nested primer
adaptor GGACACTGACATGGACTGAAGGAGTA
Human
hE1a-or71 hE1a 7905326-7905305 GCCAGCAGAGAAGGGCACGTAG
hE1a-ir47 hE1a 7905302-7905279 ATATGGATGGCGCCCTTGTGCATT
hE1L-or178 hE1 7923649-7923622 ACAATTGCTTCTTGGAGGTGAGTCTCTT
hE1L-ir168 hE1 7923639-7923612 CTTGGAGGTGAGTCTCTTGTCACTTAAA
Mouse
mP-or9146 mE1a 5209146-5209120 GAGGTCCAGCAGAAAATGGCACATAGG
mP-ir9126 mE1a 5209126-5209100 ACATAGGCATAGGGATGGCGTCCTTGG
mP-or22799 mE1c 5222799-5222777 CCTGGAAGGATGGTCACGTTGTG
mP-ir22771 mE1c 5222771-5222744 GGAGGAGAGGGAGTCTTCACATGAAGAT
pSEAP2-Basic
SE-or171 171-149 CGGTTCCAGAAGTCCGGGTTCTC
SE-ir154 154-131 GTTCTCCTCCTCAACTGGGATGAT
The position numbers refer for human to contig NT_022792.12 and for mouse to PPK mRNA NW_000342.1
C.2.7 Quantitative real-time PCR
Gene expression level was analyzed by quantitative real-time PCR on the LightCycler 2.0
system using Universal Probe Library approach and LightCycler TaqMan Master (Roche).
The Universal ProbeLibrary applies the hydrolysis probe format: a sequence-specific probe is
designed to anneal in-between the primer sites and labeled with a fluorescent reporter dye at the
5'-end and a quencher label at the 3'-end. When the probe is hybridized to its target sequence, the
quencher label suppressing the fluorescent signal in intact probe is cleaved by the 5'D3'
exonuclease activity of the FastStart Taq DNA polymerase. This results in “unquenching” the
fluorescent reporter dye and subsequent fluorescent signal detection. The universality of the
Universal ProbeLibrary set has been achieved by shortening the length of such probes to 8-9
nucleotides which is possible by using the DNA analogue LNA (locked nucleic acid). LNA is a
modified ribonucleoside forming a bicyclic structure; hybrids between LNA oligonucleotides

C MATERIALS AND METHODS 57
and complementary DNA exhibit unprecedented thermal stabilities thus allowing the Universal
Probes to be short.
For the selection of Universal Probes and the design of primers for quantitative real-time PCR
of gene transcripts the web-based Probe-Finder software (www.universalprobelibrary.com) was
used. An intron-spanning assay was employed wherever possible. Target genes with the
respective Universal Probes and primers are summarized in Table C-9.
Table C-9. Gene transcripts, Universal Probes and primers used in quantitative real-time PCR.
Primer Gene transcript
Universal Probe Name Sequence
UPL PPK forw TGCCCTTTCAGAAATTGGTT PPK 11 UPL PPK rev TCCACATCTGAGAACGCAAG
UPL GAPDH forw AGCCACATCGCTCAGACAC GAPDH 60 UPL GAPDH rev GCCCAATACGACCAAATCC
NFIA vect forw 42 CTCCACTTTCCAACGTCACC pCHNFI-A1.1 42 NFIA vect rev 42 GATGGCTGGGTGTGAGAAGT
NFIB vect forw 11 CCCCTCTCCAAATTCACCA pCHNFI-B2 11 NFIB vect rev 11 GACATATCTTGATCTCGTTCATGC
NFIC vect forw 56 GGACAGGTGTGGGCTCAG pCHNFI-C2 56 NFIC vect rev 56 TGGAAGTCTGTGGTGTCCAG
NFIX vect forw 42 GCACTTCCCTTCCACGTC pCHNFI-X2 42 NFIX vect rev 42 GGATGGTTGGGTGTGTGAA
NFIA forw 20 GCCAAGTGACGCTGACATTA NF1-A 20 NFIA rev 20 CTGTCCTGGAAGCCCAAAT
NFIB forw 20 ATGACCCATCCAGTCCACA NF1-B 20 NFIB rev 20 CACTTGGAAAGGAACCAAGC
NFIC forw 56 GACAGGGATGGGCTCTGAC NF1-C 56 NFIC rev 56 TCTCCTGGAAGTCGGTCGT
NFIX forw 42 GCTTGCTGGAGTCAGACCA NF1-X 42 NFIX rev 42 GGTCGGGTGCGTGAAATA
A sequence ID for the target genes are: NM_000892.3 for PPK, NM_002046.3 for GAPDH, NM_005595.1 for NF1-A, NM_005596.1 for NF1-B, NM_005597.2 and NM_205843.1 for NF1-C, NM_002501.2 for NF1-X. pCHNFI-A1.1, pCHNFI-B2, pCHNFI-C2, pCHNFI-X2 are NF1 expression vectors (C.1.4.5).
The quantitative real-time PCR mixture was prepared by adding the following components in
the order shown below:

C MATERIALS AND METHODS 58
Component Final concentration Volume
H2O 5.5 �l
10 �M UniversalProbeLibrary probe 100 nM 0.1 �l
10 �M primer 1 200 nM 0.2 �l
10 �M primer 2 200 nM 0.2 �l
5� LightCycler TaqMan Master 1� 2.0 �l
8 �l of the quantitative real-time PCR mixture was pipetted into each precooled LightCycler
capillary. After adding 2 �l of the cDNA template (C.2.5, C.2.6) the capillaries were centrifuged
at 800 rpm for 5 min and transferred into the LightCycler instrument. The samples were cycled
as described in Table C-10.
Table C-10. Quantitative real-time PCR parameters.
Program Name
Analysis Mode Cycles Target
temperature Hold time Acquisition mode
Pre-Incubation None 1 95 °C 10 min none
95 °C 10 s none
60 °C 30 s none Amplification Quantification 45
72 °C 1 s single
Cooling None 1 40 °C 30 s none
Temperature transition rate/slope was 20 °C/s. Seek temperature was set to 30 °C, display mode during run and for analysis was fluorescence channel F1. All protocol parameters not listed in the table were set to zero.
Measured fluorescence values were quantified using the second derivative maximum method
(LighCycler software version 3.5). To calculate concentrations for unknown samples, a standard
curve representing a series of tenfold dilutions of cDNA from liver was generated. cDNA was
synthesized from 5 �g of total liver RNA (BioCat) using the GeneRacer SuperScript III RT
Module (Invitrogen) and random hexanucleotides as primers. A stock solution was adjusted so
that 1 �l contained an amount of cDNA that reflected 100,000 pg RNA. Finally, for normaliza-
tion the amount of target transcript was divided by the amount of GAPDH transcript measured in
the same sample. For samples where the NF1 expression from vectors had to be confirmed, the
respective NF1 expression plasmids diluted from 100,000 pg to 10 pg were used for standard
curve generation.

C MATERIALS AND METHODS 59
C.2.8 DNA pull-down method
In an attempt to assess the transcription factors (TFs) binding to the Prox promoter (cf.
C.2.1.2) a DNA pull-down method was applied (Gabrielsen & Huet, 1993).
Briefly, the DNA fragment of interest is biotinylated at one end and attached to streptavidin
coated magnetic beads. For isolation of TFs a nuclear extract is incubated with the DNA affinity
beads. After a short incubation a strong magnet is placed against the tube wall. The fluid is
removed and the beads are washed several times with a buffer containing a high concentration of
a competitor DNA thus reducing unspecific binding to the DNA of interest. The specifically
bound proteins are eluted by resuspending the beads in a buffer of high ionic strength that
dissociates the DNA-bound proteins. The beads are removed by magnetic separation, leaving a
protein fraction highly enriched for the sequence-specific DNA-binding proteins.
C.2.8.1 Preparation of DNA affinity beads
Large-scale digestion of plasmid DNA. The 690-bp DNA fragment representing the Prox
promoter (cf. C.2.1.2) was excised with restriction enzymes MluI (700 U) and NheI (1000 U)
from 2 mg of the respective SEAP plasmid at 37 °C over night. The presence of the NheI site at
the end of the vector fragment would have led to the biotinylation of both the insert and the
vector fragment and its following attachment to the beads, leaving a relatively high
concentration of nonspecific binding sites on the beads. To avoid this, a third enzyme, BglII
(1300 U), was added to the mixture (total volume 3 ml). It left only a 21-bp vector sequence
biotinylated, thus reducing nonspecific binding sites to an unimportant level. The final digest
was extracted with phenol:chloroform:isoamyl alcohol (25:24:1), precipitated with ethanol, and
dissolved in TE buffer (10 mM Tris-HCl, 1 mM EDTA, pH 8.0).
Selective biotinylation of DNA. The Prox promoter with a NheI site at the 3� end was then
labeled with biotin using biotin-16-dUTP and the Klenow fragment of DNA polymerase I
(3��5� exo�). The reaction mixture (400 µl) contained the DNA digest with 0.3 nmol of specific
fragment, 5 nmol of biotin-16-dUTP, 20 nmol of dCTP to fill in the first position of the NheI
restriction site, 200 units Klenow fragment (3��5� exo�), all in 10 mM Tris-HCl, 10 mM MgCl2,
50 mM NaCl, and 1 mM DTT, pH 7.9 (1� NEBuffer 2, New England BioLabs). After 60 min
incubation at 37 °C the reaction was stopped by heating for 20 min at 75 °C. The efficiency of
biotinylation was controlled by agarose gel electrophoresis of two 1 µl-aliquots, one loaded
directly as a reference, the other loaded after mixing with 2 µl of 5 mg/ml streptavidin.
Unincorporated biotin-16-dUTP was removed by passage through Sephacryl™ S-200 HR spin
columns, equilibrated in TE buffer (the loading volume was 50 µl onto each column).

C MATERIALS AND METHODS 60
Coupling of DNA to magnetic beads. 1 ml suspension of 10 mg/ml Dynabeads® M-280
streptavidin was washed twice with 1 ml of 2� B&W buffer (10 mM Tris-HCl, 1 mM EDTA,
2 M NaCl, pH 7.5) by resuspension and magnetic separation. Then the beads were resuspended
in 2 ml 2� B&W buffer to a final concentration of 5 mg/ml and mixed with 400 µl of the
biotinylated DNA and 1.6 ml of TE buffer. The mixture was incubated at RT for 15 min. The
efficiency of coupling was visualized by agarose gel electrophoresis of DNA samples taken
before and after coupling. Finally, the beads were washed three times in 1� B&W buffer and
resuspended in 1 ml of TEN buffer (10 mM Tris-HCl, 1 mM EDTA, 100 mM NaCl, pH 7.5).
C.2.8.2 Purification of transcription factors by DNA affinity beads
Nuclear extract preparation. Nuclear extracts were prepared from HepG2 cells using Nuclear
Extract kit (Active Motif). The cells grown to confluence in a 75 cm2-flask were washed twice
with “PBS/Phosphatase Inhibitors” solution, gently scrapped and transferred to a pre-chilled
15 ml conical tube. After 5 min centrifugation at 500 rpm the supernatant was discarded.
Pelleted cells were resuspended in 500 µl of 1� “Hypotonic Buffer” and transferred to a 1.5 ml
Eppendorf tube. After 15 min incubation on ice followed by an addition of 25 µl of “Detergent”
the mixture was vortexed for 10 s and centrifuged for 30 s at 14,000 rpm. The supernatant
containing the cytoplasmic fraction was removed. The nuclear pellet was resuspended in 50 µl of
“Complete Lysis Buffer”, vortexed for 10 s and then incubated for 30 min on ice. After
incubation the lysate was vortexed for 30 s and immediately centrifuged for 10 min at
14,000 rpm. Finally, the supernatant was desalted through MicroSpin G-25 columns pre-
equilibrated in 20 mM Tris-HCl, 1 mM EDTA, 10 % (v/v) glycerol, 100 mM NaCl, pH 8.0,
aliquoted and stored at �80 °C. All buffers, tubes and a centrifuge used were pre-cooled at 4 °C.
Determination of the protein concentration. Total protein was quantified with the “Micro
BCA Protein Assay” reagent (Pierce) using bovine serum albumin (BSA) as the standard.
Purification of transcription factors. 5 mg of the DNA-coupled magnetic beads were washed
three times in 0.5 ml TGED100mM buffer (20 mM Tris-HCl, 1 mM EDTA, 10 % (v/v) glycerol,
1 mM DTT, 0.01 % (v/v) Triton X-100, 100 mM NaCl, pH 8.0) and then incubated with 500 µg
of desalted HepG2 nuclear extract on a rolling platform for 2 h at 4 °C in TGED100mM buffer
(total volume 0.5 ml). After incubation the beads were washed once with TGED100mM buffer for
5 min, once with TGED100mM buffer containing a 10 times excess of competitor poly(dI–dC)
double strand for 15 min, and once with TGED100mM buffer. Proteins were eluted on ice in 25 µl
of TGED2M buffer (20 mM Tris-HCl, 1 mM EDTA, 10% (v/v) glycerol, 1 mM DTT, 0.01 %

C MATERIALS AND METHODS 61
(v/v) Triton X-100, 2 M NaCl, pH 8.0), desalted through MicroSpin G-25 columns pre-
equilibrated in TEN buffer and stored at �80 °C.
C.2.9 TranSignal Protein/DNA Array
TranSignal™ Protein/DNA Array I, II, III (BioCat) were used to identify the TFs associated
with the Prox promoter in the pull-down assay (Zeng et al., 2003; Li et al., 2004).
Briefly, a set of biotin-labeled DNA oligonucleotides representing consensus sequences for
definite TFs is incubated with the nuclear extract of interest. Upon incubation TFs bind to the
specific DNA sequences and the formed protein/DNA complexes are separated from remaining
unbound oligonucleotides by agarose gel electrophoresis. The protein / DNA complexes are
extracted from the gel and simultaneously released from bound proteins. The resulting mixture
of free DNA probes is finally used to hybridize the TranSignal array which is spotted with the
complementary consensus-binding sequences. Signals from the hybridized probes are visualized
by HRP-based chemiluminescence detection.
10 �l of the protein fraction enriched with DNA-binding proteins specific for the Prox
promoter (C.2.8) was incubated with 10 �l of the “TranSignal probe mix” I, II or III for 30 min
at 15 °C to allow the formation of protein/DNA complexes. After incubation the probe was
mixed with 2 µl of “Loading dye” and loaded onto a 2 % agarose gel (approximately 5 mm
thick, 8 mm-wide comb) in 0.5� TBE buffer (45 mM Tris�borate, 1 mM EDTA, pH 8.0). To
separate protein/DNA complexes from the free probes, the gel was run at 120 V for about 20
min, so that the middle of the dye front was about 15 mm from the wells. A gel area (~ 6�8�5
mm) containing the protein/DNA complexes was cut out, transferred to a 1.5 ml tube and
incubated with 1 ml of “Extraction buffer A” at 55 °C until the gel was completely dissolved.
Then the solution was combined with 8 µl of resuspended “Gel extraction beads”, vortexed,
incubated for 10 min and centrifuged at 14,000 rpm for 30 s. To wash the beads, the supernatant
was removed and the pellet resuspended in 150 µl of “Extraction buffer B”. After a 30 s
centrifugation at 14,000 rpm the supernatant was aspirated and the pellet air-dried for 5 min. To
elute the bound probes, the pellet was resuspended in 150 µl of H2O, incubated for 10 min, and
after centrifugation for 1 min the supernatant was transferred to a new 1.5 ml tube.
By that time an array membrane was placed into a 50 ml conical tube and pre-hybridized in
5 ml of “Hybridization buffer” in a rotating hybridization oven at 42 °C for 2 h. The eluted
probes were denatured at 95 °C for 3 min, chilled on ice and added to the 50 ml conical tube
with the respective array membrane. The hybridization was performed at 42 °C overnight. On
the next morning the hybridization mixture was decanted, and the membrane was washed by

C MATERIALS AND METHODS 62
incubation in 50 ml of “Hybridization wash I” firstly and then in 50 ml of “Hybridization wash
II” at 42 °C for 20 min each. Afterwards the membrane was transferred to a container were it
was incubated with 20 ml of 1� “Blocking buffer” at RT for 15 min. Then 20 µl of Streptavidin-
HRP conjugate was added, and the membrane was incubated for further 15 min. After washing
the membrane at RT with 20 ml of 1� “Wash buffer” (3�10 min) it was incubated with 20 ml of
1� “Detection buffer” at RT for 5 min. Finally, the blot was overlaid with 2 ml of working
substrate solution (200 µl “Solution I” + 200 µl “Solution II” + 1.6 ml “Solution III”) for 5 min,
dried and exposed to the film (for 2 h and then overnight).
C.2.10 Electrophoretic mobility shift assay
To detect specific TFs that bind to a DNA sequence of interest, electrophoretic mobility shift
assays (EMSA) were performed. Briefly, during the incubation of a radioactive DNA probe with
a nuclear extract TFs bind to specific binding sites of the DNA oligonucleotide probe. Upon a
non-denaturating polyacrylamide gel electrophoresis complexes migrate more slowly as com-
pared to the free probe and can be detected by autoradiography. Several controls were used for
proving specificity of the binding and for identification of a binding protein itself. The first one
is an incubation with a high molar excess of the non-labeled oligo. In that case specific bands
disappear from the gel, as the unlabeled probe successfully competes for the limitedly available
TFs. To identify specific binding sites, mutated DNA oligos are used as competitors. Further
identification of a presumed TF is achieved with an antibody which is added to the incubation
mixture. If the antibody is specific for the TF and binds to the DNA binding domain of the TF,
the specific band disappears. If the antibody does not prevent binding of the TF to the probe, the
complex with a higher molecular weight is formed and appears on the gel supershifted.
C.2.10.1 Nuclear extract preparation
HepG2 cells were seeded onto TPP 150 mm culture dishes and incubated in 25 ml of culture
medium until the cells were about 80 % confluent. Nuclear extracts were prepared according to a
protocol of Schreiber (Schreiber et al., 1989) with some modifications. Firstly, cells were washed
twice with ice-cold PBS, covered with 5 ml of ice-cold Buffer A (10 mM Hepes, 15 mM KCl,
2 mM MgCl2, 0.1 mM EDTA, pH 8.0, protease inhibitor cocktail (Table C-11)) and allowed to
swell on ice for 10 min. Then Buffer A was replaced with 2.5 ml of ice-cold Buffer A + 0.2 %
NP-40 leading to cell lysis. After 10 min incubation on ice lysed cells were scraped off the dish
and transferred to a clean 15 ml conical tube. To make sure all the cells were gathered, the dish
was rinsed once with another 2.5 ml of Buffer A + 0.2 % NP-40, which was transferred to the
same tube. After resuspending and pelleting the cells by centrifugation at 1800 rpm for 5 min at

C MATERIALS AND METHODS 63
4 °C the supernatant containing cytoplasm was discarded. The pellet was resuspended by gentle
pipetting in 1 ml of ice-cold Buffer C (25 mM Hepes, 50 mM KCl, 0.1 mM EDTA, pH 8.0, 10 %
glycerol, protease inhibitor cocktail) followed by 5 min centrifugation at 1800 rpm at 4 °C. The
supernatant was removed; the volume of the pellet was estimated using the graduations on the
tube, and the nuclei were resuspended in 2 volumes of Buffer C by gentle pipetting.
Subsequently, the accurate total volume was measured by a pipette. To initiate the lysis of
nuclei, a calculated volume of 5 M NaCl was added dropwise to the suspension to the final con-
centration of 0.4 M NaCl. After 30 min incubation on ice the nuclear extract was centrifuged at
14,000 rpm for 5 min at 4 °C. Finally, the supernatant was transferred to a clean pre-chilled
microcentrifuge tube and frozen in aliquots at �80 °C. The protein concentration was determined
by Micro BCA Protein Assay (Pierce).
Table C-11. Protease inhibitor cocktail recipe.
Inhibitor Stock solution Volume*
DTT 1M (in H2O) 10 µl (4 µl)
AEBSF in H2O 0.1M (in H2O) 100 µl (40 µl)
Benzaimidine 0.2M (in H2O) 10 µl (4 µl)
Aprotinin 5 mg/ml (in H2O) 10 µl (4 µl)
Antipain 10 mg/ml (in H2O) 2 µl (0.8 µl)
Leupeptin 5 mg/ml (in H2O) 10 µl (4 µl)
Chymostatin 5 mg/ml (in DMSO) 10 µl (4 µl) * The indicated volumes of inhibitor solutions were added just prior to use to 10 ml of Buffer A and
to 10 ml of Buffer A + 0.02 % NP-40. The volumes of inhibitor solutions indicated in parentheses were added to 4 ml of Buffer C.
C.2.10.2 Preparation of radiolabeled DNA probes
When designing oligonucleotide probes (Table C-12), attention was paid that the 5'-terminal
position was not occupied by a cytosine residue because of its low labeling efficiency (van
Houten et al., 1998). To generate a double-stranded DNA fragment containing the binding site of
interest, 6 �l forward oligonucleotide (100 pmol/�l), 6 �l reverse oligonucleotide (100 pmol/�l),
1.6 �l 5 M NaCl and 6.4 �l H2O were mixed at RT. To anneal the complementary oligo-
nucleotides, the mixture was initially incubated at 95 °C for 10 min, afterwards the temperature
was reduced in 5 °C-steps (approximately 15 min each) to the final temperature of 25 °C
followed by an overnight incubation. Finally, the volume of the reaction was brought to 200 �l
with H2O so that the final concentration of the double-stranded DNA was 3 pmol/�l.

C MATERIALS AND METHODS 64
Table C-12. Oligonucleotides used in EMSA.
Probe Oligonucleotide name Sequence (5' – 3')
TBP forw AGTCAATATTGAAGCCAAGCAAAATATT Probe 1 TBP rev AATATTTTGCTTGGCTTCAATATTGACT
TBP M06 forw AGTCAAGCGTGCCTCCAAGCAAAATATT Probe 1 M06 TBP M06 rev AATATTTTGCTTGGAGGCACGCTTGACT
TBP M23 forw AGTCAATATTGAAGAACCTCAAAATATT Probe 1 M23 TBP M23 rev AATATTTTGAGGTTCTTCAATATTGACT
TBP M24 forw AGTCAATATTGAAGCCAAGACCCCTATT Probe 1 M24 TBP M24 rev AATAGGGGTCTTGGCTTCAATATTGACT
cons TBP forw GCAGAGCATATAAAATGAGGTAGGA cons TBP cons TBP rev TCCTACCTCATTTTATATGCTCTGC
cons TBP forw mut GCAGAGCAGCTAAAATGAGGTAGGA cons TBP mut cons TBP rev mut TCCTACCTCATTTTAGCTGCTCTGC
cons NFY forw AGACCGTACGTGATTGGTTAATCTCTT cons NFY cons NFY rev AAGAGATTAACCAATCACGTACGGTCT
cons NFY forw mut AGACCGTACGAAATACGGGAATCTCTT cons NFY mut cons NFY rev mut AAGAGATTCCCGTATTTCGTACGGTCT
NFI forw AAACTGTTGGCAGAAACCCAAAGTCA Probe 2 NFI rev TGACTTTGGGTTTCTGCCAACAGTTT
NFI M19 forw AAAAGTGGTGCAGAAACCCAAAGTCA Probe 2 M19 NFI M19 rev TGACTTTGGGTTTCTGCACCACTTTT
NFI M20 forw AAACTGTTGTACTCCACCCAAAGTCA Probe 2 M20 NFI M20 rev TGACTTTGGGTGGAGTACAACAGTTT
NFI M21 forw AAACTGTTGGCAGAACAAACCAGTCA Probe 2 M21 NFI M21 rev TGACTGGTTTGTTCTGCCAACAGTTT
cons NFI forw TTTTGGATTGAAGCCAATATGATAA cons NF1 cons NFI rev TTATCATATTGGCTTCAATCCAAAA
cons NFI forw mut TTTTGGATTGAATAAAATATGATAA cons NF1 mut cons NFI rev mut TTATCATATTTTATTCAATCCAAAA
Oligo3 forw TGGAATATGTTGACAGGACA Probe 3 Oligo3 rev TGTCCTGTCAACATATTCCA

C MATERIALS AND METHODS 65
Probe Oligonucleotide name Sequence (5' – 3')
Oligo3 M15 forw TGGAATAGTGGTCCAGGACA Probe 3 M15 Oligo3 M15 rev TGTCCTGGACCACTATTCCA
cons TGIF forw ACTCTGCCTGTCAAGCGAGG cons TGIF cons TGIF rev CCTCGCTTGACAGGCAGAGT
cons TGIF forw mut ACTCTGCAAATCAAGCGAGG cons TGIF mut cons TGIF rev mut CCTCGCTTGATTTGCAGAGT
The following position numbers of the probes refer to the contig NT_022792.12. Probe 1, 7923543-7923570; Probe 2, 7923522-7923547; Probe 3, 7923494-7923513. The mutated nucleotides are in bold and underlined.
To check the efficiency of the annealing, 1 �l of each sample was mixed with 9 �l of H2O and
2 �l 6� Loading Dye (Promega). The samples were separated in a 14.5 % nondenaturating
polyacrylamide gel using 0.5� TBE as running buffer for 1.5 h at 400 V. The PROTEAN® II xi
Cell apparatus (Bio-Rad) with 1.5 mm spacers and 15 wells comb was used for electrophoresis.
After electrophoresis was complete, the DNA bands were detected by silver staining according
to Riesner et al. (1989) with some modifications. Briefly, the gel was shaken slowly for 5 min in
30 % ethanol, 10 % acetic acid followed by 30 min incubation in 0.1 % silver nitrate solution.
The gel was rinsed three times with distilled water and treated with a fresh solution containing
per liter 15 g of NaOH, 0.1 g of NaBH4, and 3 ml of 37 % formaldehyde. When bands became
visible the reaction was stopped by washing the gel in 5 % acetic acid for a few minutes.
The probe was labeled by transfer of the �-32P from [�-32P]ATP using a T4 polynucleotide
kinase (NE Biolabs):
2 �l double-stranded DNA (3 pmol/�l)
2 �l 10× T4-PNK buffer (700 mM HCl, 100 mM MgCl2, 50 mM DTT, pH 7.6)
9 �l [�-32P]ATP (>6000 Ci/mmol, 10 mCi/ml)
2 �l T4 polynucleotide kinase (10 U/�l)
5 �l H2OMP
After 1 h incubation at 37 °C the kinase was inactivated by incubation at 68 °C for 10 min.
Each sample was brought to a final volume of 80 �l using STE buffer (100 mM NaCl, 20 mM
Tris-HCl, 10 mM EDTA, pH 7.5). Unincorporated [�-32P]ATP was separated from the radio-
labeled DNA probe by NucTrap probe purification columns (Stratagene) in conjunction with the
Push Column Beta Shield device according to the protocol of the supplier. Briefly, the columns

C MATERIALS AND METHODS 66
were equilibrated by applying 80 �l of STE buffer. 80 �l of the sample was loaded on the top of
the column, pushed through the column and collected in a 1.5 ml tube. To ensure complete
recovery of the sample, additional 80 �l of STE buffer was applied onto the column and eluted
into the same collection tube. The total volume collected was typically between 100 and 140 �l.
1 �l of the probe was taken for Cerenkov counting in a scintillation counter to determine specific
activity. Roughly 50,000 – 100,000 cpm/�l were obtained in the final primer solution. The
primer was stored at –20 °C for up to 1 month.
C.2.10.3 Protein-DNA binding reaction and electrophoresis of protein-DNA complexes
Nuclear extracts (5 µg each) were incubated in 20 µl of a binding mixture containing 10 mM
Tris, pH 8.0, 1 mM EDTA, 1 mM DTT, 5 % glycerol, 1 µg of poly(dI-dC) for 30 min at RT.
Thereafter, 1 µl of the radiolabeled nucleotide was added, and the mixture was again incubated
for 30 min on ice. For specificity testing, a 100-fold molar excess of a non-labeled probe was
added as a competitor to the reaction mixture at the very beginning and incubated for 30 min at
RT before adding the radiolabeled probe. As non-labeled competitors, the same DNA fragment
as the radiolabeled probe or DNA fragment with introduced mutations were used. Competition
experiments were also performed with a probe bearing a consensus binding site for the
transcription factor of interest and a mutated form of this probe. For supershift assay, 1 µl of an
antiserum reagent (Table C-13, see also C.1.2) was added to the reaction mixture 30 min prior to
the addition of the labeled DNA probe.
A 5 % polyacrylamide gel with a 37.5:1 acrylamide/bisacrylamide ratio was cast in 0.5� TBE
buffer (45 mM Tris�borate, 1 mM EDTA, pH 8.0) using the PROTEAN® II xi Cell apparatus
(Bio-Rad) with 1.5 mm spacers and 15 wells comb. Prior to loading the binding reaction
mixtures into the appropriate well, the gel was prerun for 60 min at 200 V. Separation of DNA-
protein complexes from free probe was achieved by electrophoresis at 340 V for approximately
1.5 h at 4 °C using 0.5� TBE as a running buffer. A 6× gel-loading buffer (0.25 % bromophenol
blue, 0.25 % xylene cyanol FF, 40 % (w/v) sucrose in H2O) was loaded into a separate well and
used to monitor the progress of electrophoresis. After electrophoresis the glass plates were
separated. The gel attached to one of the glass plates was covered with a sheet of Whatman
3MM filter paper, and the filter paper with the gel attached to it was peeled from the plate. The
gel was covered with plastic wrap and dried under vacuum under heating. Finally, the dried gel
was exposed to a phosphor imaging screen overnight at RT, and the image was recorded using a
phosphorimager Storm 840 (Molecular Dynamics).

C MATERIALS AND METHODS 67
Table C-13. Antibodies used in EMSA.
TF family Antibodies
AP1 complex proteins
c-Fos (4-10G)X, c-Fos (4)X, c-Fos (H-125), Fos B (102)X, Fra-1 (R-20)X, Fra-2 (L-15)X, c-Jun/Ap-1 (N)X, c-Jun/Ap-1 (D)X, Jun B (N-17)X, Jun D (329)X
C/EBP transcription factor family
C/EBP � (14AA)X, C/EBP � (C-19)X, C/EBP � (E198)X, C/EBP � (C-20)X, C/EBP � (M-17)X, CRP 1 (C22)X
ATF/CREB transcription factor family
ATF2 (C-19)X, ATF3 (C-19)X, CREB-1 (C-21)X, CREB-1 (X-12)X, CREB-2 (C-20)X
IRF family IRF1 (C-20)X, IRF2 (C-19)X, IRF3 (FL-425)X, IRF7 (H-246)X, ICSAT (M-17)X, ICSBP (C-19)X, ISGF-3� p48 (C-20)X
NFFB gene family NFFB p50 (NLS)X, NFFB p50 (H-119)X, NFFB p65 (A)X, rel B (C-19)X, c-Rel (N)X
Ets transcription factor family
Ets-1/Ets-2 (C-275)X, PU1 (Spi-1) (T-21)X
Sp1-like family Sp1 (PEP 2)X, Sp3 (D-20)X
miscellaneous Pax-2/5/8 (N-19)X, NFATc (K-18) (T-21)X, stat2 (A7)X, AP2 (C-18)X
AP-1, activator protein 1; C/EBP, CCAAT-enhancer binding protein; ATF, activating transcription factor; CREB, cAMP responsive element binding protein; IRF, interferon regulatory factor; NFFB, nuclear factor kappa B; Ets, E26 transformation specific; Sp, signal protein.
C.2.11 Chromatin immunoprecipitation
Chromatin immunoprecipitation (ChIP) is a powerful technique to study protein/DNA
interactions. In this method, intact cells are fixed by formaldehyde, which cross-links and
preserves protein-protein and protein-DNA interactions between molecules in close proximity on
the chromatin template in vivo. A whole-cell extract is prepared, and the cross-linked chromatin
is sheared by sonication to reduce the average DNA fragment size to approximately 500 bp.
Specific protein/DNA complexes are immunoprecipitated with an antibody against the protein of
interest or with a non-immune serum as a negative control. Following immunoprecipitation,
formaldehyde cross-linking is reversed by heating, the proteins are removed by treatment with
proteinase K, DNA is purified and analyzed by quantitative real-time PCR. The enrichment of
specific genomic regions in immunoprecipitated samples as compared to negative control
provides information if the protein of interest binds to the specific DNA fragment.
Chromatin preparation. HepG2 cells were grown to 70-80 % confluence on 150-mm plates
(TPP). One extra plate was included to be used solely for estimation of cell number. 37 %
formaldehyde was added directly to the culture medium to a final concentration of 1 %. After 10

C MATERIALS AND METHODS 68
min incubation at RT the cross-linking reaction was stopped by adding glycine to a final
concentration of 0.125 M and rocking for 5 min. The cells were scraped from the dish into a pre-
cooled 50 ml conical tube and pelleted by centrifugation for 5 min at 1800 rpm at 4 °C. The
supernatant was removed, and the pellet washed twice with ice-cold Dulbecco's PBS (PAN).
After the last wash, the pellet was resuspended in cold SDS lysis buffer with inhibitors (1 %
SDS, 10 mM EDTA, 50 mM Tris, pH 8.0, 1 mM AEBSF, 1× protease inhibitor cocktail
(Roche)) and incubated for 10 min on ice. The volume of the SDS lysis buffer was calculated
based on the starting cell number so that each 200 µl aliquot of the lysed cell pellet contained
approximately 3×10⁶ cells. At this point the aliquots could be frozen.
Shearing by sonication. The cross-linked DNA was sheared to an average length of about
500 bp (assessed by gel) by using 4× 10 s pulses at power 2 on the Branson sonifier B12 in a
1.5 ml Eppendorf tube while keeping samples in ice-cold water. The sonicated samples were
centrifuged for 10 min at 14,000 rpm at 4 °C, and the supernatants were transferred to new 2.0
ml microcentrifuge tubes.
Immunoprecipitation. In order to reduce the SDS concentration to 0.1 %, the sonicated cell
supernatant was diluted 10-fold with ChIP dilution buffer (16.7 mM Tris-HCl, pH 8.0, 167 mM
NaCl, 1.2 mM EDTA, 1.1 % Triton X-100, 0.01 % SDS, 1 mM AEBSF, 1× protease inhibitor
cocktail (Roche)). To reduce nonspecific background, the supernatants were pre-cleared with 20
µl of protein A beads (Miltenyi Biotec) for 60 min at 4 °C with rotation. Following pre-clearing,
the supernatants were passed over µ Columns (Miltenyi Biotec) equilibrated in PBS + 0.5 %
Triton X-100, and the flow-through fractions were collected into new 2.0 ml microcentrifuge
tubes as pre-cleared samples. 10 % (200 µl) of the pre-cleared supernatants, named Input
material, were kept to quantify the starting amount of DNA present in different samples. Either 2
µl of anti-NF1 antibody (C.1.2) or an equivalent amount of non-immune control IgG were added
to the pre-cleared samples and incubated overnight at 4 °C under rotation.
To collect the antibody-protein complexes, 30 µl of protein A beads (Miltenyi Biotec) were
added to the reaction mixture and incubated for 1 h at 4 °C under rotation. Following the
incubation, samples were pipetted onto µ Columns equilibrated in PBS + 0.5 % Triton X-100,
allowed to flow through, and washed four times with 500 µl ChIP wash buffer (100 mM Tris, pH
8.0, 500 mM LiCl, 1 % NP-40, 1 % deoxycholic acid) and once with 500 µl low salt wash buffer
(20 mM Tris, pH 8.0, 10 mM EDTA, 10 mM NaCl). ChIP product was then eluted by applying
500 µl of freshly prepared ChIP elution buffer (50 mM NaHCO3, 2 % SDS) to each column.
Reverse cross-linking and DNA purification. The reserved Input DNA was thawed, adjusted
to 500 µl with the ChIP elution buffer and taken through the following steps along with the

C MATERIALS AND METHODS 69
immunoprecipitated samples. To reverse cross-links and remove RNA, 10 µl of RNase/DNase
free (0.5 µg/µl, Roche) and 20 µl 5 M NaCl (200 mM final) were added to each ChIP eluate and
to the sample of Input DNA and incubated for 4 h at 65 °C. Following the incubation, tubes were
shortly centrifuged to collect liquid from the sides of the tubes. 10 µl of 0.5 M EDTA, 20 µl of
1 M Tris, pH 6.8, and 1 µl of 20 mg/ml proteinase K were added to each tube and incubated for
1 h at 45 °C. DNA was precipitated by adding 1 µl of glycogen (20 mg/ml), 0.1 volume of 3 M
sodium acetate, pH 5.2, and 2.5 volumes of absolute ethanol overnight at -20 °C. DNA was
extracted once with phenol:chloroform:isoamyl alcohol (25:24:1) and once with chloroform,
precipitated with ethanol, and dissolved in 100 µl of the EB (10 mM Tris-HCl, pH 8.5).
PCR analyses. The amount of the human PPK promoter fragment in immunoprecipitated
samples and input materials was quantified by quantitative real-time PCR (C.2.7) using forward
5'-GTTGGCAGAAACCCAAAGTC-3' and reverse 5'-AAGCTGTTCTAATGTGGCACTG-3'
primers and Universal Probe #139.
C.2.12 Western blotting
Western blot analysis was applied to monitor the expression of NF1 recombinant proteins.
Nuclear extract preparation. Nuclear extract was prepared from HepG2 cells transiently
transfected with NF1 expression vectors (C.2.2.3) essentially as described in C.2.10.1 with some
modification. Namely, all buffers were applied in smaller volumes because cells were grown on
12-well plates. Each well was covered with 300 µl of Buffer A, and cells from two identically
treated wells were lysed and scraped off in 100 µl of Buffer A + 0.2 % NP-40 each and
combined. The nuclear pellet was washed in 100 µl of Buffer C. The pellet (total volume about
10 µl) was resuspended in 25 µl of Buffer C and subsequently 3 µl 5 M NaCl was added.
Electrophoresis of proteins by SDS-PAGE. Electrophoretic separation of proteins was
achieved with the discontinuous method of Laemmli (1970) using SE 250 Mighty Small II
electrophoresis unit (Hoefer). 2 µg of nuclear extract was adjusted to 7.5 µl volume with
Buffer C ( C.2.10.1), mixed with 7.5 µl of Laemmli sample buffer (125 mM Tris-HCl, pH 6.8, 4
% SDS, 20 % glycerol, 0.01 % (w/v) Coomassie Brilliant Blue G-250, 25 mM DTT), and boiled
for 5 min at 95 °C. After short centrifugation to collect the liquid, samples were loaded onto a 10
% SDS-polyacrylamide gel and separated at 80 V (stacking gel) and 140 V (resolving gel) at 16
°C for about 1.5 h in total. The running buffer was 25 mM Tris, 192 mM glycine, 0.1 % (w/v)
SDS. Precision Plus Protein Kaleidoscope standards (Bio-Rad) loaded into a separate well were
used to monitor the progress of electrophoresis and subsequently as a visual reference of the
molecular weight for proteins of interest.

C MATERIALS AND METHODS 70
Immunoblotting. Following the SDS-PAGE, the separated bands were transferred from the gel
onto a nitrocellulose membrane using the semidry electrotransfer procedure. Whatman 3MM
papers and nitrocellulose membrane were cut according to the size of the gel to be blotted and
soaked in transfer buffer (48 mM Tris, 39 mM glycine, 0.037 % SDS, 20 % (v/v) methanol). The
gel was shortly rinsed with the same buffer and the following transfer sandwich was set: anode/
3× Whatman filters/ nitrocellulose membrane/ SDS-polyacrylamide gel/ 3× Whatman filters/
cathode. After removing air bubbles from the sandwich, proteins were blotted for 1.5 h at a
constant current of 70 mA per gel.
To block unspecific binding sites, the nitrocellulose membrane was incubated overnight in
5 % (w/v) skim milk powder in TBST buffer (150 mM NaCl, 50 mM Tris-base, pH 7.5, 0.1 %
Tween-20) at 4 °C on a rocking platform. The anti-hemagglutinin primary antibody (Roche) was
added for 1 h at RT in 1 % (w/v) non-fat milk in TBST buffer (1:2000 diluted). The unbound
antibody was washed away (3× 5 min) with TBST buffer, and the membrane was incubated in
TBST buffer with the 1:2000 diluted secondary HRP-labeled antibody (DAKO) for an additional
1 h. The membrane was washed again (3× 5 min) in TBST buffer, developed using Lumi-
LightPLUS Western Blotting substrate (Roche) for 15 min, dried and exposed to an X-ray film
(Amersham Biosciences).
C.2.13 Bioinformatic tools
Putative transcription factor binding sites were identified with the MatInspector program
(http://www.genomatix.de). The Matrix Family Library version 5.0 was used with core/matrix
similarity values set to 0.70/optimized.
The program Patser from regulatory sequence analysis (RSA) tools
(http://rsat.scmbb.ulb.ac.be/rsat/) was used to scan the DNA sequence of interest with a position-
specific scoring matrix. A weight matrix for the TF of interest was obtained if available by
accessing to the TRANSFAC database (http://www.gene-regulation.com/pub/databases.html
#transfac).
Cap-analysis gene expression (CAGE) Basic database was used as a source of sequenced
capped 5' ends of transcripts for mouse and human (Carninci et al., 2006; Kawaji et al., 2006).
GenScript siRNA Target Finder (https://www.genscript.com/ssl-bin/app/rnai) was used to
design siRNA.
D Multiple transcription start sites and alternative promoter regions 71
D Utilization of multiple transcription start sites and alternative promoters for the
PPK gene expression
D.1 RESULTS
D.1.1 Identification of two distal exons and splice variants of the human PPK gene
Mapping of the mouse PPK (mPPK) mRNA to the genomic sequence revealed that the
previously postulated mouse exon 1 in fact consists of three exons, designated mE1a, mE1b, and
mE1c (Neth et al., 2005). The alignment of the three newly defined mouse exons to the human
genomic sequence revealed three regions with identities between 74 % and 85 % (hE1a, hE1b,
hE1g in Figure D-1), whereby hE1g overlapped only 48 bp of the 5�-end of the conventional
exon 1 (Neth et al., 2005). To examine if the exons hE1a and hE1b are transcribed in human,
PCR experiments were carried out. PPK cDNA from three tissues with high hPPK mRNA
expression (liver, kidney, and testis) was amplified using forward and reverse primers positioned
in the putative exon hE1a and the conventional exon hE1, respectively (C.2.1.3). PCR products
were obtained for liver, kidney, and testis indicating that exon hE1a is present in hPPK
transcripts. However, the size of the PCR products estimated by an agarose gel electrophoresis
was typically greater than expected. Amplification of hepatic cDNA resulted in PCR products of
the same length, whereas PCR with renal and testicular cDNA yielded PCR products of different
lengths.
Sequencing of the PCR products confirmed the results of the in silico analysis (Figure D-1).
Two distal exons hE1a and hE1b upstream of the hPPK gene and an extended form of the
conventional exon 1, hE1g, were found. The length of the identified exon hE1b was 208 bp
against predicted 175 bp, for I1a the respective lengths were 1196 bp against 1198 bp. The
region between identified hE1b and hE1g comprised 16725 bp against predicted 16734 bp. hE1g
initiated 116 bp or 106 bp upstream of the known +1 position.
Surprisingly, two to four additional exons (designated hE1c, hE1d, hE1e, hE1f) in different
combinations and lengths were discovered within the predicted intron I1b. In liver only the
transcript of type I containing exons hE1c and hE1d of 163 bp and 185 bp, respectively, was
identified (Figure D-1), whereas in kidney and testis various splice variants were found. Kidney
transcript II contained additionally transcribed regions hE1c, hE1d, hE1e, and hE1f; in transcript
III exon hE1f was missing. Transcripts IV and V were similar to transcripts II and III,
respectively, except that exons hE1c and hE1d and the intervening region were transcribed as
one exon hE1cd. Transcript VI found in testis contained all exons but hE1d. Transcripts VII and
VIII were unusual in that exons hE1f and hE1g were shortened at the 3' end by 41 bp and at the

D Multiple transcription start sites and alternative promoter regions 72
���� ���� ����
���� ������� � �!
���� ���� ����
��� �� �� ��� � �� �� �����
���� ����
"�#$�����
%�&�$�
���� ���� ����
��� �� �� ��� � �� ��
���� ����
�$��
����
� ! ��
����
����
���� ���� ����
��� �� �� ��� � �� ��
���� ����
���
� ! �
����
�����
���� ����
�� ��
����
���
� ! �
����
�����
�� ���
���� ����
���
��
�
��
���
��
�
��
���
����
���� ���� ����
��� �� �� � � � � ��
�����
����
�� �����
����
���� ����
��� �� �� � � ��
����
�� � !
����
��
����
���� � �
���������
���� ����
��� �� �� �� � �� �� � ��
���� ����
����
�� � !
����
��
����
����
����
����
��� �� �� � ��
���� ����
�� �� � ��
����
����
��
����
�����
����
'��%�($�$
Figure D-1. Alternative splicing in the 5����-region of the hPPK gene. Filled boxes represent the newly identified exons of the hPPK gene, and lines represent introns. The black box corresponds to the conventional exon 1. Exons are drawn to scale. The gene-specific primers used in the first and nested PCR were positioned in exons hE1a and hE1g (arrowheads). Roman numerals indicate the different types of splice variants.
5' end by 10 bp, respectively, as compared to all other transcripts. In respect to the other exons
the transcript VII was identical to the transcript VI. In the splice variant VIII exons hE1b, hE1c,
and hE1d were missing.
The result that in liver only a single splice variant was found suggested that this might be due
to an experimental outlier. Therefore an additional PCR was performed using a different cDNA
from liver as template and different reverse primers as compared to the first PCR (C.2.1.3).
Similar to kidney and testis, also in liver a variety of alternatively spliced transcripts were
detected. Three splice variants corresponded to the previously identified transcripts type I, IV,
and V in liver and kidney (Figures D-2, D-1). Transcripts IX and X were similar to the transcript
I except that exon hE1g was shortened at the 5' end by 38 bp; in addition, the transcript X

D Multiple transcription start sites and alternative promoter regions 73
contained exon hE1f. Transcript XI differed from the transcript X in exon hE1f shortened at the
3' end by 41 bp and exon hE1g extended at the 5' end by 24 bp. Transcript XII contained
transcribed regions hE1a, hE1b, hE1c, hE1d, and hE1g. Transcript XIII was unusual in that
exons hE1b, hE1c, and hE1d were missing. In respect to the other exons the transcript XIII was
identical to the transcript X.
Figure D-2. Alternative splicing in the 5����-region of the hPPK gene in liver. Filled boxes represent the newly identified exons of the hPPK gene, and lines represent introns. Exons are drawn to scale. The gene-specific primers used in the first and nested PCR were positioned in exons hE1a and hE1g (arrowheads). Roman numerals indicate the different types of splice variants.
Thus, the PCR experiments demonstrated for hPPK mRNA expressed in liver, kidney, and
testis the presence of two distal exons hE1a and hE1b analogous to mouse; in addition, two to
four exons in different combinations and lengths are transcribed in the region between the newly
identified hE1b and the conventional hE1.

D Multiple transcription start sites and alternative promoter regions 74
D.1.2 The human PPK gene utilizes transcription initiation sites analogous to mouse and
vice versa
After having demonstrated that distal exons analogous to the mouse exist in human the TSSs
of the long transcripts were determined. For that reason RNA ligase-mediated rapid
amplification of 5�-cDNA ends (RLM-RACE, Invitrogen) was performed with mRNA from
human liver, kidney, and testis and the PPK-specific primers positioned in hE1a (C.2.6).
Three types of transcripts (types I to III, Figure D-3A) were detected. Type I found in liver
and testis corresponded to the transcript predicted by in silico analysis (cf. Figure D-1). It started
at positions resulting in lengths of hE1a of 83 and 110 bp in liver, 79 and 153 bp in testis. The
type II transcripts only found in testis contained an additional exon hE1a-1. hE1a-1 was
separated from hE1a by 93 bp and initiated at different TSSs resulting in lengths of 15, 35, 53,
67, and 107 bp. The type III transcripts were detected in liver and kidney. In addition to the exon
hE1a-1 (135 bp) it contained a second upstream exon, hE1a-2 (285 bp and 234 bp, respectively),
which was separated from hE1a-1 by a 3562-bp intron.
Interestingly, when RLM-RACE experiments were performed with PPK-specific primers
positioned in exon 1, none of the long transcripts was detected (Figure D-3A). All identified
transcripts started at or near position +1 resulting in lengths of hE1 of 49, 65, 67, 68, and 70 bp
for human liver; 65 and 70 bp for human kidney; 59 and 70 bp for human testis. This suggested
that transcription initiation in the distal regions is a rare event, and that the number of analyzed
transcripts was statistically too low to include one of the long transcripts.
To address the question whether TSSs analogous to those of the short form of hPPK are utilized
in mouse, RLM-RACE analyses with mRNA from mouse liver and kidney were carried out.
When the gene-specific primers were located in mE1c, in total five different TSSs within mE1c
were identified (Figure D-3B). The resulting mE1c lengths of 69, 77, 80, 83, and 84 bp were
similar in size to the conventional human exon 1. Since no transcripts corresponding to the
known mouse mRNA (i.e., starting with mE1a) were detected, an additional RLM-RACE
experiment with the PPK-specific primer in mE1a was performed (Figure D-3B). Two types of
transcripts were found in mouse liver, and three in mouse kidney. The type I transcript was
detected in both tissues and started with mE1a, where the lengths of mE1a were 62 and 147 bp in
liver and 63 bp in kidney. Transcripts of type II had an additional upstream exon, mE1a-1, which
was separated from mE1a (180 bp) by an intron of 97 bp in both liver and kidney. mE1a-1 had
the lengths of 66 and 89 bp in liver and 85 bp in kidney. The transcript of type III found
exclusively in mouse kidney contained an additional upstream exon as compared to the type II.

A
B
Figure D-3. Determination of TSSs of the human (A) and mouse (B) PPK genes by RLM-RACE. Boxes represent exons and lines introns of the PPK genes. The black boxes correspond to the conventional exon 1 for human (hE1) and the third exon for mouse (mE1c). Exons between hE1b and hE1g are not shown. Exons are drawn to scale. The positions of gene-specific primers are shown by arrowheads. Roman numerals indicate the different types of transcripts.
D
Multiple transcription start sites and alternative prom
oter regions 75

D Multiple transcription start sites and alternative promoter regions 76
mE1a-2 had a length of 80 bp and was separated from mE1a-1 by a 1393-bp intron. No TSS
corresponding to the 5�-end of the published mouse PPK mRNA (Seidah et al., 1990) was found.
Additional evidence for the use of multiple TSSs was gained from a search of the cap analysis
of gene expression (CAGE) Basic database for human and mouse (Kawaji et al., 2006). The
CAGE database stores 1260079 mouse and 706211 human TSSs which were experimentally
derived from 23 and 15 tissues, respectively. For the hPPK gene, two TSSs were found starting
at positions -11 and +6 of the known mRNA; the resulting exon hE1 lengths would be 81 and 65
bp. In addition, five distal TSSs were detected corresponding to type I (resulting in hE1a of 78
bp), type II (hE1a-1 of 118 and 133 bp), and type III (hE1a-2 of 101 and 395 bp) transcripts. For
mouse, a number of TSSs were mapped to the distal region of the mPPK gene. A total of 9 TSSs
had start sites within mE1a-2; the resulting exon lengths would be 19, 21, 32, 33, 54, 72, 81, 92,
and 95 bp. For mE1a-1, six TSSs were identified, causing mE1a-1 lengths of 24, 31 (n=2), 83,
101, and 114 bp. Ten TSSs were detected with the 5'-ends corresponding to mE1a (22 (n=2), 27,
32, 95, 151, 177, and 180 (n=3) bp), where none of the initiation sites coincided exactly with that
of the known mPPK mRNA (87 bp). Strikingly, the majority of TSSs (143) were grouped into a
single cluster that was mapped to mE1c. The resulting exon lengths varied from 19 to 141 bp
with the dominant peak of 70 (n=21) and 71 (n=27) bp, thus being similar to the size of the
conventional human exon 1.
Taken together, the RLM-RACE and the data-mining results demonstrate that both in mouse
and human transcription of the PPK gene can be initiated at sites which are up to 23 kbp apart.
However, the long transcripts were detectable only when the gene-specific primers in RLM-
RACE experiments were located in the distal exons mE1a and hE1a. Thus, the proximal TSSs
seem to be preferred over the distal initiation sites.
D.1.3 Identification of alternative promoters for the human PPK gene
The results described above and reported earlier (Neth, 2002; Neth et al., 2005) demonstrated
that the transcription of the hPPK gene can be initiated in at least five regions (Figure D-4A).
Accordingly, five different promoters could be utilized for initiation of the hPPK gene
transcription. Neth et al. showed by a reporter gene study that a region proximal to the known
mRNA (hereafter Prox) has a promoter activity (cf. -668/+22, Neth, 2002; Neth et al., 2005).
Further, they suggested that a downstream fragment comprising exon 1, intron 2, and exon 2
might be utilized for the hPPK gene transcription as well (hereafter designated E1i1E2). From
the TSS determination experiments described in section D.1.2 it could be concluded that
transcription of the hPPK gene can be driven by three additional promoters, namely three distal
regions upstream to the exons hE1a, hE1a-1, and hE1a-2 (designated Dist1, Dist2, Dist3,

D Multiple transcription start sites and alternative promoter regions 77
respectively). Therefore, five fragments encompassing the detected TSSs and an adjacent
upstream region of approximately the same length of 750 bp (Figure D-4A) were generated
(C.2.1.2). The putative promoters were cloned into the promoterless vector pSEAP2-Basic
upstream of the reporter gene encoding SEAP, a secreted form of alkaline phosphatase. The
obtained plasmids were transiently transfected into HepG2 and IHKE1 cells (C.2.2.3). Cells
were cotransfected with pCMV-�-gal plasmid to normalize for transfection efficiency. 48 hours
after transfection the activity of the putative promoters was evaluated via measurements of the
SEAP activity in the supernatants of the cells, normalized to the �-gal activity in the respective
lysates (C.2.3).
As shown in the left part of Figure D-4B, in HepG2 cells the Prox promoter was most active
(100 %); the E1i1E2 and the Dist3 alternative promoters had 37 % and 60 % activity,
respectively; the Dist1 and Dist2 promoters showed no significant activity. Differently, in
IHKE1 cells the E1i1E2 promoter was most active (100 %), whereas of the distal promoters
Dist3 had about 19 % activity. Two distal regions, Dist1 and Dist2, and the Prox promoter
showed no activity. Thus, promoter activity determined in the reporter-gene study was in concert
with the results of RLM-RACE experiments. Namely, in the liver all TSSs coincided with or
were close to the position +1 of the known hPPK mRNA, whereas in the kidney the majority of
TSSs were detected within the intron 1 and exon 2. In accordance with these findings, in HepG2
cells the Prox promoter was the most active, in IHKE1 cells the E1i1E2 region had the highest
activity.
Finally, it was examined if the promoters of PPK when cloned into pSEAP2-Basic plasmid
use TSSs analogous to those detected in the human liver and kidney. RLM-RACE analysis
(C.2.6) was performed with total RNA from HepG2 and IHKE1 cells transiently transfected with
the Prox (only HepG2), Dist3, and E1i1E2 pSEAP2 plasmids. The gene-specific primer was
located in the backbone of the pSEAP2-plasmid downstream of the inserted promoter of interest.
For the Prox promoter, RLM-RACE analysis demonstrated that all sequenced transcripts
initiated at the correct TSSs. The resulting lengths of hE1 would be 65, 70 (n=5), 73 (n=2), 75
(n=3), and 81 bp, which are close to the size of the conventional hE1 (70 bp). For the Dist3
promoter, detected TSSs were more diverse as compared to those found in liver and kidney. In
HepG2 cells, TSSs were obtained which would cause hE1a-2 lengths of 229, 230 (n=2), 361
(n=2), 408, 419, 673, and 822 bp. In IHKE1 cells, transcription was initiated from sites which
would result in lengths of hE1a-2 of 211, 221, 232, 276 (n=3), 334 (n=2), 419, and 707 bp. Thus,
the Prox and Dist3 fragments cloned into the reporter vector initiate transcription at sites
corresponding to TSSs found in human tissues.

D Multiple transcription start sites and alternative promoter regions 78
A
B
Basic
Dist3
Dist2
Dist1
Prox
E1i1E2
Prox_
Enh_f
Prox_
Enh_r
0
20
40
60
80
100 HepG2IHKE1
%
Figure D-4. Activity of the putative promoters of the hPPK gene. A. Schematic organization of the 5�-region of the hPPK gene. Shaded boxes represent exons and lines introns. Exons between hE1a and hE1 are not shown. Exons are drawn to scale. The numbers of nucleotides are indicated. Regions with putative promoter activity are shown as double arrows. B. Activity of putative promoters of PPK in HepG2 and IHKE1 cells. The promoter constructs cloned into pSEAP2-Basic plasmid were transiently transfected into the cells as described in Materials and Methods. Activity of the most active promoter in each cell type was taken as 100 %. Activity of the promoterless pSEAP2-Basic vector is indicated as Basic. The data are represented as the means ± standard deviation of at least three independent experiments made in triplicates.
Surprisingly, RLM-RACE analysis for the E1i1E2 pSEAP2 plasmid revealed that only a
small number of transcripts was initiated within the sequence of the E1i1E2 promoter, whereas
the majority of TSSs were mapped to the vector backbone. This phenomenon and its analysis are
described separately in section F.1.
Taking into account that the Dist3 region is connected with the transcription of the hPPK gene
and positioned about 22.5 kbp upstream of the conventional initiation site, it seemed possible
that Dist3 cooperates with a basic promoter of PPK and acts as an enhancer. To check this
possibility, Dist3 was cloned in forward and reverse orientation downstream of the SEAP
reporter gene into the pSEAP2 vector with either the Prox or the E1i1E2 fragments as promoters.
The obtained plasmids were transiently transfected into that cell line in which the respective
promoter was most active (Figure D-4B). However, insertion of the Dist3 region into the
plasmids did not lead to any increase in activity for the Prox and E1i1E2 promoters (Figure

D Multiple transcription start sites and alternative promoter regions 79
D-4B, right part). In HepG2 cells, the Dist3 region in reverse orientation did not result in any
significant change of the Prox promoter activity, whereas in forward orientation it had a slight
repression effect reducing activity of the Prox promoter from 100 % to 64 %. In IHKE1 cells, the
Dist3 region suppressed the E1i1E2 promoter activity from 100 % to 27 % (forward orientation)
and 55 % (reverse orientation). Thus, the Dist3 region can act as an alternative promoter but not
as an enhancer for the hPPK gene transcription in HepG2 and IHKE1 cells.
Taken together, the results suggested a cell-dependent utilization of the Prox and E1i1E2
promoters for the transcription of the hPPK gene. Of the distal promoters Dist3 was active in
both cell lines, whereas Dist1 and Dist2 had no transcriptional activity.
D.2 DISCUSSION
PCR experiments verified for hPPK mRNA expressed in liver, kidney, and testis the presence
of two distal exons hE1a and hE1b analogous to mouse (Figures D-1, D-5). The novel exons are
located approximately 18.3 and 17 kbp upstream from the annotated +1 position of the hPPK
gene, which corresponds to the distances of 13.4 and 12.1 kbp for the analogous mouse exons
mE1a and mE1b. Furthermore, RLM-RACE experiments revealed that transcription of the PPK
gene in human and mouse tissues (liver, kidney and testis) can be initiated even further upstream,
yielding transcripts with one or two additional exons, E1a-1 and E1a-2 (Figures D-3, D-5), each
one with variable TSSs. In the human the three distal start regions are about 18.3, 18.5, and 22.4
kbp upstream of the annotated (proximal) transcription start region. In the mouse the
corresponding distances are about 13.7, 13.9, and 15.5 kbp.
Figure D-5. Overview of novel exons of PPK transcripts. A 34.5-kbp interval of human chromosome 4 is shown at the top. The annotated 3'-end of CYP4V2 and the 5'-end of KLKB1 are drawn to scale. Boxes represent exons and lines introns. At the bottom the location of the novel exons of the hPPK gene determined in RLM-RACE and PCR experiments is shown. Identified PPK transcripts varied in length and combination of the individual exons (cf. Figures D-1, D-2, D-3) , only one example is shown.
D Multiple transcription start sites and alternative promoter regions 80
In addition to transcription initiation at three different distal sites, the diversity of transcripts
is further increased by the fact that the region between the newly identified hE1a and the
conventional hE1 is alternatively spliced resulting in transcripts with two to five exons (hE1b
through hE1f) in different combinations and lengths (Figures D-1, D-2, D-5). Altogether, in three
human tissues (liver, kidney and testis) thirteen types of alternatively spliced transcripts of the
hE1a-hE1g region were identified. Thus, provided that the thirteen types of alternative splicing
are expressed in vivo for each of the three distal transcription start regions, a total of at least 39
alternative long transcripts of the hPPK gene could be generated.
Altogether, in human tissues the transcription of the PPK gene may be initiated in at least five
different regions (proximal, intronic, and three distal regions) at sites which are up to 23 kbp
apart. The existence of multiple transcripts of the hPPK gene that differ substantially in their 5'-
termini reflects the presence of alternative promoters, since one and the same promoter is
thought to drive transcription from different TSSs only when they are located within an about 50
bp-wide region (Suzuki et al., 2001). This will certainly be the case for such tightly clustered
TSSs as the proximal TSSs of the hPPK gene, whereas transcription from distantly apart TSSs
(proximal, intronic and distal TSSs) will be under the control of different promoters.
Examination of the five putative promoters (proximal, intronic, and three distal ones) by
reporter-gene analysis in two cell lines demonstrated that three of them, Prox, E1i1E2, and
Dist3, directed reporter-gene expression (D.1.3) suggesting that these promoters are functional in
vivo. The finding that the Prox promoter shows the highest activity in hepatocytes, whereas
E1i1E2 is most active in kidney epithelial cells, indicates a cell-type dependent utilization of the
two promoters for the transcription of the hPPK gene. This conclusion is consistent with
previous RLM-RACE experiments which mapped the majority of TSSs in human liver close to
the conventional +1 position and in human kidney predominantly downstream of exon 1 (Table
B-1). Of the distal promoters Dist3 is active in both cell lines indicating that it drives
transcription of the hPPK gene from the most distal sites. In contrast, Dist1 and Dist2 showed no
transcriptional activity in the tested cell lines. Dist2 was supposed to control transcription
initiation in exon hE1a-1 giving rise to PPK transcripts of type II (Figure D-3). Such transcripts
were detected only in testis, but not in liver and kidney. Therefore, Dist2 may be utilized to
provide differential regulation of the hPPK gene expression in other tissues than liver and
kidney, in particular in testis. Dist1 was expected to be active at least in HepG2 cells giving rise
to transcripts of type I as found in liver. However, Dist1 was inactive. The alternative
explanation that Dist3 controls transcription initiation from the TSSs clustered in exon hE1a is
unlikely, because it is too far upstream (about 4.0 kbp) of hE1a. Therefore, in hepatocytes the

D Multiple transcription start sites and alternative promoter regions 81
regulatory region driving transcription of the hPPK gene from TSSs clustered in exons hE1a
remains to be identified. Taken together, for three out of five putative promoters it could be
verified experimentally that they are active in vivo.
The findings that alternative promoters/transcription start regions are recruited for transcript-
tion and that the 5' untranslated region is spliced in multiple ways as revealed here for the hPPK
gene fits recently published data. Based on large scale determination of transcription start sites it
has been estimated that 52-58 % of human protein-coding genes are regulated by two or more
alternative promoters with on average 3.1 distinctive putative promoters per gene (Carninci et
al., 2006; Kimura et al., 2006), an independent study predicted multiple promoters for 45 % of
multi-exon genes and for 22 % of these genes the promoters were proven to be functional
(Cooper et al., 2006). Usage of alternative promoters/TSSs giving rise to different primary
transcripts can affect the level of transcription in various tissues and/or at different
developmental stages, splicing events, nuclear export of mRNA and its cytoplasmic localization,
stability of mRNA and translational efficiency, and finally can lead to the generation of protein
isoforms (Ayoubi & Van De Ven, 1996; Hughes, 2006), albeit for the majority of genes with
alternative promoters transcripts with heterogeneous untranslated regions (UTRs) but identical
open reading frames (ORFs) are produced (Denoeud et al., 2007; Landry et al., 2003).
Both usage of alternative TSSs and alternative splicing of the resulting primary transcripts
have been reported for a variety of individual genes, and large scale studies suggested that these
phenomena are common throughout the genome and are not a biological artifact. Recently it has
been demonstrated in the ENCODE pilot study on 1 % of the human genome (The ENCODE
Project Consortium, 2004) that 81.5 % of the tested genes have at least one previously
unannotated initiation site; about 62 % of the genes were found to have alternative internal TSSs,
while approximately 68 % have unannotated 5' extensions (Denoeud et al., 2007). Distribution
analysis of the distances between the novel upstream and the previously annotated TSSs revealed
that most 5' extensions (> 70 %) span more than 10 kbp, and approximately 12 % of all detected
TSSs are found at a distance between 10 and 25 kbp of the most 5' annotated exon (The
ENCODE Project Consortium, 2007). Moreover, in 87 % of the genes with 5' extensions at least
one of the detected transcripts reaches into upstream-positioned genes, often (> 50 %)
corresponding to annotated exons of a neighboring gene. Consistently, in the case of the hPPK
gene all distal TSSs were about 18-23 kbp upstream of the originally annotated +1 position. The
next gene upstream of the hPPK gene, CYP4V2, encodes a cytochrome P450. Analysis of the
novel exons of extended PPK transcripts revealed that exons hE1a-2, hE1a-1, hE1a, and hE1b
are shared with the CYP4V2 gene, while the exons hE1c through hE1f fall into the intergenic

D Multiple transcription start sites and alternative promoter regions 82
region (Figure D-5). Thus, transcription of the hPPK gene may produce chimeric transcripts that
include sequences from the neighboring locus.
Intriguingly, the ENCODE survey demonstrated that the transcriptome of kidney and testis
showed much higher complexity as compared to liver in respect to the number of detected TSSs.
Moreover, testis and kidney belong to the three sources with the highest number of the tissue-
specific TSSs (9.6 % of the newly identified TSSs is specific to testis, 5.7 % to stomach, 4.6 %
to kidney, 1.5 % to liver) (Denoeud et al., 2007). Consistent with this observation, transcription
of the human PPK gene in kidney and testis is characterized by a wide diversity of the proximal
TSSs, whereas in liver the hPPK gene transcription initiates at a few tightly clustered TSSs
(Table B-1). For the distal TSSs comparative analysis revealed no obvious correlation with the
ENCODE results, seven distal TSSs were identified in testis, but only one in kidney and three in
liver. As far as the total number of tissue-specific initiation sites is concerned, intercomparison
of the distal, proximal and intronic TSSs utilized for the hPPK gene transcription in liver, kidney
and testis (cf. Table B-1, Figure D-3) revealed the presence of thirteen unique TSSs in testis,
twelve in kidney and five in liver, again in agreement with the ENCODE results. As a whole, the
transcription of the hPPK gene can be initiated at multiple, distantly apart TSSs and several of
them are tissue-specific.
Taken together, the comprehensive analysis of the PPK gene transcripts demonstrates the
presence of highly heterogeneous 5' UTRs resulting from recruitment of different promoters,
from a variation in the initiation sites utilized by each promoter, and from alternative splicing.
The significance of multiple alternative 5' UTRs is currently being appreciated as a means of
gene expression regulation, on the one hand at the level of gene transcription, on the other at the
level of translation.
In particular, high heterogeneity of UTRs enables a post-transcriptional regulation of
coordinated gene expression. Namely, gene expression in eukaryotes can be regulated at the
mRNA level by trans-acting factors (RNA-binding proteins and non-coding RNAs) interacting
with multiple regulatory elements within the mRNAs, especially within their UTRs. In addition,
according to the post-transcriptional operon model (Keene & Tenenbaum, 2002; Keene & Lager,
2005), if a regulatory element is shared by several mRNAs, they can be co-regulated as a group,
while other regulatory elements, present in only one mRNA, can allow it to be regulated
independently of the other mRNAs. Hence, mRNAs encoding proteins with multiple functions
can be independently co-regulated with different subsets of mRNAs due to unique combinations
of the cis-acting elements within the transcript and the trans-acting factors available.

D Multiple transcription start sites and alternative promoter regions 83
Additional control depending on the 5' UTR involves the internal ribosome entry site,
upstream ORFs, 5' terminal polypyrimidine sequences, RNA secondary structure, and the
methylation state of the cap structure (Audic & Hartley, 2004; Hughes, 2006). Concerning in
particular the alternative 5' UTRs of the PPK gene, they contain multiple upstream ORFs which
might downregulate PPK translation by restricting the access of ribosomes to the correct start
codon in exon 2. For example, the PPK transcript type IV (Figure D-2) contains 10 short reading
frames of lengths ranging from 20 (smaller ones are not counted here) to 111 amino acids, while
the PPK transcript type XIII contains only 5 alternative ORFs ranging from 20 to 68 amino
acids.
The detailed examination of alternative reading frames in the multiple 5' UTRs of the hPPK
gene reveals that the longest ORF being 111 amino acids in length resides within exons hE1d,
hE1e, and hE1f (cf. transcripts type II and IV, Figure D-1). Since none of the upstream ORFs
extends to the correct start codon in exon 2 of the hPPK gene, all detected PPK transcripts code
the classical protein. Neither fusion proteins with altered N-termini nor other proteins translated
in different reading frames are created. Differently, a truncated form of a PPK molecule lacking
the signal peptide and at least 19 amino acids of the mature protein might be produced from the
transcripts starting downstream of the regular start codon in exon 2 (Neth, 2002; Neth et al.,
2005).
The multiplicity of detected hPPK gene transcripts resulting from utilization of different
promoters and alternative splicing demonstrates that the transcription of the hPPK gene can be
regulated in many ways. In addition, the large variety of transcripts provides the possibility of
multifaceted control at the translational level including coordinated translation with other
proteins according to the post-transcriptional operon model. Overall, synthesis of plasma
prekallikrein can be meticulously regulated and fine-tuned both at the transcriptional and
translational level. This argues for that a temporal and spatial control of PPK expression is
important and thus supports the concept that plasma prekallikrein/plasma kallikrein plays
hitherto unknown diverse functional roles at various developmental stages and/or in various
tissues and cell types (Hermann et al., 1999; Neth et al., 2001).

E Proximal promoter and NF1 transcription factor 84
E Role of the nuclear factor 1 transcription factor for the expression of the human
PPK gene
E.1 RESULTS
E.1.1 Site-directed mutagenesis of the Prox promoter delineates three regions of critical
cis-acting elements
To explore the molecular mechanisms underlying transcriptional control of the hPPK gene,
the Prox fragment shown to be the principal promoter utilized in hepatocytes, the primary site of
the hPPK synthesis, was further investigated (D.1.3). A previously performed deletion analysis
of the Prox promoter had shown that the 150 bp region upstream of the hPPK gene (hereafter
referred to as the basic control region) retains more than 50 % of the whole proximal promoter
activity (Neth, 2002; Neth et al., 2005). To identify cis-acting elements, the basic control region
in the context of the Prox promoter was screened by substitution mutation analysis with
consecutive mutations of 6 bp each. The substitution mutations were introduced by a
megaprimer method using as a general rule aBc, gBt exchange (C.2.1.4). The mutated forms of
the Prox promoter were inserted into the promoterless reporter vector pSEAP2-Basic (C.2.1.8),
the obtained plasmids were transiently transfected into HepG2 cells (C.2.2.3), and promoter
activity of the mutants was measured by a chemiluminescent assay (C.2.3).
As shown in Figure E-1 the mutations 19, 21, and 06 abolished the promoter activity almost
completely. Mutations 15, 20, 23, and 24 reduced the activity to 10 – 20 % of the wild type, and
two other mutations, 05 and 26, to 40 % and 32 %, respectively. Transcriptional activities
between 50 % and 75 % were observed for the Prox pSEAP2 plasmid with mutations 09 (68 %),
04 (70 %), 16 (61 %), 18 (61 %), 22 (52 %), and 28 (62 %). The mutations 10, 01, 25 led to a
slight decrease in activity to 88 %, 85 %, 91 %, respectively, although for mutation 10 the
reduction was not significant. The mutation 12 resulted in a slight increase in activity to
approximately 135 % as compared to the wild-type Prox promoter. A several fold induction of
promoter activity (310 %, 440 %, and 210 %) was presumably caused by introducing new TF
binding sites or disrupting the recognition sequence of a repressor in the Prox promoter by
mutations 13, 14 and 17, respectively. The remaining mutants 11, 02, 03, and 27 exhibited no
significant change in promoter activity. The most critical cis-acting elements identified by site-
directed mutagenesis were grouped into the three regions, region 1, 2 and 3 (Figure E-1).
To examine if the TSS utilization was affected by the mutations, the start site used for
transcription of the SEAP gene was determined for the randomly chosen IM03 pSEAP2 plasmid.

E Proximal promoter and NF1 transcription factor 85
The detected TSSs corresponded to hE1 lengths of 70 (n=3), 73, 78 (n=2), 81, and 111 bp;
therefore it was concluded that the introduced mutations did not affect the TSSs usage.
Prox
IM09
IM10
IM11
IM01
IM02
IM03
IM04
IM05
IM12
IM13
IM14
IM15
IM16
IM17
IM18
IM19
IM20
IM21
IM22
IM06
IM23
IM24
IM25
IM26
IM27
IM28
0
25
50
75
125
150
175
200
225
250
100%
300350400450500550
%
)�
�
*!�+���
* !+�
*��+���
Figure E-1. Substitution mutation analysis of the Prox promoter of the hPPK gene. Consecutive segments of 6 bp each were mutated within the basic control region –152/+22 of the Prox promoter (–668/+22) by a megaprimer method using as a general rule aBc, gBt exchange. Designations of the mutants are given below the columns. 1, 2 and 3 indicate the regions with the most effective mutations. The position of the published transcription start site is marked by an arrow. The promoter activity of the mutants was monitored in HepG2 cells as described in Materials and Methods. Results shown are the means ± standard deviation of at least three independent experiments performed in triplicates.
Thus, there are at least three regions (1, 2 and 3) of important elements within the basic
control region of the Prox promoter. TFs binding to these elements are most likely to have a
profound effect on transcription of the hPPK gene.
E.1.2 Multiple DNA-binding proteins interact with regions 1 and 3 of the basic control
region
To identify TFs that interact with the defined regions and accordingly might be responsible
for the in vivo control of the hPPK gene transcription, electrophoretic mobility shift assays
(EMSAs) were employed (C.2.10). Firstly, a database search was performed to predict which
known TFs and TF families might be capable of binding to the regions with important cis-acting
elements (C.2.13). The MatInspector program proposed TATA-binding protein (TBP) and
nuclear factor Y (NFY) to be candidates for binding to the region 1 and TG-interacting factor
(TGIF) to the region 3. The predicted protein-DNA interactions were tested by EMSA with

E Proximal promoter and NF1 transcription factor 86
nuclear extracts from HepG2 cells (C.2.10.1) and oligonucleotides encompassing the identified
regions of critical elements and several adjacent bases at their 5�- and 3�-ends (Table C-12).
At least three complexes were obtained with P32-labeled Probe 1 (Figure E-2A, labeled bands
1 through 3). A factor responsible for the lower band seemed to be unstable and easily affected
by casual variations in experimental conditions since the complex was not in all experiments
visible. Addition of a 100-fold excess of unlabeled Probe 1 oligonucleotide abolished the bands
and thus demonstrated specificity of binding. To address the sequence-specificity of the protein-
DNA interactions, competition experiments were performed with unlabeled probes containing
the same substitution mutations as used in mutation analysis (E.1.1). The mutant competitor
Probe 1 M23 had no affect on all three complexes, thus, the mutation 23 disrupted binding sites
in such a way that they no longer bound to the respective proteins. Inclusion into a binding
reaction of the unlabeled mutant competitors Probe 1 M06 and Probe 1 M24 resulted in detection
of faint bands corresponding to the complexes 2, 3 and 1, 2, 3, respectively, suggesting that the
two mutations reduced the affinity of the proteins to the respective DNA sequences only slightly.
Mutation 06 had no affect on the protein-DNA interaction corresponding to the complex 1 since
the Probe 1 M06 oligomer competed successfully. To characterize TFs present in complexes 1, 2
and 3, competition experiments with consensus oligonucleotides were performed. Neither TBP
nor NFY consensus oligomers could compete with the labeled Probe 1 for specific binding
suggesting that these TFs are not involved in the formation of the observed complexes.
Specific complexes were also detected with Probe 3 in EMSA (Figure E-2B). Formation of a
prominent upper band (1) and two lower doublets (2 and 3) was completely prevented when the
reaction was performed in the presence of a 100-fold excess of the unlabeled wild-type probe but
not in the presence of the Probe 3 M15 oligomer. It indicated that the complexes were specific,
and the mutation 15 disrupted the recognition sequence of the TFs involved in the formation of
the complexes. However, competition experiments with the TGIF consensus oligonucleotide and
its mutant resulted in the band pattern identical to the Control thus disproving the in silico
prediction of specific participation of the TGIF in any of the complexes.
Taken together, transcription factors TBP, NFY and TGIF predicted to bind to the regions 1
and 3 of the Prox promoter could not be identified as components of specific complexes detected
in the EMSA experiments.
In addition, potential protein-DNA interactions were screened in supershift experiments with
antibodies specific for TFs of the ATF/CREB, AP-1, NFFB, C/EBP, and IRF families (Table
C-13). Neither supershift nor disappearance of any band were detected with any of the two

E Proximal promoter and NF1 transcription factor 87
oligonucleotides as a probe (data not shown). Thus, the nature of the TFs specifically binding to
the region 1 and region 3 of the basic control region remains unknown.
Figure E-2. Sequence-specific protein-DNA interactions of the regions 1 and 3 of the Prox promoter. A. EMSA competition experiments with P32-labeled Probe 1 oligomer and nuclear extracts from HepG2 cells. Unlabeled Probe 1, mutant probes and consensus oligonucleotides (wild-type and mutant) for TBP and NFY transcription factors were used as competitors. The thin white line between the Control and cons TBP lanes is due to that several lanes present in the gel are not shown in the figure. B. Analogous EMSA competition experiments with P32-labeled Probe 3 and unlabeled Probe 3, the mutated forms of Probe 3, and consensus oligonucleotides for TGIF as competitors. All introduced mutations corresponded to those used in substitution mutation analysis. Specific complexes are numbered and indicated by arrows.
E.1.3 Nuclear factor 1 binds in vitro and in vivo to the region 2 of critical cis-acting
elements of the Prox promoter
Nuclear factor 1 (NF1) was predicted by the programs MatInspector and Patser to bind to the
region 2 of important cis-acting elements. The NF1 binding site represents a palindrome-like

E Proximal promoter and NF1 transcription factor 88
sequence composed of two TTGGCA half sites with three spacer nucleotides (Osada et al.,
1996). An alignment of the consensus NF1 recognition sequence to the Prox promoter (Figure
E-3A) showed that the 5'-half site would be disrupted by the mutations 19 and 20, whereas the
3'-half site would be affected solely by the mutation 21. Incubation of the P32-labeled Probe 2
with the HepG2 nuclear extract resulted in detection of three complexes (Figure E-3B). These
complexes were shown to be specific as their formation was prevented by an excess of the
unlabeled Probe 2. Subsequently, competition experiments were performed with mutated forms
of Probe 2 to identify the specific binding sites. Mutated Probe 2 oligonucleotides, designated
Probe 2 M19, Probe 2 M20, and Probe 2 M21, were generated by introducing the respective
substitution mutations used in mutation scanning analysis. As shown in Figure E-3B, Probe 2
M19 and Probe 2 M20 did not compete with the P32-labeled Probe 2 for the specific nuclear
factors thus indicating that mutations 19 and 20 prevented the formation of all three complexes.
However, Probe 2 M21 still could successfully compete for a TF responsible for the formation of
the largest complex suggesting that its binding site was not affected by the mutation 21. Besides,
inclusion of the Probe 2 M21 as a competitor resulted in appearance of the middle (barely visible
in the figure) and lower complexes again, but to a lesser extent as compared to Probe 2 M19 or
M20. It suggested that introduction of the mutation 21 into Probe 2 changed binding affinities of
nuclear factors responsible for the formation of the mentioned complexes, but did not completely
disrupt the respective binding sites.
To determine if the complexes were related to NF1 protein, NF1 consensus oligonucleotide
and its mutated form were used in competition experiments. NF1 consensus oligonucleotide
efficiently competed for binding nuclear factors involved in formation of the two lower
complexes. Competition was effectively blocked by mutation of the NF1 consensus sequence.
To determine if these complexes were in fact formed by NF1 proteins, a NF1 antiserum
(SantaCruz) was added to the reaction mixture. This resulted in preventing the formation of the
same two bands confirming that NF1 was included in the detected complexes. The nature of
other TFs involved in formation of the observed complexes remains to be identified. Supershift
experiments demonstrated that at least TFs of the ATF/CREB, AP-1, NFFB, C/EBP, and IRF
families (Table C-13) did not participate in formation of the specific complexes (data not
shown).

E Proximal promoter and NF1 transcription factor 89
Figure E-3. NF1 binds to the region 2 of important cis-acting elements in the Prox promoter. A. Alignment of the NF1 consensus sequence to the –66/–41 region of the PPK promoter used as Probe 2 in EMSA experiments. Designations mut19, mut20 and mut21 under the 6 bp segments indicate the position of the respective mutations used in substitution mutation analysis. B. Competition and supershift experiments with P32 labeled Probe 2. Unlabeled Probe 2, mutated forms of Probe 2 and competitors as well as an antibody specific for the NF1 transcription factor were analyzed. Arrows indicate the detected complexes.

E Proximal promoter and NF1 transcription factor 90
The ability of NF1 transcription factor to bind in vitro to the region 2 did not necessarily
prove that the same protein would bind to this sequence in vivo, since access to DNA-binding
sites may be influenced by such factors as chromatin structure, occupancy of the binding sites by
other DNA-binding proteins, and intranuclear availability of the NF1 proteins. To determine
whether NF1 protein interacts with the Prox promoter in vivo, chromatin immunoprecipitation
(ChIP) was performed (C.2.11). Chromatin fragments were immunoprecipitated from HepG2
cells with the anti-NF1 antibody H300 (SantaCruz). Levels of the –61/+10 fragment (numbers
are relative to the published +1 position of the mRNA, NM_000892) of the Prox promoter
encompassing the NF1-binding site were quantified using quantitative real-time PCR in the
DNA fragments pulled down by the anti-NF1 antibody and were compared with their levels in
the nonspecific DNA fragments pulled down by normal IgG. ChIP with the anti-NF1 antibody
led to a moderate enrichment of the –61/+10 region of the Prox promoter (4.28±1.27-fold; n=4)
(Figure E-4) thus indicating an association of the NF1 with the Prox promoter in vivo.
IgG NF1 (H-300)0
1
2
3
4
5
6
Fold
indu
ctio
n
Figure E-4. Association of NF1 with the Prox promoter of PPK in vivo. ChIP assays were performed with HepG2 cells using either normal rabbit IgG or the anti-NF1 antibody H300 (SantaCruz). The levels of the PPK region containing the NF1 binding site were quantified using quantitative real-time PCR.
Mammalian NF1 proteins include the NF1-A, NF1-B, NF1-C, and NF1-X isoforms (reviewed
in Gronostajski, 2000). In EMSA and ChIP experiments it was not possible to distinguish
between different NF1 proteins since anti-NF1 antibody H300 recognizes all NF1 isoforms.
E.1.4 NF1-B expression elevates the level of human PPK mRNA
After showing in vitro and in vivo binding of the NF1 to the Prox promoter of the hPPK gene
it was attempted to show by overexpression of NF1 isoforms and RNA interference approach
(E.1.5) if this interaction is physiologically relevant. The ability of NF1 isoforms to activate the
hPPK gene transcription was tested. Hemagglutinin-tagged NF1-A, NF1-B, NF1-C, and NF1-X
proteins were overexpressed in HepG2 cells via transient transfection with pCHNFI-A1.1,
pCHNFI-B2, pCHNFI-C2, pCHNFI-X2 vectors (C.1.4.5). pCH vector expressing no protein was
used as a reference. 48 h after transfection, total RNA was isolated (C.2.4), reverse transcribed
into cDNA (C.2.5), and the cDNAs of the NF1 isoforms and PPK were quantified by
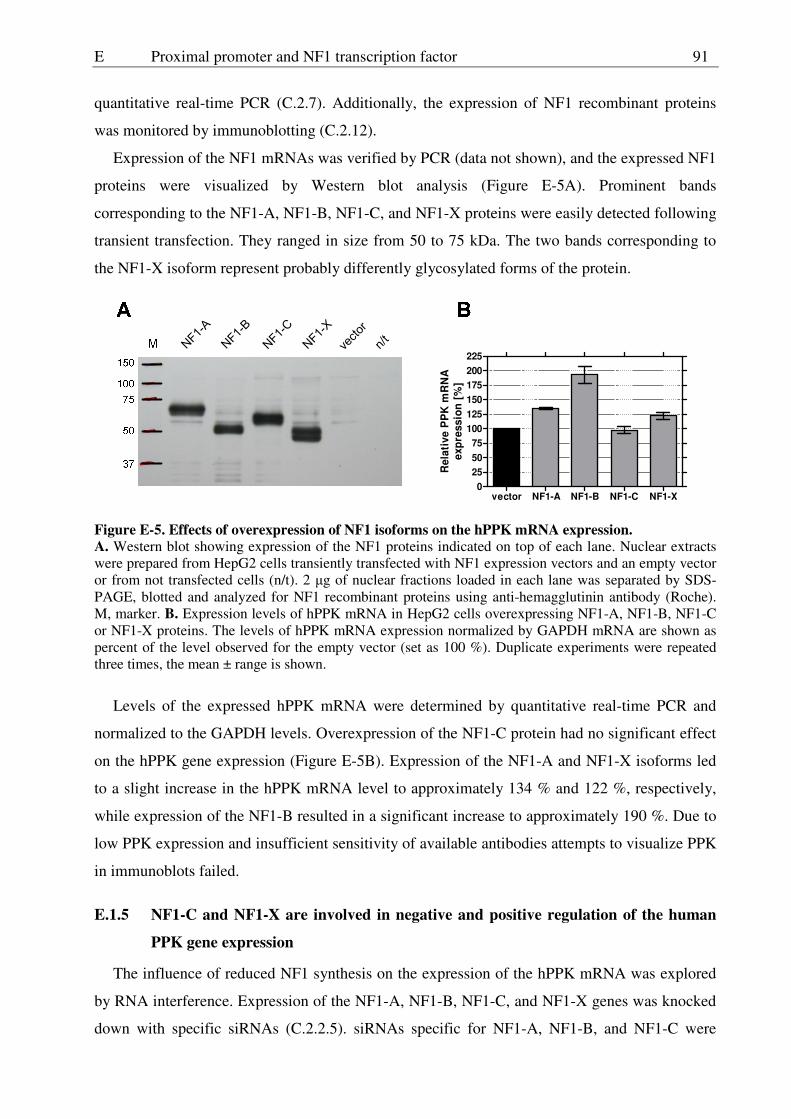
E Proximal promoter and NF1 transcription factor 91
quantitative real-time PCR (C.2.7). Additionally, the expression of NF1 recombinant proteins
was monitored by immunoblotting (C.2.12).
Expression of the NF1 mRNAs was verified by PCR (data not shown), and the expressed NF1
proteins were visualized by Western blot analysis (Figure E-5A). Prominent bands
corresponding to the NF1-A, NF1-B, NF1-C, and NF1-X proteins were easily detected following
transient transfection. They ranged in size from 50 to 75 kDa. The two bands corresponding to
the NF1-X isoform represent probably differently glycosylated forms of the protein.
vector NF1-A NF1-B NF1-C NF1-X0
255075
100125150175200225
Rel
ativ
e P
PK
mR
NA
expr
essi
on [
%]
,-���
,-���
,-���
,-��.
#$����
�+�
Figure E-5. Effects of overexpression of NF1 isoforms on the hPPK mRNA expression. A. Western blot showing expression of the NF1 proteins indicated on top of each lane. Nuclear extracts were prepared from HepG2 cells transiently transfected with NF1 expression vectors and an empty vector or from not transfected cells (n/t). 2 �g of nuclear fractions loaded in each lane was separated by SDS-PAGE, blotted and analyzed for NF1 recombinant proteins using anti-hemagglutinin antibody (Roche). M, marker. B. Expression levels of hPPK mRNA in HepG2 cells overexpressing NF1-A, NF1-B, NF1-C or NF1-X proteins. The levels of hPPK mRNA expression normalized by GAPDH mRNA are shown as percent of the level observed for the empty vector (set as 100 %). Duplicate experiments were repeated three times, the mean ± range is shown.
Levels of the expressed hPPK mRNA were determined by quantitative real-time PCR and
normalized to the GAPDH levels. Overexpression of the NF1-C protein had no significant effect
on the hPPK gene expression (Figure E-5B). Expression of the NF1-A and NF1-X isoforms led
to a slight increase in the hPPK mRNA level to approximately 134 % and 122 %, respectively,
while expression of the NF1-B resulted in a significant increase to approximately 190 %. Due to
low PPK expression and insufficient sensitivity of available antibodies attempts to visualize PPK
in immunoblots failed.
E.1.5 NF1-C and NF1-X are involved in negative and positive regulation of the human
PPK gene expression
The influence of reduced NF1 synthesis on the expression of the hPPK mRNA was explored
by RNA interference. Expression of the NF1-A, NF1-B, NF1-C, and NF1-X genes was knocked
down with specific siRNAs (C.2.2.5). siRNAs specific for NF1-A, NF1-B, and NF1-C were

E Proximal promoter and NF1 transcription factor 92
generated using GenScript siRNA Target Finder. NF1-C siRNA was designed to target both
known mRNAs (NM_005597, NM_205843). A non-silencing siRNA served as the negative
control for knockdown efficiency, whereas validated NF1-X siRNA guaranteed to provide 82 %
of knockdown level was used as the positive control.
Efficiency of NF1 knockdown was determined by comparing expression levels of the NF1
isoforms between HepG2 cells transfected with specific and with non-silencing siRNAs (Figure
E-6A). Expression of NF1-X protein was knocked down to 18 %, it confirmed the data of the
manufacturer indicating that the protocol of siRNA transfection worked well. The data indicated
high and moderate knockdown efficiencies for the NF1-C (80 %) and NF1-A (71 %),
respectively. Although NF1-B siRNA complied with the rules of potent siRNA design, the target
mRNA was down-regulated only to 39 % of its normal expression level; this silencing efficiency
was the best of three different siRNAs directed against different regions of the NF1-B mRNA
(data not shown). Noteworthy, the NF1-B mRNA is 8159 bp in length, whereas NF1-A (2684
bp), NF1-C (2185 and 2401 bp), and NF1-X (5575 bp) mRNAs are significantly shorter. It
seems that NF1-B RNA is refractory to RNAi-mediated silencing likely due to the existence of
stable secondary structures.
NegContr
NF1-ANF1-B
NF1-CNF1-X
0
25
50
75
100
125
150
175
Rel
ativ
e P
PK
mR
NA
expr
essi
on [
%]
NegContr
NF1-A
NF1-B
NF1-C
NF1-X
0102030405060708090
100110
Rel
ativ
e m
RN
Aex
pres
sion
of
NF1
isof
orm
s [%
]
Figure E-6. Effect of siRNA-mediated knockdown of NF1 isoforms on expression of the hPPK gene. A. Efficiency of the NF1 knockdown. B. Effect of NF1 silencing on the hPPK gene transcription. HepG2 cells were transfected with either negative control siRNA or siRNA specific for NF1-A, NF1-B, NF1-C and NF1-X. After 24 h RNA was isolated, reverse-transcribed, and subsequently analyzed by quantitative real-time PCR. Levels of NF1 and hPPK mRNAs are normalized by those of GAPDH mRNA. The transcription of NF1 isoforms and of PPK is shown as percent of that observed with the non-target-directed siRNA (NegContr, set as 100 %). Duplicate experiments were repeated three times, the mean ± standard deviation is shown.
The knockdown of NF1-C expression induced expression of the hPPK gene to 155 % (Figure
E-6B). Silencing of NF1-X led to a slight decrease in the hPPK mRNA level to 80 %. The down-
regulation of the NF1-A and NF1-B did not affect expression of the hPPK gene. These results
suggest that NF1-C and NF1-X are involved in negative and positive regulation of the hPPK

E Proximal promoter and NF1 transcription factor 93
gene expression, respectively. The missing of effects of NF1-A and NF1-B knockdown on the
expression of PPK may be due to the insufficient silencing efficiency or the absence of effects of
these factors on the transcription of the hPPK gene.
E.2 DISCUSSION
Investigation of the transcriptional mechanisms by which the human plasma prekallikrein
gene generates multiple mRNAs with alternative 5' UTRs led to the identification of three
alternative promoters (D.1.3). Of the three promoters the region proximal to the known mRNA,
Prox promoter, shows the highest activity in hepatocytes. Consistently, RLM-RACE data
indicate that in liver, which is the primary site of PPK synthesis, transcription of the hPPK gene
is initiated predominantly at or close to the conventional +1 position. Therefore, further studies
on the regulation of the hPPK gene expression focused first on the Prox promoter.
Substitution mutation analysis of the basic control region (-152/ +22 relative to the known +1
position) of the Prox promoter (-668/+22) revealed a series of important control elements
(Figures E-1, E-7), most of them being located within 90 bp upstream of the +1 position. Of the
14 mutations in this region 12 led to reduction of promoter activity, with 7 of them reducing
transcriptional activity to less than 25 %, one had no effect, and one resulted in enhanced
promoter activity. The mutations resulting in reduction of promoter activity to less than 25 % are
located in region 1 (-39/-21), region 2 (-63/-46), and region 3 (-87/-82). In the 5'-terminal 60-bp
segment of the basic control region only one positive cis-element is significantly affected by a
mutation (at position -111/-106 bp, cf. IM05, Figures E-1, E-7). The transcriptional activity of
the respective mutant is about 40 %, while all of the remaining mutants have more than 50 % of
the wild-type promoter activity and three of them above 100 %. It should be noted that in the
present study possibly not all of the key elements have been identified. Elements of which
redundant ones are present could have been overlooked, since the mutation of only one of them
at a time would have little effect on promoter activity. For the detection of such elements
additional mutant analyses will be necessary.
The observation that mutations 13, 14 and 17 caused a several fold higher activity than the
wild-type promoter can be explained in two ways. On the one hand, the introduction of these
substitution mutations could have led to the accidental creation of a new binding site for an
activator or to an improvement of an existing recognition site. This is likely to be true for the
region affected by mutation 17, since introduction of the mutation 17 led to a doubling of the
promoter activity, while the two flanking mutants 16 and 18 exhibited half of the wild-type
activity. On the other hand, the increased promoter activity can result from disruption of a
binding site for a transcriptional repressor. This seems to be the case for the region -99/-88 which

E Proximal promoter and NF1 transcription factor 94
is affected by two consecutive mutations 13 and 14, both resulting in a severalfold increase in
activity. It is unlikely that each of the two mutations by itself introduced a new binding site for a
strong activator or improved an existent binding site. In addition, the preceding mutant 12
(-105/-100) exhibited slightly increased activity suggesting that this substitution mutation
affected the affinity of the binding sequence for a repressor as well, although not so pronounced
as mutations 13 and 14. A database search using the MatInspector program provided a list of
potential transcription factor binding sites within the -105/-88 region. A potential binding factor
is the transcription factor E4BP4 (E4 binding protein 4), since its consensus sequence
(G/A)TTA(T/C)GTAA(C/T) can be nicely mapped to the region -99/-88 affected by mutations
13 and 14. Moreover, E4BP4 is expressed in liver and it behaves as an active transcriptional
repressor that directly suppresses the transcriptional activities of genes to whose promoters it
binds (Cowell, 2002). One of its targets is the gene encoding von Willebrand factor which is
involved in blood coagulation (Hough et al., 2005). Additional experiments will be necessary to
examine if E4BP4 can bind to the -99/-88 sequence and thus suppress Prox promoter activity.
Figure E-7. Sequence of the basic control region of the Prox promoter. The 5-8 bp segments of the -152/+22 region which were independently mutated in substitution mutant analysis are indicated. The sequence segments which upon mutation resulted in reduction of promoter activity to less than 25 % are highlighted in dark grey, to 25-50 % in grey, to 50-100 % in light grey. Segments whose mutation had no effect on activity are not highlighted. The sequence segments which upon mutation showed an increase of promoter activity are in bold. +1 indicates the start site of the known PPK mRNA.
As a whole, the high density of critical nucleotides within the 90-bp sequence upstream of the
conventional +1 position (regions 1, 2, 3) and its proximity to the main TSS suggest that the
general transcription factors and RNApolII bind to this region. For the 5'-terminal 60 bp of the
analyzed -152/+22 region the experimental data suggest that activators / respressors bind to it.
Thus, the 90-bp sequence upstream of the major TSS is sufficient for basal activity of the Prox
promoter, while the following 60 bp 5' upstream are more likely to contribute to the regulated

E Proximal promoter and NF1 transcription factor 95
transcription of the hPPK gene. Consistently, deletion mutation analysis (Neth, 2002; Neth et al,
2005) had demonstrated that the fragment -152/+22 had high promoter activity which was
reduced to one fourth by deletion of 50 bp at the 5'-end. The resulting fragment -102/+22 still
exhibited activity significantly above background, whereas the following deletion mutant
-23/+22, comprising only 23 bp of the 90-bp sequence, had no promoter activity
Examination of the Prox promoter sequence for binding sites of known transcription factors
led to the identification of a TATA-box motive at -39 to -32. According to recent data, in more
than 70 % of cases where a TATA-box is found within 50 bp upstream of a TSS, the TATA-box
motive starts 28-33 bp upstream of the major initiation site, with a distance of 30-31 bp being
strongly preferred (Carninci et al., 2006). The putative TATA box of the Prox promoter is a few
bp upstream of the most preferred position, but can be expected to be functional. However,
EMSA experiments with oligonucleotides encompassing the region 1 rejected a specific binding
of the TATA-binding protein (TBP) to this region indicating that the Prox promoter has no
TATA-box and belongs to the large fraction of TATA-less mammalian promoters. According to
recent estimations only about 16 % of mammalian promoters contains a functional TATA box
(Cooper et al., 2006), as opposed to the earlier belief that most promoters have a TATA box
(Smale & Kadonaga, 2003).
A different core promoter element, the Inr element, was found to be the most common (Gross
& Oelgeschläger, 2006). Actually, of the known core promoter motives, only the TATA box and
the Inr element have been shown to be capable of directing specific transcription initiation of
protein encoding genes by RNApolII, independent of other core promoter elements. The
molecular events leading to preinitiation complex (PIC) assembly and RNApolII transcription
initiation on TATA-containing promoters are well studied, whereas not much is known about the
general mechanism of PIC formation on Inr-dependent TATA-less promoters. But it has been
shown that DNA-binding activity of TBP of the TFIID complex is dispensable for Inr-dependent
transcription from TATA-less promoters. Instead, TFIID interactions with the Inr element are
thought to be mediated by the components TAF1 and TAF2 of the complex.
In the Prox promoter of the hPPK gene consensus sequences of the Inr element were
identified for several TSSs including the known +1 position (Neth et al., 2005). To examine if
the Inr element of the +1 position may be able to direct accurate transcription of the hPPK gene
from the TATA-less Prox promoter, the Inr element will have to be mutated and the mutant
checked for the ability to drive the transcription of a reporter gene. In addition, it will have to be
examined if TAF1 binds to the Inr sequence and thus mediates assembly of the PIC.
Inadvertently, in the substitution mutant analysis the mutations 27 and 28 affected the 3'- and 5'-

E Proximal promoter and NF1 transcription factor 96
end, respectively, of the Inr sequence of the +1 position. This resulted in unchanged and
decreased (62 %) activity, respectively, of the Prox promoter. However, based on these results
no final conclusion concerning the functionality of the Inr element can be drawn, since no
mutants targeting directly the Inr element have been checked by reporter gene assays. Besides, it
has not been examined if the same TSS is utilized by the mutants 27 and 28 and the wild-type,
i.e. if the function of the Inr element of +1 position could be taken over by a different core
promoter motive.
A database search identified a NF1 binding site in the region 2 of the Prox promoter.
Subsequent EMSA and ChIP assays demonstrated that NF1 proteins indeed interact with this
region in vitro and in vivo. The NF1 gene family of vertebrates contains four highly homologous
genes, NF1-A, NF1-B, NF1-C, and NF1-X, which appear to have arisen from a single
duplication of a genomic segment containing two NF1 intermediate genes (Gründer et al., 2003).
To test the potential roles of individual NF1 proteins in the hPPK gene transcription,
overexpression and knockdown studies of all four NF1 isoforms were performed. In these
experiments, overexpression of only NF1-B increased the hPPK mRNA level significantly, while
that of NF1-A and NF1-X led only to a slight increase of the hPPK mRNA level and
overexpression of NF1-C had no effect. The other way around, down-regulation of NF1 factors
revealed negative and positive contribution of NF1-C and NF1-X proteins, respectively, to the
expression of the hPPK gene. The fact that NF1-B overexpression induces hPPK gene
transcription but has no effect when silenced suggests that this TF is not important for the basal
expression of the hPPK gene, but rather plays a role in the regulated PPK transcription. In
contrast, NF1-C is involved in the constitutive hPPK gene expression, since it affects PPK
expression when silenced but not when overexpressed. Finally, the level of PPK transcripts is
directly linked to the level of NF1-X protein, since the down-regulation of NF1-X results in a
reduced level of PPK mRNA, and the overexpression of NF1-X leads to an increased level of
PPK transcripts.
Against expectation, silencing of none of the NF1 proteins resulted in abolishment of the
hPPK gene expression. One possible explanation is that functional redundancy between highly
homologous members of the NF1 family may obscure their functions, i.e. NF1 isoforms may
take over the function of the silenced NF1 protein. It is also possible that a different TF
contributes to the full activity of the Prox promoter through binding to the region 2 of critical
cis-acting elements. EMSA experiments argue for this possibility, since one specific complex
was identified that did not include the NF1 proteins (cf. the largest complex, Figure E-3B). The
nature of TF(s) involved in the formation of this complex remains to be elucidated.

E Proximal promoter and NF1 transcription factor 97
Taken together, the precise role of NF1 proteins in hPPK gene expression appears to be
difficult to elucidate, which is consistent with the literature. For example, along with the well
studied observation that NF1-C protein is able to activate transcription through direct interaction
with basal transcription factors, the NF1-C has also been reported to be implicated in the
repression of transcription by several promoters including those of cyclin D1 (Eeckhoute et al.,
2006), cyclin-dependent kinase inhibitor 1A (Ouellet et al., 2006), cytochrome P450 17�-
hydroxylase (Wickenheisser et al., 2004), and liver X receptor (Steffensen et al., 2001). The
mechanism of transcriptional repression by NF1-C may involve recruitment of specific co-
repressors which do not interact with other NF1 isoforms. Another possibility is a direct
competition with more potent transactivators for binding at the same or adjacent sites. Thus, for
example, several TFs that can bind to almost the same sequences as the NF1 consensus sequence
have been described (Dorn et al., 1987; Lee et al., 1998; Krohn et al., 1999; Devireddy et al.,
2000). Alternatively, NF1-C transcriptional repression activity could involve an as yet poorly
characterized repression domain within the protein. Such repression-mediating domains were
identified in both NF1-A (Osada et al., 1997) and NF1-X proteins (Nebl & Cato, 1995). As far as
the NF1-X isoform is concerned, in addition to the repression domain the activation domain was
identified and its ability to stimulate transcription from the proximal promoter position has been
investigated in detail (Apt et al., 1994).
Exploring the precise molecular mechanism underlying the activation/repression of the hPPK
gene expression by NF1 transcription factors will be complicated by functional diversity of NF1
proteins (Gronostajski, 2000). First of all, it is essential for the DNA-binding activity of NF1-
proteins to dimerize to homo- or heterodimers. Heterodimers between two different NF1
isoforms may have different characteristics depending on the respective types of the dimer-
forming NF1 proteins. Additional complexity is added by alternative splicing which generates
many variants of the repression/activation domain of each of the four NF1 proteins. Lastly, NF1
isoforms are known to cooperate with various transcription factors. Thus, compositions of the
NF1 dimers and the interacting proteins contribute greatly to the functional diversity of NF1
proteins.
Taken together, important regulatory sequences within the main promoter of the hPPK gene
have been extensively characterized and significant evidence regarding a regulatory function
exerted by NF1 proteins has been presented. Further exploration of the mechanisms of
transcriptional regulation of the hPPK gene expression should concentrate, in particular, on the
identification of additional TFs controlling hPPK gene expression through specific binding to the
cis-acting elements localized in the Prox promoter by scanning mutation analysis. Understanding

E Proximal promoter and NF1 transcription factor 98
of the interplay between the specific TFs would contribute significantly to unraveling cellular
pathways and events in which PPK is implicated, i.e. as yet unknown functional roles of PPK in
various tissues and cells.

F TSS displacing effect mediated by a 13-bp element 99
F Identification of a 13-bp element at the 3'-end of intron 1 of the human PPK gene
that causes recruitment of alternative promoters
F.1 RESULTS
F.1.1 E1i1E2 causes TSS displacement in HepG2 and IHKE1 cells
Transient transfection experiments demonstrated that the E1i1E2 fragment, encompassing 10
bp of the 5'-proximal region, exon 1, intron 1, exon 2, and 7 bp of intron 2 of the hPPK gene,
exhibited significant transcriptional activity in both HepG2 and IHKE1 cells (Figure D-4). When
it was examined if the E1i1E2 pSEAP2 plasmid uses TSSs analogous to those detected in human
liver and kidney it was found that only a small number of transcripts was initiated within the
E1i1E2 sequence (Figure F-1). In HepG2 cells, the number of such “ normal” transcripts was 4
out of 13 sequenced PCR-products (30 %); these transcripts were initiated in exon 1 at position
+31 (n=2) and in exon 2 at position +72 (n=2) of the PPK mRNA. In IHKE1 cells TSSs of only
2 out of 12 transcripts (17 %) could be mapped to the E1i1E2 insert at positions -5 and +12. The
majority of all transcripts initiated within the vector sequence (Figure F-1).
The extended transcripts did not consist of uninterrupted vector sequence, but of distinct
segments, i.e. part of the vector sequence was transcribed and spliced like normal pre-mRNA.
Typically, extended transcripts were initiated at different sites in the ampicillin resistance gene
(at positions 3001, 3101, 3107, 3121, 3509) with the “ second exon” (4403-4475) ending in
proximity to the transcription blocker. The longest transcript initiating at position 2242 in the
pUC plasmid replication origin was detected in IHKE1 cells; one transcript initiated in the f1
single-strand DNA origin at position 4040; one TSS was detected 37 nucleotides upstream of the
inserted Ei1iE2 region at position 4661. The common 3'-terminal exon contained the 3'-terminal
15 bp of the E1i1E2 fragment and extended uninterrupted into the SEAP reporter gene.
The effect of “ TSS displacement” seems to be specific for the E1i1E2 promoter region, since
it was not observed when Prox and Dist3 pSEAP2 constructs were transiently transfected into
HepG2 and IHKE1 cells. In these experiments the TSSs corresponded to those found in human
liver and kidney (D.1.3).

F TSS displacing effect mediated by a 13-bp element 100
Figure F-1. Transcripts detected in HepG2 and IHKE1 cells after transfection with the E1i1E2 pSEAP2 construct. The E1i1E2 pSEAP2 construct (5430 bp) is shown as a linearized vector map between nucleotides 2000 and 2001. The numeration of the manufacturer for the pSEAP2 backbone (1-4677) is retained. +1 indicates position 1 of the pSEAP2 vector. The E1i1E2 region is inserted between nucleotides 20 and 21 of the pSEAP2 backbone. The numbering of the E1i1E2 insert (7923578-7924330) refers to the contig NT_022792.12, the first two digits 79 are omitted in the figure. Shaded regions correspond to the exons 1 (7923588-7923657) and 2 (7924265-7924323), with intron 1 in-between. Arrowheads indicate the position of the primer used for RLM-RACE. Detected transcripts are shown under the vector map. Transcribed segments of the vector backbone and the E1i1E2 insert are represented by white and grey boxes, respectively; not transcribed segments by the connecting lines. Several transcripts (3 out of 13 for HepG2 and 1 out of 12 for IHKE1 cells) with TSSs in the vector backbone are not shown due to incomplete sequence data. SEAP, secreted alkaline phosphate gene; Amp, ampicillin resistance gene; f1 ori, f1 single-strand DNA origin; pUC, pUC plasmid replication origin; TB, transcription blocker.
F.1.2 The proximal upstream region of the PPK gene does not prevent the TSS
displacing effect
In human liver and kidney the vast majority of the TSSs was found at or near position +1 or
within intron 1 and only very few in distal regions (D.1.2). This suggested that elements of the
sequence upstream of the PPK gene could prevent the TSS displacing effect. Therefore, the
fragment Joint (C.2.1.2) containing the E1i1E2 region and adjacent 658 bp of the upstream
sequence was analyzed (Figure F-2A). The reporter gene assay in HepG2 and IHKE1 cells

F TSS displacing effect mediated by a 13-bp element 101
revealed an approximately 2.5- and 1.5-fold reduction in transcriptional activity of Joint as
compared to E1i1E2 (Figure F-2B).
0
25
50
75
100
125HepG2 IHKE1
E1i1E2 Joint E1i1E2 Joint
%
Figure F-2. Activity of the Joint fragment. A. Schematic representation of the Prox, E1i1E2 and Joint fragments. The length and position of each fragment are indicated by double arrows, the number of basepairs is given in parentheses. The annotated +1 position and start codon of the hPPK gene are indicated. B. Activity of the E1i1E2 and Joint pSEAP2 constructs in HepG2 and IHKE1 cells. The relative promoter activity of the Joint construct is expressed as percentage of the E1i1E2 activity. The data are presented as the means ± standard deviation of at least three independent experiments made in triplicates.
TSS determination with RNA from HepG2 and IHKE1 cells transfected with the Joint
pSEAP2 construct showed that 6 out of 7 sequences for each cell line represented extended
transcripts (Figure F-3). The exon-intron patterns were the same as in the case of the E1i1E2
construct (cf. Figure F-1). In HepG2 cells, three transcripts were initiated within the ampicillin
resistance gene at positions 3107, 3116 and 3121, further three transcripts started within the f1
origin at positions 4018, 4019 and 4021. In IHKE1 cells one TSS was detected within the pUC
origin (2289), four within the ampicillin resistance gene (3032, 3107, 3121, 3330), and one
within the f1 origin (4040). In both cell lines one transcript each started within the Joint region at
position +12 of exon 1. Thus, joining the additional 658 bp of the upstream sequence to E1i1E2
did not prevent the TSS displacing effect of the Ei1iE2 region in both HepG2 and IHKE1 cells.
F.1.3 The TSS displacement effect is also observed in stably transfected cells
To examine if TSS displacement is also observed in a more natural chromatin configuration
than when analyzed by transient transfection, stable transfection experiments were performed.
The SEAP gene under control of E1i1E2 or Joint was integrated into the genome of HEK-293
cells using the pcDNA5/FRT vector and Flp-In system (C.2.2.4). For comparison, HEK-293
cells were also transiently transfected with the respective PPK gene segments in pSEAP2-Basic
vector.

F TSS displacing effect mediated by a 13-bp element 102
� !���! ��
�! ��
� !��
��
��� ��� ���
� !��
��
!���
!���
!��
�!
!�� /$�0�
�� � ! ���������������������� � !!�
�1 �������
!� ���!�
�2����
3���� ��
�4�� ��
� !���! ��
�! ��
� !��
��!���
�!!!!�
� !��
��
� �
� !��!���
!��
� !��
��
!���!�!�
!��
�!
� !��
��
!���
!��
�!����
� ��
5/%��
Figure F-3. Transcripts detected in HepG2 and IHKE1 cells after transfection with the Joint pSEAP2 construct. The Joint construct (6088 bp) is shown as a linearized vector map. The numeration of the manufacturer for the pSEAP2 backbone (1-4677) is retained. The numbering of the Joint insert (7922920-7924330) refers to the contig NT_022792.12, the first two digits 79 are omitted in the figure. Shaded regions correspond to the exons 1 and 2 with intron 1 in-between. Detected transcripts are shown under the vector map. Transcribed segments of the vector backbone and the Joint insert are represented by white and grey boxes, respectively; not transcribed segments by the connecting lines. For a detailed description of the figure refer to the legend to Figure F-1.
Exon-intron patterns of the transcripts detected by RLM-RACE are shown in Figure F-4.
With the E1i1E2 region all transcripts detected in transiently and stably transfected HEK-293
cells (four for each transfection) were initiated within the vector backbone (Table F-1, Figure
F-4A). In transiently transfected cells one TSS was mapped to the pUC ori (2258) and three to
the ampicillin resistance gene (3121, 3147, 3183) of the pSEAP2 backbone; in stably transfected
cells three transcripts were initiated within the ampicillin resistance gene of the pcDNA5/FRT
vector (4203, 4574, 4641) and one 162 bp upstream of the inserted E1i1E2 fragment. The results
indicate that the TSS displacement efficiency of the E1i1E2 construct was independent of the
mode of transfection.
However, when the Joint pSEAP2 construct was transiently transfected into HEK-293 cells,
TSSs of 6 out of 11 sequenced transcripts were localized within the Joint insert (Table F-1,
Figure F-4B). Five transcripts were initiated in exon 1 resulting in exon 1 lengths of 70, 65
(n=2), 60, and 43 bp; one transcript was initiated in exon 2 at position +117 relative to the known
mRNA and continued uninterrupted into the SEAP reporter gene. Five transcripts were extended,
they initiated within the ampicillin resistance gene at positions 3101 (n=2), 3107, 3144, and

F TSS displacing effect mediated by a 13-bp element 103
3221. Thus, with the Joint pSEAP2 construct the TSS displacement was blocked to a significant
extent even in transiently transfected HEK-293 cells, obviously due to the additional 658 bp of
upstream region.
Table F-1. Transcription start sites utilized by E1i1E2 and Joint constructs stably and transiently transfected into HEK-293 cells.
HEK-293 cells Stable transfection Transient transfection
0 % in PPK insert (0/4)¤ 0 % in PPK insert (0/4) E1i1E2
100 % in vector* (4/4) 100 % in vector (4/4)
80 % in PPK insert (8/10) 55 % in PPK insert (6/11) Joint
20 % in vector (2/10) 45 % in vector (5/11) ¤ number of positive transcripts out of total analyzed sequences. * pcDNA5/FRT for stably transfected cells, pSEAP2-Basic for transiently transfected cells.
In stably transfected HEK-293 cells the displacement blocking effect was even more
pronounced: only 2 out of 10 transcripts were initiated within the pcDNA5/FRT vector
backbone. The TSSs of both extended transcripts were mapped to the pUC plasmid origin of
replication to positions 3377 and 3424. These initiation sites correspond exactly to positions
2242 and 2289 detected in the pUC ori of the pSEAP2 backbone (cf. Figure F-1, F-3). As far as
“ normal” transcripts are concerned, one transcript had a single exon starting at position 600
relative to the first 5' nucleotide of the intron. Seven TSSs were detected close to the known +1
position resulting in lengths of exon 1 of 108, 67, 65 (n=2), 60, 49 and 43 bp. Six out of the
seven transcripts had the common second exon containing the 3'-terminal 15 bp of the Joint
fragment followed by the sequence of the SEAP reporter gene; one transcript contained the fully
transcribed exon 2.
The data obtained in HEK-293 cells made evident that in this cell line the 658-bp proximal
region joined to the E1i1E2 fragment suppresses the TSS displacement to an appreciable degree,
independent of the mode of transfection. The displacement blocking effect mediated by the 658-
bp proximal region seems to be cell-type dependent, since it was not apparent in HepG2 and
IHKE1 cells. The fact that also in HEK-293 cells the blocking effect was not complete lead to
the assumption that additional upstream sequence elements are necessary for preventing the TSS
displacement more efficiently. In HepG2 and IHKE1 cells different sequence elements upstream
of the PPK gene might be necessary to bring the TSSs to the normal position.

Figure F-4. Transcripts detected in HEK-293 cells transiently or stably transfected with the E1i1E2 (A) and Joint (B) constructs. The constructs are shown as linearized vector maps. The E1i1E2 (7923578-7924330) and Joint (7922920-7924330) fragments were cloned either alone into pSEAP2-Basic vector (1-4677) for transient transfection or, for stable transfection, followed by the SEAP gene into pcDNA5/FRT vector (1-5070). For the vectors the numeration of the manufacturers is retained, the numbering of the inserts refers to the contig NT_022792.12, the first two digits 79 are omitted in the figure. +1 indicates the first nucleotide of the respective vector. The E1i1E2 and Joint fragments are inserted between nucleotides 20-21 of the pSEAP2 backbone or 233-978 of the pcDNA5/FRT backbone. Shaded regions of the inserts correspond to the exons 1 and 2 with intron 1 in-between. Detected transcripts are shown under the vector maps. Transcribed segments of the vector backbones and the inserts are represented by white and grey boxes, respectively; not transcribed segments by the connecting lines. For a detailed description of the figure refer to the legend to Figure F-1.
F T
SS displacing effect mediated by a 13-bp elem
ent 104

F TSS displacing effect mediated by a 13-bp element 105
F.1.4 Deletion-mutation analysis defined a minimal sequence with transcriptional and
TSS displacing activity
To delimit the sequence responsible for the TSS displacing effect, deletion mutants of the
E1i1E2 region were investigated (Figure F-5). The importance of exons 1 and 2 in mediating the
TSS displacement was evaluated by analyzing the deletion mutant Int1 representing exclusively
intron 1. In reporter gene assays Int1 had approximately 1.3 and 1.6 times higher transcriptional
activity than E1i1E2 in HepG2 and IHKE1 cells, respectively (Figure F-6). This slight increase
in activity may be due to the exclusion of the hPPK translation start site, which might interfere
with the translation of the reporter gene SEAP (Carey and Smale, 2000a).
The TSS analysis of HepG2 and IHKE1 cells transfected with Int1 plasmid revealed that not
only promoter activity but also the TSS displacing effect is connected to intron 1. For HepG2
cells, all six sequenced transcripts were initiated in the vector, five within the ampicillin
resistance gene at positions 3101 (n=2) and 3107 (n=3), one in the pUC origin at position 2242
(Figure F-7A). The latter transcript is not shown in Figure F-7 due to incomplete sequence data.
For IHKE1 cells, eight out of nine TSSs were mapped to the vector sequence, namely, seven in
the ampicillin resistance gene (3101 (n=2), 3107 (n=2), 3110, 3158, 3252) and one at the end of
the f1 origin (4390). One transcript was initiated within intron 1 at position 457 relative to the
first 5' nucleotide of the intron. Taken together, reporter gene assays and TSS determination
indicated that exon 1 and 2 of the hPPK gene are not relevant both for transcriptional activity and
for TSS displacement.
Figure F-5. Schematic representation of the E1i1E2 fragment and its deletion variants. The top line shows a part of the hPPK gene. The anno-tated +1 position and start codon are indicated. Frag-ment E1i1E2 includes 10 bp of the 5'-upstream region, exon 1, intron 1, exon 2 and 7 bp of intron 2. The length and position of each deletion mu-tant are indicated by double arrows, the number of base-pairs is given in the right column.

F TSS displacing effect mediated by a 13-bp element 106
E1i1E2
Int1
Int1
_D2
Int1
_D3
Int1
_D4
Int1
_D5
Int1
_D6
Int1
_D7
Int1
_D8
Int1
_D9
Int1
_D10
Int1
_D11
Int1
_D12
Int1
_D13
Int1
_D(1
-13)
0255075
100125150175200225
%
E1i1E2
Int1
Int1_D
3
Int1_D
6
Int1_D
9
Int1_D
13
Int1_D(1-
13)
0
20
40
60
80
100
120
140
%
Figure F-6. Transcriptional activity of the Int1 and E1i1E2 regions and Int1 deletion mutants in HepG2 (A) and IHKE1 (B) cells. The indicated fragments cloned into pSEAP2-Basic plasmid were transiently transfected into the cells. The relative promoter activity of each construct is expressed as percentage of the Int1 activity. The data are presented as the means ± standard deviation of at least three independent experiments made in triplicates.
To further delineate the sequence responsible for the TSS displacing effect and presuming that
the same elements are responsible for both the transcriptional activity and the TSS displacement,
the promoter activity of a series of 5'-deletion mutants of intron 1 was analyzed in HepG2 cells
(Figure F-5, F-6A). Deletion of the first 159 nucleotides (Int1_D2) did not affect the activity
level as compared to Int1; deletion of further 139 nucleotides (Int1_D3) resulted in an activity
decrease to 70 % (Figure F-6A). Two subsequent deletions of about 70 nucleotides each
(Int1_D4, Int1_D5) led to an increase in activity to 125 %. Elimination of further 132 bp in steps
of 31-35 bp (Int1_D6 to Int1_D9) resulted in transcriptional activities between 129 and 191 %
relative to Int1. Surprisingly, the level of transcriptional activity remained at high levels with the
next four deletion variants, Int1_D10 – Int1_D13, generated by eliminating 24 bp in 6-bp steps.
Despite some variation, all four constructs displayed activities above 140 %. The last deletion
variant, Int1_D13, being only 13 bp in length, had approximately 145 % of the activity of Int1
which is 607 bp in length. Thus, exclusively the 13-bp element at the 3'-end of intron 1 is
responsible for the transcription activity of the whole Int1 region. To confirm this finding, the
deletion variant Int1_D(1-13) was analyzed which contains the intron 1 sequence except for the
3'-terminal 13 bp. In a transient transfection experiment in HepG2 cells this deletion mutant
showed virtually no transcriptional activity (Figure F-6A).

F TSS displacing effect mediated by a 13-bp element 107
Figure F-7. Transcripts detected in HepG2 and IHKE1 cells transiently transfected with the Int1 (A) and Int1_D13 (B) pSEAP2 constructs. The Int1 (5284 bp) and Int1_D13 (4690 bp) constructs are shown as linearized vector maps. For the pSEAP2 backbone (1-4677) the numeration of the manufacturer is retained. The numbering of the Int1 (7923658-7924264) and Int1_D13 (7924252-7924264) inserts refers to the contig NT_022792.12; the first two numerals 79 are omitted in the figure. Int1_D13 being 13 bp in length is not drawn to scale. Detected transcripts are shown under the vector map. Transcribed segments of the vector backbone and the inserted regions are represented by white and grey boxes, respectively; not transcribed segments by the connecting lines. For a detailed description of the figure refer to the legend to Figure F-1.
It was then examined if the same 13-bp sequence confers transcriptional activity to the Int1
fragment in IHKE1 cells as well. The cells were transfected with a selection of the Int1 deletion
variants (Figures F-5, F-6B). Reporter gene assays revealed that in IHKE1 cells the same 13-bp
element is responsible for the detected transcription activity: Int1_D13 deletion variant was still
active whereas Int1_D(1-13) was not (Figure F-6B). In contrast to HepG2 cells, the level of the
transcription activity remained unchanged for Int1_D6, _D9, and _D13 constructs as compared
to that of Int1.

F TSS displacing effect mediated by a 13-bp element 108
Finally, it was verified that the 13-bp element is not only responsible for transcriptional
activity, but also provokes the TSS displacing effect. HepG2 and IHKE1 cells were transiently
transfected with the Int1_D13 plasmid and subjected to RLM-RACE analysis. All detected
transcripts (5 for HepG2 cells and 4 for IHKE1 cells) were initiated at different sites within the
vector sequence (Figure F-7B). Namely, in HepG2 cells one transcript was initiated upstream of
and the other one within the pUC origin of plasmid replication (2016 and 2209, respectively),
two within the ampicillin resistance gene (3101, 3110), and one in the region of the f1 origin. In
IHKE1 cells all detected TSSs were mapped to the pUC origin (2240 (n=2), 2243, 2258). Thus,
the results demonstrated that the 13-bp segment is sufficient to evoke TSS displacement by
forcing recruitment of an alternative promoter.
F.1.5 Identification of critical basepairs of the 13-bp segment
To define the critical nucleotides within the sequence of the 13-bp element, specific
substitution mutations were introduced into the Int1_D13 fragment (C.2.1.2). Transient
transfection experiments with the mutants in HepG2 cells demonstrated that all four mutants
exhibited strongly reduced transcription activity (Figure F-8). The central mutations 2 and 3
reduced activity to the background level; the two flanking mutants 1 and 4 displayed a residual
activity of about 25 % and 15 %, respectively. These findings demonstrate that the important
nucleotides span the whole 13-bp element sequence, however, the most critical are the six central
basepairs.
Int1
_D13
mut1
mut2
mut3
mut4
0102030405060708090
100110
%
Figure F-8. Site-directed mutagenesis of the 13-bp element. The upper panel shows the DNA sequence of the 13-bp element. The underlined nucleotides were substituted in the indicated mutants using aBc, gBt exchanges. The lower panel shows the effect of the introduced mutations on transcription activity in HepG2 cells. The relative promoter activity of each mutant is expressed as per-centage of activity of the wild-type Int1_D13 plasmid. The data are presented as the means ± standard devi-ation of at least three independent experiments made in triplicates.

F TSS displacing effect mediated by a 13-bp element 109
F.2 DISCUSSION
During investigations by reporter gene assays of the transcriptional activity of the E1i1E2
fragment and its deletion mutants, a 13-bp segment TTTTCTTTTTTAG, representing the 3'-end
of intron 1 of the hPPK gene, was identified as a new potential regulatory element. Namely, the
13-bp fragment displays transcriptional activity as high as whole E1i1E2 (753 bp) and causes
upstream displacement of the TSSs, presumably by aiding the recruitment of alternative
promoters.
This TSS displacement activity was detected when it was examined in reporter gene studies
with E1i1E2 pSEAP2 constructs if for the transcription of the reporter gene the same initiation
sites were recruited as utilized in vivo for transcription of the hPPK gene. Generally, it is taken
for granted that the same TSSs are utilized for transcription of the reporter gene and of the
targeted gene and the initiation sites of the reporter gene transcripts are not verified
experimentally. Therefore, a TSS displacing effect as reported here would no be recognized.
One explanation of the observed TSS displacing effect would be that E1i1E2 and its deletion
variants are only weak promoters and that all observed extended transcripts result from
background transcription. If this were the case, then Prox and Dist3, which promote similar
transcriptional activity as E1i1E2 (Figure D-4B), should also show the TSS displacing effect.
However, in the reporter gene studies with the Prox and Dist3 pSEAP2 constructs only TSSs
within the inserted fragments could be identified (D.1.3) demonstrating that the transcription
blocker of the pSEAP2-Basic vector (cf. C.1.4.1) prevents background transcription efficiently.
An alternative interpretation of the high transcriptional and TSS displacement activity is the
recruitment by the 13-bp element of an alternative promoter within the vector sequence.
Alternative promoters provide distinctly different sets of cis-acting elements and, therefore, the
specific recruitment of a particular one of alternative promoters is dependent on the distinct
combinations of transcription factors prevalent in different tissues or at different developmental
and metabolic stages. However, in addition to this passive process of promoter selection there
may exist also mechanisms which actively aid the usage of alternative promoters, like special
cis-acting elements. The study presented here indicates that the 13-bp sequence may represent
such a regulatory element.
Evidence that the TSS displacement activity is also functional in vivo was gained from
experiments where E1i1E2 was chromosomally integrated in HEK-293 cells by stable
transfection. The experiments verified that the displacing effect of the E1i1E2 fragment is also
operative in a more natural chromatin configuration than when analyzed by transient
transfection. It is also of interest to note that in vivo in addition to the transcription start at or near

F TSS displacing effect mediated by a 13-bp element 110
the +1 position of the known PPK mRNA alternative TSSs up to 23 kbp upstream are utilized
(D.1.2). It is tempting to speculate that the 13-bp element and possibly additional regulatory
sequences contribute to the recruitment of these upstream TSSs/promoters of the hPPK gene
under distinct spatial and temporal conditions.
A BLAST search of the reference genomic sequence NCBI database detected 3401 sequence
segments in the human genome fully identical with the sequence of the 13-bp segment. One may
hypothesize that at least some of them will be involved in the recruitment of alternative upstream
promoter regions of certain genes resulting in transcription initiation at alternative sites.
Estimates for the total number of genes of mammalian and simpler organisms showed that the
number of protein-coding genes has not increased among eukaryotes in proportion to the
complexity of the organisms (Landry et al., 2003). Therefore, it is generally accepted that in
addition to higher gene numbers other mechanisms contribute to the phenotypic complexity of
higher eukaryotes. In particular, alternative promoter usage which increases substantially the
transcriptional and translational potential of a genome is now being recognized as one of such
mechanisms. This phenomenon is attributed to that a particular combination of transcription
factors, prevalent in different tissues or at different developmental and metabolic stages, can
result in the preferential recruitment of a distinct promoter. The results of this study suggest in
addition the existence of cis-acting elements which by themselves aid recruiting alternative
promoters, possibly by blocking the usage of a certain promoter.

G OUTLOOK 111
G OUTLOOK
This study represents the first characterization of mechanisms that regulate transcription of
the hPPK gene. Utilization of multiple TSSs and alternative promoter regions has been
demonstrated, important regulatory sequences within the main promoter of the hPPK gene have
been extensively characterized, and significant evidence regarding a regulatory function exerted
by NF1 proteins has been presented.
Some issues remain to be clarified. In particular, the regulatory region driving transcription of
the hPPK gene from distal transcription initiation sites clustered in exon hE1a remains to be
identified. The identified promoter regions (Prox, E1i1E2, Dist3) and regions with putative
promoter activity (Dist1, Dist2) for which no activity could be detected should be tested for
functionality in other cell lines, especially such representing model systems of testis and
pancreas.
Future investigations will have to contribute to a detailed understanding of the regulatory
mechanisms of hPPK gene transcription and translation. Thus, for example, recent evidence
suggests that there is a connection between alternative promoter usage and splicing events
(Kornblihtt, 2005). Therefore, it will be intriguing to explore the correlation of the usage of the
distal TSSs of the hPPK gene with downstream splice events as well as with the level of PPK
mRNA expression and protein sythesis in various tissues and cells.
The scanning mutant analysis, which unraveled important cis-acting elements in the Prox
promoter, provides the basis for the identification of additional TFs controlling hPPK gene
expression. Understanding the interplay of the specific TFs will contribute significantly to
discovering cellular pathways and events in which PPK is implicated, i.e. the as yet unknown
functional roles of PPK synthesized in various tissues and cells.
The results of this study strongly support the concept that plasma prekallikrein/plasma
kallikrein, in addition to the well-known functions in the blood, plays multiple roles in diverse
cells and tissues. It will be intriguing to elucidate what these roles are. Functional studies in cell
and animal models such as on the effect of knocking down PPK synthesis may be next steps in
order to achieve this aim.

H APPENDIX 112
H APPENDIX
H.1 The importance of examining the plasmid DNA quality in promoter studies
During the studies on the transcriptional regulation of the hPPK gene by means of reporter
gene assays a problem of poor reproducibility in the results emerged which could finally be
attributed to differences in the quality of plasmid DNA. This influence of the plasmid quality on
the activity measured in transient transfection experiments could be excluded by selection of
plasmids of appropriate quality based on visualization of intact plasmids by agarose gel
electrophoresis.
The deletion analysis of the Prox (−668/+22) promoter revealed that a deletion variant D3
(−152/+22) alone retains more than 50 % of the Prox promoter activity; deletion of further 50
nucleotides led to a 4-fold reduction of the promoter activity (Neth, 2002; Neth et al., 2005).
Therefore, region −152 to −103 was subjected to in silico analysis (Quandt et al., 2006; Lenhard
et al., 2003), and possible binding sites for factors of the Nkx-homeodomain family (NKXH) and
activator protein 4 (AP4) were mapped to −129/−117 and −119/−114 segments, respectively
(Figure H-1A). To check if these TFs contribute to the promoter activity, the specific binding
sites (Figure H-1A, cf. mutations 02, 03, 04) as well as adjacent 5�- and 3�-sequences (cf.
mutations 01, 05) were mutated using a megaprimer method (C.2.1.4). After cloning the mutated
inserts into pSEAP2-Basic the plasmids were propagated in an E. coli strain B834 (Novagen).
Activities of the D3 and its mutated forms were subsequently monitored by transient transfection
of HepG2 cells (C.2.2.3) followed by a luminescent SEAP assay (C.2.3).
As shown in Figure H-1B mutations 02 and 04 reduced promoter activity to about 10 % and
25 %, respectively, as compared to the non-mutated D3, and mutation 05 to about 50 %. The
D3_IM01 and D3_IM03 plasmids exhibited promoter activities of about 80 %. Surprisingly,
when the experiment was repeated, but with the wildtype D3 pSEAP2 plasmid propagated from
a different E. coli colony of the same ligation (D3_II), the results differed from the first
experiment. Namely, the activity of the five mutants relative to the wild-type D3_II increased
dramatically whereas the ratios between the activities of the mutants remained unchanged. When
the two wild-type plasmids D3 and D3_II were used in parallel in a transient transfection
experiment, the activity of D3_II had only 26 % of the activity of D3 (Figure H-1B). Agarose gel
electrophoresis with both plasmids undigested revealed for the D3_II plasmid only a very faint
lower band (Figure H-1C). By running gels with and without ethidium bromide and, in parallel,
including the sample of the same DNA linearized by single cleavage the lower band was
identified as the supercoiled form of the plasmid DNA. The upper bands probably represented
the single strand nicked and/or multimeric concatenated forms of DNA plasmid. It is known that

H APPENDIX 113
nicked and linearized plasmid DNAs are poorly transcribed in mammalian tissue culture cells
compared with circular forms of the same templates (Weintraub et al., 1986; Sive et al., 1986).
Therefore, the observed difference in the activities of D3 and D3_II pSEAP2 plasmids could be
explained by the different fraction of supercoiled DNA in the respective plasmid preparations.
D3_II D3
D3_IM
01
D3_IM
02
D3_IM
03
D3_IM
04
D3_IM
05
D3_IM
02_II
D3_IM
04_II
0102030405060708090
100110
%
Figure H-1. A. –135/–106 region of the PPK gene (numbers are relative to the annotated +1 position). Consecutive segments of 6-bp each were mutated within the D3 region by aBc, gBt exchange. The designations above the fragments refer to the respective mutation numbers. The binding site for the NKXH family and the core sequence for AP4 transcription factor are indicated by brackets. B. Transient transfection assay. The activity is given in percentage of the construct D3. The bars indicate the mean ± standard deviation of three independent experiments performed in triplicates. C. 1 % agarose gel with 1 �g each of the intact plasmids as indicated.
Agarose gel electrophoresis of the undigested D3_IM01 – D3_IM05 pSEAP2 plasmids
revealed absent or faint lower bands in the case of D3_IM02 and D3_IM04, respectively (Figure
H-1C). This suggested that the observed differences in transcriptional activity of these two
mutants compared to wild-type D3 were not due to the introduction of the mutations but to the
quality of the respective plasmid DNA, i.e. the partly or completely missing of supercoiled
DNA. Therefore, the D3_IM02 and D3_IM04 plasmids were again transformed into E. coli host
strain B834 resulting in new clones for the same plasmids: D3_IM02_II and D3_IM04_II,
respectively. Gel electrophoresis of the new undigested plasmids revealed that both contained the
lower bands of the supercoiled plasmid form in intensities comparable with those of D3,
D3_IM01, _03, and _05 (Figure H-1C). In the reporter gene assay the D3_IM02_II plasmid had
about 90 % and the D3_IM04_II plasmid about 50 % activity as compared to the D3 plasmid
(Figure H-1B).

H APPENDIX 114
The content of the supercoiled DNA form in plasmid DNA preparations can be influenced by
the vector type, host strain, growth-conditions, cell lysis and purification methods. To start with,
the influence of the host strain on the quality of a plasmid DNA and thus on the activity
measured in a reporter gene assay was evaluated. Alternative promoters of the hPPK gene
(D.1.3) were cloned into the pSEAP2-Basic vector and propagated in the two E. coli strains
B834 (Novagen) and TOP10 (Invitrogen). Visualization of intact plasmids after agarose gel
electrophoresis revealed that strain TOP10 plasmids (ProxTOP, E1i1E2TOP, Dist3TOP) had a high
content of the supercoiled form (Figure H-2A). Furthermore, the quality of the plasmid obtained
with this host strain was more consistent as all three samples resulted in the same band pattern.
Strain B834 plasmids (ProxB834, E1i1E2B834, Dist3B834) had a lower and, in addition, variable
content of supercoiled plasmid DNA. The plasmid preparations from the different strains showed
different transcriptional activities upon transfection into HepG2 cells (Figure H-2B). Strain
TOP10 plasmids had significantly higher activities than the respective strain B834 plasmids, and
these differences correlated with the variance in intensity of the respective lower bands on the
gel.
TO
PP
rox
B83
4P
rox
T
OP
E1i
1E2
B83
4E
1i1E
2
TO
PD
ist3
B
834
Dis
t3
0
20
40
60
80
100
120
%
Figure H-2. A. 1 % agarose gel with 1 �g each of the intact plasmid DNA as indicated. Prox, E1i1E2, Dist3 alternative promoters of the PPK gene cloned into pSEAP2-Basic vector were propagated in two different E. coli strains: B834 and TOP10. B. Transient transfection assay. The activities of plasmids prepared using host strain TOP10 were set to 100 %. The bars indicate the mean ± standard deviation of three independent experiments made in triplicates.
It is known that some host strains such as DH1, C600, etc. yield high quality of the purified
DNA (Ausubel et al., 2003). Differently, strain HB101 and its derivatives contain large amounts
of carbohydrate which can inhibit enzyme activities if not completely removed from the plasmid
preparation. In addition, some strains contain the wild type endA gene. The product of this gene,
endonuclease A, could potentially nick, linearize, and, eventually, completely degrade
supercoiled plasmids thus yielding DNA of lower quality. The E. coli strain B834 that had for

H APPENDIX 115
some time been used routinely in our laboratory turned out to be an endA� strain. Therefore it
could account for the above described effects.
DNA plasmid quality is determined by a number of factors, each being able to dramatically
affect downstream applications. In the case of promoter studies it is known that plasmid quality
as reflected in DNA topology influences the transcription efficiency (Weintraub et al., 1986;
Sive et al., 1986). However, a random PubMed survey of approximately 80 articles on promoter
analysis published from 1995 to 2006 indicated that only two articles referred to the supercoiled
form of plasmid DNA, whereas the majority used verification of the inserted sequence as the
only control concerning DNA plasmids used for transcriptional activity measurements. The
results described above indicate that it is recommendable to examine the quality of each new
plasmid preparation in respect to the content of supercoiled plasmid. In a case when the
supercoiled fraction of DNA plasmid is not high enough and/or not reproducible it is worthwhile
to screen several E. coli strains.
H.2 Inadequacy of a protein/DNA array analysis for identification of transcription
factors binding to a promoter region of interest
Once the region proximal to the hPPK gene was defined as the main promoter utilized in
hepatocytes (D.1.3), the question arose what were the sophisticated molecular mechanisms
underlying the regulation of the transcription initiation by the Prox promoter. As a starting point,
cis-acting elements of the Prox promoter contributing to its full activity in hepatocytes and
transcription factors binding to these elements had to be identified. A substitution mutation
analysis is routinely performed to unravel the position of critical nucleotides, and subsequent
identification of the TFs bound by these nucleotides requires an additional set of experiments. In
this context, the DNA pull-down method followed by the TranSignal Protein/DNA array (Zeng
et al., 2003), that rapidly yields a global view of identity and abundance of TFs bound to the
promoter region of interest, represented an attractive alternative to the former approach.
The DNA pull-down method was performed using magnetic beads loaded with a DNA
fragment representing the Prox promoter and nuclear extract from HepG2 cells (details in C.2.8).
The protein fraction thus enriched with the proteins binding to the Prox DNA was used as a
starting material for the TranSignal Protein/DNA array (C.2.9). Three versions of the TranSignal
Protein/DNA Array spotted with 244 different DNA consensus sequences had been offered by
the manufacturer at that time. The pull-down experiment was done three times, and for each type
of array (I, II, and III) the membrane hybridization was performed three times, each time with a
separately pulled-down nuclear extract. The results of the three experiments are summarized in
Table H-1. In addition, there were slight signals corresponding to some other TFs not given in

H APPENDIX 116
Table H-1. Since these signals were low and/or detected only on one membrane of the triplicate,
they were considered as nonspecific hybridization. The hybridization membranes are shown in
Figure H-3.
Table H-1. Identities of the pulled-down proteins from the Prox promoter.
Array I Array II Array III TFs Exp.1 Exp.2 Exp.3 TFs Exp.1 Exp.2 Exp.3 TFs Exp.1 Exp.2 Exp.3
AP-2(1) + +++ ADR1 (+) + + AFP1 +++ +++ +++ EGR(1) ++ +++ +++ AhR/Arnt (+) + + CREB2 ++ ++
GRE + +++ DR-1 ++ + +++ EBP 40/45 ++ ++ +
NF1 + + FKHR (human) +++ + +++ HMG ++ + ++
NF-E2 + ++ + Afxh (Foxo4) +++ +++ +++ HOXD
8/9/10 + +
p53 (+) ++ GATA1/2 + ++ ++ HOX D9/10 + + +
Pax-5 ++ +++ ++ HBS+ HAS + + + ICSBP + ++ +++
RXR (DR1) ++ ++ +++ MEF-3 ++ + + MTF(1) ++ ++ ++
Smad3/4 + ++ ++ MT-Box + ++ ++ NF-Y + + +++ Stat4 + +++ ORE +++ +++ ++ p53(2) +++ +++ ++ TR + ++ RREB(1) +++ +++ +++ PYR +++ +++ + TR (DR-4) + +++ +++ RSRFC4 +++ +++ +++ RFX
1/2/3(1) + + +
VDR (DR3) + +++ +++ WT1(1) + (+) ++
MRE + ++ (+) WT1(2) + (+) ++
From strongest to the slightest hybridization signal: +++, ++, +, (+). TFs with the most strong and consistent signals are in bold.
A detailed analysis of the hybridization signals showed that the obtained data were difficult to
interpret. Generally, two types of problems were encountered: many detected signals were of
questionable relevance/specificity and alignment of the binding sites of TFs with strong signals
to the Prox promoter sequence was ambiguous. Examples given below illustrate these problems
and some discrepancies inherent to the arrays.
The consensus oligonucleotide for high mobility group proteins HMGI(Y) 5'-
CGATCTGGAACTCCGGGAATTTCCCTGGCCC-3' spotted in the Array III represents a part
of a chemokine MGSA/GRO promoter. It was demonstrated in EMSA experiments that the
HMGI(Y) recognizes exclusively the AT-rich motif (underlined) nested within the NF-�B
element (in bold). Competition experiments with poly(dA-dT) as a specific competitor resulted
in complete elimination of the specific complex (Wood et al., 1995). Taking into account that the
used oligonucleotide was not exclusively specific for the HMGI(Y) protein and the Prox
promoter sequence contains a lot of AT-rich regions, the detected hybridization signal in the
Array III could be hardly considered as specific.

H APPENDIX 117
I
II
III
Figure H-3. Protein/DNA array analysis of TFs bound to the Prox promoter. Proteins bound to the Prox promoter of the hPPK gene were pulled down from nuclear extracts of HepG2 cells, and their identities were determined using TranSignal Protein/DNA Arrays I, II, and III. Hybridization signals (right) and TF identity (left) are given. The membranes shown are array I and II of experiment 3, array III of experiment 2. The genes on the Array I are spotted in duplicates: normal and 1:10 for the alternating rows. Dark spots in the right and bottom margins of the hybridization membrane are intended for alignment.

H APPENDIX 118
An oligonucleotide 5’ -GAATGGGGCACTGAGGCGTGACCACCG-3’ spotted in the Array
I corresponds to the consensus recognition sequence for the B-cell specific transcription factor
BSAP (Pax5) (Czerny et al., 1993). The binding sites for the Pax5 can be divided into two
classes depending on whether its 5' (class I) or 3' (class II) half sites (underlined) fully match the
consensus sequence (the most critical nucleotides are in bold). The overall affinity of a given
BSAP-binding site depends on the strength of both interactions and correlates with its match to
the consensus sequence. Deviation of one half site from its consensus sequence can be
compensated for by a perfect match of the second half site with its consensus motif. Thus, the
degenerate DNA sequence recognition of Pax 5 made it difficult to ultimately delineate the
binding site within sequence of the Prox promoter. Among other TFs whose recognition
sequences could not be aligned to the Prox promoter are �-fetoprotein enhancer binding
protein 1 (AFP1), MRE-binding transcription factor 1 (MTF(1)), nuclear factor Y (NFY) (Table
H-1).
In Array I a moderate signal was detected for DR-1, a hormone response element consisting
of the common consensus half-site sequence AGGTCA in the form of a direct repeat (DR)
separated by one nucleotide (Kliewer et al., 1992). DR-1 could be aligned to the Prox promoter
sequence although with some mismatches (data not shown). However, a perfect DR1 element is
quite promiscuous, since it allows the binding of RXR homodimers, peroxisome proliferators-
activated receptor/RXR, and retinoic acid receptor/RXR heterodimers as well as of orphan
members of the nuclear receptor superfamily like apolipoprotein regulatory protein-1, hepatocyte
nuclear factor 4, and chicken ovalbumin upstream promoter transcription factor (Sladek et al.,
1990; Ladias & Karathanasis, 1991; Kliewer et al., 1992; Nakshatri & Chambon, 1994). Thus,
the nature of a TF binding to the spotted oligonucleotide is ambiguous.
The following examples point out some imperfection inherent to the array. The oligo-
nucleotide 5'-AAGCTCCTTCCTTCCCCTTCCTTCCAGAC-3' spotted in the Array III is
claimed to specifically bind PYR (polypyrimidine complex) initially described as a nuclear
protein of unknown nature that binds to an oligopyrimidine repeat (O'Neill et al., 1991).
However, the ability of the 29-bp oligonucleotide to bind the pyr factor is questionable since in
gel shift assays the specific complex was detected only with a 99-bp oligonucleotide probe; the
factor failed to recognize the shorter 46-bp probe, indicating that pyr factor recognized DNA
with a definite secondary structure (O'Neill et al., 1991). Later PYR was characterized as an
adult erythroid stage–specific chromatin remodeling complex consisting of several subunits with
Ikaros as the single DNA-binding subunit (O'Neill et al., 2000). In Array II a separate
oligonucleotide specific for Ikaros is spotted. Taken together, it is not clear which TF is

H APPENDIX 119
supposed to bind to the consensus oligonucleotide and, accordingly, to which TF the detected
signal corresponds.
Mouse Fkhr and Afxh (Foxo4) transcription factors, the members of the forkhead family,
were shown to recognize the common consensus DNA sequence (G/A)(T/A)(A/T)AACA (Biggs
et al., 2001). Despite this finding, the Fkhr- and Afxh-binding oligonucleotides spotted in the
Array II differ in their sequences: 5’ -CATAAACAAA-3’ and 5’ -CATAAACAAC-3’ . Thus, it is
doubtful if the difference in the signals corresponding to the mouse Fkhr (negative) and Afxh
(positive) TFs indeed results from adenine – cytosine exchange or it reflects discrepancy inherent
to the array.
At last, an oligonucleotide for the TF p53 was spotted twice (Figure H-3, cf. p53 on the Array
I, G-H/11-12, and p53(2) on the Array III, H15-H16). Despite the differences in the designation,
the consensus sequence was claimed to be equal. Comparison of the detected signals on the
Array I and III revealed certain discrepancy. An incubation of the same pulled-down nuclear
extracts with Arrays I and III gave no to moderate signals for the first one and strong signals for
the second one (Table H-1).
Thus, the comprehensive analysis of the results revealed poor specificity and some
discrepancy in data obtained from different arrays. Several additional factors lowering the
overall significance of the derived data should be taken into account. Some relevant TFs could
be missed during incubation of a nuclear extract with DNA coupled to magnetic beads, since the
binding reaction is performed under average conditions where only a subset of TFs has the
binding optimum. Besides, it is known that some TFs relevant for transcription initiation have a
low affinity for the respective recognition sequence, and its binding to DNA in vivo is stabilized
by other proteins. If the corresponding oligonucleotides used in the arrays do not encompass a
recognition site of a co-factor along with a consensus sequence of the nuclear factor of interest,
those TFs are likely to result in weak if any hybridization signals on the membrane, thus leading
to its neglecting. Taken together, the overall low reliability of the derived information made it
impossible to use it for further analyses of the Prox promoter.
Recently several research groups employed the DNA pull-down method coupled with the
DNA/protein array for promoter analysis of different genes (Zeng et al., 2003; Xia et al., 2003,
2005; Li et al., 2004). However, specific binding of the detected TFs to the respective promoters
and their relevance as regulators for these promoters was not further investigated. Apparently,
the authors encountered analogous problems.

I REFERENCES 120
I REFERENCES
Akita K., Okuno M., Enya M., Imai S., Moriwaki H., Kawada N., Suzuki Y., Kojima S. (2002). Impaired liver regeneration in mice by lipopolysaccharide via TNF-alpha/kallikrein-mediated activation of latent TGF-beta. Gastroenterology 123, 352-364.
Apt D., Liu Y., Bernard H.U. (1994). Cloning and functional analysis of spliced isoforms of human nuclear factor I-X: interference with transcriptional activation by NFI/CTF in a cell-type specific manner. Nucleic Acids Res 22, 3825-3833.
Audic Y., Hartley R.S. (2004). Post-transcriptional regulation in cancer. Biol Cell 96, 479-498.
Ausubel F.M., Brent B., Kingston R.E., Moore D.D., Seidman J.G., Smith J.A., Struhl K. (2003). Minipreps of plasmid DNA. In: Current protocols in molecular biology, John Wiley & Sons Inc. New York, 1.6.1-1.6.10.
Ayoubi T.A., Van De Ven W.J. (1996). Regulation of gene expression by alternative promoters. FASEB J 10, 453-460.
Bhoola K.D., Figueroa C.D., Worthy K. (1992). Bioregulation of kinins: kallikreins, kininogens, and kininases. Pharmacol Rev 44, 1-80.
Biggs W.H. 3rd, Cavenee W.K., Arden K.C. (2001). Identification and characterization of members of the FKHR (FOX O) subclass of winged-helix transcription factors in the mouse. Mamm Genome 12, 416-425.
Birnboim H.C., Doly J. (1979). A rapid alkaline extraction procedure for screening recombinant plasmid DNA. Nucleic Acids Res 7, 1513-1523.
Biyashev D., Tan F., Chen Z., Zhang K., Deddish P.A., Erdös E.G., Hecquet C. (2006). Kallikrein activates bradykinin B2 receptors in absence of kininogen. Am J Physiol Heart Circ Physiol 290, H1244-H1250.
Carey M.F., Smale S.T. (2000a). Functional assays for promoter analysis. In: Transcriptional regulation in eukaryotes: concepts, strategies, and techniques, Cold Spring Harbor New York, 137-191.
Carey M.F., Smale S.T. (2000b). Identifying cis-acting DNA elements within a control region. In: Transcriptional regulation in eukaryotes: concepts, strategies, and techniques, Cold Spring Harbor New York, 213-248.
Carninci P., Sandelin A., Lenhard B., Katayama S., Shimokawa K., Ponjavic J., Semple C.A., Taylor M.S., Engstrom P.G., Frith M.C., Forrest A.R., Alkema W.B., Tan S.L., Plessy C., Kodzius R., Ravasi T., Kasukawa T., Fukuda S., Kanamori-Katayama M., Kitazume Y., Kawaji H., Kai C., Nakamura M., Konno H., Nakano K., Mottagui-Tabar S., Arner P., Chesi A., Gustincich S., Persichetti F., Suzuki H., Grimmond S.M., Wells C.A., Orlando V., Wahlestedt C., Liu E.T., Harbers M., Kawai J., Bajic V.B., Hume D.A., Hayashizaki Y.

I REFERENCES 121
(2006). Genome-wide analysis of mammalian promoter architecture and evolution. Nat Genet 38, 626-635.
Chung D.W., Fujikawa K., McMullen B.A., Davie E.W. (1986). Human plasma prekallikrein, a zymogen to a serine protease that contains four tandem repeats. Biochemistry 25, 2410-2417.
Ciechanowicz A., Bader M., Wagner J., Ganten D. (1993). Extra-hepatic transcription of plasma prekallikrein gene in human and rat tissues. Biochem Biophys Res Commun 197, 1370-1376.
Colman R.W., Wong P.Y. (1979). Kallikrein-kinin system in pathologic conditions. In: Handbook of experimental pharmacology (Erdös E.G., eds) 25 (Supplement), Springer Heidelberg, New York, 569-607.
Colman R.W., Schmaier A.H. (1997). Contact system: a vascular biology modulator with anticoagulant, profibrinolytic, antiadhesive, and proinflammatory attributes. Blood 90, 3819-3843.
Colman R.W. (1998). The contact system: a proinflammatory pathway with antithrombotic activity. Nat Med 4, 277-278.
Colman R.W. (1999). Biologic activities of the contact factors in vivo-potentiation of hypotension, inflammation, and fibrinolysis, and inhibition of cell adhesion, angiogenesis and thrombosis. Thromb Haemost 82, 1568-1577.
Cooper S.J., Trinklein N.D., Anton E.D., Nguyen L., Myers R.M. (2006). Comprehensive analysis of transcriptional promoter structure and function in 1% of the human genome. Genome Res 16, 1-10.
Couture R., Harrisson M., Vianna R.M., Cloutier F. (2001). Kinin receptors in pain and inflammation. Eur J Pharmacol 429, 161-176.
Cowell I.G. (2002). E4BP4/NFIL3, a PAR-related bZIP factor with many roles. Bioessays 24, 1023-1029.
Czerny T., Schaffner G., Busslinger M. (1993). DNA sequence recognition by Pax proteins: bipartite structure of the paired domain and its binding site. Genes Dev 7, 2048-2061.
Davis A.E.I. (2005). The pathophysiology of hereditary angioedema. Clin Immunol 114, 3-9.
de Wardener H.E. (2001). The hypothalamus and hypertension. Physiol Rev 81, 1599-1658.
Delgado M.D., Leon J. (2006). Gene expression regulation and cancer. Clin Transl Oncol 8, 780-787.
Denoeud F., Kapranov P., Ucla C., Frankish A., Castelo R., Drenkow J., Lagarde J., Alioto T., Manzano C., Chrast J., Dike S., Wyss C., Henrichsen C.N., Holroyd N., Dickson M.C., Taylor R., Hance Z., Foissac S., Myers R.M., Rogers J., Hubbard T., Harrow J., Guigo R.,

I REFERENCES 122
Gingeras T.R., Antonarakis S.E., Reymond A. (2007). Prominent use of distal 5' transcription start sites and discovery of a large number of additional exons in ENCODE regions. Genome Res 17, 746-759.
Devireddy L.R., Kumar K.U., Pater M.M., Pater A. (2000). BAG-1, a novel Bcl-2-interacting protein, activates expression of human JC virus. J Gen Virol 81, 351-357.
Dorn A., Bollekens J., Staub A., Benoist C., Mathis D. (1987). A multiplicity of CCAAT box-binding proteins. Cell 50, 863-872.
Eeckhoute J., Carroll J.S., Geistlinger T.R., Torres-Arzayus M.I., Brown M. (2006). A cell-type-specific transcriptional network required for estrogen regulation of cyclin D1 and cell cycle progression in breast cancer. Genes Dev 20, 2513-2526.
Erdös E.G., Renfrew A.G., Sloane E.M., Wohler J.R. (1963). Enzymatic studies on bradykinin and similar peptides. Ann NY Acad Sci 104, 222-235.
Erdös E.G., Yang H.Y. (1967). An enzyme in microsomal fraction of kidney that inactivates bradykinin. Life Sci 6, 569-574.
Evans B.A., Yun Z.X., Close J.A., Tregear G.W., Kitamura N., Nakanishi S., Callen D.F., Baker E., Hyland V.J., Sutherland G.R. (1988). Structure and chromosomal localization of the human renal kallikrein gene. Biochemistry 27, 3124-3129.
Fan X., Chou D.M., Struhl K. (2006). Activator-specific recruitment of Mediator in vivo. Nat Struct Mol Biol 13, 117-120.
Fink E., Bhoola K.D., Snyman C., Neth P., Figueroa C.D. (2007). Cellular expression of plasma prekallikrein in human tissues. Biol Chem 388, 957-963.
Freier S.M., Kierzek R., Jaeger J.A., Sugimoto N., Caruthers M.H., Neilson T., Turner D.H. (1986). Improved free-energy parameters for predictions of RNA duplex stability. Proc Natl Acad Sci USA 83, 9373-9377.
Fukushima D., Kitamura N., Nakanishi S. (1985). Nucleotide sequence of cloned cDNA for human pancreatic kallikrein. Biochemistry 24, 8037-8043.
Gabrielsen O.S., Huet J. (1993). Magnetic DNA affinity purification of yeast transcription factor. Methods Enzymol 218, 508-525.
Gronostajski R.M. (2000). Roles of the NFI/CTF gene family in transcription and development. Gene 249, 31-45.
Gross P., Oelgeschläger T. (2006). Core promoter-selective RNA polymerase II transcription. Biochem Soc Symp 73, 225-236.

I REFERENCES 123
Gründer A., Qian F., Ebel T.T., Mincheva A., Lichter P., Kruse U., Sippel A.E. (2003). Genomic organization, splice products and mouse chromosomal localization of genes for transcription factor Nuclear Factor One. Gene 304, 171-181.
Guo Y.L., Colman R.W. (2005). Two faces of high-molecular-weight kininogen (HK) in angiogenesis: bradykinin turns it on and cleaved HK (HKa) turns it off. J Thromb Haemost 3, 670-676.
Hattersley P.G., Hayse D. (1970). Fletcher factor deficiency: a report of three unrelated cases. Br J Haematol 18, 411-416.
Hecquet C., Tan F., Marcic B.M., Erdös E.G. (2000). Human bradykinin B(2) receptor is activated by kallikrein and other serine proteases. Mol Pharmacol 58, 828-836.
Hecquet C., Becker R.P., Tan F., Erdös E.G. (2002). Kallikreins when activating bradykinin B2 receptor induce its redistribution on plasma membrane. Int Immunopharmacol 2, 1795-1806.
Hermann A., Buchinger P., Somlev B., Rehbock J. (1996). High and low molecular weight kininogen and plasma prekallikrein/plasma kallikrein in villous capillaries of human term placenta. Placenta 17, 223-230.
Hermann A., Arnhold M., Kresse H., Neth P., Fink E. (1999). Expression of plasma prekallikrein mRNA in human nonhepatic tissues and cell lineages suggests special local functions of the enzyme. Biol Chem 380, 1097-1102.
Holland J.A., Pritchard K.A., Pappolla M.A., Wolin M.S., Rogers N.J., Stemerman M.B. (1990). Bradykinin induces superoxide anion release from human endothelial cells. J Cell Physiol 143, 21-25.
Hong S.L. (1980). Effect of bradykinin and thrombin on prostacyclin synthesis in endothelial cells from calf and pig aorta and human umbilical cord vein. Thromb Res 18, 787-795.
Hough C., Cuthbert C.D., Notley C., Brown C., Hegadorn C., Berber E., Lillicrap D. (2005). Cell type-specific regulation of von Willebrand factor expression by the E4BP4 transcriptional repressor. Blood 105, 1531-1539.
Hughes T.A. (2006). Regulation of gene expression by alternative untranslated regions. Trends Genet 22, 119-122.
Isordia-Salas I., Pixley R.A., Sainz I.M., Martinez-Murillo C., Colman R.W. (2005). The role of plasma high molecular weight kininogen in experimental intestinal and systemic inflammation. Arch Med Res 36, 87-95.
Jessen H., Roigaard H., Riahi-Esfahani S., Jacobsen C. (1994). A comparative study on the uptake of alpha-aminoisobutyric acid by normal and immortalized human embryonic kidney cells from proximal tubule. Biochim Biophys Acta 1190, 279-288.

I REFERENCES 124
Joseph K., Tholanikunnel B.G., Kaplan A.P. (2002). Heat shock protein 90 catalyzes activation of the prekallikrein-kininogen complex in the absence of factor XII. Proc Natl Acad Sci USA 99, 896-900.
Joseph K., Kaplan A.P. (2005). Formation of bradykinin: a major contributor to the innate inflammatory response. Adv Immunol 86, 159-208.
Kawaji H., Kasukawa T., Fukuda S., Katayama S., Kai C., Kawai J., Carninci P., Hayashizaki Y. (2006). CAGE Basic/Analysis Databases: the CAGE resource for comprehensive promoter analysis. Nucleic Acids Res 34, D632-D636.
Keene J.D., Tenenbaum S.A. (2002). Eukaryotic mRNPs may represent posttranscriptional operons. Mol Cell 9, 1161-1167.
Keene J.D., Lager P.J. (2005). Post-transcriptional operons and regulons co-ordinating gene expression. Chromosome Res 13, 327-337.
Kimura K., Wakamatsu A., Suzuki Y., Ota T., Nishikawa T., Yamashita R., Yamamoto J., Sekine M., Tsuritani K., Wakaguri H., Ishii S., Sugiyama T., Saito K., Isono Y., Irie R., Kushida N., Yoneyama T., Otsuka R., Kanda K., Yokoi T., Kondo H., Wagatsuma M., Murakawa K., Ishida S., Ishibashi T., Takahashi-Fujii A., Tanase T., Nagai K., Kikuchi H., Nakai K., Isogai T., Sugano S. (2006). Diversification of transcriptional modulation: large-scale identification and characterization of putative alternative promoters of human genes. Genome Res 16, 55-65.
Kliewer S.A., Umesono K., Heyman R.A., Mangelsdorf D.J., Dyck J.A., Evans R.M. (1992). Retinoid X receptor-COUP-TF interactions modulate retinoic acid signaling. Proc Natl Acad Sci USA 89, 1448-1452.
Kornberg R.D. (2005). Mediator and the mechanism of transcriptional activation. Trends Biochem Sci 30, 235-239.
Kornblihtt A.R. (2005). Promoter usage and alternative splicing. Curr Opin Cell Biol 17, 262-268.
Kraut H., Frey E.K., Bauer E. (1928). Über ein neues Kreislaufhormon. Hoppe-Seylers Z Physiol Chem 175, 97-114.
Kraut H., Frey E.K., Werle E. (1930). Der Nachweis eines Kreislaufhormons in der Pankreasdrüse. Hoppe-Seylers Z Physiol Chem 189, 97-106.
Kraut H., Frey E.K., Werle E. (1933). Über den Nachweis und das Vorkommen des Kallikreins im Blut. Hoppe-Seylers Z Physiol Chem 222, 73-98.
Krohn K., Rozovsky I., Wals P., Teter B., Anderson C.P., Finch C.E. (1999). Glial fibrillary acidic protein transcription responses to transforming growth factor-beta1 and interleukin-1beta are mediated by a nuclear factor-1-like site in the near-upstream promoter. J Neurochem 72, 1353-1361.

I REFERENCES 125
Ladias J.A., Karathanasis S.K. (1991). Regulation of the apolipoprotein AI gene by ARP-1, a novel member of the steroid receptor superfamily. Science 251, 561-565.
Laemmli U.K. (1970). Cleavage of structural proteins during the assembly of the head of bacteriophage T4. Nature 227, 680-685.
Landry J.R., Mager D.L., Wilhelm B.T. (2003). Complex controls: the role of alternative promoters in mammalian genomes. Trends Genet 19, 640-648.
Lee M., Song H., Park S., Park J. (1998). Transcription of the rat p53 gene is mediated by factor binding to two recognition motifs of NF1-like protein. Biol Chem 379, 1333-1340.
Lenhard B., Sandelin A., Mendoza L., Engström P., Jareborg N., Wasserman W.W. (2003). Identification of conserved regulatory elements by comparative genome analysis. J Biol 2, 13.
Levy J.H., O'Donnell P.S. (2006). The therapeutic potential of a kallikrein inhibitor for treating hereditary angioedema. Expert Opin Investig Drugs 15, 1077-1090.
Li Q., Peterson K.R., Fang X., Stamatoyannopoulos G. (2002). Locus control regions. Blood 100, 3077-3086.
Li Q., Dashwood W.M., Zhong X., Al Fageeh M., Dashwood R.H. (2004). Cloning of the rat beta-catenin gene (Ctnnb1) promoter and its functional analysis compared with the Catnb and CTNNB1 promoters. Genomics 83, 231-242.
Liao D.F., Jin Z.G., Baas A.S., Daum G., Gygi S.P., Aebersold R., Berk B.C. (2000). Purification and identification of secreted oxidative stress-induced factors from vascular smooth muscle cells. J Biol Chem 275, 189-196.
Lim C.Y., Santoso B., Boulay T., Dong E., Ohler U., Kadonaga J.T. (2004). The MTE, a new core promoter element for transcription by RNA polymerase II. Genes Dev 18, 1606-1617.
Lodish H., Berk A., Matsudaira P., Kaiser C.A., Krieger M., Scott M.P., Zipursky S.L., Darnell J. (2003a) Activators and repressors of transcription. In: Molecular cell biology, W.H. Freeman and Company New York, 458-469.
Lodish H., Berk A., Matsudaira P., Kaiser C.A., Krieger M., Scott M.P., Zipursky S.L., Darnell J. (2003b) Transcription initiation by RNA Polymerase II. In: Molecular cell biology, W.H. Freeman and Company New York, 469-471.
Lund L.R., Green K.A., Stoop A.A., Ploug M., Almholt K., Lilla J., Nielsen B.S., Christensen I.J., Craik C.S., Werb Z., Dano K., Romer J. (2006). Plasminogen activation independent of uPA and tPA maintains wound healing in gene-deficient mice. EMBO J 25, 2686-2697.
Lundwall A., Band V., Blaber M., Clements J.A., Courty Y., Diamandis E.P., Fritz H., Lilja H., Malm J., Maltais L.J., Olsson A.Y., Petraki C., Scorilas A., Sotiropoulou G., Stenman U.H.,

I REFERENCES 126
Stephan C., Talieri M., Yousef G.M. (2006). A comprehensive nomenclature for serine proteases with homology to tissue kallikreins. Biol Chem 387, 637-641.
MacGregor G.R., Caskey C.T. (1989). Construction of plasmids that express E. coli beta-galactosidase in mammalian cells. Nucleic Acids Res 17, 2365.
Mandle R.J., Colman R.W., Kaplan A.P. (1976). Identification of prekallikrein and high-molecular-weight kininogen as a complex in human plasma. Proc Natl Acad Sci USA 73, 4179-4183.
Mandle R.J., Kaplan A.P. (1977). Hageman factor substrates. Human plasma prekallikrein: mechanism of activation by Hageman factor and participation in hageman factor-dependent fibrinolysis. J Biol Chem 252, 6097-6104.
McMullen B.A., Fujikawa K., Davie E.W. (1991). Location of the disulfide bonds in human plasma prekallikrein: the presence of four novel apple domains in the amino-terminal portion of the molecule. Biochemistry 30, 2050-2056.
Movat H.Z. (1979). The plasma kallikrein-kinin system and its interrelationship with other components of blood. In: Bradykinin, kallidin and kallikrein. Handbook of experimental pharmacology XXV (Erdös E.G., eds), Springer–Verlag Berlin, 1–89.
Nakshatri H., Chambon P. (1994). The directly repeated RG(G/T)TCA motifs of the rat and mouse cellular retinol-binding protein II genes are promiscuous binding sites for RAR, RXR, HNF-4, and ARP-1 homo- and heterodimers. J Biol Chem 269, 890-902.
Nebl G., Cato A.C. (1995). NFI/X proteins: a class of NFI family of transcription factors with positive and negative regulatory domains. Cell Mol Biol Res 41, 85-95.
Neth P., Arnhold M., Nitschko H., Fink E. (2001). The mRNAs of prekallikrein, factors XI and XII, and kininogen, components of the contact phase cascade are differentially expressed in multiple non-hepatic human tissues. Thromb Haemost 85, 1043-1047.
Neth, P. (2002). Molekulare Analyse der mRNA-Expression von Plasma-Prokallikrein: Expressionsprofil in humanen Geweben und Mechanismen der Transkriptionsregulation. Dissertation, Ludwig-Maximilians-Universität Munich: Faculty of Biology.
Neth P., Arnhold M., Sidarovich V., Bhoola K.D., Fink E. (2005). Expression of the plasma prekallikrein gene: utilization of multiple transcription start sites and alternative promoter regions. Biol Chem 386, 101-109.
Noda M., Kariura Y., Pannasch U., Nishikawa K., Wang L., Seike T., Ifuku M., Kosai Y., Wang B., Nolte C., Aoki S., Kettenmann H., Wada K. (2007). Neuroprotective role of bradykinin because of the attenuation of pro-inflammatory cytokine release from activated microglia. J Neurochem 101, 397-410.

I REFERENCES 127
O'Neill D.W., Bornschlegel K., Flamm M., Castle M., Bank A. (1991). A DNA-binding factor in adult hematopoietic cells interacts with a pyrimidine-rich domain upstream from the human delta-globin gene. Proc Natl Acad Sci USA 88, 8953-8957.
O'Neill D.W., Schoetz S.S., Lopez R.A., Castle M., Rabinowitz L., Shor E., Krawchuk D., Goll M.G., Renz M., Seelig H.P., Han S., Seong R.H., Park S.D., Agalioti T., Munshi N., Thanos D., Erdjument-Bromage H., Tempst P., Bank A. (2000). An ikaros-containing chromatin-remodeling complex in adult-type erythroid cells. Mol Cell Biol 20, 7572-7582.
Osada S., Daimon S., Nishihara T., Imagawa M. (1996). Identification of DNA binding-site preferences for nuclear factor I-A. FEBS Lett 390, 44-46.
Osada S., Ikeda T., Xu M., Nishihara T., Imagawa M. (1997). Identification of the transcriptional repression domain of nuclear factor 1-A. Biochem Biophys Res Commun 238, 744-747.
Ouellet S., Vigneault F., Lessard M., Leclerc S., Drouin R., Guerin S.L. (2006). Transcriptional regulation of the cyclin-dependent kinase inhibitor 1A (p21) gene by NFI in proliferating human cells. Nucleic Acids Res 34, 6472-6487.
Page J.D., You J.L., Harris R.B., Colman R.W. (1994). Localization of the binding site on plasma kallikrein for high-molecular-weight kininogen to both apple 1 and apple 4 domains of the heavy chain. Arch Biochem Biophys 314, 159-164.
Paliouras M., Diamandis E.P. (2006). The kallikrein world: an update on the human tissue kallikreins. Biol Chem 387, 643-652.
Palmer R.M., Ferrige A.G., Moncada S. (1987). Nitric oxide release accounts for the biological activity of endothelium-derived relaxing factor. Nature 327, 524-526.
Peek M., Moran P., Mendoza N., Wickramasinghe D., Kirchhofer D. (2002). Unusual proteolytic activation of pro-hepatocyte growth factor by plasma kallikrein and coagulation factor XIa. J Biol Chem 277, 47804-47809.
Quandt K., Frech K., Karas H., Wingender E., Werner T. (2006). MatInd and MatInspector: new fast and versatile tools for detection of consensus matches in nucleotide sequence data. Nucleic Acids Res 23, 4878-4884.
Renne T., Dedio J., Meijers J.C., Chung D., Müller-Esterl W. (1999). Mapping of the discontinuous H-kininogen binding site of plasma prekallikrein. Evidence for a critical role of apple domain-2. J Biol Chem 274, 25777-25784.
Renne T., Pozgajova M., Gruner S., Schuh K., Pauer H.U., Burfeind P., Gailani D., Nieswandt B. (2005). Defective thrombus formation in mice lacking coagulation factor XII. J Exp Med 202, 271-281.
Reynolds A., Leake D., Boese Q., Scaringe S., Marshall W.S., Khvorova A. (2004). Rational siRNA design for RNA interference. Nat Biotechnol 22, 326-330.

I REFERENCES 128
Riesner D., Steger G., Zimmat R., Owens R.A., Wagenhofer M., Hillen W., Vollbach S., Henco K. (1989). Temperature-gradient gel electrophoresis of nucleic acids: analysis of conformational transitions, sequence variations, and protein-nucleic acid interactions. Electrophoresis 10, 377-389.
Rocha e Silva M., Beraldo W.T., Rosenfeld G. (1949). Bradykinin, a hypotensive and smooth muscle stimulating factor released from plasma globulin by snake venoms and by trypsin. Am J Physiol 156, 261-273.
Saito H., Ratnoff O.D., Donaldson V.H. (1974). Defective activation of clotting, fibrinolytic, and permeability-enhancing systems in human Fletcher trait plasma. Circ Res 34, 641-651.
Sambrook J., Russel D.W. (2001). Mutagenesis. In: Molecular cloning: a laboratory manual, Cold Spring Harbor Laboratory Press New York, 13.1-13.91.
SantaLucia J.J. (1998). A unified view of polymer, dumbbell, and oligonucleotide DNA nearest-neighbor thermodynamics. Proc Natl Acad Sci USA 95, 1460-1465.
Schreiber E., Matthias P., Müller M.M., Schaffner W. (1989). Rapid detection of octamer binding proteins with 'mini-extracts', prepared from a small number of cells. Nucleic Acids Res 17, 6419.
Seidah N.G., Sawyer N., Hamelin J., Mion P., Beaubien G., Brachpapa L., Rochemont J., Mbikay M., Chretien M. (1990). Mouse plasma kallikrein: cDNA structure, enzyme characterization, and comparison of protein and mRNA levels among species. DNA Cell Biol 9, 737-748.
Selvarajan S., Lund L.R., Takeuchi T., Craik C.S., Werb Z. (2001). A plasma kallikrein-dependent plasminogen cascade required for adipocyte differentiation. Nat Cell Biol 3, 267-275.
Shariat-Madar Z., Mahdi F., Schmaier A.H. (2002a). Assembly and activation of the plasma kallikrein/kinin system: a new interpretation. Int Immunopharmacol 2, 1841-1849.
Shariat-Madar Z., Mahdi F., Schmaier A.H. (2002b). Identification and characterization of prolylcarboxypeptidase as an endothelial cell prekallikrein activator. J Biol Chem 277, 17962-17969.
Shariat-Madar Z., Mahdi F., Schmaier A.H. (2004). Recombinant prolylcarboxypeptidase activates plasma prekallikrein. Blood 103, 4554-4561.
Shariat-Madar Z., Schmaier A.H. (2004). The plasma kallikrein/kinin and renin angiotensin systems in blood pressure regulation in sepsis. J Endotoxin Res 10, 3-13.
Shariat-Madar Z., Rahimy E., Mahdi F., Schmaier A.H. (2005). Overexpression of prolylcarboxypeptidase enhances plasma prekallikrein activation on Chinese hamster ovary cells. Am J Physiol Heart Circ Physiol 289, H2697-H2703.

I REFERENCES 129
Shuman S. (1991). Recombination mediated by Vaccinia virus DNA topoisomerase I in Escherichia coli is sequence specific. Proc Natl Acad Sci USA 88, 10104-10108.
Shuman S. (1994). Novel approach to molecular cloning and polynucleotide synthesis using Vaccinia DNA topoisomerase. J Biol Chem 269, 32678-32684.
Sive H.L., Heintz N., Roeder R.G. (1986). Multiple sequence elements are required for maximal in vitro transcription of a human histone H2B gene. Mol Cell Biol 6, 3329-3340.
Sladek F.M., Zhong W.M., Lai E., Darnell J.E., Jr. (1990). Liver-enriched transcription factor HNF-4 is a novel member of the steroid hormone receptor superfamily. Genes Dev 4, 2353-2365.
Smale S.T., Kadonaga J.T. (2003). The RNA polymerase II core promoter. Annu Rev Biochem 72, 449-479.
Stadnicki A., DeLa Cadena R.A., Sartor R.B., Bender D., Kettner C.A., Rath H.C., Adam A., Colman R.W. (1996). Selective plasma kallikrein inhibitor attenuates acute intestinal inflammation in Lewis rat. Dig Dis Sci 41, 912-920.
Stadnicki A., Sartor R.B., Janardham R., Majluf-Cruz A., Kettner C.A., Adam A.A., Colman R.W. (1998). Specific inhibition of plasma kallikrein modulates chronic granulomatous intestinal and systemic inflammation in genetically susceptible rats. FASEB J 12, 325-333.
Stadnicki A. (2005). Tissue and plasma kallikrein in inflammatory bowel disease. Dig Liver Dis 37, 648-650.
Steffensen K.R., Holter E., Tobin K.A., Leclerc S., Gustafsson J.A., Guerin S.L., Eskild W. (2001). Members of the nuclear factor 1 family reduce the transcriptional potential of the nuclear receptor LXRalpha promoter. Biochem Biophys Res Commun 289, 1262-1267.
Stoop A.A., Craik C.S. (2003). Engineering of a macromolecular scaffold to develop specific protease inhibitors. Nat Biotechnol 21, 1063-1068.
Suzuki Y., Taira H., Tsunoda T., Mizushima-Sugano J., Sese J., Hata H., Ota T., Isogai T., Tanaka T., Morishita S., Okubo K., Sakaki Y., Nakamura Y., Suyama A., Sugano S. (2001). Diverse transcriptional initiation revealed by fine, large-scale mapping of mRNA start sites. EMBO Rep 2, 388-393.
Szutorisz H., Dillon N., Tora L. (2005). The role of enhancers as centres for general transcription factor recruitment. Trends Biochem Sci 30, 593-599.
Tang J., Yu C.L., Williams S.R., Springman E., Jeffery D., Sprengeler P.A., Estevez A., Sampang J., Shrader W., Spencer J., Young W., McGrath M., Katz B.A. (2005). Expression, crystallization, and three-dimensional structure of the catalytic domain of human plasma kallikrein. J Biol Chem 280, 41077-41089.

I REFERENCES 130
The ENCODE Project Consortium (2004). The ENCODE (ENCyclopedia Of DNA Elements) Project. Science 306, 636-640.
The ENCODE Project Consortium (2007). Identification and analysis of functional elements in 1% of the human genome by the ENCODE pilot project. Nature 447, 799-816.
Thomas M.C., Chiang C.M. (2006). The general transcription machinery and general cofactors. Crit Rev Biochem Mol Biol 41, 105-178.
Tokusumi Y., Ma Y., Song X., Jacobson R.H., Takada S. (2007). The new core promoter element XCPE1 (X Core Promoter Element 1) directs activator-, mediator-, and TATA-binding protein-dependent but TFIID-independent RNA polymerase II transcription from TATA-less promoters. Mol Cell Biol 27, 1844-1858.
Tveito G., Hansteen I.L., Dalen H., Haugen A. (1989). Immortalization of normal human kidney epithelial cells by nickel (II). Cancer Res 49, 1829-1835.
Valenzuela L., Kamakaka R.T. (2006). Chromatin insulators. Annu Rev Genet 40, 107-138.
van der Graaf F., Tans G., Bouma B.N., Griffin J.H. (1982). Isolation and functional properties of the heavy and light chains of human plasma kallikrein. J Biol Chem 257, 14300-14305.
van Houten V., Denkers F., van Dijk M., van den B.M., Brakenhoff R. (1998). Labeling efficiency of oligonucleotides by T4 polynucleotide kinase depends on 5'-nucleotide. Anal Biochem 265, 386-389.
Webster M.E. (1970). Kallikreins in glandular tissues. In: Bradykinin, kallidin and kallikrein. Handbook of experimental pharmacology XXV (Erdös E.G., eds), Springer Verlag Berlin, 131-155.
Weintraub H., Cheng P.F., Conrad K. (1986). Expression of transfected DNA depends on DNA topology. Cell 46, 115-122.
Werle E., Götze W., Keppler A. (1937). Über die Wirkung des Kallikreins auf den isolierten Darm und über neue darmkontrahierende Substanz. Biochem Z 289, 217-233.
Werle E. (1970). Discovery of the most important kallikreins and kallikrein inhibitors. In: Bradykinin, kallidin and kallikrein. Handbook of experimental pharmacology XXV (Erdös E.G., eds), Springer Verlag Berlin, 1-6.
West A.G., Fraser P. (2005). Remote control of gene transcription. Hum Mol Genet 14 (Spec No 1), R101-R111.
Wickenheisser J.K., Nelson-DeGrave V.L., Quinn P.G., McAllister J.M. (2004). Increased cytochrome P450 17alpha-hydroxylase promoter function in theca cells isolated from patients with polycystic ovary syndrome involves nuclear factor-1. Mol Endocrinol 18, 588-605.

I REFERENCES 131
Wong P., Colman R.W., Talamo R.C., Babior B.M. (1972). Kallikrein-bradykinin system in chronic alcoholic liver disease. Ann Intern Med 77, 205-209.
Wood L.D., Farmer A.A., Richmond A. (1995). HMGI(Y) and Sp1 in addition to NF-kappa B regulate transcription of the MGSA/GRO alpha gene. Nucleic Acids Res 23, 4210-4219.
Xia T., Gao L., Yu R.K., Zeng G. (2003). Characterization of the promoter and the transcription factors for the mouse UDP-Gal:betaGlcNAc beta1,3-galactosyltransferase gene. Gene 309, 117-123.
Xia T., Zeng G., Gao L., Yu R.K. (2005). Sp1 and AP2 enhance promoter activity of the mouse GM3-synthase gene. Gene 351, 109-118.
Yang H.Y., Erdös E.G. (1967). Second kininase in human blood plasma. Nature 215, 1402-1403.
Young W.B., Rai R., Shrader W.D., Burgess-Henry J., Hu H., Elrod K.C., Sprengeler P.A., Katz B.A., Sukbuntherng J., Mordenti J. (2006). Small molecule inhibitors of plasma kallikrein. Bioorg Med Chem Lett 16, 2034-2036.
Yu H., Anderson P.J., Freedman B.I., Rich S.S., Bowden D.W. (2000). Genomic structure of the human plasma prekallikrein gene, identification of allelic variants, and analysis in end-stage renal disease. Genomics 69, 225-234.
Zeng G., Gao L., Xia T., Tencomnao T., Yu R.K. (2003). Characterization of the 5'-flanking fragment of the human GM3-synthase gene. Biochim Biophys Acta 1625, 30-35.
Zhang J., Krishnan R., Arnold C.S., Mattsson E., Kilpatrick J.M., Bantia S., Dehghani A., Boudreaux B., Gupta S.N., Kotian P.L., Chand P., Babu Y.S. (2006). Discovery of highly potent small molecule kallikrein inhibitors. Med Chem 2, 545-553.
Zhao Y., Qiu Q., Mahdi F., Shariat-Madar Z., Rojkjaer R., Schmaier A.H. (2001). Assembly and activation of HK-PK complex on endothelial cells results in bradykinin liberation and NO formation. Am J Physiol Heart Circ Physiol 280, H1821-H1829.

ACKNOWLEDGEMENTS 132
ACKNOWLEDGEMENTS
Working on a thesis is a long and eventful journey. One starts it with enthusiasm and energy,
works hard and expects a lot, from time to time arrives at frustrations and even falls into crisis,
but finds strength to overcome disillusionments for what is richly rewarded afterwards with long-
expected final results. This journey is not so appealing to undertake unless one is accompanied
by many open-minded and friendly people one comes across when working in science. I dedicate
this page to all those people who were alongside all these years and who helped me, both directly
and indirectly, in completing my doctorate journey.
First of all I would like to thank my supervisor Prof. Dr. Edwin Fink. I am indebted to him for
scientific guidelines and advices along the whole thesis work, for his scientific experience
generously shared with me, for being always precise and constructive when judging my ideas
and giving a feedback, and last but not least for his help in solving daily questions. Without his
personal support and encouragement this thesis would not have been possible.
I am very grateful to Ms. Marianne Arnhold for her skillful assistance in experimental work
and her sincere personal support. I am particularly grateful to her for advancing my German
language abilities.
I express my thanks to Prof. Dr. Marianne Jochum who supported this work as the head of the
division and stimulated my scientific development through discussion of the experimental results
in numerous seminars.
I am very grateful to Prof. Dr. Dr. Adelbert Bacher from the Department of Chemistry of the
Technical University Munich for taking over the mentorship.
I would like to thank PD. Dr. Peter J. Nelson from the Medical Policlinic of the Ludwig-
Maximillians-University Munich and his PhD students Christine von Törne and Dilip Kumar for
their invaluable help and assistance in establishing EMSA and ChIP experiments.
I am also grateful to PD. Dr. Alexander Faussner and Dr. Peter Neth for their generous
scientific support and productive discussions.
I am greatly indebted to my colleagues from the division who have contributed to this thesis
in numerous ways: Prof. Dr. Hans Fritz, Prof. Dr. Christian Sommerhoff, Dr. Christian Ries, Dr.
Dorit Nägler, Dr. Oliver Popp, Annette Lechner, Lourdes Ruiz-Heinrich. I wish to particularly
thank my friends Dr. Dusica Gabrijelcic-Geiger, Marisa Karow, Virginia Egea, Tania Popp, and
Göran Wennerberg. Thanks for the good time I had while working with you and during my spare
time in Munich.

ACKNOWLEDGEMENTS 133
It is difficult to overstate my gratitude to my friends Dr. Irina Kalatskaya, Dr. Roman
Anisimov, Dr. Andrei Golubov and his family. Side by side we were getting used to the new
country and culture, exchanging scientific and daily life experience. I also want to thank my old
friends from Minsk many of whom have dispersed last years over the whole world. Mikita, Julia,
Lena, Andrei, Sergei, Liosha, Katia, Roma, Tania - thank you for being close to me
notwithstanding long geographic distances, making my stay away from home bearable.
I will be always grateful to Dr. Anna Georgievna Lapko for being the first person
professionally acquainting me with the world of science.
Lastly, and most importantly, I wish to thank my family. I remain indebted to my parents
Tania and Yuri, my sister Irina, aunt Lena and uncle Wolfgang for always loving me, supporting
me and believing in me. I especially thank my husband Andrei, who gave me his love and
encouragement, and, not least, for his patience and forbearance whilst I have spent hundreds of
hours working on the thesis!
Thank you all!
Munich, December, 2007

CURRICULUM VITAE 134
PERSONAL DATA
NAME Viktoryia Sidarovich DATE OF BIRTH July 19, 1980 PLACE OF BIRTH Minsk, Belarus CITIZENSHIP Belarussian MARITAL STATUS married, one child PRE-UNIVERSITY SCHOOLING 1986 − 1995 Secondary school G 161, Minsk, Belarus
1995 − 1997 Scientific Lyceum of the Belarusian State University, Minsk, Belarus,
magna cum laude
UNIVERSITY STUDY
1997 − 2002 Sakharov International Environmental University, Faculty of Radiobiology, Minsk, Belarus M.S., Radiobiology and radiation medicine, summa cum laude Major: Medical ecology Thesis: “Estimation and evaluation of standardized cancer mortality rates of the population of Minsk during the period from 1953 to 2000”
POSTGRADUATE STUDIES
2003 − 2007 Experimental work for a PhD thesis at the Abteilung für Klinische Chemie und Klinische Biochemie, Klinikum Innenstadt, Medizinische Fakultät, Ludwig-Maximilians-Universität München, Germany PhD candidate Thesis: “ Transcription of the human plasma prekallikrein gene: demonstration of alternative promoters, multiple initiation sites, and alternative splicing and identification of cis-acting DNA elements”
From 2008 Centre for Integrative Biology, University of Trento, Italy Postdoctoral position
HONOURS AND AWARDS
A.D. Sakharov Foundation scholarship for academic excellence, Sakharov International Environmental University, Minsk, Belarus; May 2000 – April 2001
V.I. Vernadsky Ecological Foundation scholarship for academic excellence, Lomonosov Moscow State University, Moscow, Russian Federation; 2001

LIST OF PUBLICATIONS AND PRESENTATIONS 135
LIST OF PUBLICATIONS AND PRESENTATIONS RELATED TO THE WORK
� Neth P., Arnhold M., Sidarovich V., Bhoola K., Fink E. (2005). Expression of the
plasma prekallikrein gene: utilization of multiple transcription start sites and alternative
promoter regions. Biol Chem 386, 101−109.
� Sidarovich V., Arnhold M., Fink E. Role of the nuclear factor 1 transcription factor for
the expression of the human PPK gene. (In preparation)
� Sidarovich V., Fink E. Identification in the gene of human plasma prekallikrein
(KLKB1) of a cis-acting element which assists in the recruitment of alternative
promoters. (In preparation)
� 2nd International Conference on “Exploring the Future of Vascular and
Inflammatory Mediators"
May 30 − June 2, 2007, Berlin, Germany
Sidarovich V., Arnhold M., Neth P., Fink E. Regulation of the plasma prekallikrein
transcription: identification of cis-acting DNA elements within the basic control region.
(Poster)
� 24th Winter School on “Proteinases and Their Inhibitors - Recent Developments”
February 28 - March 4, 2007, Tiers, Italy
Sidarovich V., Fink E. Regulation of the plasma prekallikrein transcription: a 13-bp
element of intron 1 causes displacement of the transcription start site. (Presentation)
� 7th EMBL Transcription Meeting
August 26-30, 2006, Heidelberg, Germany
Sidarovich V., Arnhold M., Neth P., Fink E. Transcription of the plasma prekallikrein
gene: identification of cis-acting DNA elements within the basic control region. (Poster)
� 23rd Winter School on Proteinases and Their Inhibitors - Recent Developments
March 1−5, 2006, Tiers, Italy
Sidarovich V., Arnhold M., Neth P., Fink E. Transcription of the plasma prekallikrein
gene: identification of alternative promoter regions and cis-acting DNA elements within
the basic control region. (Presentation)
� International Conference “Exploring the Future of Local Vascular and
Inflammatory Mediators"
May 26−28, 2005, Lund, Sweden
Sidarovich V., Arnhold M., Neth P., Fink E. Transcription of the plasma prekallikrein
gene: utilization of multiple start sites and alternative promoter regions. (Poster)