TRANSACTIONS ON SOFTWARE ENGINEERING, VOL....
13
0098-5589 (c) 2015 IEEE. Translations and content mining are permitted for academic research only. Personal use is also permitted, but republication/redistribution requires IEEE permission. See http://www.ieee.org/publications_standards/publications/rights/index.html for more information. This article has been accepted for publication in a future issue of this journal, but has not been fully edited. Content may change prior to final publication. Citation information: DOI 10.1109/TSE.2016.2527791, IEEE Transactions on Software Engineering TRANSACTIONS ON SOFTWARE ENGINEERING, VOL. V, NO. N, MONTH 20YY 1 The Role of Method Chains and Comments in Software Readability and Comprehension – An Experiment Jürgen Börstler, Member, IEEE, and Barbara Paech, Member, IEEE Abstract—Software readability and comprehension are important factors in software maintenance. There is a large body of research on software measurement, but the actual factors that make software easier to read or easier to comprehend are not well understood. In the present study, we investigate the role of method chains and code comments in software readability and comprehension. Our analysis comprises data from 104 students with varying programming experience. Readability and comprehension were measured by perceived readability, reading time and performance on a simple cloze test. Regarding perceived readability, our results show statistically significant differences between comment variants, but not between method chain variants. Regarding comprehension, there are no significant differences between method chain or comment variants. Student groups with low and high experience, respectively, show significant differences in perceived readability and performance on the cloze tests. Our results do not show any significant relationships between perceived readability and the other measures taken in the present study. Perceived readability might therefore be insufficient as the sole measure of software readability or comprehension. We also did not find any statistically significant relationships between size and perceived readability, reading time and comprehension. Index Terms—Software readability, software comprehension, software measurement, comments, method chains, experiment. ✦ 1 I NTRODUCTION S OFTWARE readability and comprehension are major soft- ware cost factors. Software maintenance accounts for 66%–90% of the total costs of software during its lifetime [15] and around half of those costs are spent on code comprehension [16, 39, 57]. Furthermore, more than 40% of the comprehension time is spent on plain code reading [33]. Readability is therefore a key cost-driver for software development and maintenance. Chen and Huang [9] claim that inadequate documenta- tion and lack of adherence to common guidelines or best practices are the most important problem factors for main- tenance. Extensive documentation can significantly support software maintenance, but the extra effort needed to pro- duce the necessary documents pays off only long-term and only for complex maintenance tasks [2]. In practice, docu- mentation therefore rapidly deteriorates [35]. Writing self- documenting code, instead of documenting ill-structured code, is proposed as a partial solution to this problem [26, 48]. This emphasizes the importance of readable and comprehensible code, in particular in the context of Ag- ile/Lean development practices where extraneous docu- mentation might be considered as waste [43]. There is a large body of literature on general coding guidelines or practices to improve code readability and comprehension [42, 50, 53] as well as specific rules, heuris- • J. Börstler is with the Department of Software Engineering, Blekinge Institute of Technology, Karlskrona, Sweden. E-mail: [email protected] • B. Paech is with the Department of Computer Science, Heidelberg Uni- versity, Heidelberg, Germany. [email protected] tics and guidelines to obtain “good” or “better” (object- oriented) design or code, e.g., design patterns [6, 19], design heuristics [36, 45], code smells and refactoring [17, 25, 29]. The actual factors that make software easier to comprehend are, however, not well understood. Furthermore, the factors can also have complex interactions. We distinguish people, project, cognitive and software factors, where people factors comprise properties of people and software factors comprise properties of software, cogni- tive factors are derived from cognitive theories and project factors describe elements of the project environment which can ease comprehension (see Fig. 1). In this classification readability is a software factor. Examples of interactions can be found between complexity, size and readability. Reduc- ing the complexity of a program will likely also affect its size. More comments or more white-space might increase a programs readability and comprehensibility, but also make it longer. Longer programs are, however, less readable and more difficult to comprehend [44]. In the present study, we investigate the role of source code comments and method chains in software readability and comprehension. Method chaining has been advocated as a programming style that leads to more compact and more readable code [18, 28]. Careless use of method chain- ing can lead to violations of the Law of Demeter [36] though, which can lead to more defects [21]. In coding guidelines source code comments are advocated as “absolutely vital to keeping ... code readable” 1 , but also that focus should be on code that clearly communicates intent and functionality to 1. http://google-styleguide.googlecode.com/svn/trunk/cppguide. html#Comments, last visited 2014-09-12.
Transcript of TRANSACTIONS ON SOFTWARE ENGINEERING, VOL....

0098-5589 (c) 2015 IEEE. Translations and content mining are permitted for academic research only. Personal use is also permitted, but republication/redistribution requires IEEE permission. Seehttp://www.ieee.org/publications_standards/publications/rights/index.html for more information.
This article has been accepted for publication in a future issue of this journal, but has not been fully edited. Content may change prior to final publication. Citation information: DOI 10.1109/TSE.2016.2527791, IEEETransactions on Software Engineering
TRANSACTIONS ON SOFTWARE ENGINEERING, VOL. V, NO. N, MONTH 20YY 1
The Role of Method Chains and Comments inSoftware Readability and Comprehension – An
ExperimentJürgen Börstler, Member, IEEE, and Barbara Paech, Member, IEEE
Abstract—Software readability and comprehension are important factors in software maintenance. There is a large body of researchon software measurement, but the actual factors that make software easier to read or easier to comprehend are not well understood.In the present study, we investigate the role of method chains and code comments in software readability and comprehension. Ouranalysis comprises data from 104 students with varying programming experience. Readability and comprehension were measured byperceived readability, reading time and performance on a simple cloze test.Regarding perceived readability, our results show statistically significant differences between comment variants, but not betweenmethod chain variants. Regarding comprehension, there are no significant differences between method chain or comment variants.Student groups with low and high experience, respectively, show significant differences in perceived readability and performance on thecloze tests.Our results do not show any significant relationships between perceived readability and the other measures taken in the present study.Perceived readability might therefore be insufficient as the sole measure of software readability or comprehension. We also did not findany statistically significant relationships between size and perceived readability, reading time and comprehension.
Index Terms—Software readability, software comprehension, software measurement, comments, method chains, experiment.
F
1 INTRODUCTION
SOFTWARE readability and comprehension are major soft-ware cost factors. Software maintenance accounts for
66%–90% of the total costs of software during its lifetime[15] and around half of those costs are spent on codecomprehension [16, 39, 57]. Furthermore, more than 40%of the comprehension time is spent on plain code reading[33]. Readability is therefore a key cost-driver for softwaredevelopment and maintenance.
Chen and Huang [9] claim that inadequate documenta-tion and lack of adherence to common guidelines or bestpractices are the most important problem factors for main-tenance. Extensive documentation can significantly supportsoftware maintenance, but the extra effort needed to pro-duce the necessary documents pays off only long-term andonly for complex maintenance tasks [2]. In practice, docu-mentation therefore rapidly deteriorates [35]. Writing self-documenting code, instead of documenting ill-structuredcode, is proposed as a partial solution to this problem[26, 48]. This emphasizes the importance of readable andcomprehensible code, in particular in the context of Ag-ile/Lean development practices where extraneous docu-mentation might be considered as waste [43].
There is a large body of literature on general codingguidelines or practices to improve code readability andcomprehension [42, 50, 53] as well as specific rules, heuris-
• J. Börstler is with the Department of Software Engineering, BlekingeInstitute of Technology, Karlskrona, Sweden.E-mail: [email protected]
• B. Paech is with the Department of Computer Science, Heidelberg Uni-versity, Heidelberg, [email protected]
tics and guidelines to obtain “good” or “better” (object-oriented) design or code, e.g., design patterns [6, 19], designheuristics [36, 45], code smells and refactoring [17, 25, 29].The actual factors that make software easier to comprehendare, however, not well understood. Furthermore, the factorscan also have complex interactions.
We distinguish people, project, cognitive and softwarefactors, where people factors comprise properties of peopleand software factors comprise properties of software, cogni-tive factors are derived from cognitive theories and projectfactors describe elements of the project environment whichcan ease comprehension (see Fig. 1). In this classificationreadability is a software factor. Examples of interactions canbe found between complexity, size and readability. Reduc-ing the complexity of a program will likely also affect itssize. More comments or more white-space might increase aprograms readability and comprehensibility, but also makeit longer. Longer programs are, however, less readable andmore difficult to comprehend [44].
In the present study, we investigate the role of sourcecode comments and method chains in software readabilityand comprehension. Method chaining has been advocatedas a programming style that leads to more compact andmore readable code [18, 28]. Careless use of method chain-ing can lead to violations of the Law of Demeter [36] though,which can lead to more defects [21]. In coding guidelinessource code comments are advocated as “absolutely vital tokeeping ... code readable”1, but also that focus should be oncode that clearly communicates intent and functionality to
1. http://google-styleguide.googlecode.com/svn/trunk/cppguide.html#Comments, last visited 2014-09-12.

0098-5589 (c) 2015 IEEE. Translations and content mining are permitted for academic research only. Personal use is also permitted, but republication/redistribution requires IEEE permission. Seehttp://www.ieee.org/publications_standards/publications/rights/index.html for more information.
This article has been accepted for publication in a future issue of this journal, but has not been fully edited. Content may change prior to final publication. Citation information: DOI 10.1109/TSE.2016.2527791, IEEETransactions on Software Engineering
TRANSACTIONS ON SOFTWARE ENGINEERING, VOL. V, NO. N, MONTH 20YY 2
Ease of program
comprehension
Programming language fluency:Degree of knowledge/experience of the syntax and semantics of the PL.
Domain knowledge: Degree of knowledge and/or experience in the application domain.
Stress/motivation: Degree of engagement/interest in the task.
Size: The plain volume of data/text/information.
Readability: The properties that make some programs more easy to read than others.
Complexity (spatial and structu-ral): The complexity of the compo-nents and their interactions.
Cognitive FactorsE.g., cognitive load theory, program comprehension
theories
Coherence: Adherence to and application of standards, practices and idioms.
Project FactorsE.g., tools
Software FactorsPeople Factors
Programming skills/experience:Degree of knowledge/skills/experi-ence in the domain of programming.
Fig. 1. Factors affecting the ease of program comprehension.
reduce the need for comments [20].The remainder of the paper is roughly organized as pro-
posed in common guidelines for empirical studies [24, 55],but has been slightly adapted for clarity of presentation. Inthe next section, we briefly review related work. In Section 3,we outline our research questions. The details of experimentplanning and execution are described in Section 4 and Sec-tion 5, respectively. Before a detailed analysis and discussionin Section 7, we give a brief overview over the raw datain Section 6. Threats to validity are discussed in Section 8.Lessons learned, conclusions and future work are presentedin Section 9 and Section 10, respectively.
2 RELATED WORK
There is a large body of knowledge on methods, languagesand tools to support program comprehension [49]. Althoughreadability and comprehensibility are related, they are con-ceptually quite different. Readability is required for compre-hensibility, but readability does not necessarily imply com-prehensibility. That makes it difficult to measure readabilityobjectively and independently of comprehensibility.
Smith and Taffler point out that in text readability studiescomprehension is frequently used erroneously as a proxyfor readability and that comprehension also is related tofactors like context, education and experience [47]. In ourwork, we consider readability as a property of the code andcomprehension as a characteristic of the reader. Klare pointsout though, that there is a strong relationship betweentext readability (as measured by readability formulas) andcomprehension as well as reading speed [31]. Since readingspeed can vary significantly between individuals, it needsto be calibrated carefully.
DuBay [13] defines readability as “what makes sometexts easier to read than others. It is often confused withlegibility, which concerns typeface and layout”. Hargis [23]emphasizes that “[r]eadability depends on things that affectthe readers’ eyes and minds. Type size, type style, and lead-ing affect the eye. Sentence structure and length, vocabulary,and organization affect the mind.”
The focus of the present study is on the latter, inherentproperties of the code, and we ignore legibility issues.Although, for example code coloring, can make code easierto read or understand, there are differences in readabilityand comprehensibility that cannot be alleviated by “thingsthat affect the readers’ eyes”. While most editors havesupport for the handling of legibility issues like fonts andindentation, inherent code properties that affect readabilityand comprehension cannot be easily resolved using editors.
In the following subsections, we give a brief overviewover the research that is related to the present study. Sub-section 2.1 primarily focuses on recent studies on softwarereadability. Subsections 2.2 and 2.3 discuss related researchon method chains and source code comments, respectively.
2.1 Software Readability and Comprehension
Readability has long been recognized as an important factorin software development [11, 14, 32]. A recent study at Mi-crosoft showed that poor readability was ranked as the mostimportant reason for initiating refactorings and improvedreadability the highest ranked benefit from refactoring [29].
There is only little research on measuring software read-ability [4, 5, 7]. Buse and Weimer proposed a measure forsoftware readability based on the ratings of perceived read-ability of 120 students on 100 small code snippets in Java[7]. The code snippets were taken, as is, from 5 Open Sourceprojects and are 4–11 lines in length, including comments.Indentation and white-space was not adjusted and snippetscould comprise incomplete conditionals. A predictor wasbuilt using 25 features of those snippets, where the fol-lowing features per line of code had the highest predictivepower for readability (in decreasing order): average num-ber of identifiers, average line length, average number ofparentheses, maximum line length, and average number of‘.’. The readability measure shows strong correlations withquality indicators like bugs indicated by FindBugs on 15Open Source Java projects.
Posnett et al. [44] found several weaknesses in Buse andWeimer’s model, most importantly that it does not scalewell and that most of the variation could be explained by

0098-5589 (c) 2015 IEEE. Translations and content mining are permitted for academic research only. Personal use is also permitted, but republication/redistribution requires IEEE permission. Seehttp://www.ieee.org/publications_standards/publications/rights/index.html for more information.
This article has been accepted for publication in a future issue of this journal, but has not been fully edited. Content may change prior to final publication. Citation information: DOI 10.1109/TSE.2016.2527791, IEEETransactions on Software Engineering
TRANSACTIONS ON SOFTWARE ENGINEERING, VOL. V, NO. N, MONTH 20YY 3
snippet size. They proposed a simpler readability modelfor Buse and Weimer’s dataset using 3 variables only; Hal-stead’s Volume, lines of code, and token entropy.
Several studies have investigated identifier naming is-sues, e.g., [3, 8, 34]. We acknowledge that naming is animportant factor for software readability and comprehen-sion. In the present study, we focus on two additionalimportant factors; comments and method chains. It shouldbe noted that we do not aim at a general readability modellike Posnett et al. or Buse and Weimer. A good overviewover program comprehension models and early programcomprehension experiments can be found in [12, 54].
2.2 Method ChainsMethod chaining is an object-oriented programming style[18, Ch. 35]. A method that returns an object can be used asthe source for another method call, as in the general examplebelow.o b j e c t . method1 ( . . . ) . method2 ( . . . ) . method3 ( ) ;
Method chaining has been advocated as a good pro-gramming style [18, 28] and is used frequently to supportmore compact code as in the following examples./∗ ( 1 ) Method c h a i n with i d e n t i c a l method c a l l s . ∗ /S t r i n g B u f f e r sb = new S t r i n g B u f f e r ( . . . ) ;sb . append ( ’ ’ Hello ’ ’ ) . append ( aNameString ) . append ( ’ ’ ! ’ ’ ) ;
/∗ ( 2 ) A l l method c a l l s r e t u r n t h e same t y p e . ∗ /Scanner reader = new Scanner ( . . . ) ;S t r i n g inputLine = reader . nextLine ( ) . tr im ( ) . toLowerCase ( ) ;
/∗ ( 3 ) Unc l ear r e t u r n t y p e s . ∗ //∗ Might v i o l a t e t h e Law o f Demeter . ∗ /i f ( scanner . recordLineSeparator ) {
compilat ionUnit . compi la t ionResul t . l i n e S e p a r a t o r P o s i t i o n s= scanner . getLineEnds ( ) ;
}
This can be intuitive when methods are chained in asystematic and predictable way, as in examples (1) and(2) above or so-called fluent interfaces [28]. If methods arechained ad hoc, as in example (3), method chaining mightlead to less intuitive code and also to violations of the Law ofDemeter (LoD) [36]. In short, the LoD requires that a clientobject must only send messages to objects that are in itsimmediate scope, which enforces information hiding andmakes all coupling explicit.
Guo et al. show that violations of the LoD lead to moredefects [21]2. Guo et al.’s study also shows that violationsof the LoD are very common in the Eclipse plugins theyevaluated. Marinescu and Marinescu show that clients ofclasses that exhibit design flaws are more fault-prone [37].Thus, some forms of method chaining are more fault-proneand might be more difficult to understand.
2.3 CommentsSource code comments are highlighted in many codingguidelines as an important tool for program comprehension[1, 38]. There are, however, few empirical studies on the ef-fects of source code comments on program comprehension.Furthermore, most of these studies are more than 20 yearsold.
2. Example code (3) is a simplified version of a violation of LoD inthe JDT core presented in [21].
Experimental studies from the 1980s show that the effectof source code comments on comprehension interacts withprogram decomposition and program indentation. Higherdegrees of decomposition decreased the effects of com-menting on program comprehension [52, 56]. Experimentsby Norcio, revealed the best comprehension results for in-dented programs with single lines of comments interspersedwith the code [40].
In a more recent experiment, Takang et al. showed thatcomments significantly improved program comprehensionindependently of the identifier naming style used (fullvs. abbreviated names) [51]. This experiment also showedthat full name identifiers were perceived as significantlymore meaningful. There were no significant differences,though, in the comprehension of the programs with fulland abbreviated names, respectively. The authors surmisethat the programs used in the experiment might have beentoo familiar and the time given too long to give significantresults in the test scores.
In another study, Nurvitadhi et al. investigated the utilityof class and method comments in Java [41]. Compared toa program without any comments, method comments im-proved comprehension significantly, but class comments didnot. Thus, as for method chains, some forms of commentsmight be more helpful for code comprehension than others.
3 RESEARCH QUESTIONS
In the present study we investigate in which ways com-menting and method chaining affect software readabilityand comprehension.
RQ1: How does the amount and quality of source codecomments affect software readability and comprehension?
RQ2: How does method chaining affect software read-ability and comprehension?
4 EXPERIMENT PLANNING
In the following, we describe the subjects, materials, tasks,dependent and independent variables, as well as the exper-iment design. We deliberately did not only measure codecomprehension through readability scores by the subjects.We wanted to get an understanding of what the subjectshave understood from the code. Therefore, we also usedopen questions where subjects had to summarize their codeunderstanding as well as cloze questions where studentshad to recall the code to fill in gaps (see Section 4.2.2 andSection 4.3.).
4.1 SubjectsThe subjects were first and second year Computer Sciencestudents from Heidelberg University. The first year studentsparticipated in a course (with tutorials) covering a generalintroduction to programming and C++ in particular. Thesecond year students participated in a course (with tutorials)covering a general introduction to software engineeringwhich included a crash course in Java at the beginning. Atthe end of their courses, both groups got as a homeworkexercise to participate in the experiment and to reflect onthe experiences with it. The students had to successfullycomplete 50% of all homework exercises. As this was at

0098-5589 (c) 2015 IEEE. Translations and content mining are permitted for academic research only. Personal use is also permitted, but republication/redistribution requires IEEE permission. Seehttp://www.ieee.org/publications_standards/publications/rights/index.html for more information.
This article has been accepted for publication in a future issue of this journal, but has not been fully edited. Content may change prior to final publication. Citation information: DOI 10.1109/TSE.2016.2527791, IEEETransactions on Software Engineering
TRANSACTIONS ON SOFTWARE ENGINEERING, VOL. V, NO. N, MONTH 20YY 4
the end of the course, only very few students really neededto complete this homework to reach this threshold. Thus,they were encouraged by specific emails to participate.Participation was therefore mainly voluntarily.
It should be noted that 42.3% of the students declaredthat they have high or very high practical experience fromother languages than Java or C++. Furthermore, 19.2% of thestudents declared practical experience (medium–very high)as a professional programmer (see Fig. 13 in Appendix C).
4.2 Materials
The following subsections describe the code snippets, com-prehension questions, and other questions used in thepresent experiment. The full set of experiment materials canbe downloaded from http://www.bth.se/com/jub.nsf. Thekey characteristics of the used code snippets are summa-rized in Table 1.
4.2.1 Code SnippetsThe code snippets used in the experiment should be as real-istic as possible, but still sufficiently general, representativeand simple. The subjects should not need specific domainor application knowledge to understand them. To increasegeneralizability, we strived for code snippets that differ intheir expression of comments and method chains, as well asin overall length and complexity. The code snippets shouldalso vary in terms of existing readability measures (e.g.,[44]). We therefore mined public Java projects for actualexamples that we then adapted in the following way to suitthe experiment context:
• Delete complex syntactical structures that are irrelevantfor those parts of the code that are studied, e.g., innerclasses or try/catch blocks.
• Replace unnecessarily cryptic identifiers by more in-tuitive and shorter ones. However, we tried to retaineven lengthy names to avoid the breaking of namingpatterns.
• Use camelCase-style for all identifiers.• Remove all comments, except strategic comments3.• Introduce line breaks to keep line lengths below 80.• Format all code according to the same style (K&R-style
[27]).Thus, we tried to minimize the influence of factors dif-
ferent from method chains and comments, such as namingstyle, line length or indentation. In contrast to the studyof Buse and Weimer [7], we strived for self-contained codesnippets (complete methods) with consistent formattingand indentation. We wanted to ensure that the snippetsare readable as such to be able to isolate the influenceof method chains and comments. Table 1 summarizes thekey characteristics of code snippets S1–S5. An example ofa code snippet and some of its variants can be found inAppendix A. As can be seen, the snippets vary in lengthand complexity as well as in the number of method chainsand comments.
Each of the code snippets was then modified in a system-atic way according to our experiment factors; method chains
3. A strategic comment describes the purpose of a piece of code andis placed before this code.
and comments. Regarding method chains, we developedfollowing variants:
1) MC (method chains): An original (adapted) method con-taining at least one method chain with 3 or moreelements.
2) NoMC (no method chains): A variant of the original asabove, but with all method chains resolved. Methodchains with more than 2 elements were broken up intoseveral statements. If necessary, temporary variableswere introduced. Existing variables were used wherepossible.
Regarding comments, we developed the following variants:
1) GC (good comments): An original (adapted) method withuseful strategic comments that give additional informa-tion beyond the actual code it explains.
/∗ Add a l l a v a i l a b l e a n a l y s i s d a t a ( s u b l i n e s ) . ∗ /for ( SublineNode subl ine : move . ge tSubl ines ( ) ) { . . . }
2) BC (bad comments): A variant of the original as above,but with all source code comments replaced by com-ments that just repeat what the code does withoutexplaining its purpose.
/∗ Add s u b l i n e s . ∗ /for ( SublineNode subl ine : move . ge tSubl ines ( ) ) { . . . }
3) NC (no comments): A variant of the original as above,but with all source code comments removed.
In all variants we retained the comments preceding themethod header to convey the general purpose of the codeof a snippet in the same way. Considering all combina-tions, we had 6 variants per snippet and thus 30 differentsnippets altogether. A comprehensive summary of measuresand properties for all variants can be found in Table 6 inAppendix B.
4.2.2 Comprehension Questions
For each code snippet, we developed cloze tests to measurecomprehension. In a cloze test certain parts of the text (codein our case) are blanked out and the subject has to fillin the blanks with suitable code, but not necessarily theoriginal code. In contrast to free-form descriptions of thecode content (which we also asked from the subjects), clozetests allow a more standardized way of testing compre-hension. If a subject has understood the overall purpose,behavior and flow of the code, it will be easier to provide ananswer that is syntactically and semantically correct. Thisis, of course, easier than recalling the code or its structureverbatim. Such tests have long been used successfully in textcomprehension tests and have also been shown applicablein tests of program comprehension [10, 22, 40].
In each code snippet, we blanked out the code thatdealt with method chains (in the MC versions) and thecode replacing the method chains (in the NoMC version),respectively. To make it difficult for the subjects to identifypatterns in the blanked out parts of the code, we alsoblanked out unrelated code in some snippets. This resultedin 2–6 “gaps” for our snippets, depending on the complexityand number of method chains that were present in theparticular snippet. An example of the gap placement for S1is shown in Appendix A.
0098-5589 (c) 2015 IEEE. Translations and content mining are permitted for academic research only. Personal use is also permitted, but republication/redistribution requires IEEE permission. Seehttp://www.ieee.org/publications_standards/publications/rights/index.html for more information.
This article has been accepted for publication in a future issue of this journal, but has not been fully edited. Content may change prior to final publication. Citation information: DOI 10.1109/TSE.2016.2527791, IEEETransactions on Software Engineering
TRANSACTIONS ON SOFTWARE ENGINEERING, VOL. V, NO. N, MONTH 20YY 5
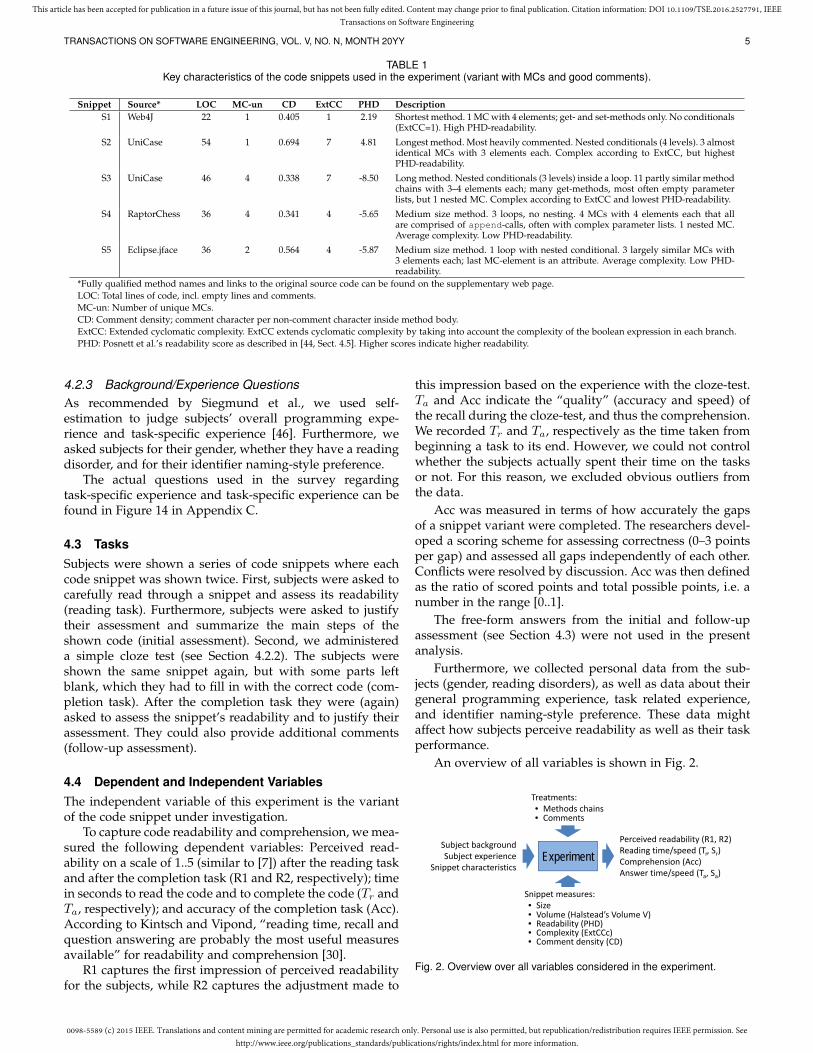
TABLE 1Key characteristics of the code snippets used in the experiment (variant with MCs and good comments).
Snippet Source* LOC MC-un CD ExtCC PHD DescriptionS1 Web4J 22 1 0.405 1 2.19 Shortest method. 1 MC with 4 elements; get- and set-methods only. No conditionals
(ExtCC=1). High PHD-readability.
S2 UniCase 54 1 0.694 7 4.81 Longest method. Most heavily commented. Nested conditionals (4 levels). 3 almostidentical MCs with 3 elements each. Complex according to ExtCC, but highestPHD-readability.
S3 UniCase 46 4 0.338 7 -8.50 Long method. Nested conditionals (3 levels) inside a loop. 11 partly similar methodchains with 3–4 elements each; many get-methods, most often empty parameterlists, but 1 nested MC. Complex according to ExtCC and lowest PHD-readability.
S4 RaptorChess 36 4 0.341 4 -5.65 Medium size method. 3 loops, no nesting. 4 MCs with 4 elements each that allare comprised of append-calls, often with complex parameter lists. 1 nested MC.Average complexity. Low PHD-readability.
S5 Eclipse.jface 36 2 0.564 4 -5.87 Medium size method. 1 loop with nested conditional. 3 largely similar MCs with3 elements each; last MC-element is an attribute. Average complexity. Low PHD-readability.
*Fully qualified method names and links to the original source code can be found on the supplementary web page.LOC: Total lines of code, incl. empty lines and comments.MC-un: Number of unique MCs.CD: Comment density; comment character per non-comment character inside method body.ExtCC: Extended cyclomatic complexity. ExtCC extends cyclomatic complexity by taking into account the complexity of the boolean expression in each branch.PHD: Posnett et al.’s readability score as described in [44, Sect. 4.5]. Higher scores indicate higher readability.
4.2.3 Background/Experience QuestionsAs recommended by Siegmund et al., we used self-estimation to judge subjects’ overall programming expe-rience and task-specific experience [46]. Furthermore, weasked subjects for their gender, whether they have a readingdisorder, and for their identifier naming-style preference.
The actual questions used in the survey regardingtask-specific experience and task-specific experience can befound in Figure 14 in Appendix C.
4.3 TasksSubjects were shown a series of code snippets where eachcode snippet was shown twice. First, subjects were asked tocarefully read through a snippet and assess its readability(reading task). Furthermore, subjects were asked to justifytheir assessment and summarize the main steps of theshown code (initial assessment). Second, we administereda simple cloze test (see Section 4.2.2). The subjects wereshown the same snippet again, but with some parts leftblank, which they had to fill in with the correct code (com-pletion task). After the completion task they were (again)asked to assess the snippet’s readability and to justify theirassessment. They could also provide additional comments(follow-up assessment).
4.4 Dependent and Independent VariablesThe independent variable of this experiment is the variantof the code snippet under investigation.
To capture code readability and comprehension, we mea-sured the following dependent variables: Perceived read-ability on a scale of 1..5 (similar to [7]) after the reading taskand after the completion task (R1 and R2, respectively); timein seconds to read the code and to complete the code (Tr andTa, respectively); and accuracy of the completion task (Acc).According to Kintsch and Vipond, “reading time, recall andquestion answering are probably the most useful measuresavailable” for readability and comprehension [30].
R1 captures the first impression of perceived readabilityfor the subjects, while R2 captures the adjustment made to
this impression based on the experience with the cloze-test.Ta and Acc indicate the “quality” (accuracy and speed) ofthe recall during the cloze-test, and thus the comprehension.We recorded Tr and Ta, respectively as the time taken frombeginning a task to its end. However, we could not controlwhether the subjects actually spent their time on the tasksor not. For this reason, we excluded obvious outliers fromthe data.
Acc was measured in terms of how accurately the gapsof a snippet variant were completed. The researchers devel-oped a scoring scheme for assessing correctness (0–3 pointsper gap) and assessed all gaps independently of each other.Conflicts were resolved by discussion. Acc was then definedas the ratio of scored points and total possible points, i.e. anumber in the range [0..1].
The free-form answers from the initial and follow-upassessment (see Section 4.3) were not used in the presentanalysis.
Furthermore, we collected personal data from the sub-jects (gender, reading disorders), as well as data about theirgeneral programming experience, task related experience,and identifier naming-style preference. These data mightaffect how subjects perceive readability as well as their taskperformance.
An overview of all variables is shown in Fig. 2.
ExperimentSubject backgroundSubject experience
Snippet characteristics
Perceived readability (R1, R2)Reading time/speed (Tr, Sr)Comprehension (Acc)Answer time/speed (Ta, Sa)
Treatments:• Methods chains• Comments
Snippet measures:• Size• Volume (Halstead’s Volume V)• Readability (PHD)• Complexity (ExtCCc)• Comment density (CD)
Fig. 2. Overview over all variables considered in the experiment.

0098-5589 (c) 2015 IEEE. Translations and content mining are permitted for academic research only. Personal use is also permitted, but republication/redistribution requires IEEE permission. Seehttp://www.ieee.org/publications_standards/publications/rights/index.html for more information.
This article has been accepted for publication in a future issue of this journal, but has not been fully edited. Content may change prior to final publication. Citation information: DOI 10.1109/TSE.2016.2527791, IEEETransactions on Software Engineering
TRANSACTIONS ON SOFTWARE ENGINEERING, VOL. V, NO. N, MONTH 20YY 6
4.5 Design
Our experiment investigates 2 factors (method chains andsource code comments), with 2 and 3 treatments, respec-tively.
Variants of code snippets were developed as outlined inSection 4.2.1.
We used a 2x3 factorial design with blocking. To mitigateordering effects subjects were randomly assigned to one ofsix predefined snippet sequences. In each sequence, all snip-pets S1–S5 were shown in the same order, but in differentvariants. No variant was shown twice in any sequence. Thesequences are shown in Table 2. The variants for methodchains and comments are numbered from 1 to 2 and 1 to 3,respectively. Thus, Si_m:c describes the variant from snippetSi using method chain variant m and comment variant c (seealso Section 4.2.1).
Subjects were randomly assigned to one of six prede-fined snippet sequences to ensure that all subjects see eachsnippet and each variant exactly once.
TABLE 2Snippet sequences used in the experiment.
SnippetSequence S1 S2 S3 S4 S5
Seq 1 S1_1:1 S2_2:2 S3_1:3 S4_1:2 S5_2:3Seq 2 S1_1:2 S2_2:3 S3_1:1 S4_1:3 S5_2:1Seq 3 S1_1:3 S2_2:1 S3_1:2 S4_1:1 S5_2:2Seq 4 S1_2:1 S2_1:2 S3_2:3 S4_2:2 S5_1:3Seq 5 S1_2:2 S2_1:3 S3_2:1 S4_2:3 S5_1:1Seq 6 S1_2:3 S2_1:1 S3_2:2 S4_2:1 S5_1:2
Si_m:c – i:snippet no; m:1=MC,2=NoMC; c:1=GC,2=BC,3=NC.See Sect. 4.2.1 for an explanation of the acronyms.
4.6 Piloting
Initially, we used six snippets with 36 variants in total. Aftera pilot study, we removed one snippet to cut down theexpected total time for the experiment to at most 45 minutes,so that the experiment could be run within a traditionallecture.
5 EXPERIMENT EXECUTION
The experiment was administered as an on-line question-naire and instrumented using LimeService4, see Fig. 3 for anoverview. The questions regarding task-related experienceand identifier naming-style preference were placed after theexperimental tasks, since they might have influenced thesubjects’ answers.
LimeSurvey was also used for time-logging. For eachsubject we logged the time for each reading task and eachcompletion task. The students were informed about thetime-logging and that their answers and timing data “willonly be used to study the readability and comprehensibilityof code and not to assess your performance.”
To mitigate fatigue effects and to make the time mea-surements more reliable, students were instructed to pauseonly at pre-defined breakpoints. They were also instructedthat they cannot go back in the questionnaire and that they
4. http://www.limeservice.com.
Experiment overviewExperiment overview
Welcome screen
Personal background and overall
programming experience
Task-related experience
Thank you/ feedback
Reading task
Completion task
Initial assessment
Follow-up assessment
Pause
For each snippet S1–S5
Fig. 3. Overview over the on-line questionnaire. Timing data was takenfor each of the “boxes”.
should “not take notes or copy the code snippets (manuallyor electronically), otherwise your answers would be uselessfor the study”.
The instructions and full set of questions can be down-loaded from http://www.bth.se/com/jub.nsf.
6 RESULTS
Overall, 255 subjects started the survey and 110 (43.1%)successfully completed it. Of those, we deleted 6 outliers,i.e. subjects with extremely short times for code reading andquestions answering. The remaining 104 subjects provided520 datapoints in total; 104 per snippet and between 14 and23 for each individual snippet variant5. The median timefor these 104 subjects for completing the survey was 48.5minutes (including pauses). For the present analysis, weonly included the data from those 104 subjects.
87
17
0
20
40
60
80
100
Gender
male female 36 37
16
96
0
10
20
30
40
Naming style pref
cC strongcCneutralu_su_s strong
28
56
29 27
47
21
0
10
20
30
40
50
60
Overall progrexp
Overall task‐specific exp
lowmediumhigh
Fig. 4. Gender, naming preference (cC=camelCase style,u_s=under_score style) and overall experience levels (programmingand task-specific) for the subjects (in absolute numbers for all 104subjects).
Fig. 4 gives an overview over the subjects’ demograph-ics. The data shows that the majority of subjects is male(83.7%) and that the majority of subjects have a preferencefor camelCase-style format (70.2%). In general, subjects havea high overall programming experience (43.3%), but a lowoverall task-specific experience (53.8%).6 Only 3 subjects(2.9%) declared a reading disorder. Since their data wereno outliers, we included them in the analysis.
5. The imbalance of datapoints per snippet variant is due to an over-representation of a specific snippet series among the excluded subjects.
6. Overall programming experience is aggregated from the subjects’responses regarding experience levels in Java, C++, and Other program-ming languages. Overall task-specific experience is aggregated fromthe subjects’ responses regarding knowledge/experience in OOD, LoD,refactoring and plug-in programming in Eclipse, see Appendix C fordetails.

0098-5589 (c) 2015 IEEE. Translations and content mining are permitted for academic research only. Personal use is also permitted, but republication/redistribution requires IEEE permission. Seehttp://www.ieee.org/publications_standards/publications/rights/index.html for more information.
This article has been accepted for publication in a future issue of this journal, but has not been fully edited. Content may change prior to final publication. Citation information: DOI 10.1109/TSE.2016.2527791, IEEETransactions on Software Engineering
TRANSACTIONS ON SOFTWARE ENGINEERING, VOL. V, NO. N, MONTH 20YY 7
TABLE 3Perceived readability (R1, R2), timing data (Tr, Ta, Sr, Sa) and answer
accuracy (Acc) for all snippets.
Snippet N R1 R2 Tr Ta Acc Sr Sa
S1_1:1 16 2.81 2.38 79.11 135.25 0.40 8.30 4.86S1_1:2 23 2.74 2.70 70.73 101.92 0.38 8.75 6.07S1_1:3 14 2.71 2.57 82.21 81.02 0.38 6.35 6.44S1_2:1 15 2.60 2.27 88.14 92.13 0.27 8.10 7.75S1_2:2 21 3.00 2.71 101.62 108.17 0.41 6.65 6.25S1_2:3 15 2.47 2.20 84.41 104.28 0.33 6.86 5.55S2_1:1 15 2.60 2.53 183.55 113.67 0.50 7.77 12.55S2_1:2 15 2.60 2.47 153.24 89.51 0.61 8.14 13.93S2_1:3 21 2.29 2.24 113.28 80.97 0.65 8.08 11.30S2_2:1 14 2.43 2.57 187.26 140.11 0.52 7.99 10.68S2_2:2 16 2.00 1.94 120.97 206.93 0.51 10.89 6.36S2_2:3 23 2.35 2.26 153.01 104.24 0.53 6.44 9.45S3_1:1 23 3.35 3.00 136.66 87.09 0.48 8.56 13.43S3_1:2 14 2.64 2.29 124.64 104.80 0.41 9.47 11.26S3_1:3 16 2.25 2.25 153.84 91.50 0.46 5.86 9.85S3_2:1 21 3.00 2.86 179.61 106.91 0.40 6.32 10.62S3_2:2 15 2.33 1.87 79.05 141.04 0.37 14.48 8.12S3_2:3 15 2.73 2.33 54.63 85.83 0.28 15.85 10.09S4_1:1 14 2.79 2.29 143.10 67.07 0.37 6.32 13.48S4_1:2 16 2.94 2.69 119.32 60.22 0.49 6.65 13.17S4_1:3 23 2.30 2.09 98.62 55.68 0.43 7.31 12.95S4_2:1 15 2.93 2.87 145.29 84.36 0.37 6.86 11.81S4_2:2 15 3.00 2.80 72.49 50.74 0.44 12.21 17.44S4_2:3 21 2.67 2.48 140.08 62.29 0.52 5.80 13.05S5_1:1 21 3.38 3.38 114.36 71.54 0.47 8.00 12.79S5_1:2 15 2.40 2.60 113.77 73.08 0.37 7.62 11.86S5_1:3 15 2.93 3.00 74.18 45.27 0.28 9.32 15.26S5_2:1 23 3.13 3.00 130.16 75.75 0.53 7.44 12.79S5_2:2 14 2.93 2.57 118.97 92.26 0.39 7.74 9.98S5_2:3 16 2.75 2.56 116.50 79.42 0.46 6.40 9.38
ALL 520 2.72 2.54 108.32 88.76 0.44 8.22 10.62N: Number of datapoints (subjects).R1,R2: Average perceived readability after the reading and completion task.Tr, Ta: Median snippet reading and answering time in seconds.Acc: Average answer accuracy in %.Sr, Sa: Median reading and answering speed in characters per second.
Table 3 summarizes the data for perceived readability(R1, R2), timing data (Tr, Ta, Sr, Sa) and answer accuracy(Acc) for all 30 code snippet variants. The raw data for allcompleted answers can be downloaded from http://www.bth.se/com/jub.nsf.
7 ANALYSIS AND DISCUSSION
In the following, we first describe some preliminaries onhow we analyzed the results. Then we discuss the majorresults with respect to the overall influence of method chainsand code comments, of subject characteristics and of thesnippets on perceived readability and comprehension. Wealso discuss the relationships between different experimentvariables and go into detail on different subject groups andsnippet variants in subsections. A summary of all relation-ships found in the present experiment is shown in Fig. 5.
Perceived readability (R1, R2) was measured on a scalefrom very difficult to very easy, i.e. these data are ordinal.Subjects were asked to rate snippet readability based ontheir own programming experience. Absolute individualscores are therefore less relevant than relative differences.Differences in perceived readability between groups of sub-jects or snippets/snippet variants were tested using Chi-Square tests (χ2).
R1
Size Acc
Tr
PHD V
Legend:significant correlation at α < 0.01significant correlation at α < 0.001
Neg negative correlation
ExtCCc
CD
NegComment variant
Legend:significant differences at α < 0.01significant differences at α < 0.001
Overall programmingexperienceTask-specificexperienceNaming preference
Fig. 5. Summary of relationships between experiment variables.
Stacked bar charts as in Figures 6 and 7 are used tovisualize the distribution of actual scores of R1. Each barrepresents a total (100%) and each part shows the proportionof scores in a category. Each bar is centered at 0% whichmakes it easier to compare the relative perceived readabilityof a total.
Since R1 and R2 are strongly and significantly relatedaccording to Spearman’s rank correlation (ρ = 0.848;α <0.0001), we ignore R2 in our further analysis
Method chains and comments. Regarding RQ2, our datadoes not show any significant differences in the perceivedreadability (R1) for the MC variants. Regarding RQ1, thereare significant differences between the comment variants(χ2 = 16.1;α = 0.003). Code snippets with good comments(GC) are perceived as the most readable and the variantswithout comments (NC) are perceived as the least readable.The Acc means for the MC and comment variants are allbetween 0.43 and 0.45. All differences are insignificant (seeFig. 6).
Fig. 6. Distribution of scores for perceived readability (R1) for methodchain variants (MC/NoMC) and comment variants (GC/BC/NC). Thenumbers in the middle show the number of datapoints for each variant.The numbers in the two columns to the right show the average perceivedreadability (R1, left column) and the average answer accuracy (Acc,rightmost column).
Subject characteristics. When looking at different sub-ject groups (see Fig. 7), we can identify differences in per-ceived readability for several subject groups. For example,there is a significant relationship between overall program-ming experience and R1 (χ2 = 19.7;α = 0.001) as well asbetween task-specific experience and R1 (χ2 = 29.7;α <0.0001). ANOVA tests show that also the means for Accare significantly higher for the groups with high overallprogramming and high task-specific experience (α < 0.01).
Regarding naming preferences, our data shows a sig-nificant difference in R1 between the subject group thathas a naming preference and the groups that have none(χ2 = 9.55;α = 0.008). The difference between the two pref-erence groups (camelCase-style versus under_score-style) is
0098-5589 (c) 2015 IEEE. Translations and content mining are permitted for academic research only. Personal use is also permitted, but republication/redistribution requires IEEE permission. Seehttp://www.ieee.org/publications_standards/publications/rights/index.html for more information.
This article has been accepted for publication in a future issue of this journal, but has not been fully edited. Content may change prior to final publication. Citation information: DOI 10.1109/TSE.2016.2527791, IEEETransactions on Software Engineering
TRANSACTIONS ON SOFTWARE ENGINEERING, VOL. V, NO. N, MONTH 20YY 8
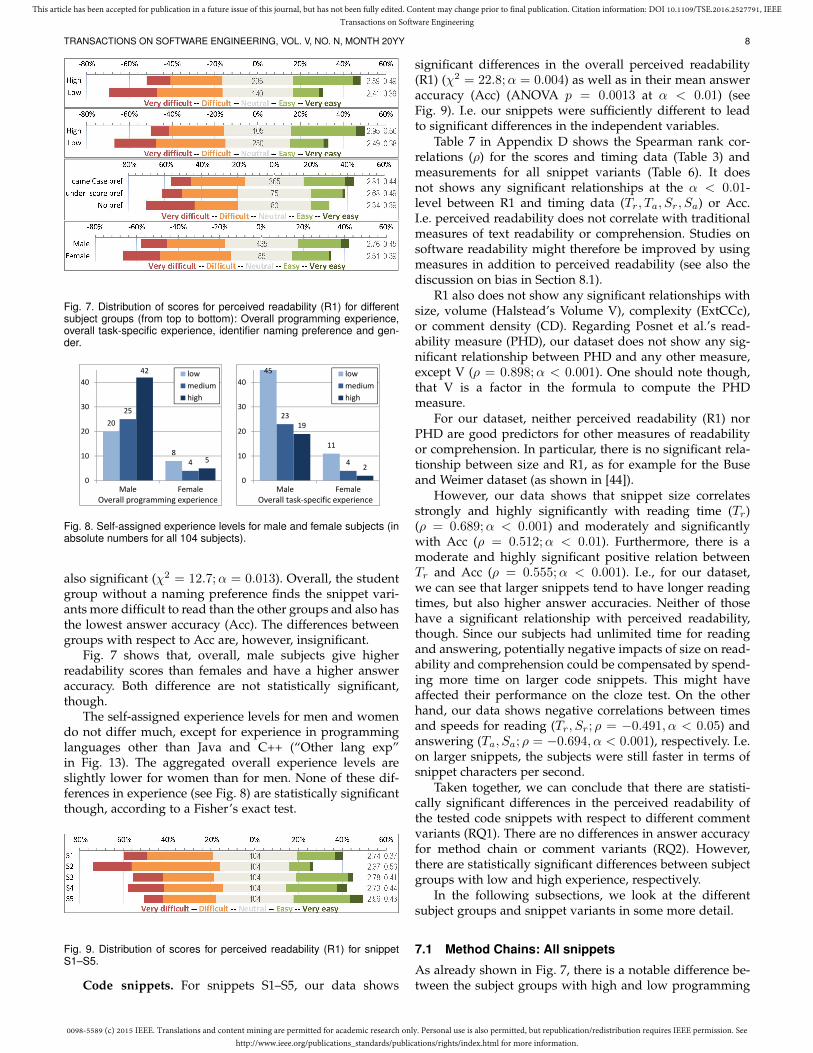
Fig. 7. Distribution of scores for perceived readability (R1) for differentsubject groups (from top to bottom): Overall programming experience,overall task-specific experience, identifier naming preference and gen-der.
Gender Naming style pref
20
8
25
4
42
5
0
10
20
30
40
Male Female
lowmediumhigh
Overall programming experience
45
11
23
4
19
2
0
10
20
30
40
Male Female
lowmediumhigh
Overall task‐specific experience
exp specific exp
Fig. 8. Self-assigned experience levels for male and female subjects (inabsolute numbers for all 104 subjects).
also significant (χ2 = 12.7;α = 0.013). Overall, the studentgroup without a naming preference finds the snippet vari-ants more difficult to read than the other groups and also hasthe lowest answer accuracy (Acc). The differences betweengroups with respect to Acc are, however, insignificant.
Fig. 7 shows that, overall, male subjects give higherreadability scores than females and have a higher answeraccuracy. Both difference are not statistically significant,though.
The self-assigned experience levels for men and womendo not differ much, except for experience in programminglanguages other than Java and C++ (“Other lang exp”in Fig. 13). The aggregated overall experience levels areslightly lower for women than for men. None of these dif-ferences in experience (see Fig. 8) are statistically significantthough, according to a Fisher’s exact test.
Fig. 9. Distribution of scores for perceived readability (R1) for snippetS1–S5.
Code snippets. For snippets S1–S5, our data shows
significant differences in the overall perceived readability(R1) (χ2 = 22.8;α = 0.004) as well as in their mean answeraccuracy (Acc) (ANOVA p = 0.0013 at α < 0.01) (seeFig. 9). I.e. our snippets were sufficiently different to leadto significant differences in the independent variables.
Table 7 in Appendix D shows the Spearman rank cor-relations (ρ) for the scores and timing data (Table 3) andmeasurements for all snippet variants (Table 6). It doesnot shows any significant relationships at the α < 0.01-level between R1 and timing data (Tr, Ta, Sr, Sa) or Acc.I.e. perceived readability does not correlate with traditionalmeasures of text readability or comprehension. Studies onsoftware readability might therefore be improved by usingmeasures in addition to perceived readability (see also thediscussion on bias in Section 8.1).
R1 also does not show any significant relationships withsize, volume (Halstead’s Volume V), complexity (ExtCCc),or comment density (CD). Regarding Posnet et al.’s read-ability measure (PHD), our dataset does not show any sig-nificant relationship between PHD and any other measure,except V (ρ = 0.898;α < 0.001). One should note though,that V is a factor in the formula to compute the PHDmeasure.
For our dataset, neither perceived readability (R1) norPHD are good predictors for other measures of readabilityor comprehension. In particular, there is no significant rela-tionship between size and R1, as for example for the Buseand Weimer dataset (as shown in [44]).
However, our data shows that snippet size correlatesstrongly and highly significantly with reading time (Tr)(ρ = 0.689;α < 0.001) and moderately and significantlywith Acc (ρ = 0.512;α < 0.01). Furthermore, there is amoderate and highly significant positive relation betweenTr and Acc (ρ = 0.555;α < 0.001). I.e., for our dataset,we can see that larger snippets tend to have longer readingtimes, but also higher answer accuracies. Neither of thosehave a significant relationship with perceived readability,though. Since our subjects had unlimited time for readingand answering, potentially negative impacts of size on read-ability and comprehension could be compensated by spend-ing more time on larger code snippets. This might haveaffected their performance on the cloze test. On the otherhand, our data shows negative correlations between timesand speeds for reading (Tr, Sr; ρ = −0.491, α < 0.05) andanswering (Ta, Sa; ρ = −0.694, α < 0.001), respectively. I.e.on larger snippets, the subjects were still faster in terms ofsnippet characters per second.
Taken together, we can conclude that there are statisti-cally significant differences in the perceived readability ofthe tested code snippets with respect to different commentvariants (RQ1). There are no differences in answer accuracyfor method chain or comment variants (RQ2). However,there are statistically significant differences between subjectgroups with low and high experience, respectively.
In the following subsections, we look at the differentsubject groups and snippet variants in some more detail.
7.1 Method Chains: All snippets
As already shown in Fig. 7, there is a notable difference be-tween the subject groups with high and low programming

0098-5589 (c) 2015 IEEE. Translations and content mining are permitted for academic research only. Personal use is also permitted, but republication/redistribution requires IEEE permission. Seehttp://www.ieee.org/publications_standards/publications/rights/index.html for more information.
This article has been accepted for publication in a future issue of this journal, but has not been fully edited. Content may change prior to final publication. Citation information: DOI 10.1109/TSE.2016.2527791, IEEETransactions on Software Engineering
TRANSACTIONS ON SOFTWARE ENGINEERING, VOL. V, NO. N, MONTH 20YY 9
TABLE 4Differences in R1 and Acc between subject groups with low and high experience for the snippets’ MC variants.
Snippet All subjects High exp groups* Low exp groups* CommentS1 Similar R1 for MC and
NoMC. Slightly higherAcc for MC.
Inconsistent, but lessreadable variant hashigher Acc.
NoMC more readableand slightly higherAcc.
Most groups consider NoMC more readable. Slightlyhigher Acc for NoMC for most groups.
S2 MC more readable andhigher Acc.
MC more readable. In-consistent for Acc.
MC more readable andhigher Acc.
All groups consider MC more readable. Higher Acc forMC for all but the smallest group (high task-spec exp).
S3 MC more readable andhigher Acc.
Inconsistent. MC more readable andhigher Acc.
All but one group consider MC more readable. Higheror same Acc for MC for all groups.
S4 NoMC more readableand slightly higherAcc.
NoMC more readable,but lower Acc.
NoMC more readableand higher Acc.
All groups consider NoMC more readable. High andlow exp groups contradictory regarding Acc, but over-all slightly higher Acc for NoMC.
S5 Similar R1 for MC andNoMC. Higher Acc forNoMC.
NoMC more readableand higher Acc.
Inconsistent All groups, except the low task-specific exp groupconsider NoMC more readable. All but the low progrexp group have higher Acc for NoMC.
*There are two such groups: High/low programming experience and high/low task-specific experience, respectively.
Fig. 10. Distribution of scores for perceived readability (R1) for all snip-pets by MC variant, grouped by subject group experience level.
and task-specific experience, respectively. Subjects with highexperience rate the code snippets, overall, as more readablethan subjects with low experience and have higher Acc-values. Within an experience group the differences in R1and Acc are marginal. An ANCOVA analysis for Acc withoverall general and task-specific experience levels7, respec-tively, as covariates shows that the observed means for Accare almost identical to the adjusted means.
7.2 Method Chains: Individual snippets
When we break down Fig. 10 to the level of individualsnippets, we get larger differences for R1 and Acc withinsubject groups. These differences do not follow a consis-tent pattern for all snippets, though. Furthermore, none ofthe differences within an experience group is statisticallysignificant. This observation also holds when looking atthe method chain variants independently of the commentvariants.
A summary of the observations from breaking downthe analysis to snippet level and experience groups can befound in Table 4. As already indicated in Fig. 9, there areconsiderable differences between the snippets. For snippetsS2 and S3, the experiment results show an advantage forthe MC variants for R1 as well as for Acc. For snippets S1,S4 and S5, the results are almost the opposite. In large, thesnippet variants with higher R1 also have higher Acc.
From the available data it is not clear whether thesedifferences are related to specific properties of the actual
7. For the ANCOVA analysis, we used the weighted sums of thefirst six experience indicators in Fig. 13 for general experience and theremaining four for task-specific experience.
method chains in S2 and S3 on the one hand and in S1,S4 and S5 on the other. We can note though, that S3 is thesnippet with the most method chains and the only snippetwhere the NoMC variant is smaller than the MC variant.
The role of such properties should be studied in moredetail.
7.3 Comments: All snippets
Fig. 11. Distribution of scores for perceived readability (R1) for all snip-pets by comments variant grouped by subject group experience level.
For the comment variants, as for the MC variants, thereare notable difference between the groups with high andlow programming and task-specific experience, respectively(see Fig. 11). Contrary to the MC variants, we can see con-siderable differences within different experience groups. Ex-cept for the low programming experience group, all groupsperceive GC as most readable and NC as least readable.This challenges some earlier work on comments discussedin Section 2.3 and suggests that the role and quality ofcomments should be investigated in more detail.
For the low task-specific experience group, the differ-ences are significant (χ2 = 19.4;α = 0.0007). The differ-ences in Acc between experience groups as well as withinexperience groups are small.
An ANCOVA analysis (as for the method chains in Sec-tion 7.1) shows no significant differences in the Acc meansfor the different comment variants.
7.4 Comments: Individual snippetsWhen breaking down Fig. 11 to the level of individualsnippets, we get a more inconsistent picture. Table 5 on

0098-5589 (c) 2015 IEEE. Translations and content mining are permitted for academic research only. Personal use is also permitted, but republication/redistribution requires IEEE permission. Seehttp://www.ieee.org/publications_standards/publications/rights/index.html for more information.
This article has been accepted for publication in a future issue of this journal, but has not been fully edited. Content may change prior to final publication. Citation information: DOI 10.1109/TSE.2016.2527791, IEEETransactions on Software Engineering
TRANSACTIONS ON SOFTWARE ENGINEERING, VOL. V, NO. N, MONTH 20YY 10
TABLE 5Differences in R1 and Acc between subject groups with low and high experience for the snippets’ comment variants.
Snippet All subjects High exp groups* Low exp groups* CommentS1 BC easiest to read; NC
most difficult. Acc highestfor BC; almost the samefor GC and NC
BC easiest to read; NC mostdifficult. Inconsistent regard-ing Acc.
BC easiest to read; GCmost difficult with many“very difficult” scores. Accfollows same pattern, i.e.BC>NC>GC.
BC has highest R1 and highest Acc in allgroups. Inconsistent results for R1 andAcc regarding GC and NC.
S2 GC easiest to read; Smalldifferences between BCand NC. Small differencesin Acc (NC>BC>GC).
Inconsistent regarding R1.Lowest Acc for BC.
BC most difficult to readwith very many “very dif-ficult” scores. GC slightlyhigher Acc as NC.
BC most difficult to read in 4 of the 5groups. Inconsistent regarding Acc butoverall high.
S3 GC much easier to readthan BC and NC, whichare about the same. Simi-lar for Acc, but differencesare smaller.
GC easiest to read, many“very easy” scores; BC mostdifficult. Inconsistent regard-ing Acc but overall high.
GC much easier to readthan BC and NC; NC mostdifficult with many “verydifficult” scores. LowestAcc for BC; Acc on anoverall low level.
GC consistently rated as easiest to read;R1 inconsistent for BC and NC, but NChas the most“very difficult” scores in allgroups. Inconsistent and large variationsin Acc.
S4 BC easiest to read; NCmost difficult. Acc almostthe same for GC, BC andNC.
BC easiest to read, despitemany “very difficult” scores.Inconsistent regarding DCand NC. Acc highest for NCand lowest for BC.
Inconsistent regarding R1,but differences are small.Very low Acc for GC;highest Acc for NC.
Large inconsistencies regarding R1 andAcc, but consistently highest Acc for NC.
S5 GC easiest to read; BCmost difficult. Highest Accfor GC; almost the samefor BC and NC.
GC easiest to read; inconsis-tent regarding BC and NC.Highest Acc for GC; lowestfor NC. Comparatively smalldifferences in R1, but largedifferences in Acc.
GC much easier to readthan BC and NC; BC mostdifficult. Highest Acc forGC.
GC consistently rated easiest to read; BCmost difficult in 4 of the 5 groups. Accconsistently highest for GC in all groups;lowest Acc for NC in 4 of the 5 groups.
*There are two such groups: High/low programming experience and high/low task-specific experience, respectively.
the next page provides a summary of the observations forindividual snippets. Overall, we can see that either GC or BCwere rated as the most readable snippet variants. Regardingthe Acc-values all variants were rated best or worst for somesnippets. Unlike for the MCs, there does not exist a tendencythat variants with a high R1 also have a high Acc. This raisesthe question whether the subjects actually considered thequality of the comments or just their presence or amountwhen rating the readability of the code.
8 THREATS TO VALIDITY
8.1 Internal ValidityInternal validity is concerned with the observed relation-ships between the independent and dependent variables,i.e. to which extent the treatment and independent vari-able actually caused the observed effects. Unknown factors(confounding variables, bias, etc.) might have affected theresults and limit (internal) validity of the study. As dis-cussed in Section 4.2.2, we tried to minimize learning effectsconcerned with the cloze questions by varying the places ofthe gaps. We also reduced the number of snippets to 6 afterpiloting to bring down the expected total task time to under45 minutes. Furthermore, we minimized fatigue effects byallowing pausing. The snippets were always shown in thesame order (S1–S5), so that the results for the last snippetscould be affected by fatigue. However, we placed the largestand most complex snippets in positions 2 and 3, respectivelyto mitigate this problem.
As shown in the discussion of the results, programmingexperience is a confounding factor for comprehension whichwe controlled for explicitly. We could not control cheatingby our students. As the students participated voluntarilywe see no reason for validity issues here.
A problem, that might have affected our results is bias.Since our subjects are undergraduate students, their percep-tion of what is readable or not might be biased by personal
beliefs or beliefs imposed on them (e.g., in their program-ming education). This should, however, only affect our mea-sures of perceived readability. Since perceived readabilityand other measures of readability and comprehension donot show any significant relationships in our study, thisthreat might be real. Therefore perceived readability mightnot be sufficient as the sole measure of readability (see alsothe discussion in Section 7).
8.2 External Validity
External validity is concerned with the generalizability ofthe results to other contexts. Our study is restricted bythe fact that the subjects were undergraduate students andonly few rated themselves with high experience. Resultsmight be different for professionals. The snippets used inthe study do not contain complex programming languagefeatures. This limits generalizability to code with commondata structures and control logic. However, we believe thatour snippets are representative for professional code withthese constraints as we took them from known code basesand only made slight adaptations. The limited number ofbase snippets could also be seen as a threat to generaliz-ability. However, the goal of the study was not to developa general readability formula. We investigated the effectof specific code variations only. The code variations werecarefully developed (see Section 4.2.1) and, as shown by thedata, the snippets differ in their readability. Limiting thenumber of snippets allowed us to gather enough data pointsfor the variants for statistical analysis.
As mentioned in Section 7, unlimited time might be anissue. In our experiment, reading and answer time werenot restricted. For professional programmers, time on taskis usually restricted. However, this allowed us to studythe influence of the reading and answering times on theaccuracy of the results.

0098-5589 (c) 2015 IEEE. Translations and content mining are permitted for academic research only. Personal use is also permitted, but republication/redistribution requires IEEE permission. Seehttp://www.ieee.org/publications_standards/publications/rights/index.html for more information.
This article has been accepted for publication in a future issue of this journal, but has not been fully edited. Content may change prior to final publication. Citation information: DOI 10.1109/TSE.2016.2527791, IEEETransactions on Software Engineering
TRANSACTIONS ON SOFTWARE ENGINEERING, VOL. V, NO. N, MONTH 20YY 11
8.3 Construct Validity
Construct validity is concerned with the operationalizationof the study and to which extent the factors, measures,and materials actually represent the intended real worldconstructs. As the good and bad comments were partlydefined by the researchers, it could be that they do notrepresent realistic code comments. However, we preservedexisting comments as far as possible and used commoncommenting guidelines. We believe that the differences asdescribed in Section 4 were quite typical.
Regarding measures, we deliberately used measuresother than perceived software readability to also includeother factors of comprehension. As the researchers devisedthe gaps for the cloze questions and rated the accuracy, itcould be that by chance the gaps were too artificial. How-ever, as mentioned in Section 4, we placed the gaps at verydifferent places. Furthermore, we evaluated accuracy indi-vidually, based on assessment criteria defined and agreedupon in advance. This process led to a high agreement andonly few answers required a discussion.
8.4 Conclusion Validity
Conclusion validity is concerned with the correctness ofthe conclusions drawn in this study. We used standardstatistical algorithms as recommended in text books onexperimentation in software engineering such as [55]. Theonline questionnaire made sure that the questions wereadministered uniformly. Ordering and learning effects werecountered by grouping.
9 LESSONS LEARNED
We want to group the lessons learned from this study intotwo groups: Lessons learned from the actual experimentprocess and lessons learned from the actual results. Bothgave valuable insight into considerations for future experi-ments in software readability and comprehension.
• It is very difficult to isolate and study a single com-prehension factor, since there are so many factors thatinteract with each other in ways that are not wellunderstood. The experimental code must show as muchvariation as possible to be able to generalize, but aslittle as possible variation to be able to get statisticallysignificant results.
• Timing is important. Giving subjects unlimited time forthe experimental tasks makes measuring of comprehen-sion very difficult. This cannot be made up for easily bytaking into account the time on task.
• Perceived readability (as R1) might be insufficient asthe only measure of readability and/or comprehension,since it can be affected by bias that is difficult to control.In the present study, it seems that the subjects werebiased towards the existence of comments.
• Controlling for experience is very important even forsingle cohorts of students, since experience is a signifi-cant factor for comprehension.
10 CONCLUSIONS AND FUTURE WORK
In the present study, we have shown that code comments onstatement level affect the perceived readability of software,but not comprehension measured in terms of accuracy ofanswers to cloze questions. Regarding the former, our studyshows that code with bad comments was rated as morereadable than expected. In several cases the variants withbad comments were actually rated as the most readablevariants. This suggests that the role of comments for codequality should be studied in more detail.
In our study, the absence or presence of method chainsis not significantly related to perceived readability or com-prehension. Method chaining is often claimed to lead tomore compact and more readable code. This could notbe corroborated by our study. In fact, it is interesting tonote that even experienced subjects favored code withoutmethod chains in several cases (see Table 4). The ambiguousresults of our study could be an artefact of differences inthe code snippets used in the experiment. Further studiesare necessary to provide empirical evidence for or againstmethod chaining as an object-oriented programming style.
The result that perceived readability and comprehension(measured by answer accuracy – Acc) are not related issomewhat disturbing. It shows that it is difficult to mea-sure readability and comprehension and to investigate theirrelationship. It could also mean that perceived readabilitymight not be sufficient as a sole indicator or predictor ofsoftware quality. This should be studied in more detail.
REFERENCES
[1] Scott W. Ambler, Alan Vermeulen, and Greg Bumgard-ner. The Elements of Java Style. Cambridge UniversityPress, New York, NY, USA, 1999.
[2] Erik Arisholm, Lionel C. Briand, Siw Elisabeth Hove,and Yvan Labiche. The impact of UML documentationon software maintenance: An experimental evaluation.IEEE Transactions on Software Engineering, 32(6):365–381,2006.
[3] Dave Binkley, Marcia Davis, Dawn Lawrie, Jonathan I.Maletic, Christopher Morrell, and Bonita Sharif. Theimpact of identifier style on effort and comprehension.Empirical Software Engineering, 18(2):219–276, 2013.
[4] Jürgen Börstler, Michael E. Caspersen, and Marie Nord-ström. Beauty and the beast—toward a measurementframework for example program quality. Technical Re-port UMINF-07.23, Dept. of Computing Science, UmeåUniversity, Umeå, Sweden, 2007.
[5] Jürgen Börstler, Michael E. Caspersen, and Marie Nord-ström. Beauty and the beast: on the readability ofobject-oriented example programs. Software QualityJournal, 2015. in press, available online.
[6] Frank Buschmann, Regine Meunier, Hans Rohnert,Peter Sommerlad, and Michael Stal. Pattern-OrientedSoftware Architecture: A System of Patterns. Wiley, 1996.
[7] Raymond P.L. Buse and Westley R. Weimer. Learninga metric for code readability. IEEE Transactions onSoftware Engineering, 36(4):546–558, 2010.
[8] Simon Butler, Michel Wermelinger, Yijun Yu, and HelenSharp. Exploring the influence of identifier names oncode quality: an empirical study. In Proceedings of the

0098-5589 (c) 2015 IEEE. Translations and content mining are permitted for academic research only. Personal use is also permitted, but republication/redistribution requires IEEE permission. Seehttp://www.ieee.org/publications_standards/publications/rights/index.html for more information.
This article has been accepted for publication in a future issue of this journal, but has not been fully edited. Content may change prior to final publication. Citation information: DOI 10.1109/TSE.2016.2527791, IEEETransactions on Software Engineering
TRANSACTIONS ON SOFTWARE ENGINEERING, VOL. V, NO. N, MONTH 20YY 12
14th European Conference on Software Maintenance andReengineering, pages 156–165, 2010.
[9] Jie-Cherng Chen and Sun-Jen Huang. An empiricalanalysis of the impact of software development prob-lem factors on software maintainability. Journal ofSystems and Software, 82(6):981–992, 2009.
[10] Curtis Cook, William Bregar, and David Foote. A pre-liminary investigation of the use of the cloze procedureas a measure of program understanding. InformationProcessing & Management, 20(1):199–208, 1984.
[11] Lionel E. Deimel and J. Fernando Naveda. Readingcomputer programs: Instructor’s guide and exercises.Technical Report CMU/SEI-90-EM-3, Software Engi-neering Institute, Pittsburgh, PA, USA, 1990.
[12] Françoise Détienne. Software Design–Cognitive Aspects.Springer, 2002.
[13] William H. DuBay. The Principles of Readability. ImpactInformation, Costa Mesa, CA, USA, 2004.
[14] James L. Elshoff and Michael Marcotty. Improvingcomputer program readability to aid modification.Communications of the ACM, 25(8):512–521, 1982.
[15] Len Erlikh. Leveraging legacy system dollars for e-business. IT professional, 2(3):17–23, 2000.
[16] John R. Foster. Cost factors in software maintenance. PhDthesis, School of Engineering and Computer Science,University of Durham, UK, 1993.
[17] Martin Fowler. Refactoring: Improving the design of exist-ing code. Addison-Wesley, 1999.
[18] Martin Fowler. Domain-specific languages. Addison-Wesley, 2010.
[19] Erich Gamma, Richard Helm, Ralph Johnson, and JohnVlissides. Design patterns: Elements of reusable object-oriented software. Addison-Wesley Professional, 1995.
[20] Robert Green and Henry Ledgard. Coding guidelines:Finding the art in the science. Communications of theACM, 54(12):57–63, 2011.
[21] Yi Guo, Michael Würsch, Emanuel Giger, and Harald CGall. An empirical validation of the benefits of adher-ing to the law of demeter. In Proceedings of the 18thWorking Conference on Reverse Engineering, pages 239–243, 2011.
[22] William E. Hall and Stuart H. Zweben. The cloze pro-cedure and software comprehensibility measurement.IEEE Transactions on Software Engineering, 12(5):608–623,1986.
[23] Gretchen Hargis. Readability and computer documen-tation. Journal of Computer Documentation, 24(3):122–131, 2000.
[24] Andreas Jedlitschka, Marcus Ciolkowski, and DietmarPfahl. Reporting experiments in software engineering.In Guide to advanced empirical software engineering, pages201–228. Springer, 2008.
[25] Joshua Kerievsky. Refactoring to patterns. Addison-Wesley, 2005.
[26] Brian W. Kernighan and Phillip James Plauger. Theelements of programming style. McGraw-Hill, New York,USA, 1978.
[27] Brian W. Kernighan and Dennis M. Ritchie. The Cprogramming language, volume 2. Prentice-Hall, Engle-wood Cliffs, USA, 1988.
[28] Yunus Emre Keskin. Fluent interface for more
readable code. http://java.dzone.com/articles/fluent-interface-more-readable-0, March 2014. Last vis-ited: 2014-08-19.
[29] Miryung Kim, Thomas Zimmermann, and NachiappanNagappan. An empirical study of refactoring chal-lenges and benefits at microsoft. IEEE Transactions onSoftware Engineering, 40(7):633–649, 2014.
[30] Walter Kintsch and Douglas Vipond. Reading com-prehension and readability in educational practice andpsychological theory. In Lars-Göran Nilss, editor, Per-spectives on Memory Research. Lawrence Erlbaum Asso-ciates, Inc., 1979.
[31] George R. Klare. Readable computer documentation.Journal of Computer Documentation, 24(3):148–168, 2000.
[32] Donald E. Knuth. Literate programming. The ComputerJournal, 27(2):97–111, 1984.
[33] Thomas D. LaToza, Gina Venolia, and Robert DeLine.Maintaining mental models: a study of developer workhabits. In Proceedings of the 28th International Conferenceon Software Engineering, pages 492–501, 2006.
[34] Dawn Lawrie, Henry Feild, and David Binkley. Quanti-fying identifier quality: an analysis of trends. EmpiricalSoftware Engineering, 12(4):359–388, 2007.
[35] Timothy C. Lethbridge, Janice Singer, and AndrewForward. How software engineers use documentation:The state of the practice. IEEE Software, 20(6):35–39,2003.
[36] Karl J. Lieberherr and Ian M. Holland. Assuringgood style for object-oriented programs. IEEE Software,6(5):38–48, 1989.
[37] Radu Marinescu and Cristina Marinescu. Are theclients of flawed classes (also) defect prone? In Pro-ceedings of the 11th IEEE International Working Conferenceon Source Code Analysis and Manipulation, pages 65–74,2011.
[38] Robert C. Martin. Clean code: A Handbook of Agile Soft-ware Craftsmanship. Prentice Hall, Boston, MA, USA,2008.
[39] Vu Nguyen. Improved size and effort estimation mod-els for software maintenance. In Proceedings of the 26thInternational Conference on Software Maintenance, pages1–2, 2010.
[40] A.F. Norcio. Indentation, documentation and program-mer comprehension. In Proceedings of the 1982 Confer-ence on Human Factors in Computing Systems, pages 118–120, 1982.
[41] Eriko Nurvitadhi, Wing Wah Leung, and Curtis Cook.Do class comments aid java program understanding?In Proceedings of the 33rd Annual Frontiers in Education,volume 1, pages T3C–13, 2003.
[42] Paul W. Oman and Curtis R. Cook. A program-ming style taxonomy. Journal of Systems and Software,15(3):287–301, 1991.
[43] Kai Petersen. Implementing Lean and Agile software devel-opment in industry. PhD thesis, School of Computing,Blekinge Institute of Technology, Karlskrona, Sweden,2010.
[44] Daryl Posnett, Abram Hindle, and Premkumar De-vanbu. A simpler model of software readability. InProceedings of the 8th Working Conference on MiningSoftware Repositories, pages 73–82, 2011.

0098-5589 (c) 2015 IEEE. Translations and content mining are permitted for academic research only. Personal use is also permitted, but republication/redistribution requires IEEE permission. Seehttp://www.ieee.org/publications_standards/publications/rights/index.html for more information.
This article has been accepted for publication in a future issue of this journal, but has not been fully edited. Content may change prior to final publication. Citation information: DOI 10.1109/TSE.2016.2527791, IEEETransactions on Software Engineering
TRANSACTIONS ON SOFTWARE ENGINEERING, VOL. V, NO. N, MONTH 20YY 13
[45] Arthur J. Riel. Object-Oriented Design Heuristics.Addison-Wesley, 1996.
[46] Janet Siegmund, Christian Kästner, Jörg Liebig, SvenApel, and Stefan Hanenberg. Measuring and modelingprogramming experience. Empirical Software Engineer-ing, 2013. Online first.
[47] Malcolm Smith and Richard Taffler. Readability andunderstandability: different measures of the textualcomplexity of accounting narrative. Accounting, Audit-ing & Accountability Journal, 5(4):84–98, 1992.
[48] Diomidis Spinellis. Code documentation. IEEE Soft-ware, 27(4):18–19, 2010.
[49] Margaret-Anne Storey. Theories, tools and researchmethods in program comprehension: past, present andfuture. Software Quality Journal, 14(3):187–208, 2006.
[50] Herb Sutter and Andrei Alexandrescu. C++ codingstandards: 101 rules, guidelines, and best practices. PearsonEducation, 2004.
[51] Armstrong A. Takang, Penny A. Grubb, and Robert D.Macredie. The effects of comments and identifiernames on program comprehensibility: an experimen-tal investigation. Journal of Programming Languages,4(3):143–167, 1996.
[52] Ted Tenny. Program readability: Procedures versuscomments. IEEE Transactions on Software Engineering,14(9):1271–1279, 1988.
[53] Al Vermeulen, Scott W. Ambler, Greg Bumgardner,Eldon Metz, Trevor Misfeldt, Jim Shur, and PatrickThompson. The Elements of Java (TM) Style. CambridgeUniversity Press, 2000.
[54] Anneliese von Mayrhauser and A. Marie Vans. Pro-gram comprehension during software maintenanceand evolution. IEEE Computer, 28(8):44–55, 1995.
[55] Claes Wohlin, Per Runeson, Martin Höst, Magnus COhlsson, Björn Regnell, and Anders Wesslén. Experi-mentation in software engineering. Springer, 2012.
[56] Scott N. Woodfield, Hubert E. Dunsmore, and Vin-cent Yun Shen. The effect of modularization andcomments on program comprehension. In Proceedingsof the 5th International Conference on Software Engineering,pages 215–223, 1981.
[57] Stephen W.L. Yip and Tom Lam. A software main-tenance survey. In Proceedings of the 1st Asia-PacificSoftware Engineering Conference, pages 70–79, 1994.
PLACEPHOTOHERE
Jürgen Börstler is a professor of software en-gineering at Blekinge Institute of Technology,Sweden. He has a PhD in computer sciencefrom Aachen University of Technology (RWTH),Germany. His main research interests are in theareas requirements engineering, object-orientedmodeling, software process improvement, soft-ware measurement and computer science edu-cation.
PLACEPHOTOHERE
Barbara Paech is a professor for Software Engi-neering at Heidelberg University, Germany. Herteaching and research focuses on methods andprocesses to ensure the quality of software withadequate effort. She is particularly active in thearea of requirements and rational engineering.Based on her experiences as department headat the Fraunhofer Institute Experimental Soft-ware Engineering her research is often empiricaland in close cooperation with industry.