Trans-ethnic meta-analysis of white blood cell phenotypes · Trans-ethnic meta-analysis of white...
61
Trans-ethnic meta-analysis of white blood cell phenotypes Margaux F. Keller 1,7, { , Alexander P. Reiner 8,12, { , Yukinori Okada 13,15, { , Frank J.A. van Rooij 16,19, { , Andrew D. Johnson 20,22 , Ming-Huei Chen 21,22 , Albert V. Smith 23,24 , Andrew P. Morris 25,26 , Toshiko Tanaka 3 , Luigi Ferrucci 3 , Alan B. Zonderman 4 , Guillaume Lettre 27,28 , Tamara Harris 2 , Melissa Garcia 2 , Stefania Bandinelli 29 , Rehan Qayyum 30 , Lisa R. Yanek 30 , Diane M. Becker 30 , Lewis C. Becker 30,31 , Charles Kooperberg 12 , Brendan Keating 32,33 , Jared Reis 34 , Hua Tang 35 , Eric Boerwinkle 36 , Yoichiro Kamatani 13 , Koichi Matsuda 37 , Naoyuki Kamatani 13 , Yusuke Nakamura 37,38,39 , Michiaki Kubo 14 , Simin Liu 40,41 , Abbas Dehghan 16,19 , Janine F. Felix 16,19 , Albert Hofman 16,19 , Andre ´ G. Uitterlinden 16,18,19 , Cornelia M. van Duijn 16,19 , Oscar H. Franco 16,17,19 , Dan L. Longo 5 , Andrew B. Singleton 1 , Bruce M. Psaty 9,10,11,42 , Michelle K. Evans 6 , L. Adrienne Cupples 22,43 , Jerome I. Rotter 44,45 , Christopher J. O’Donnell 20,22 , Atsushi Takahashi 13, { , James G. Wilson 46, { , Santhi K. Ganesh 47,48, { , ∗ and Mike A. Nalls 1, { , ∗ for the CHARGE Hematology, COGENT, and BioBank Japan Project (RIKEN) Working Groups } 1 Laboratory of Neurogenetics, 2 Laboratory of Epidemiology and Population Sciences, National Institute on Aging, National Institutes of Health, Bethesda, MD, USA, 3 Longitudinal Studies Section, Clinical Research Branch, 4 Behavioral Epidemiology Section, Laboratory of Epidemiology & Population Sciences, National Institute on Aging Intramural Research Program, National Institutes of Health, Baltimore, MD, USA, 5 Laboratory of Genetics, 6 Health Disparities Research Section, Clinical Research Branch, National Institute on Aging, National Institutes of Health, Baltimore, MD, USA, 7 Department of Biological Anthropology, Temple University, Philadelphia, PA, USA, 8 Department of Epidemiology, 9 Cardiovascular Health Research Unit, 10 Department of Medicine, 11 Department of Epidemiology and Health Services, University of Washington, Seattle, WA, USA, 12 Division of Public Health Sciences, Fred Hutchinson Cancer Research Center, Seattle, WA, USA, 13 Laboratory for Statistical Analysis, 14 Laboratory for Genotyping Development, RIKEN Center for Integrative Medical Sciences, Yokohama, Japan, 15 Department of Human Genetics and Disease Diversity, Graduate School of Medical and Dental Sciences, Tokyo Medical and Dental University, Tokyo, Japan, 16 Department of Epidemiology, 17 ErasmusAGE, Department of Epidemiology, 18 Department of Internal Medicine, Erasmus Medical Center, Rotterdam, The Netherlands, 19 Consortium for Healthy Aging (NGI-NCHA), The Netherlands Genomics Initiative, Leiden, The Netherlands, 20 Cardiovascular Epidemiology and Human Genomics Branch, NHLBI Division of Intramural Research, Bethesda, MD, USA, 21 Department of Neurology, Boston University School of Medicine, Boston, MA, USA, 22 NHLBI Framingham Heart Study, Bethesda, MD, USA, 23 Icelandic Heart Association, Kopavogur, Iceland, 24 University of Iceland, Reykjavik, Iceland, 25 Genetic and Genomic Epidemiology Unit, Wellcome Trust Centre for Human Genetics, University of Oxford, Oxford, UK, 26 Department of Biostatistics, University of Liverpool, Liverpool, UK, 27 Montreal Heart Institute, Montre ´ al, Canada, 28 De ´ partement de Me ´ decine, Universite ´ de Montre ´ al, Montre ´ al, Canada, 29 Geriatric Rehabilitation Unit, Azienda Sanitaria Firenze (ASF), Florence, Italy, 30 GeneSTAR Research Program, Division of General Internal Medicine , 31 Division of Cardiology, Johns Hopkins School of Medicine, Baltimore, MD, USA, 32 Center for Applied Genomics, Children’s Hospital of Philadelphia, PA, USA, 33 Department of Pediatrics, University of Pennsylvania, † These authors contributed equally to this work. ‡ These authors contributed equally to this work. ∗ To whom correspondence should be addressed at: Division of Cardiovascular Medicine, Department of Internal Medicine, University of Michigan, 1500 E. Medical Center Drive, Ann Arbor, MI 48109, USA. Tel: +1 7347644500; Fax: +1 7349368266; Email: [email protected]; Laboratory of Neurogenetics, Building 35, 1A-1014, 35 Convent Drive Bethesda, MD 20892, USA. Tel: 301 451 3831; E-mail: [email protected] } A full list of collaborators from CHARGE, COGENT and RIKEN can be found in Supplementary Material. Published by Oxford University Press 2014. This work is written by (a) US Government employee(s) and is in the public domain in the US. Human Molecular Genetics, 2014, Vol. 23, No. 25 6944–6960 doi:10.1093/hmg/ddu401 Advance Access published on August 5, 2014 at NIH Library on May 26, 2015 http://hmg.oxfordjournals.org/ Downloaded from
Transcript of Trans-ethnic meta-analysis of white blood cell phenotypes · Trans-ethnic meta-analysis of white...
Trans-ethnic meta-analysis of white blood cellphenotypesMargaux F. Keller1,7,{, Alexander P. Reiner8,12,{, Yukinori Okada13,15,{, Frank J.A. van Rooij16,19,{,
Andrew D. Johnson20,22, Ming-Huei Chen21,22, Albert V. Smith23,24, Andrew P. Morris25,26,
Toshiko Tanaka3, Luigi Ferrucci3, Alan B. Zonderman4, Guillaume Lettre27,28, Tamara Harris2,
Melissa Garcia2, Stefania Bandinelli29, Rehan Qayyum30, Lisa R. Yanek30, Diane M. Becker30,
Lewis C. Becker30,31, Charles Kooperberg12, Brendan Keating32,33, Jared Reis34, Hua Tang35,
Eric Boerwinkle36, Yoichiro Kamatani13, Koichi Matsuda37, Naoyuki Kamatani13, Yusuke
Nakamura37,38,39, Michiaki Kubo14, Simin Liu40,41, Abbas Dehghan16,19, Janine F. Felix16,19,
Albert Hofman16,19, Andre G. Uitterlinden16,18,19, Cornelia M. van Duijn16,19, Oscar H. Franco16,17,19,
Dan L. Longo5, Andrew B. Singleton1, Bruce M. Psaty9,10,11,42, Michelle K. Evans6,
L. Adrienne Cupples22,43, Jerome I. Rotter44,45, Christopher J. O’Donnell20,22,
Atsushi Takahashi13,{, James G. Wilson46,{, Santhi K. Ganesh47,48,{,∗ and Mike A. Nalls1,{,∗ for the
CHARGE Hematology, COGENT, and BioBank Japan Project (RIKEN) Working Groups}
1Laboratory of Neurogenetics, 2Laboratory of Epidemiology and Population Sciences, National Institute on Aging,National Institutes of Health, Bethesda, MD, USA, 3Longitudinal Studies Section, Clinical Research Branch, 4BehavioralEpidemiology Section, Laboratory of Epidemiology & Population Sciences, National Institute on Aging IntramuralResearch Program, National Institutes of Health, Baltimore, MD, USA, 5Laboratory of Genetics, 6Health DisparitiesResearch Section, Clinical Research Branch, National Institute on Aging, National Institutes of Health, Baltimore, MD,USA, 7Department of Biological Anthropology, Temple University, Philadelphia, PA, USA, 8Department of Epidemiology,9Cardiovascular Health Research Unit, 10Department of Medicine, 11Department of Epidemiology and Health Services,University of Washington, Seattle, WA, USA, 12Division of Public Health Sciences, Fred Hutchinson Cancer ResearchCenter, Seattle, WA, USA, 13Laboratory for Statistical Analysis, 14Laboratory for Genotyping Development, RIKENCenter for Integrative Medical Sciences, Yokohama, Japan, 15Department of Human Genetics and Disease Diversity,Graduate School of Medical and Dental Sciences, Tokyo Medical and Dental University, Tokyo, Japan, 16Department ofEpidemiology, 17ErasmusAGE, Department of Epidemiology, 18Department of Internal Medicine, Erasmus MedicalCenter,Rotterdam,TheNetherlands, 19ConsortiumforHealthyAging (NGI-NCHA),TheNetherlandsGenomics Initiative,Leiden, The Netherlands, 20Cardiovascular Epidemiology and Human Genomics Branch, NHLBI Division of IntramuralResearch, Bethesda, MD, USA, 21Department of Neurology, Boston University School of Medicine, Boston, MA, USA,22NHLBI Framingham Heart Study, Bethesda, MD, USA, 23Icelandic Heart Association, Kopavogur, Iceland, 24Universityof Iceland, Reykjavik, Iceland, 25Genetic and Genomic Epidemiology Unit, Wellcome Trust Centre for Human Genetics,University of Oxford, Oxford, UK, 26Department of Biostatistics, University of Liverpool, Liverpool, UK, 27Montreal HeartInstitute, Montreal, Canada, 28Departement de Medecine, Universite de Montreal, Montreal, Canada, 29GeriatricRehabilitation Unit, Azienda Sanitaria Firenze (ASF), Florence, Italy, 30GeneSTAR Research Program, Division ofGeneral Internal Medicine , 31Division of Cardiology, Johns Hopkins School of Medicine,Baltimore, MD, USA, 32Center forApplied Genomics, Children’s Hospital of Philadelphia, PA, USA, 33Department of Pediatrics, University of Pennsylvania,
†These authors contributed equally to this work.‡These authors contributed equally to this work.
∗To whom correspondence should be addressed at: Division of Cardiovascular Medicine, Department of Internal Medicine, University of Michigan,1500 E. Medical Center Drive, Ann Arbor, MI 48109, USA. Tel: +1 7347644500; Fax: +1 7349368266; Email: [email protected]; Laboratoryof Neurogenetics, Building 35, 1A-1014, 35 Convent Drive Bethesda, MD 20892, USA. Tel: 301 451 3831; E-mail: [email protected]
}A full list of collaborators from CHARGE, COGENT and RIKEN can be found in Supplementary Material.
Published by Oxford University Press 2014. This work is written by (a) US Government employee(s) and is in the public domain in theUS.
Human Molecular Genetics, 2014, Vol. 23, No. 25 6944–6960doi:10.1093/hmg/ddu401Advance Access published on August 5, 2014
at NIH
Library on May 26, 2015
http://hmg.oxfordjournals.org/
Dow
nloaded from
PA, USA, 34Division of Cardiovascular Sciences, National Heart, Lung, and Blood Institute, Bethesda, MD, USA,35Stanford University School of Medicine, Stanford, CA 94305, USA, 36The Brown Foundation, Institute of MolecularMedicine for the Prevention of Human Diseases, University of Texas, Houston, TX, USA, 37Laboratory of MolecularMedicine, Human Genome Center, Institute of Medical Science, The University of Tokyo, Tokyo, Japan, 38Department ofMedicine, 39Department of Surgery, Center for Personalized Therapeutics, The University of Chicago, Chicago, IL, USA,40Department of Epidemiology, 41Department of Medicine, Brown University, Providence, RI, USA, 42Group HealthResearch Institute, Group Health Cooperative, Seattle, WA, USA, 43Boston University Department of Statistics, Boston,MA, USA, 44Institute for Translational Genomics and Population Sciences, Los Angeles BioMedical Research Institute atHarbor-UCLA Medical Center, Torrance, CA, USA, 45Division of Genetic Outcomes, Department of Pediatrics, Harbor-UCLA Medical Center, Torrance, CA, USA, 46Department of Physiology and Biophysics, University of Mississippi MedicalCenter, Jackson, MS, USA 47Division of Cardiovascular Medicine, Department of Internal Medicine, University ofMichigan, Ann Arbor, MI, USA and 48Department of Human Genetics, University of Michigan, Ann Arbor, MI, USA
Received April 25, 2014; Revised and Accepted July 31, 2014
White blood cell (WBC) count is a common clinical measure used as a predictor of certain aspects of humanhealth, including immunity and infection status. WBC count is also a complex trait that varies among individualsand ancestry groups. Differences in linkage disequilibrium structure and heterogeneity in allelic effects areexpected to play a role in the associations observed between populations. Prior genome-wide associationstudy (GWAS) meta-analyses have identified genomic loci associated with WBC and its subtypes, but muchof the heritability of these phenotypes remains unexplained. Using GWAS summary statistics for over 50 000individuals from three diverse populations (Japanese, African-American and European ancestry), a Bayesianmodel methodology was employed to account for heterogeneity between ancestry groups. This approachwas used to perform a trans-ethnic meta-analysis of total WBC, neutrophil and monocyte counts. Ten previouslyknown associations were replicated and six new loci were identified, including several regions harboring genesrelated to inflammation and immune cell function. Ninety-five percent credible interval regions were calculatedto narrow the association signals and fine-map the putatively causal variants within loci. Finally, a conditionalanalysis was performed on the most significant SNPs identified by the trans-ethnic meta-analysis (MA), andnine secondary signals within loci previously associated with WBC or its subtypes were identified. This workillustrates the potential of trans-ethnic analysis and ascribes a critical role to multi-ethnic cohorts and consortiain exploring complex phenotypes with respect to variants that lie outside the European-biased GWAS pool.
INTRODUCTION
White blood cells (WBCs) are critically involved in the body’simmune system, serving as a primary defense mechanismagainst foreign pathogens. WBC count is used as a clinicalmarker of inflammation status, and higher WBC count hasbeen associated with a risk of cardiovascular disease, cancermortality and all-cause mortality (1–3). Elevated WBC countis also associated with disease risk factors including increasingage, high blood pressure, cigarette smoking, adiposity and in-creasing plasma inflammatory markers (4).
WBCs are classified into five subtypes according to theirmorphology and functions, including neutrophils, basophils,eosinophils, lymphocytes and monocytes. Total WBC count ishighly variable even among healthy individuals of the samepopulation (5). WBC count is a moderately heritable phenotype,with h2 estimates ranging from 0.14 to 0.40 across the WBC sub-types (6). Additionally, between 25 and 50% of individuals ofAfrican descent exhibit benign ethnic neutropenia, character-ized by low neutrophil counts, due to a regulatory variant inthe Duffy antigen receptor for chemokines (DARC) gene
(5,7,8). Given the importance of WBC in both host defenseand, potentially, pathologic inflammation, elucidation of add-itional genetic mechanisms responsible for regulating whileblood cell count could have a substantial medical impact.
Admixture mapping and genome-wide association studies(GWAS) performed on cohorts of differing continental ancestry,including European, Japanese and African-American, have beensuccessful in identifying multiple loci associated with WBC phe-notypes (5,8–14). The joint effects of these loci generallyexplain only a small portion of the overall heritability of eithertotal WBC or WBC subtypes. Some prior GWAS have notdefined the subtypes of WBC that are driving their observedassociations; however, neutrophils in particular are often impli-cated (9,11). Furthermore, the loci identified by GWAS general-ly encompass large genomic regions, often containing manygenes and variants with comparable association signals. Thus,fine-mapping methods aimed at pinpointing association signalsmore precisely are needed (15).
Recently, the 1000 Genomes Project and phase three of theHapMap project released comprehensive reference panels fora number of ethnic groups, including African, Asian and
Human Molecular Genetics, 2014, Vol. 23, No. 25 6945
at NIH
Library on May 26, 2015
http://hmg.oxfordjournals.org/
Dow
nloaded from
additional European populations (16,17). Imputation using thesehigher density reference panels allows inference of genotypesnot captured by genotyping arrays, markedly increasing thebreadth of genetic variation that can be included in associationtests. This has provided new opportunities both to detect novelloci and to refine the localization of association signals for anumber of phenotypes, including WBC phenotypes.
Trans-ethnic meta-analysis (MA) potentially offers a morecomprehensive view of the genetic variation that is associatedwith a trait, but traditional fixed-effects MA methods do not ad-equately address heterogeneity in allelic effects, allele frequen-cies or differences in linkage disequilibrium between ethnicities(18). For example, in a previous fixed-effects analysis of thecohorts included in the current study, only 152 of 161 singlenucleotide polymorphisms (SNPs) that had been associatedwith WBC phenotypes in earlier analyses were replicated at aBonferroni-corrected significance threshold of P , 3.57E23,and no novel associations were observed (9). Whereas random-effects-based methods of MA do account for inter-study hetero-geneity, they lose statistical power in the setting of high levelsof heterogeneity that may result from experimental or statisticaldifferences in study design (15,19).
These shortcomings have been addressed in the softwarepackage, MANTRA (Meta-Analysis of Trans-ethnic Associationstudies), which allows for heterogeneity between diverse ethnicgroups and provides increased power and mapping resolution com-pared with random-effects-based methods (15). In the currentstudy,we usedMANTRAtocombine summaryresults ofancestry-specific GWAS of WBC traits in three distinct populations. Weidentify novel loci associated with WBC count, assess heterogen-eity in allelic effects between ancestry groups and improve fine-mapping resolution of some previously identified regions.
RESULTS
Descriptive statistics for each cohort are found in Table 1. In thetrans-ethnic MANTRA analyses, we observed strong evidenceof association, defined by a log10 Bayes factor (BF) of .6, at10 previously identified loci and six novel loci, and detectednine secondary signals within 500 kb of a previously identifiedlocus. The population-specific and trans-ethnic results for the
established and novel loci associated with each WBC phenotype(total WBC, neutrophil and monocyte count) are summarized inTable 2. Cohort-level Manhattan plots are shown in Figure 1. Ofthe 15 previously identified variants (at 10 loci), six of the sixmonocyte associations, two of the four neutrophil associationsand two of the five WBC count associations were initially iden-tified in the original GWAS papers from which the dataemployed by this analysis are drawn.
Regions previously identified by single-ethnicity GWASreappeared in the MANTRA trans-ethnic analyses, but in someinstances, the index SNP from the original publication was notthe most significant. These include rs4065321 and rs17609240on 17q21.1 (WBC count and neutrophil count), rs2517524 on6p21.33 (WBC count) and rs10956483 on 8q24.21 (monocytecount). Additionally, rs2814778, a marker identifying theDuffy null blood group antigen and located on the DARC geneof chromosome 1 at position (b37) 159 174 683, was availableonly in the COGENT data. This marker accounts for 20% ofpopulation variance in the WBC of African ancestry populationsand is monomorphic in non-African populations.
Novel associations
In addition to replicating known variants, the trans-ethnic ana-lysis identified six novel trait–locus associations (Table 2).For neutrophil counts, novel findings include rs6936204 inregion 6p21.32, located nearest to AK123889. This region isvery near known locus 6p21.33, which was previously asso-ciated with WBC and lymphocyte counts (9). These loci arenear the HLA region; thus, it is possible that population stratifi-cation is driving this association (20). These variants are not inlinkage disequilibrium (LD) with any of the known HLAmarkers, but as meiotic crossovers are known to cluster aroundHLA, it is possible that these variants are separated from thisregion by a recombination hotspot. Novel association forWBC count includes rs10932765 in region 2q35, located nearARPC2, which has previously been associated with monocytecount and inflammatory bowel disease (12,21). This region isnotable because of its proximity to IL8RA, which encodesCXCR1. CXCR1, the receptor for the chemokine IL-8, is a medi-ator of inflammatory responses; interestingly, the Duffy antigen
Table 1. Descriptive statistics
Study RIKEN CHARGE COGENTPopulation ancestry Japanese European African-American
Total WBCWBC count: mean (SD) in cells × 103/ml 6.20 (1.67), n ¼ 16 843 5.72 (1.24), n ¼ 19 509 5.94 (1.88), n #16 388Neutrophils: mean (SD) in cells × 103/ml 3.80 (1.40), n ¼ 9802 3.52 (1.06), n ¼ 16 550 3.57 (1.57), n #7391Monocytes: mean (SD) in cells × 103/ml 0.36 (0.22), n ¼ 9810 0.43 (0.14), n ¼ 16 550 0.36 (0.17), n #7369
CovariatesAge in years: mean (SD) 63.5 (10.6) 63.8 (8.9) 50.9 (7.6)BMI: mean (SD) kg/m2 23.1 (3.6) NA NA% Female 39.1 53.5 65.6% Current smoker 52.6 17.6 NA
Sample sizeTotal N 17 218 19 509 16 388
Counts are reported in thousands of cells per milliliter of blood (cells × 109/l).SD, standard deviation; NA, not available.
6946 Human Molecular Genetics, 2014, Vol. 23, No. 25
at NIH
Library on May 26, 2015
http://hmg.oxfordjournals.org/
Dow
nloaded from
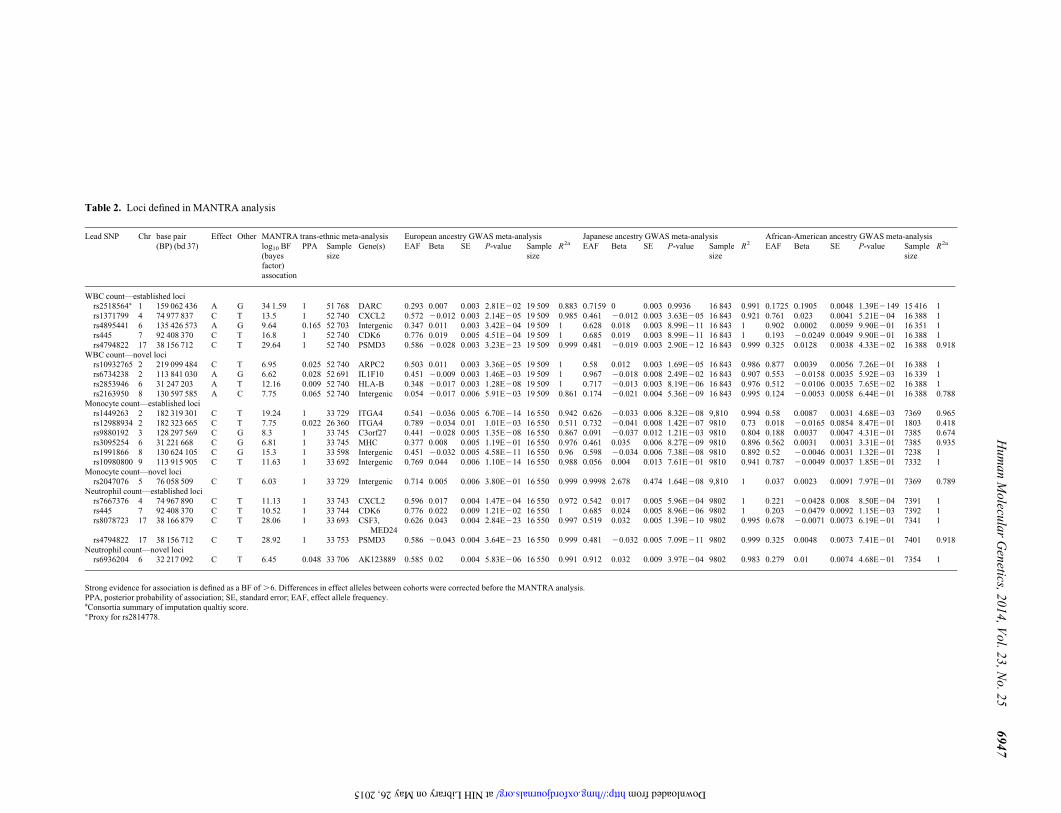
Table 2. Loci defined in MANTRA analysis
Lead SNP Chr base pair(BP) (bd 37)
Effect Other MANTRA trans-ethnic meta-analysis European ancestry GWAS meta-analysis Japanese ancestry GWAS meta-analysis African-American ancestry GWAS meta-analysislog10 BF(bayesfactor)assocation
PPA Samplesize
Gene(s) EAF Beta SE P-value Samplesize
R2a EAF Beta SE P-value Samplesize
R2 EAF Beta SE P-value Samplesize
R2a
WBC count—established locirs2518564∗ 1 159 062 436 A G 34 1.59 1 51 768 DARC 0.293 0.007 0.003 2.81E202 19 509 0.883 0.7159 0 0.003 0.9936 16 843 0.991 0.1725 0.1905 0.0048 1.39E2149 15 416 1rs1371799 4 74 977 837 C T 13.5 1 52 740 CXCL2 0.572 20.012 0.003 2.14E205 19 509 0.985 0.461 20.012 0.003 3.63E205 16 843 0.921 0.761 0.023 0.0041 5.21E204 16 388 1rs4895441 6 135 426 573 A G 9.64 0.165 52 703 Intergenic 0.347 0.011 0.003 3.42E204 19 509 1 0.628 0.018 0.003 8.99E211 16 843 1 0.902 0.0002 0.0059 9.90E201 16 351 1rs445 7 92 408 370 C T 16.8 1 52 740 CDK6 0.776 0.019 0.005 4.51E204 19 509 1 0.685 0.019 0.003 8.99E211 16 843 1 0.193 20.0249 0.0049 9.90E201 16 388 1rs4794822 17 38 156 712 C T 29.64 1 52 740 PSMD3 0.586 20.028 0.003 3.23E223 19 509 0.999 0.481 20.019 0.003 2.90E212 16 843 0.999 0.325 0.0128 0.0038 4.33E202 16 388 0.918
WBC count—novel locirs10932765 2 219 099 484 C T 6.95 0.025 52 740 ARPC2 0.503 0.011 0.003 3.36E205 19 509 1 0.58 0.012 0.003 1.69E205 16 843 0.986 0.877 0.0039 0.0056 7.26E201 16 388 1rs6734238 2 113 841 030 A G 6.62 0.028 52 691 IL1F10 0.451 20.009 0.003 1.46E203 19 509 1 0.967 20.018 0.008 2.49E202 16 843 0.907 0.553 20.0158 0.0035 5.92E203 16 339 1rs2853946 6 31 247 203 A T 12.16 0.009 52 740 HLA-B 0.348 20.017 0.003 1.28E208 19 509 1 0.717 20.013 0.003 8.19E206 16 843 0.976 0.512 20.0106 0.0035 7.65E202 16 388 1rs2163950 8 130 597 585 A C 7.75 0.065 52 740 Intergenic 0.054 20.017 0.006 5.91E203 19 509 0.861 0.174 20.021 0.004 5.36E209 16 843 0.995 0.124 20.0053 0.0058 6.44E201 16 388 0.788
Monocyte count—established locirs1449263 2 182 319 301 C T 19.24 1 33 729 ITGA4 0.541 20.036 0.005 6.70E214 16 550 0.942 0.626 20.033 0.006 8.32E208 9,810 0.994 0.58 0.0087 0.0031 4.68E203 7369 0.965rs12988934 2 182 323 665 C T 7.75 0.022 26 360 ITGA4 0.789 20.034 0.01 1.01E203 16 550 0.511 0.732 20.041 0.008 1.42E207 9810 0.73 0.018 20.0165 0.0854 8.47E201 1803 0.418rs9880192 3 128 297 569 C G 8.3 1 33 745 C3orf27 0.441 20.028 0.005 1.35E208 16 550 0.867 0.091 20.037 0.012 1.21E203 9810 0.804 0.188 0.0037 0.0047 4.31E201 7385 0.674rs3095254 6 31 221 668 C G 6.81 1 33 745 MHC 0.377 0.008 0.005 1.19E201 16 550 0.976 0.461 0.035 0.006 8.27E209 9810 0.896 0.562 0.0031 0.0031 3.31E201 7385 0.935rs1991866 8 130 624 105 C G 15.3 1 33 598 Intergenic 0.451 20.032 0.005 4.58E211 16 550 0.96 0.598 20.034 0.006 7.38E208 9810 0.892 0.52 20.0046 0.0031 1.32E201 7238 1rs10980800 9 113 915 905 C T 11.63 1 33 692 Intergenic 0.769 0.044 0.006 1.10E214 16 550 0.988 0.056 0.004 0.013 7.61E201 9810 0.941 0.787 20.0049 0.0037 1.85E201 7332 1
Monocyte count—novel locirs2047076 5 76 058 509 C T 6.03 1 33 729 Intergenic 0.714 0.005 0.006 3.80E201 16 550 0.999 0.9998 2.678 0.474 1.64E208 9,810 1 0.037 0.0023 0.0091 7.97E201 7369 0.789
Neutrophil count—established locirs7667376 4 74 967 890 C T 11.13 1 33 743 CXCL2 0.596 0.017 0.004 1.47E204 16 550 0.972 0.542 0.017 0.005 5.96E204 9802 1 0.221 20.0428 0.008 8.50E204 7391 1rs445 7 92 408 370 C T 10.52 1 33 744 CDK6 0.776 0.022 0.009 1.21E202 16 550 1 0.685 0.024 0.005 8.96E206 9802 1 0.203 20.0479 0.0092 1.15E203 7392 1rs8078723 17 38 166 879 C T 28.06 1 33 693 CSF3,
MED240.626 0.043 0.004 2.84E223 16 550 0.997 0.519 0.032 0.005 1.39E210 9802 0.995 0.678 20.0071 0.0073 6.19E201 7341 1
rs4794822 17 38 156 712 C T 28.92 1 33 753 PSMD3 0.586 20.043 0.004 3.64E223 16 550 0.999 0.481 20.032 0.005 7.09E211 9802 0.999 0.325 0.0048 0.0073 7.41E201 7401 0.918Neutrophil count—novel loci
rs6936204 6 32 217 092 C T 6.45 0.048 33 706 AK123889 0.585 0.02 0.004 5.83E206 16 550 0.991 0.912 0.032 0.009 3.97E204 9802 0.983 0.279 0.01 0.0074 4.68E201 7354 1
Strong evidence for association is defined as a BF of .6. Differences in effect alleles between cohorts were corrected before the MANTRA analysis.PPA, posterior probability of association; SE, standard error; EAF, effect allele frequency.aConsortia summary of imputation qualtiy score.∗Proxy for rs2814778.
Hu
ma
nM
olecu
lar
Gen
etics,2
01
4,V
ol.2
3,N
o.2
56
94
7
at NIH Library on May 26, 2015 http://hmg.oxfordjournals.org/ Downloaded from
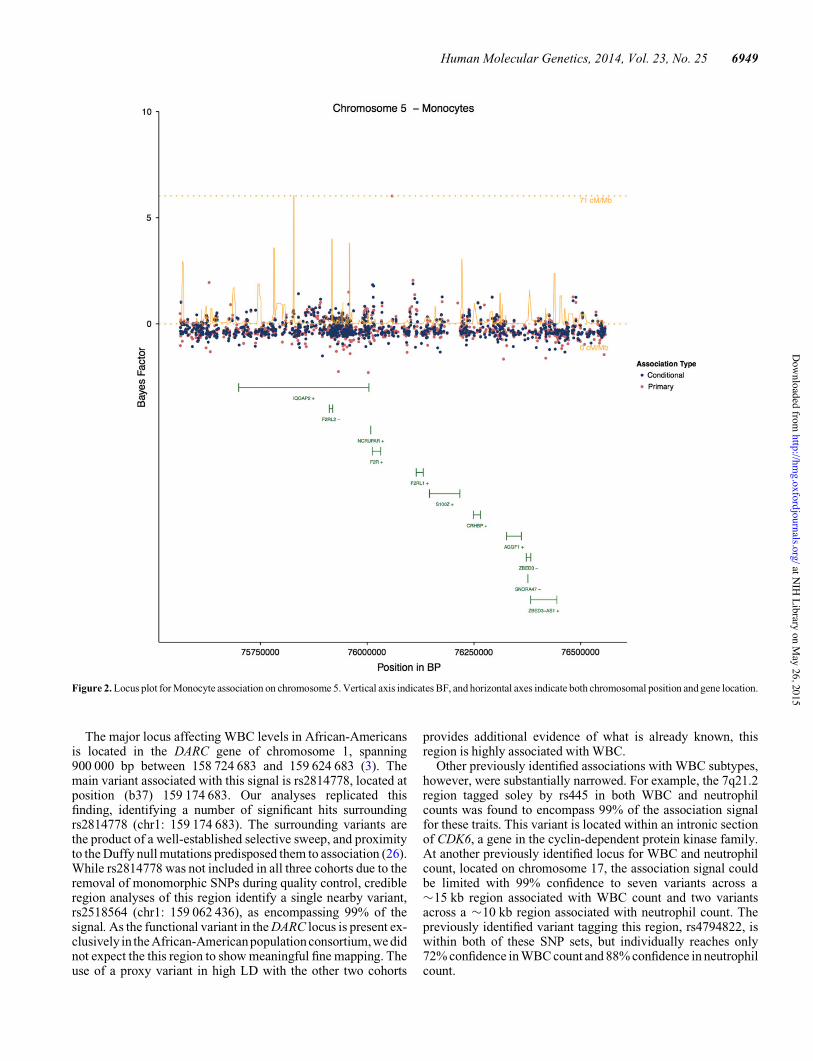
is also a receptor for IL-8. Additional novel associations forWBC include rs2163950 at 8q24.21, located in an intergenicregion, and rs6734238 in region 2q13, located near IL1F10and IL1RN. Top SNP rs6734238 tags the IL-1 gene familylocus near 2q13 and has also been associated with C-reactiveprotein levels in a European ancestry population (22). Notably,a large region of the implicated chromosome 6 associations forWBC, tagged by rs2853946, contains an apparently bimodalsignal of association, between 310.00 and 313.00 Mb (Fig. 2).A single novel association for monocyte count was identifiedby rs2047076 in region 5q13.3, also within an intergenicregion of the genome. This region falls between F2R, associatedwith platelet count (23), and F2RL1 which encodes PAR-2, amonocyte receptor (24).
Variants showing strong evidence for association wereexamined for heterogeneity in their allelic effects across ances-tries, indicated by a posterior probability of heterogeneity(PPH) of .0.5 (Table 3). For the novel monocyte-associatedlocus on chromosome 5, the RIKEN cohort has a large posteriormean allelic effect (PMAE), whereas the COGENT andCHARGE cohorts have PMAE that are much smaller. This sug-gests that the association may be specific to the Japanese popu-lation, or that the variant tagging this region, rs2047076, maynot be a good proxy among European or African-Americanindividuals because of differing LD structure between thesepopulations. The associations reported on chromosome 4 forboth WBC and neutrophils exhibit allelic effects in oppositedirections between the ancestry groups, which could reflectmultiple risk variants, or differing LD structure (1). The novelassociations reported on chromosome 2 for WBC have a poster-ior probability of association (PPA) of #0.03, and the PMAE ofthese variants are similar across the three ancestries (#0.01).PPA is estimated from the weighted average of the alternative
models and accounts for the differences in likelihood andstatistical power between tests (25). Locus plots for novelassociations are shown in Figures 2–7, and locus plots forknown associations are shown in Supplementary Material,Figures S1–S11.
To determine how consistent the MANTRA results are acrossstudies, a random-effects MA was also performed usingMETAL. The results are largely supportive of the known andnovel loci reported here, with the exception of those variantswith high levels of heterogeneity between populations, such asthe novel variant associated with monocytes and located onchromosome 5, rs2047076. The results of this additional MAare found in Supplementary Material, Table S1.
Cohort-level data were imputed before the trans-ethnic ana-lysis was performed. In instances where a novel variant wasboth imputed across multiple cohorts and exhibits low allele fre-quencies within those cohorts, additional replication is needed tovalidate the associations made here. In particular, these includers2047076, associated with monocytes, and rs2163950, asso-ciated with WBC count (Table 2). Without replication, thesenovel results should be viewed cautiously. We are optimisticthat in time, a similarly sized, ancestry-matched cohort will beavailable to replicate these analyses. In the meantime, we haveprovided genome-wide summary statistics for the primaryMANTRA analyses of monocyte, neutrophil and WBC counttraits in Supplementary Material, Table S2.
Fine mapping
Credible sets were defined to assess the extent to which the trans-ethnic analysis improved fine-mapping resolution of knownassociations. Credible region summary data for associated lociare presented in Supplementary Material, Table S3.
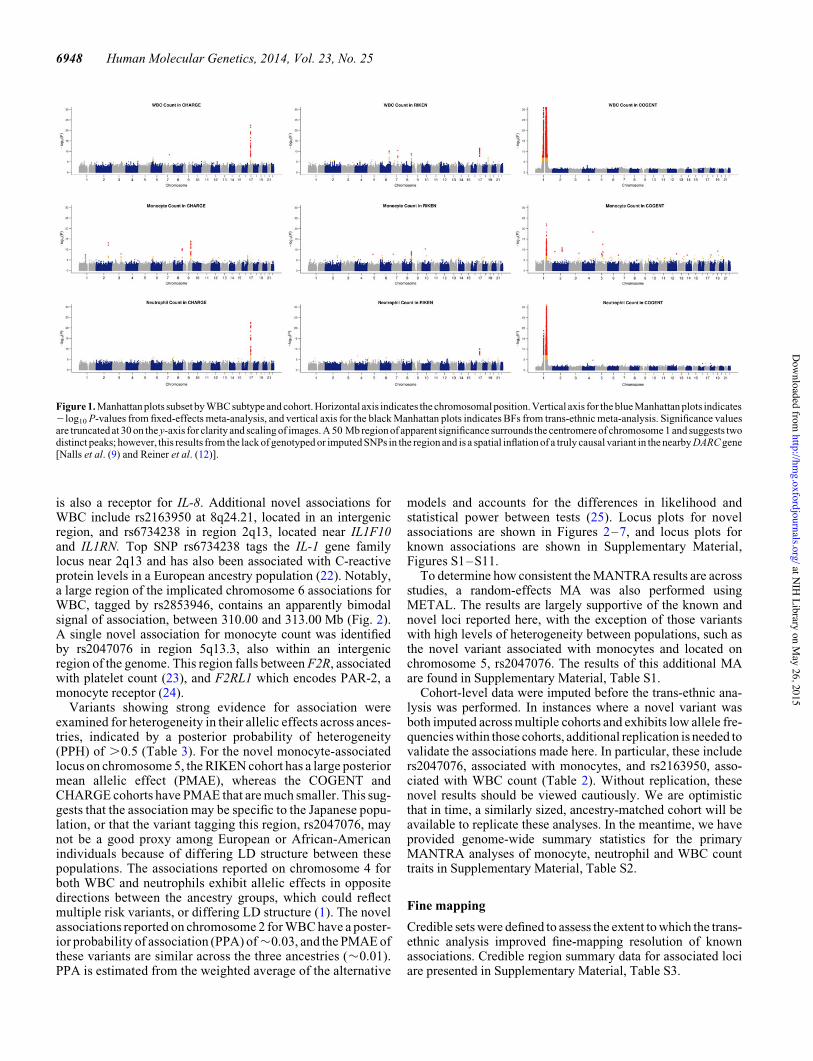
Figure 1. Manhattan plots subset by WBC subtype and cohort. Horizontal axis indicates the chromosomal position. Vertical axis for the blue Manhattan plots indicates2log10 P-values from fixed-effects meta-analysis, and vertical axis for the black Manhattan plots indicates BFs from trans-ethnic meta-analysis. Significance valuesare truncated at 30 on the y-axis for clarity and scaling of images. A 50 Mb region of apparent significance surrounds the centromere of chromosome 1 and suggests twodistinct peaks; however, this results from the lack of genotyped or imputed SNPs in the region and is a spatial inflation of a truly causal variant in the nearby DARC gene[Nalls et al. (9) and Reiner et al. (12)].
6948 Human Molecular Genetics, 2014, Vol. 23, No. 25
at NIH
Library on May 26, 2015
http://hmg.oxfordjournals.org/
Dow
nloaded from
The major locus affecting WBC levels in African-Americansis located in the DARC gene of chromosome 1, spanning900 000 bp between 158 724 683 and 159 624 683 (3). Themain variant associated with this signal is rs2814778, located atposition (b37) 159 174 683. Our analyses replicated thisfinding, identifying a number of significant hits surroundingrs2814778 (chr1: 159 174 683). The surrounding variants arethe product of a well-established selective sweep, and proximityto the Duffy null mutations predisposed them to association (26).While rs2814778 was not included in all three cohorts due to theremoval of monomorphic SNPs during quality control, credibleregion analyses of this region identify a single nearby variant,rs2518564 (chr1: 159 062 436), as encompassing 99% of thesignal. As the functional variant in the DARC locus is present ex-clusively in the African-American populationconsortium,we didnot expect the this region to show meaningful fine mapping. Theuse of a proxy variant in high LD with the other two cohorts
provides additional evidence of what is already known, thisregion is highly associated with WBC.
Other previously identified associations with WBC subtypes,however, were substantially narrowed. For example, the 7q21.2region tagged soley by rs445 in both WBC and neutrophilcounts was found to encompass 99% of the association signalfor these traits. This variant is located within an intronic sectionof CDK6, a gene in the cyclin-dependent protein kinase family.At another previously identified locus for WBC and neutrophilcount, located on chromosome 17, the association signal couldbe limited with 99% confidence to seven variants across a#15 kb region associated with WBC count and two variantsacross a #10 kb region associated with neutrophil count. Thepreviously identified variant tagging this region, rs4794822, iswithin both of these SNP sets, but individually reaches only72% confidence in WBC count and 88% confidence in neutrophilcount.
Figure 2. Locus plot for Monocyte association on chromosome 5. Vertical axis indicates BF, and horizontal axes indicate both chromosomal position and gene location.
Human Molecular Genetics, 2014, Vol. 23, No. 25 6949
at NIH
Library on May 26, 2015
http://hmg.oxfordjournals.org/
Dow
nloaded from
Conditional analysis
Conditional analysis adjusting for the effect of the most signifi-cantly associated SNP at each locus was performed to assess theindependence of possible novel variants and to detect the pres-ence of any secondary association signals within knownregions. Secondary signals were defined as additional associatedvariants within 500 kb of previously known loci. Of the primary(known and novel) loci, approximately half contained secondarysignals; these include four signals associated with monocytes,three associated with neutrophils and six associated with WBCcount. In some instances, the top signal identified by the second-ary analysis was stronger than that observed in the primary ana-lysis. This could occur, for example, when the allele frequenciesof the initial, index SNP are similar across ancestries, but the con-ditional signal(s) more accurately tag a functional variant in therespective populations. In order to verify the authenticity of ourconditional analysis results, we performed reverse conditioningon our secondary signals and found the signals reported here toremain significant, suggesting an independent effect on WBCsubtypes. The top association signals from these conditional ana-lyses are found in Table 4.
Expression quantitative trait loci analysis
All known, conditional and novel loci were assessed as potentialexpression quantitative trait loci (eQTLs) in leukocyte-derivedtissues in order to identify any correlations between associationsignals and gene expression, as such correlations may account
for functional relationships that are not captured by LD. Twoknown loci associated with monocyte count, and one novellocus newly associated with both WBC and neutrophil count,represented significant (P , 5E205) eQTLs when assessingeither the European ancestry sentinel SNPs or their proxies inthe YRI (African) and ASN (Asian) populations (1). Three ofthe four index SNPs at these loci are located within chromosome6p21.3; each has been associated with a different blood cell trait.The monocyte eQTLs on chromosome six are defined by thetranscription factor gene TCF19; the neutrophil eQTLs relateprimarily to the HLA transcripts, but depending on the tissuetype are also associated with expression of ATP6V1G2, whichencodes an enzyme involved in eukaryotic cell compartmentacidification. The WBC count eQTLs also relate to various tran-scripts of this region. Additionally, a previously described locusassociated with monocyte count on chromosome 2 is an eQTLfor the ITGA4 transcript at 2q31.3, which encodes the integrinalpha-4 subunit of the very late antigen-4 receptor on monocytesand other mononuclear cells (27,28). In instances where a proxyeQTLSNPhasbeenusedtorepresentaWBCorsubtype-associatedSNP, variants with greater concordance to the index SNP areviewed with more confidence than those with lower R2 values.Only two eQTL SNPs were found to be concordant or in veryhigh LD: rs3130320 (R2¼ 1) for neutrophils and rs6740847(R2¼ 0.983) for monocytes. We have reported other SNPs as po-tential eQTLs if their R2 value with the proxy eQTL SNP is.0.5; these SNPs are of course likely to be near the blood cellSNPs’ physical location. All the proxy eQTL variants identifiedhere are located in Supplementary Material, Table S4.
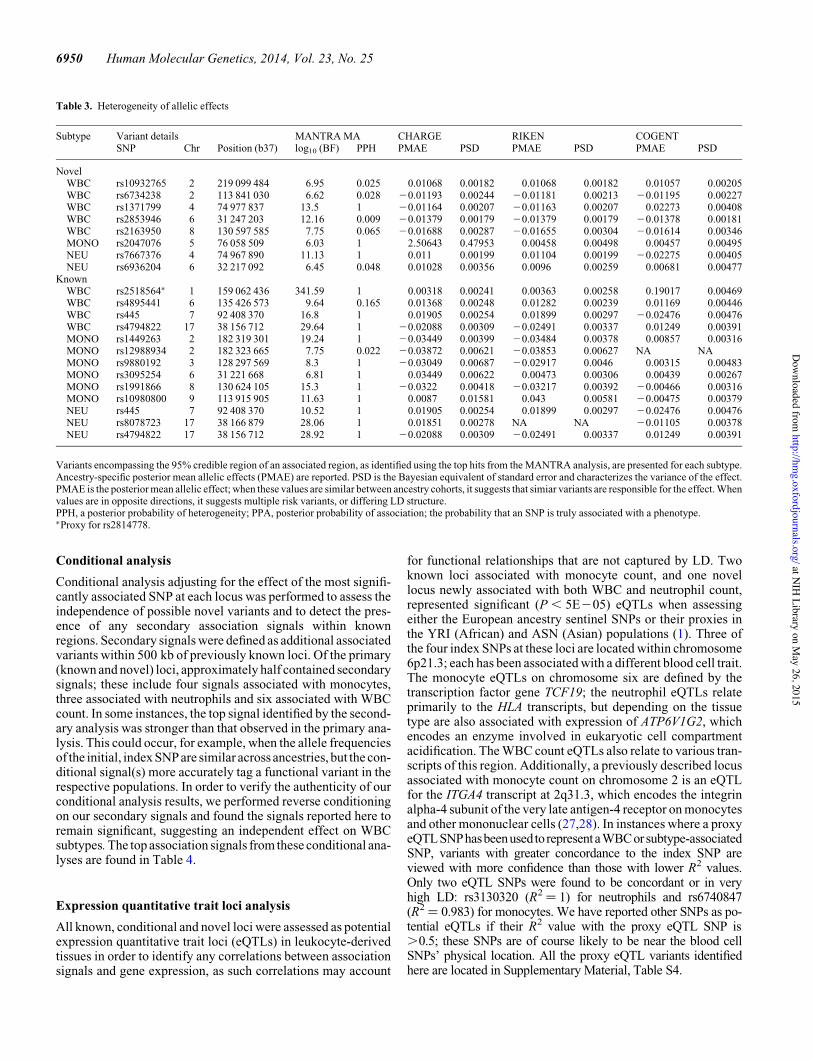
Table 3. Heterogeneity of allelic effects
Subtype Variant details MANTRA MA CHARGE RIKEN COGENTSNP Chr Position (b37) log10 (BF) PPH PMAE PSD PMAE PSD PMAE PSD
NovelWBC rs10932765 2 219 099 484 6.95 0.025 0.01068 0.00182 0.01068 0.00182 0.01057 0.00205WBC rs6734238 2 113 841 030 6.62 0.028 20.01193 0.00244 20.01181 0.00213 20.01195 0.00227WBC rs1371799 4 74 977 837 13.5 1 20.01164 0.00207 20.01163 0.00207 0.02273 0.00408WBC rs2853946 6 31 247 203 12.16 0.009 20.01379 0.00179 20.01379 0.00179 20.01378 0.00181WBC rs2163950 8 130 597 585 7.75 0.065 20.01688 0.00287 20.01655 0.00304 20.01614 0.00346MONO rs2047076 5 76 058 509 6.03 1 2.50643 0.47953 0.00458 0.00498 0.00457 0.00495NEU rs7667376 4 74 967 890 11.13 1 0.011 0.00199 0.01104 0.00199 20.02275 0.00405NEU rs6936204 6 32 217 092 6.45 0.048 0.01028 0.00356 0.0096 0.00259 0.00681 0.00477
KnownWBC rs2518564∗ 1 159 062 436 341.59 1 0.00318 0.00241 0.00363 0.00258 0.19017 0.00469WBC rs4895441 6 135 426 573 9.64 0.165 0.01368 0.00248 0.01282 0.00239 0.01169 0.00446WBC rs445 7 92 408 370 16.8 1 0.01905 0.00254 0.01899 0.00297 20.02476 0.00476WBC rs4794822 17 38 156 712 29.64 1 20.02088 0.00309 20.02491 0.00337 0.01249 0.00391MONO rs1449263 2 182 319 301 19.24 1 20.03449 0.00399 20.03484 0.00378 0.00857 0.00316MONO rs12988934 2 182 323 665 7.75 0.022 20.03872 0.00621 20.03853 0.00627 NA NAMONO rs9880192 3 128 297 569 8.3 1 20.03049 0.00687 20.02917 0.0046 0.00315 0.00483MONO rs3095254 6 31 221 668 6.81 1 0.03449 0.00622 0.00473 0.00306 0.00439 0.00267MONO rs1991866 8 130 624 105 15.3 1 20.0322 0.00418 20.03217 0.00392 20.00466 0.00316MONO rs10980800 9 113 915 905 11.63 1 0.0087 0.01581 0.043 0.00581 20.00475 0.00379NEU rs445 7 92 408 370 10.52 1 0.01905 0.00254 0.01899 0.00297 20.02476 0.00476NEU rs8078723 17 38 166 879 28.06 1 0.01851 0.00278 NA NA 20.01105 0.00378NEU rs4794822 17 38 156 712 28.92 1 20.02088 0.00309 20.02491 0.00337 0.01249 0.00391
Variants encompassing the 95% credible region of an associated region, as identified using the top hits from the MANTRA analysis, are presented for each subtype.Ancestry-specific posterior mean allelic effects (PMAE) are reported. PSD is the Bayesian equivalent of standard error and characterizes the variance of the effect.PMAE is the posterior mean allelic effect; when these values are similar between ancestry cohorts, it suggests that simiar variants are responsible for the effect. Whenvalues are in opposite directions, it suggests multiple risk variants, or differing LD structure.PPH, a posterior probability of heterogeneity; PPA, posterior probability of association; the probability that an SNP is truly associated with a phenotype.∗Proxy for rs2814778.
6950 Human Molecular Genetics, 2014, Vol. 23, No. 25
at NIH
Library on May 26, 2015
http://hmg.oxfordjournals.org/
Dow
nloaded from
DISCUSSION
We applied trans-ethnic MA to summary data from Japanese,African-American and European-Americans populations andidentified six new regions that contain biologically plausiblegenetic loci associated with WBC traits. Many of the noveland secondary association signals we observed involve genomicregions that contain several inflammatory and immune cell-related genes.
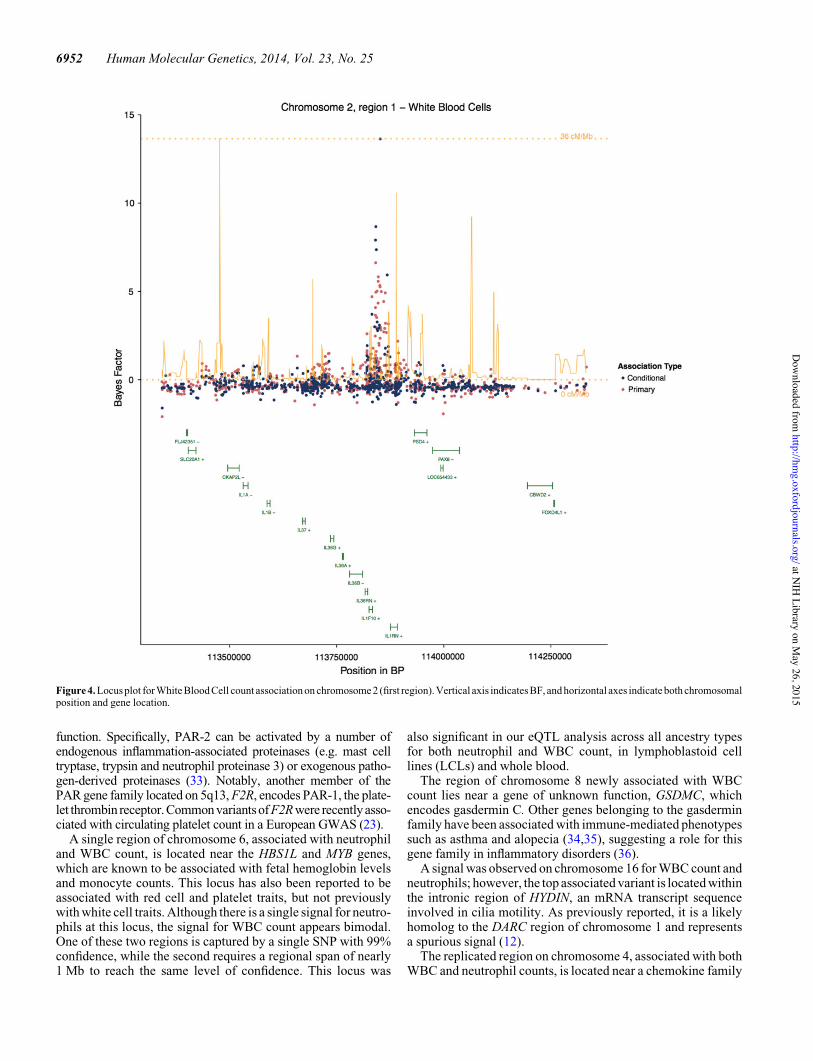
Particularly interesting, novel regions include the two loci onchromosome 2 associated with WBC count. The first, identifiedby rs6734238, falls within an inflammatory gene region of theinterleukin-1 cytokine gene family (29). This region has beenassociated with several inflammation-related biomarkers,including C-reactive protein and fibrinogen. rs6734238 islocated downstream of IL1F10 and upstream of IL1RN. IL1RNencodes IL-1 receptor antagonist (IL-1RA), which regulates a
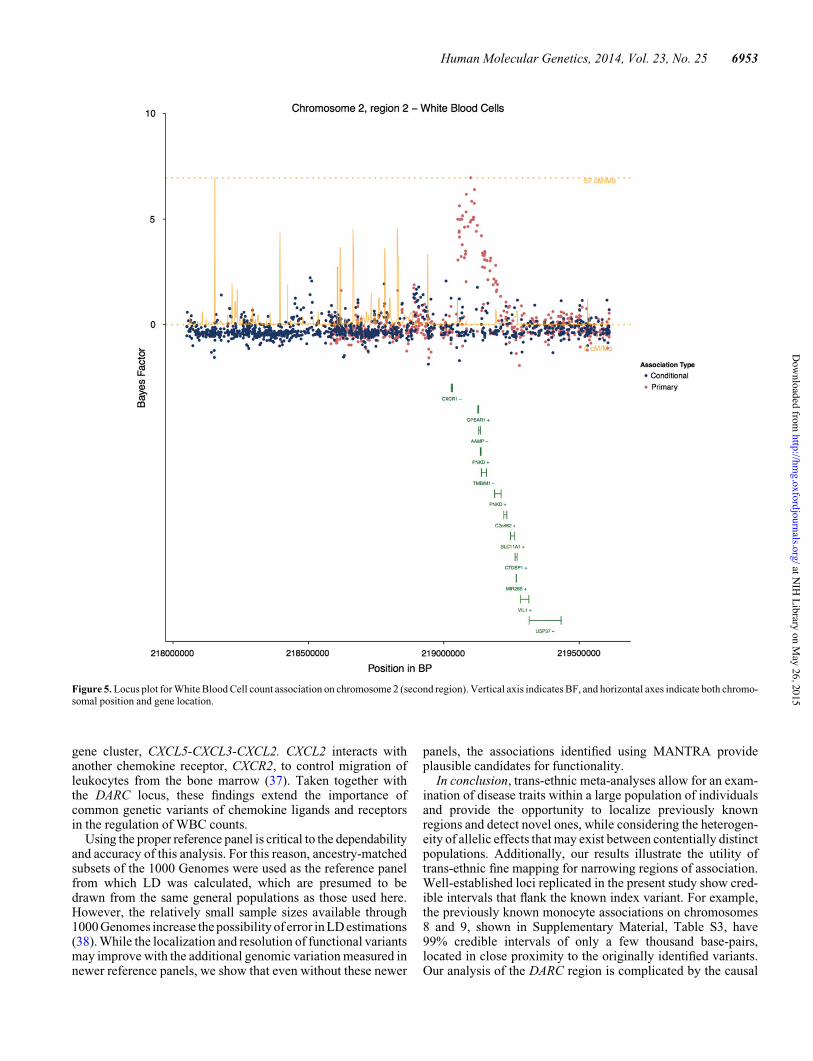
variety of interleukin-1-related immune and inflammatoryresponses, including inhibition of interleukin 1, alpha (IL1A)and interleukin 1, beta (IL1B). IL1F10 encodes IL-38, whichregulates Th17 immune responses and stimulates IL-6 cytokineproduction from dendritic cells in vitro (30). The secondchromosome 2 region, identified by rs10932765, is nearAPRC2 and CXCR1 (also known as IL8RA). CXCR1 is of par-ticular interest as this is a chemokine receptor involved in leuko-cyte chemotaxis and trafficking (31).
The novel chromosome 5q13 region associated with mono-cyte count lies within a family of protease-activated receptorgenes, F2RL2-F2RL1-F2R. The F2RL1 gene (protease-activated receptor-2 or PAR-2) has previously been related tosome inflammatory and autoimmune diseases, and is a knownreceptor on monocytes (32). PAR-2 is a G protein-coupledreceptor on monocyte/macrophages and other cell types thatappear to have a direct role in the regulation of innate immune
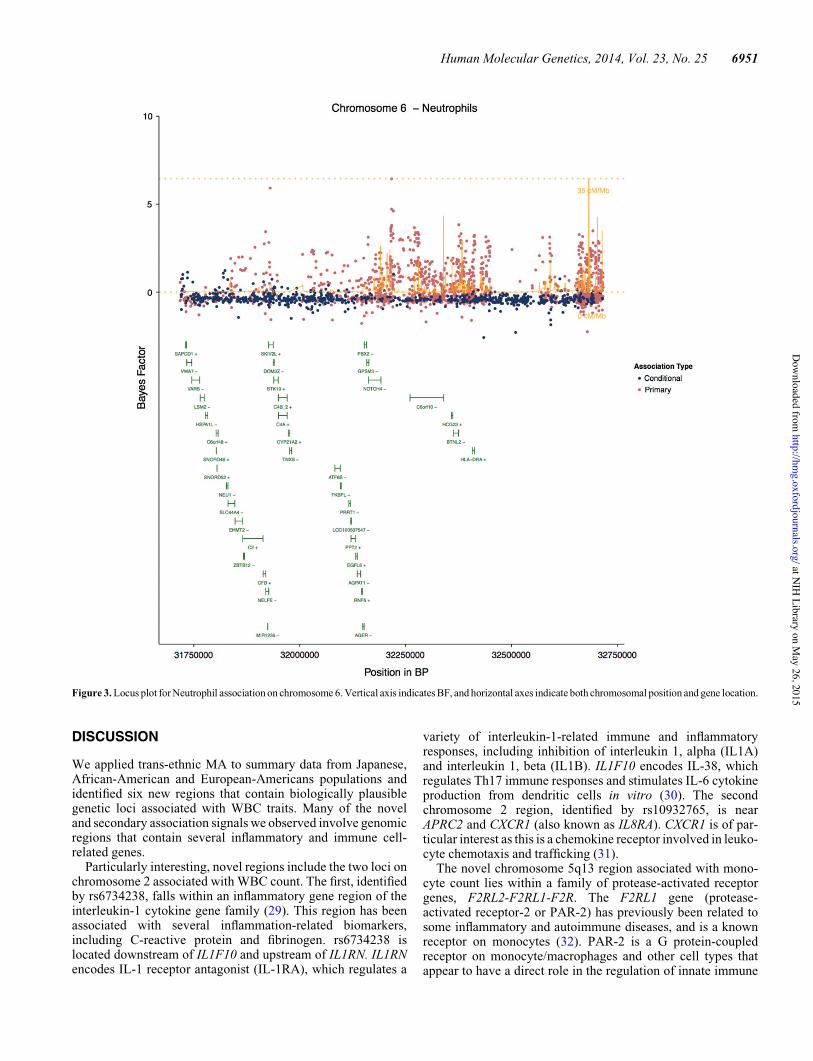
Figure 3. Locus plot for Neutrophil association on chromosome 6. Vertical axis indicates BF, and horizontal axes indicate both chromosomal position and gene location.
Human Molecular Genetics, 2014, Vol. 23, No. 25 6951
at NIH
Library on May 26, 2015
http://hmg.oxfordjournals.org/
Dow
nloaded from
function. Specifically, PAR-2 can be activated by a number ofendogenous inflammation-associated proteinases (e.g. mast celltryptase, trypsin and neutrophil proteinase 3) or exogenous patho-gen-derived proteinases (33). Notably, another member of thePAR gene family located on 5q13, F2R, encodes PAR-1, the plate-let thrombin receptor. Common variants of F2R were recently asso-ciated with circulating platelet count in a European GWAS (23).
A single region of chromosome 6, associated with neutrophiland WBC count, is located near the HBS1L and MYB genes,which are known to be associated with fetal hemoglobin levelsand monocyte counts. This locus has also been reported to beassociated with red cell and platelet traits, but not previouslywith white cell traits. Although there is a single signal for neutro-phils at this locus, the signal for WBC count appears bimodal.One of these two regions is captured by a single SNP with 99%confidence, while the second requires a regional span of nearly1 Mb to reach the same level of confidence. This locus was
also significant in our eQTL analysis across all ancestry typesfor both neutrophil and WBC count, in lymphoblastoid celllines (LCLs) and whole blood.
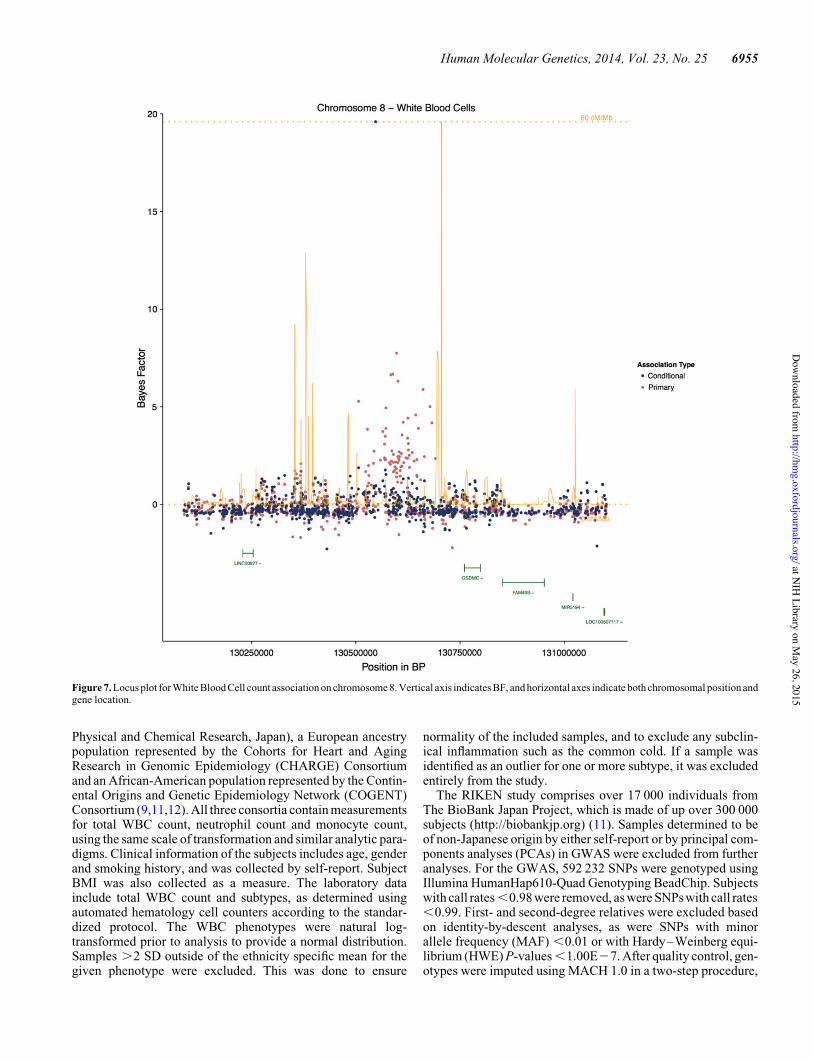
The region of chromosome 8 newly associated with WBCcount lies near a gene of unknown function, GSDMC, whichencodes gasdermin C. Other genes belonging to the gasderminfamily have been associated with immune-mediated phenotypessuch as asthma and alopecia (34,35), suggesting a role for thisgene family in inflammatory disorders (36).
A signal was observed on chromosome 16 for WBC count andneutrophils; however, the top associated variant is located withinthe intronic region of HYDIN, an mRNA transcript sequenceinvolved in cilia motility. As previously reported, it is a likelyhomolog to the DARC region of chromosome 1 and representsa spurious signal (12).
The replicated region on chromosome 4, associated with bothWBC and neutrophil counts, is located near a chemokine family
Figure 4. Locus plot for White Blood Cell count association on chromosome 2 (first region). Vertical axis indicates BF, and horizontal axes indicate both chromosomalposition and gene location.
6952 Human Molecular Genetics, 2014, Vol. 23, No. 25
at NIH
Library on May 26, 2015
http://hmg.oxfordjournals.org/
Dow
nloaded from
gene cluster, CXCL5-CXCL3-CXCL2. CXCL2 interacts withanother chemokine receptor, CXCR2, to control migration ofleukocytes from the bone marrow (37). Taken together withthe DARC locus, these findings extend the importance ofcommon genetic variants of chemokine ligands and receptorsin the regulation of WBC counts.
Using the proper reference panel is critical to the dependabilityand accuracy of this analysis. For this reason, ancestry-matchedsubsets of the 1000 Genomes were used as the reference panelfrom which LD was calculated, which are presumed to bedrawn from the same general populations as those used here.However, the relatively small sample sizes available through1000 Genomes increase the possibility of error in LD estimations(38). While the localization and resolution of functional variantsmay improve with the additional genomic variation measured innewer reference panels, we show that even without these newer
panels, the associations identified using MANTRA provideplausible candidates for functionality.
In conclusion, trans-ethnic meta-analyses allow for an exam-ination of disease traits within a large population of individualsand provide the opportunity to localize previously knownregions and detect novel ones, while considering the heterogen-eity of allelic effects that may exist between contentially distinctpopulations. Additionally, our results illustrate the utility oftrans-ethnic fine mapping for narrowing regions of association.Well-established loci replicated in the present study show cred-ible intervals that flank the known index variant. For example,the previously known monocyte associations on chromosomes8 and 9, shown in Supplementary Material, Table S3, have99% credible intervals of only a few thousand base-pairs,located in close proximity to the originally identified variants.Our analysis of the DARC region is complicated by the causal
Figure 5. Locus plot for White Blood Cell count association on chromosome 2 (second region). Vertical axis indicates BF, and horizontal axes indicate both chromo-somal position and gene location.
Human Molecular Genetics, 2014, Vol. 23, No. 25 6953
at NIH
Library on May 26, 2015
http://hmg.oxfordjournals.org/
Dow
nloaded from
SNP being monomorphic in two of the three populations employed.When the credible interval analysis is applied to this region, theproxy variant (rs2518564) tagging the known functional variant(rs2814778) (5,8) is identified as accounting for the entire signal.However, prior association studies and evidence of biologicalfunction allow confident identification of rs2814778 as the func-tional variant. By calculating credible intervals across test statisticsfrom analyses of combined ancestries, we were able to narrow ex-pansive loci tosmaller regions.Furtherwork isnecessary to identifywhat functional variants may lie within these regions.
The increasing availability of GWAS summary data for manyphenotypic traits of interest, from many ethnically diverse popu-lations, suggests that the trans-ethnic GWAS MA approach canyield additional association signals, thereby explaining some ofthe missing heritability and genetic architecture for othercomplex traits. In addition, this work is relevant for future
targeted sequencing follow-up studies, as we have narrowedthe scope of follow-up sequencing efforts for functional variants.By increasing the mapping resolution of the causal variantswithin these loci, we hope that these results guide next-generation targeted deep sequencing studies, which may disen-tangle the heterogeneity of effect across ethnicities (39).Future work will discern which functional variants are thesame across ethnicities and which tag nearby regions, throughLD, that harbor the true functional variant or variants.
MATERIALS AND METHODS
The trans-ethnic GWA strategy was applied to three consortiacontaining WBC phenotypes. These include a Japanese popula-tion represented by RIKEN (Rikagaku Kenkyusho, Institute of
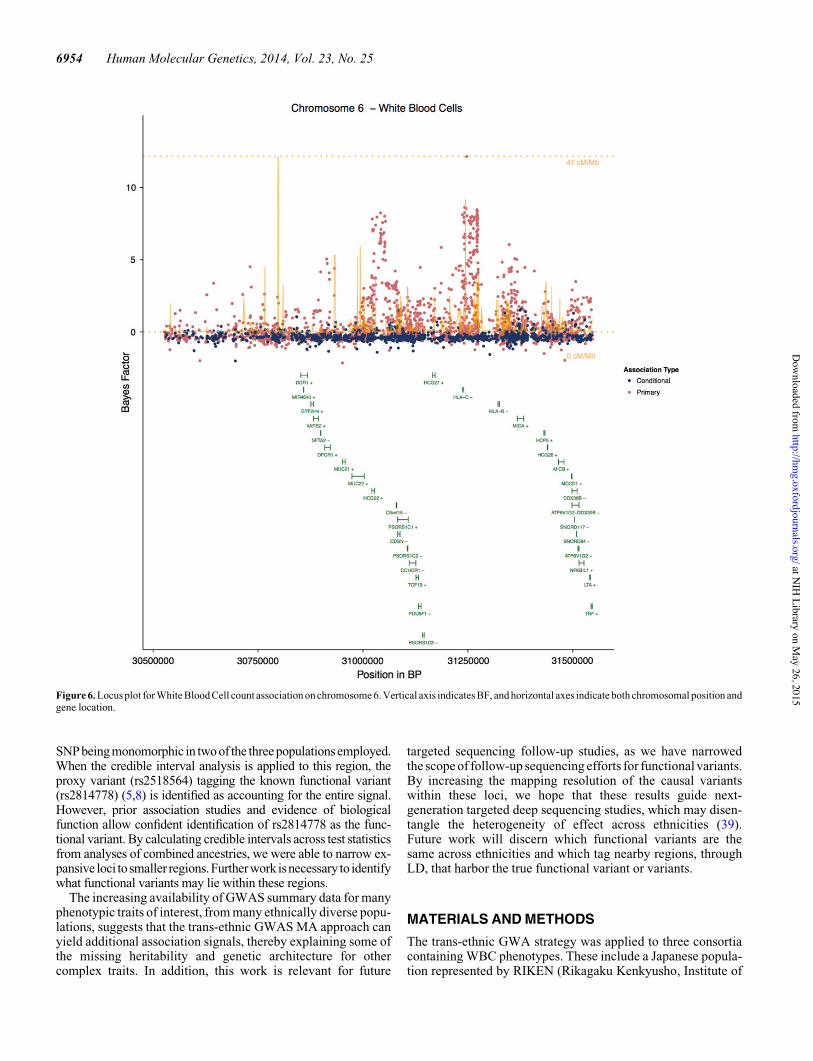
Figure 6. Locus plot for White Blood Cell count association on chromosome 6. Vertical axis indicates BF, and horizontal axes indicate both chromosomal position andgene location.
6954 Human Molecular Genetics, 2014, Vol. 23, No. 25
at NIH
Library on May 26, 2015
http://hmg.oxfordjournals.org/
Dow
nloaded from
Physical and Chemical Research, Japan), a European ancestrypopulation represented by the Cohorts for Heart and AgingResearch in Genomic Epidemiology (CHARGE) Consortiumand an African-American population represented by the Contin-ental Origins and Genetic Epidemiology Network (COGENT)Consortium (9,11,12). All three consortia contain measurementsfor total WBC count, neutrophil count and monocyte count,using the same scale of transformation and similar analytic para-digms. Clinical information of the subjects includes age, genderand smoking history, and was collected by self-report. SubjectBMI was also collected as a measure. The laboratory datainclude total WBC count and subtypes, as determined usingautomated hematology cell counters according to the standar-dized protocol. The WBC phenotypes were natural log-transformed prior to analysis to provide a normal distribution.Samples .2 SD outside of the ethnicity specific mean for thegiven phenotype were excluded. This was done to ensure
normality of the included samples, and to exclude any subclin-ical inflammation such as the common cold. If a sample wasidentified as an outlier for one or more subtype, it was excludedentirely from the study.
The RIKEN study comprises over 17 000 individuals fromThe BioBank Japan Project, which is made of up over 300 000subjects (http://biobankjp.org) (11). Samples determined to beof non-Japanese origin by either self-report or by principal com-ponents analyses (PCAs) in GWAS were excluded from furtheranalyses. For the GWAS, 592 232 SNPs were genotyped usingIllumina HumanHap610-Quad Genotyping BeadChip. Subjectswith call rates ,0.98 were removed, as were SNPs with call rates,0.99. First- and second-degree relatives were excluded basedon identity-by-descent analyses, as were SNPs with minorallele frequency (MAF) ,0.01 or with Hardy–Weinberg equi-librium (HWE) P-values ,1.00E27. After quality control, gen-otypes were imputed using MACH 1.0 in a two-step procedure,
Figure 7. Locus plot for White Blood Cell count association on chromosome 8. Vertical axis indicates BF, and horizontal axes indicate both chromosomal position andgene location.
Human Molecular Genetics, 2014, Vol. 23, No. 25 6955
at NIH
Library on May 26, 2015
http://hmg.oxfordjournals.org/
Dow
nloaded from
described in detail elsewhere (40,41). HapMap Phase II Japaneseindividuals from Tokyo (JPT) and Han Chinese individiualsfrom Beijing (CHB) individuals were adopted as references.SNPs with imputation qualities ,0.30 were excluded prior toanalyses, and genomic control was applied to the cohort-leveldata. All participants provided written informed consent asapproved by the ethical committees of the Center for GenomicMedicine, RIKEN and the Institute of Medical Science, the Uni-versity of Tokyo (11).
The CHARGE consortium dataset is comprised of over 19 000individuals from seven discovery cohorts, including: the Rotter-dam Study (RS), Framingham Heart Study (FHS), the NHLBI’sAtherosclerosis Risk in Communities (ARIC) Study, the Age,Gene/Environment Susceptibility—Reykjavik Study (AGES),Health Aging and Body Composition study (HABC), the Balti-more Longitudinal Study of Aging (BLSA) and the Invecchairein Chianti Study (inChianti) (9). Each of these studies, with theexception of the Framingham Heart Study, is comprised ofunrelated individuals of confirmed European ancestry, based onPCAs. Prior to MA, SNPs with MAF ,0.01, missingness .5%or HWE ,1.00E27 were excluded. Individuals with call rates,95% were also excluded. After quality control, genotypeswere imputed using the CEU reference panel of the HapMapPhase II haplotype data. The CHARGE consortium is comprisedof MA data resulting from the summary statistics of these indi-vidual studies. Prior to the meta- analyses, study results wereadjusted for genomic inflation factors, and SNPs with imputationquality,0.30 were excluded. Meta-analyses were performedusing a fixed-effects model in METAL (42).
The COGENT consortium is comprised of over 16 000 self-identified African-Americans from seven discovery cohorts, in-cluding: Atherosclerosis Risk in Communities (ARIC), CoronaryArtery Risk Development in Young Adults (CARDIA), JohnsHopkins Genetic Study of Atherosclerosis Risk (GeneSTAR),HealthyAging in Neighborhoods of Diversity across the LifeSpan (HANDLS), Health, Aging, and Body Composition(Health ABC), Jackson Heart Study (JHS) and the Women’sHealth Initiative (WHI) (12). SNPs were excluded from
cohort-level GWAS if MAF ,1% or missingness.5%. Mono-morphic SNPs and ambiguously mapped SNPs were alsoremoved. Individual samples exhibiting gender mismatch orgenotype missingness .10% were excluded. After qualitycontrol, genotypes were imputed with HapMap Phase II, usinga 1 : 1 mixture of the CEU and YRI reference populations.Prior to MA, SNPs with imputation quality ,0.30 were excluded.Study-specific GWA results were corrected for genomic inflationfactors, and MA was performed using a fixed-effects model inMETAL (42).
Statistical analysis
Summary statistics for the RIKEN GWAS and the CHARGE andCOGENT meta-analyses were collected and stratified by ethni-city and WBC subtype availability. Data were input into thetrans-ethnic MA software package, MANTRA (15), whichmakes use of a prior model of relatedness between studies corre-sponding to Fst, or mean effect allele frequency differencesbetween populations. Relatedness is determined by differencesin allele frequency between studies. MANTRA estimates theBF in favor of association for each SNP using a Markov chainMonte Carlo (MCMC) algorithm. Results are reported as log10
(BF), and associations of 6 or greater have the highest posteriorodds of being truly present (43,44). Posterior probability of het-erogeneity is also reported to examine levels of variation inallelic effects across the populations used in the analysis. Com-bining results across studies using a Bayesian approach is advan-tageous, as the evidence produced by this study is directlycomparable to future studies performed in the same way. Simu-lations of distinct ancestry populations show that whenMANTRA is compared with random-effects and fixed-effectsmeta-analyses, MANTRA shows increased performance andproduces the highest-powered results in the detection of novelassociations (15,22,45–47).
Since the initial imputation of the datasets used here, a numberof more comprehensive reference panels have been released in-cluding the latest HapMap release and the samples available
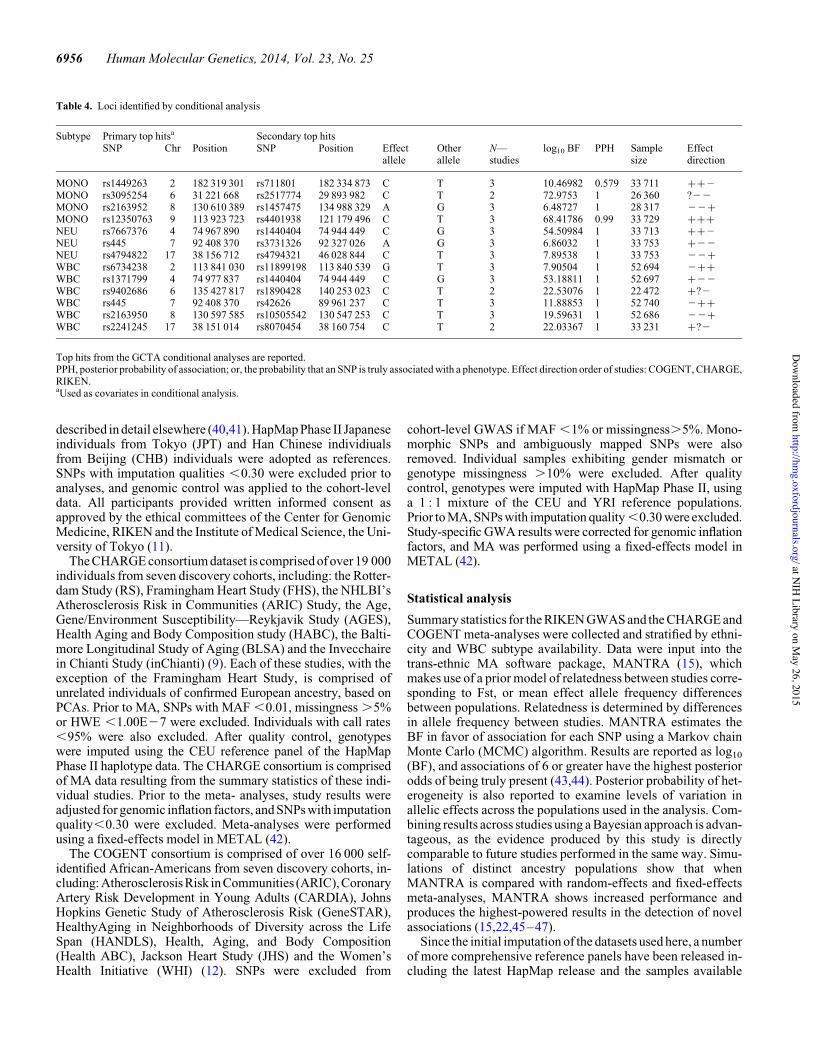
Table 4. Loci identified by conditional analysis
Subtype Primary top hitsa Secondary top hitsSNP Chr Position SNP Position Effect
alleleOtherallele
N—studies
log10 BF PPH Samplesize
Effectdirection
MONO rs1449263 2 182 319 301 rs711801 182 334 873 C T 3 10.46982 0.579 33 711 ++2MONO rs3095254 6 31 221 668 rs2517774 29 893 982 C T 2 72.9753 1 26 360 ?22MONO rs2163952 8 130 610 389 rs1457475 134 988 329 A G 3 6.48727 1 28 317 22+MONO rs12350763 9 113 923 723 rs4401938 121 179 496 C T 3 68.41786 0.99 33 729 +++NEU rs7667376 4 74 967 890 rs1440404 74 944 449 C G 3 54.50984 1 33 713 ++2NEU rs445 7 92 408 370 rs3731326 92 327 026 A G 3 6.86032 1 33 753 +22NEU rs4794822 17 38 156 712 rs4794321 46 028 844 C T 3 7.89538 1 33 753 22+WBC rs6734238 2 113 841 030 rs11899198 113 840 539 G T 3 7.90504 1 52 694 2++WBC rs1371799 4 74 977 837 rs1440404 74 944 449 C G 3 53.18811 1 52 697 +22WBC rs9402686 6 135 427 817 rs1890428 140 253 023 C T 2 22.53076 1 22 472 +?2WBC rs445 7 92 408 370 rs42626 89 961 237 C T 3 11.88853 1 52 740 2++WBC rs2163950 8 130 597 585 rs10505542 130 547 253 C T 3 19.59631 1 52 686 22+WBC rs2241245 17 38 151 014 rs8070454 38 160 754 C T 2 22.03367 1 33 231 +?2
Top hits from the GCTA conditional analyses are reported.PPH, posterior probability of association; or, the probability that an SNP is truly associated with a phenotype. Effect direction order of studies: COGENT, CHARGE,RIKEN.aUsed as covariates in conditional analysis.
6956 Human Molecular Genetics, 2014, Vol. 23, No. 25
at NIH
Library on May 26, 2015
http://hmg.oxfordjournals.org/
Dow
nloaded from
through the 1000 Genomes Project. As these reference panelscontain more individuals and greater genome coverage, more gen-otypes are predicted with greater confidence than when using priorHapMap releases. Imputing raw data to the latest release of 1000Genomes wouldbe ideal; however, due to the data-sharing require-ments of the cohorts included in this analysis, only summary statis-tics were available for these datasets. However, MANTRA is stillexpected to outperform a traditional MA in this case, as MANTRAaccounts for heterogeneity while making no assumptions aboutdifferences or similarities in allelic effect.
To quantify uncertainty surrounding the top hits from thetrans-ethnic MANTRA analysis, we calculated 95 and 99% cred-ible regions (48). We estimated credible sets of SNPs by firstdefining a 1 Mb genomic region surrounding lead SNPs(+500 kb), then ranking the regional SNPs within this regionaccording to their BF and then combining the cumulative poster-ior probabilities of these ranked SNPs until 95 and 99% confi-dence was reached.
In addition, the top hits from MANTRA were input into a con-ditional analysis in order to identify additional association signalsat nearby susceptibility loci and to determine independence ofthese secondary signals from the index SNP association. Ascomplex diseases are assumed to be influenced by two or moregenes acting in concert, it is possible that prior GWAS aimed atidentifying single loci have not detected secondary signals.Thus, when large sample sizes are available, conditionalapproaches can be useful in detecting secondary associationsignals with loci that initially appear to contribute a negligiblerisk todiseasesusceptibility. Inaddition,asevidenceofassociationis predicated on a given conditioned SNP, it is possible that, insome instances, the secondary associations are stronger thanwhat was observed in the primary single-ethnicity GWAS ana-lysis. This is possible when the allele frequencies of a given SNPare similar across ancestries, as conditional hits may be closer toa functional variant than the original, single-population hit.
We used the software program Genome-wide Complex TraitAnalysis (GCTA) v1.13 to perform conditional association ana-lysis for each ancestry-specific set of summary results (49). Asindividual genotype data were unavailable, this was performedseparately for each cohort using summary statistics and incorp-orating LD information from ancestry-matched referencesamples containing individual-level genotype data. Whenoriginal genotype data are not available, it is essential that thereference samples be from the same population as the originaldata, so that the LD structure estimated from the reference popu-lation is not biased. It is also critical that the reference sample isnot affected by cryptic relatedness or population stratification.This is particularly relevant to admixed populations, such asCOGENT, which is comprised of African-American indivi-duals. In order to avoid confounding the genetic relationshipmatrix (GRM) produced by GCTA, eigenvectors are includedin the model as covariates, to capture and account for any vari-ance that is present due to population structure (49). In thisanalysis, we used ancestry-matched subsets from the 1000Genomes Project to estimate LD structure within our samples(17). Using these samples as LD proxies, the GCTA associationanalyses were conditioned on the top hits from MANTRA,specific to each locus of interest. Independently associatedSNPs were selected using a stepwise model selection procedure.Analyses were performed separately for each ancestry cohort.
The results from each cohort were then meta-analyzed acrossethnicities.
In addition to the trans-ethnic association analysis, a second-ary analysis exploring eQTLs was performed using SNAP (50).SNAP is a web server that identifies and annotates nearby proxySNPs in LD (according to HapMap) to those queried. Usingancestry-specific tissues, SNAP was identified alias SNPs forsignificant index SNPs, and proxy SNPs in high linkage disequi-librium (R2 . 0.5). Sentinel, alias and proxy SNPs were queriedwithin a collected database of expression SNP (eSNP) results,drawn from the following leukocyte-derived tissues: fresh lym-phocytes (51), fresh leukocytes (52), leukocyte samples in indi-viduals with celiac disease (53), whole blood samples (54–56),LCLs derived from asthmatic children (57,58), HapMap LCLfrom three populations (59), a separate study on HapMap CEULCL (60) and additional LCL population samples [(61–63);Mangravite et al., unpublished], CD19+ B cells (64), primaryPHA (phytohaemagglutinin)-stimulated T cells (61), CD4+ Tcells (65), peripheral blood monocytes (27,64,66), CD11+ den-dritic cells before and after Mycobacterium tuberculosis infec-tion (67) and micro-RNA QTLs queried for LCL (68). Thecollected eSNP results met criteria for statistical thresholds of as-sociation with gene transcript levels, as described in the originalcited papers. In cases where an SNP was associated with a tran-script, we further examined the strongest eSNP for the transcriptwithin that dataset and the LD between the strongest eSNP andblood count-selected eSNPs. This was done to assess the con-cordance of the blood count and expression signals.
SUPPLEMENTARY MATERIAL
Supplementary Material is available at HMG online.
ACKNOWLEDGEMENTS
This study utilized the high-performance computational capa-bilities of the Biowulf Linux cluster at the National Institutesof Health, Bethesda, MD (http://biowulf.nih.gov).
Conflict of Interest statement. None declared.
FUNDING
Y.O. is supported by a grant from the Japan Society of the Pro-motion of Science (JSPS). The development of the softwarepackage MANTRA was supported by Wellcome Trust (grantnos WT098017, WT090532 and WT064890). S.K.G. was sup-ported in part by P30HL101290. Funding for CHARGE wasmade possible by NIA/NIH contract AG000932-2 (2009) Char-acterization of Normal Genomic Variability. The Age, Gene/Environment Susceptibility Reykjavik Study is funded by NIHcontract N01-AG-12100, the NIA Intramural Research Program,Hjartavernd (the Icelandic Heart Association) and the Althingi(the Icelandic Parliament). The Atherosclerosis Risk in theCommunities Study is carried out as a collaborative study sup-ported by National Heart, Lung, and Blood Institute contracts(HHSN268201100005C, HHSN268201100006C, HHSN268201100007C, HHSN268201100008C, HHSN268201100009C,HHSN268201100010C, HHSN268201100011C and HHSN268
Human Molecular Genetics, 2014, Vol. 23, No. 25 6957
at NIH
Library on May 26, 2015
http://hmg.oxfordjournals.org/
Dow
nloaded from
201100012C), R01HL087641, R01HL59367 and R01HL086694;National Human Genome Research Institute contract (U01HG004402) and National Institutes of Health contract (HHSN268200625226C). The authors thank the staff and participantsof the ARIC study for their important contributions. Infrastruc-ture was partly supported by grant number UL1RR025005, acomponent of the National Institutes of Health and NIHRoadmap for Medical Research. The National Heart, Lung,and Blood Institute’s Framingham Heart Study is a jointproject of the National Institutes of Health and Boston Univer-sity School of Medicine and was supported by the NationalHeart, Lung, and Blood Institute’s Framingham Heart Study(contract No. N01-HC-25195) and its contract with Affymetrixfor genotyping services (contract No. N02-HL-6-4278). Ana-lyses reflect the efforts and resource development from the Fra-mingham Heart Study investigators participating in the SNPHealth Association Resource (SHARe) project. A portion ofthis research was conducted using the Linux Cluster forGenetic Analysis (LinGA-II) funded by the Robert DawsonEvans Endowment of the Department of Medicine at theBoston University School of Medicine and Boston MedicalCenter. The Health ABC Study was supported in part by theIntramural Research Program of the NIH, National Institute onAging, NIA contracts N01AG62101, N01AG62103 and N01AG62106. The GWAS was funded by NIA grant 1R01AG032098-01A1 to Wake Forest University Health Sciences and genotyp-ing services were provided by the Center for Inherited DiseaseResearch (CIDR). CIDR is fully funded through a federal con-tract from the National Institutes of Health to The JohnsHopkins University (contract number HHSN268200782096C).The InChianti Study was supported as a ‘targeted project’ (ICS110.1RS97.71) by the Italian Ministry of Health, by the US Na-tional Institute on Aging (contracts N01-AG-916413, N01-AG-821336, 263 MD 9164 13 and 263 MD 821336) and inpart by the Intramural Research Program, National Institute onAging, National Institutes of Health, USA. The generation andmanagement of GWAS genotype data for the Rotterdam Studyis supported by the Netherlands Organization of Scientific Re-search NWO Investments (no. 175.010.2005.011, 911-03-012),the Research Institute for Diseases in the Elderly (014-93-015;RIDE2), EUROSPAN (European Special Populations ResearchNetwork; LSHG-CT-2006-01947), the Netherlands Organiza-tion for Scientific Research (Pionier, 047.016.009, 047.017.043;050-060-810), Erasmus Medical Center and the Centre forMedical Systems Biology (CMSB I and II and Grand; NationalGenomics Initiative) of the Netherlands Genomics Initiative(NGI); The Rotterdam Study is further funded by ErasmusMedical Center and Erasmus University, Rotterdam, Nether-lands Organization for the Health Research and Development(ZonMw), the Research Institute for Diseases in the Elderly(RIDE), the Ministry of Education, Culture and Science, theMinistry for Health, Welfare and Sports, the European Commis-sion (DG XII) and the Municipality of Rotterdam. Funding forCOGENT was obtained through the Broad Institute (N01-HC-65226) to create this genotype/phenotype database for widedissemination to the biomedical research community. The Ath-erosclerosis Risk in Communities Study is carried out as acollaborative study supported by National Heart, Lung, andBlood Institute contracts (HHSN268201100005C, HHSN268201100006C, HHSN268201100007C, HHSN268201100008C,
HHSN268201100009C, HHSN268201100010C, HHSN268201100011C and HHSN268201100012C), R01HL087641, R01HL59367 and R01HL086694; National Human Genome ResearchInstitute (contract U01HG004402) and National Institutes ofHealth (contract HHSN268200625226C). The authors thankthe staff and participants of the ARIC study for their importantcontributions. Infrastructure was partly supported by grant num-ber UL1RR025005, a component of the National Institutes ofHealth and NIH Roadmap for Medical Research. ARIC is alsosupported by University of North Carolina at Chapel Hill(funded by N01-HC-55015), Baylor Medical College (N01-HC-55016), University of Mississippi Medical Center (N01-HC-55021), University of Minnesota (N01-HC-55019), JohnsHopkins University (N01-HC-55020), University of TexasHouston (N01-HC-55017) and University of North Carolina(N01-HC-55018). Coronary Artery Risk in Young Adults(CARDIA): University of Alabama at Birmingham (N01-HC-48047), University of Minnesota (N01-HC-48048), North-western University (N01-HC-48049), Kaiser FoundationResearch Institute (N01-HC-48050), University of Alabama atBirmingham (N01-HC-95095), Tufts-New England MedicalCenter (N01-HC-45204), Wake Forest University (N01-HC-45205), Harbor-UCLA Research and Education Institute (N01-HC-05187), University of California, Irvine (N01-HC-45134and N01-HC-95100). Jackson Heart Study (JHS): JacksonState University (N01-HC-95170), University of Mississippi(N01-HC-95171), Tougaloo College (N01-HC-95172). HealthyAging in Neighborhoods of Diversity across the Life SpanStudy (HANDLS): This research was supported by the IntramuralResearch Program of the NIH, National Institute on Aging and theNational Center on Minority Health and Health Disparities (intra-mural project # Z01-AG000513 and human subjects protocol #2009-149). Health ABC: This research was supported by NIAcontracts N01AG62101, N01AG62103 and N01AG62106. TheGWAS was funded by NIA grant 1R01AG032098-01A1 toWake Forest University Health Sciences and genotyping serviceswere provided by the Center for Inherited Disease Research(CIDR). CIDR is fully funded through a federal contract fromthe National Institutes of Health to The Johns Hopkins University(contract number HHSN268200782096C). This research wassupported in part by the Intramural Research Program of theNIH, National Institute on Aging. GeneSTAR Acknowledge-ment: This research was supported by the National Heart, Lung,and Blood Institute (NHLBI) through the PROGENI (U01HL72518)andSTAMPEED (R01HL087698-01)consortia.Add-itional support was provided by grants from the NIH/National In-stitute of Nursing Research (R01NR08153) and the NIH/NationalCenter for Research Resources (M01-RR000052) to the JohnsHopkins General Clinical Research Center. WHI: The WHIprogram is funded by the National Heart, Lung, and Blood Insti-tute, National Institutes of Health, US Department of Health andHuman Services, through contracts N01WH22110, 24152,32100-2, 32105-6, 32108-9, 32111-13, 32115, 32118-32119,32122, 42107-26, 42129-32 and 44221. The CardiovascularHealth Study (CHS) is supported from contracts N01-HC-35129, N01-HC-45133, N01-HC-75150, N01-HC-85079through N01-HC-85086, N01 HC-15103, N01 HC-55222 andU01 HL080295 from the National Heart, Lung, and Blood Insti-tute, with additional contribution from the National Institute ofNeurological Disorders and Stroke. Additional support for this
6958 Human Molecular Genetics, 2014, Vol. 23, No. 25
at NIH
Library on May 26, 2015
http://hmg.oxfordjournals.org/
Dow
nloaded from
work was provided by NIH R01 HL71862-06 and ARRAN000949304 (to A.P.R.). Some of the results of this paperwere obtained by using the program package S.A.G.E., whichis supported by a US Public Health Service Resource Grant(RR03655) from the National Center for Research Resources.The funders had no role in study design, data collection andanalysis, decision to publish or preparation of the manuscript.Funding for RIKEN and the BioBank Japan Project was sup-ported by Ministry of Education, Culture, Sports, Science andTechnology, Japan. The funders had no role in study design,data collection and analysis, decision to publish or preparationof the manuscript.
REFERENCES
1. Ruggiero, C., Metter, E.J., Cherubini, A., Maggio, M., Sen, R., Najjar, S.S.,Windham, G.B., Ble, A., Senin, U. and Ferrucci, L. (2007) White blood cellcount and mortality in the Baltimore Longitudinal Study of Aging. J. Am.Coll. Cardiol., 49, 1841–1850.
2. Danesh, J., Collins, R., Appleby, P. and Peto, R. (1998) Association offibrinogen, C-reactive protein, albumin, or leukocyte count with coronaryheart disease: meta-analyses of prospective studies. JAMA, 279,1477–1482.
3. Shankar, A., Wang, J.J., Rochtchina, E., Yu, M.C., Kefford, R. and Mitchell,P. (2006) Association between circulating white blood cell count and cancermortality: a population-based cohort study. Arch. Intern. Med., 166,188–194.
4. Nieto, F.J., Szklo, M., Folsom, A.R., Rock, R. and Mercuri, M. (1992)Leukocyte count correlates in middle-aged adults: the Atherosclerosis Riskin Communities (ARIC) Study. Am. J. Epidemiol., 136, 525–537.
5. Nalls, M.A., Wilson, J.G., Patterson, N.J., Tandon, A., Zmuda, J.M.,Huntsman, S., Garcia, M., Hu, D., Li, R., Beamer, B.A. et al. (2008)Admixture mapping of white cell count: genetic locus responsible for lowerwhite blood cell count in the Health ABC and Jackson Heart studies.Am. J. Hum. Genet., 82, 81–87.
6. Pilia, G., Chen, W.-M., Scuteri, A., Orru, M., Albai, G., Dei, M., Lai, S.,Usala, G., Lai, M., Loi, P. et al. (2006) Heritability of cardiovascular andpersonality traits in 6,148 Sardinians. PLoS Genet., 2, e132.
7. Haddy, T.B., Rana, S.R. and Castro, O. (1999) Benign ethnic neutropenia:what is a normal absolute neutrophil count? J. Lab. Clin. Med., 133, 15–22.
8. Reich, D., Nalls, M.A., Kao, W.H.L., Akylbekova, E.L., Tandon, A.,Patterson, N., Mullikin, J., Hsueh, W.-C., Cheng, C.-Y., Coresh, J. et al.(2009) Reduced neutrophil count in people of African descent is due to aregulatory variant in the Duffy antigen receptor for chemokines gene. PLoSGenet., 5, e1000360.
9. Nalls, M.A., Couper, D.J., Tanaka, T., van Rooij,F.J.A., Chen,M.-H., Smith,A.V., Toniolo, D., Zakai, N.A., Yang, Q., Greinacher, A. et al. (2011)Multiple loci are associated with white blood cell phenotypes. PLoS Genet.,7, e1002113.
10. Okada, Y. and Kamatani, Y. (2012) Common genetic factors forhematological traits in humans. J. Hum. Genet., 57, 161–169.
11. Okada, Y., Hirota, T., Kamatani, Y., Takahashi, A., Ohmiya, H., Kumasaka,N., Higasa, K., Yamaguchi-Kabata, Y., Hosono, N., Nalls, M.A. et al. (2011)Identificationof nine novel loci associatedwith white bloodcell subtypes in aJapanese population. PLoS Genet., 7, e1002067.
12. Reiner, A.P., Lettre, G., Nalls, M.A., Ganesh, S.K., Mathias, R., Austin,M.A., Dean, E., Arepalli, S., Britton, A., Chen, Z. et al. (2011) Genome-wideassociation study of white blood cell count in 16,388 African Americans: thecontinental origins and genetic epidemiology network (COGENT). PLoSGenet., 7, e1002108.
13. Crosslin, D.R., McDavid, A., Weston, N., Nelson, S.C., Zheng, X., Hart, E.,de Andrade, M., Kullo, I.J., McCarty, C.A., Doheny, K.F. et al. (2012)Geneticvariantsassociatedwith the white bloodcell count in 13,923subjectsin the eMERGE Network. Hum. Genet., 131, 639–652.
14. Li, J., Glessner, J.T., Zhang, H., Hou, C., Wei, Z., Bradfield, J.P., Mentch,F.D., Guo, Y., Kim, C., Xia, Q. et al. (2013) GWAS of blood cell traitsidentifies novel associated loci and epistatic interactions in Caucasian andAfrican-American children. Hum. Mol. Genet., 22, 1457–1464.
15. Morris, A.P. (2011) Transethnic meta-analysis of genomewide associationstudies. Genet. Epidemiol., 35, 809–822.
16. International HapMap Consortium (2003) The International HapMapProject. Nature, 426, 789–796.
17. 1000 Genomes Project ConsortiumAbecasis, G.R., Altshuler, D., Auton, A.,Brooks, L.D., Durbin, R.M., Gibbs, R.A., Hurles, M.E. and McVean, G.A.(2010) A map of human genome variation from population-scalesequencing. Nature, 467, 1061–1073.
18. Magi, R. and Morris, A.P. (2010) GWAMA: software for genome-wideassociation meta-analysis. BMC Bioinformatics, 11, 288.
19. Han, B. and Eskin, E. (2011) Random-effects model aimed at discoveringassociations in meta-analysis of genome-wide association studies.Am. J. Hum. Genet., 88, 586–598.
20. Tian, C., Gregersen, P.K. and Seldin, M.F. (2008) Accounting for ancestry:population substructure and genome-wide association studies. Hum. Mol.Genet., 17, R143–e150.
21. Franke, A., Balschun, T., Sina, C., Ellinghaus, D., Hasler, R., Mayr, G.,Albrecht, M., Wittig, M., Buchert, E., Nikolaus, S. et al. (2010)Genome-wide association study for ulcerative colitis identifies risk loci at7q22 and 22q13 (IL17REL). Nat. Genet., 42, 292–294.
22. Dastani, Z., Hivert, M.-F., Timpson, N., Perry, J.R.B., Yuan, X., Scott, R.A.,Henneman, P., Heid, I.M., Kizer, J.R., Lyytikainen, L.-P. et al. (2012) Novelloci for adiponectin levels and their influence on type 2 diabetes andmetabolic traits: a multi-ethnic meta-analysis of 45,891 individuals. PLoSGenet., 8, e1002607.
23. Gieger, C., Radhakrishnan, A., Cvejic, A., Tang, W., Porcu, E., Pistis, G.,Serbanovic-Canic, J., Elling, U., Goodall, A.H., Labrune, Y. et al. (2011)New gene functions in megakaryopoiesis and platelet formation. Nature,480, 201–208.
24. Johansson, U., Lawson, C., Dabare, M., Syndercombe-Court, D., Newland,A.C., Howells, G.L. and Macey, M.G. (2005) Human peripheral bloodmonocytes express protease receptor-2 and respond to receptor activation byproduction of IL-6, IL-8, and IL-1{beta}. J. Leukoc. Biol., 78, 967–975.
25. Stephens, M. and Balding, D.J. (2009) Bayesian statistical methods forgenetic association studies. Nat. Rev. Genet., 10, 681–690.
26. Hamblin, M.T. and Di Rienzo, A. (2000) Detection of the signatureof naturalselection in humans: evidence from the Duffy blood group locus.Am. J. Hum. Genet., 66, 1669–1679.
27. Zeller, T., Wild, P., Szymczak, S., Rotival, M., Schillert, A., Castagne, R.,Maouche, S., Germain, M., Lackner, K., Rossmann, H. et al. (2010) Geneticsand beyond—the transcriptome of human monocytes and diseasesusceptibility. PLoS ONE, 5, e10693.
28. Maugeri, N., Powell, J.E., ‘t Hoen, P.A.C., de Geus, E.J.C., Willemsen, G.,Kattenberg, M., Henders, A.K., Wallace, L., Penninx, B., Hottenga, J.-J.et al. (2011) LPAR1 and ITGA4 regulate peripheral blood monocyte counts.Hum. Mutat., 32, 873–876.
29. Van de Veerdonk, F.L. and Netea, M.G. (2013) New insights in theimmunobiology of IL-1 family members. Front. Immunol., 4, 167.
30. Van de Veerdonk, F.L., Stoeckman, A.K., Wu, G., Boeckermann, A.N.,Azam, T., Netea, M.G., Joosten, L.A.B., van der Meer, J.W.M., Hao, R.,Kalabokis, V. et al. (2012) IL-38 binds to the IL-36 receptor and hasbiological effects on immune cells similar to IL-36 receptor antagonist.Proc. Natl. Acad. Sci. USA, 109, 3001–3005.
31. Raghuwanshi, S.K., Su, Y., Singh, V., Haynes, K., Richmond, A. andRichardson, R.M. (2012) The chemokine receptors CXCR1 and CXCR2couple to distinct G protein-coupled receptor kinases to mediate and regulateleukocyte functions. J. Immunol., 189, 2824–2832.
32. Rothmeier, A.S. and Ruf, W. (2012) Protease-activated receptor 2 signalingin inflammation. Semin. Immunopathol., 34, 133–149.
33. Shpacovitch, V., Feld, M., Bunnett, N.W. and Steinhoff, M. (2007)Protease-activated receptors: novel PARtners in innate immunity. TrendsImmunol., 28, 541–550.
34. Li, X., Ampleford, E.J., Howard, T.D., Moore, W.C., Torgerson, D.G., Li,H., Busse, W.W., Castro, M., Erzurum, S.C., Israel, E. et al. (2012)Genome-wide association studies of asthma indicate oppositeimmunopathogenesis direction from autoimmune diseases. J. Allergy Clin.Immunol., 130, 861–868.e7.
35. Zhou, Y., Jiang, X., Gu, P., Chen, W., Zeng, X. and Gao, X. (2012) Gsdma3mutation causes bulge stem cell depletion and alopecia mediated by skininflammation. Am. J. Pathol., 180, 763–774.
36. Saeki, N., Usui, T., Aoyagi, K., Kim, D.H., Sato, M., Mabuchi, T.,Yanagihara, K., Ogawa, K., Sakamoto, H., Yoshida, T. et al. (2009)Distinctive expression and function of four GSDM family genes
Human Molecular Genetics, 2014, Vol. 23, No. 25 6959
at NIH
Library on May 26, 2015
http://hmg.oxfordjournals.org/
Dow
nloaded from
(GSDMA-D) in normal and malignant upper gastrointestinal epithelium.Genes Chromosomes Cancer, 48, 261–271.
37. Day, R.B. and Link, D.C. (2012) Regulation of neutrophil trafficking fromthe bone marrow. Cell. Mol. Life Sci., 69, 1415–1423.
38. Yang, J., Ferreira, T., Morris, A.P., Medland, S.E., Madden, P.A.F., Heath,A.C., Martin, N.G., Montgomery, G.W., Weedon, M.N., Loos, R.J. et al.(2012) Conditional and joint multiple-SNP analysis of GWAS summarystatistics identifies additional variants influencing complex traits. Nat.Genet., 44, 369–375.
39. Goldstein, D.B. (2011) The importance of synthetic associations will only beresolved empirically. PLoS Biol., 9, e1001008.
40. Howie, B., Fuchsberger, C., Stephens, M., Marchini, J. and Abecasis, G.R.(2012) Fast and accurate genotype imputation in genome-wide associationstudies through pre-phasing. Nat. Genet., 44, 955–959.
41. Li, Y., Willer, C.J., Ding, J., Scheet, P. and Abecasis, G.R. (2010) MaCH:using sequence and genotype data to estimate haplotypes and unobservedgenotypes. Genet. Epidemiol., 34, 816–834.
42. Willer, C.J., Li, Y. and Abecasis, G.R. (2010) METAL: fast and efficientmeta-analysis of genomewide association scans. Bioinformatics, 26,2190–2191.
43. Lander, E. and Kruglyak, L. (1995) Genetic dissection of complex traits:guidelines for interpreting and reporting linkage results. Nat. Genet., 11,241–247.
44. Sawcer, S. (2010) Bayes factors in complex genetics. Eur. J. Hum. Genet.,18, 746–750.
45. Wang, X., Chua, H.-X., Chen, P., Ong, R.T.-H., Sim, X., Zhang, W.,Takeuchi, F., Liu, X., Khor, C.-C., Tay, W.-T. et al. (2013) Comparingmethods for performing trans-ethnic meta-analysis of genome-wideassociation studies. Hum. Mol. Genet., 22, 2303–2311.
46. Urbanek, M., Hayes, M.G., Armstrong, L.L., Morrison, J., Lowe, L.P.,Badon, S.E., Scheftner, D., Pluzhnikov, A., Levine, D., Laurie, C.C. et al.(2013) The chromosome 3q25 genomic region is associated with measuresof adiposity in newborns in a multi-ethnic genome-wide association study.Hum. Mol. Genet., 22, 3583–3596.
47. Franceschini, N., Fox, E., Zhang, Z., Edwards, T.L., Nalls, M.A., Sung, Y.J.,Tayo, B.O., Sun, Y.V., Gottesman, O., Adeyemo, A. et al. (2013)Genome-wide association analysis of blood-pressure traits inAfrican-Ancestry individuals reveals common associated genes in Africanand non-African populations. Am. J. Hum. Genet. 10.1016/j.ajhg.2013.07.010.
48. Franceschini, N., van Rooij, F.J.A., Prins, B.P., Feitosa, M.F., Karakas, M.,Eckfeldt, J.H., Folsom, A.R., Kopp, J., Vaez, A., Andrews, J.S. et al. (2012)Discovery and fine mapping of serum protein loci through transethnicmeta-analysis. Am. J. Hum. Genet., 91, 744–753.
49. Yang, J., Lee, S.H., Goddard, M.E. and Visscher, P.M. (2011) GCTA: a toolfor genome-wide complex trait analysis. Am. J. Hum. Genet., 88, 76–82.
50. Johnson, A.D., Handsaker, R.E., Pulit, S.L., Nizzari, M.M., O’Donnell, C.J.and de Bakker, P.I.W. (2008) SNAP: a web-based tool for identification andannotation of proxy SNPs using HapMap. Bioinformatics, 24, 2938–2939.
51. Goring, H.H.H., Curran, J.E., Johnson, M.P., Dyer, T.D., Charlesworth, J.,Cole, S.A., Jowett, J.B.M., Abraham, L.J., Rainwater, D.L., Comuzzie, A.G.et al. (2007) Discovery of expression QTLs using large-scale transcriptionalprofiling in human lymphocytes. Nat. Genet., 39, 1208–1216.
52. Idaghdour, Y., Czika, W., Shianna, K.V., Lee, S.H., Visscher, P.M., Martin,H.C., Miclaus, K., Jadallah, S.J., Goldstein, D.B., Wolfinger, R.D. et al.(2010) Geographical genomics of human leukocyte gene expressionvariation in southern Morocco. Nat. Genet., 42, 62–67.
53. Heap, G.A., Trynka, G., Jansen, R.C., Bruinenberg, M., Swertz, M.A.,Dinesen, L.C., Hunt, K.A., Wijmenga, C., Vanheel, D.A. and Franke, L.(2009) Complex nature of SNP genotype effects on gene expression inprimary human leucocytes. BMC Med. Genomics, 2, 1.
54. Fehrmann, R.S.N., Jansen, R.C., Veldink, J.H., Westra, H.-J., Arends, D.,Bonder, M.J., Fu, J., Deelen, P., Groen, H.J.M., Smolonska, A. et al. (2011)Trans-eQTLs reveal that independent genetic variants associated with acomplexphenotype convergeon intermediate genes,with a major role for theHLA. PLoS Genet., 7, e1002197.
55. Emilsson, V., Thorleifsson, G., Zhang, B., Leonardson, A.S., Zink, F., Zhu,J., Carlson, S., Helgason, A., Walters, G.B., Gunnarsdottir, S. et al. (2008)Genetics of gene expression and its effect on disease. Nature, 452, 423–428.
56. Mehta, D., Heim, K., Herder, C., Carstensen, M., Eckstein, G., Schurmann,C., Homuth, G., Nauck, M., Volker, U., Roden, M. et al. (2013) Impact ofcommon regulatory single-nucleotide variants on gene expression profiles inwhole blood. Eur. J. Hum. Genet., 21, 48–54.
57. Dixon, A.L., Liang, L., Moffatt, M.F., Chen, W., Heath, S., Wong, K.C.C.,Taylor, J., Burnett, E., Gut, I., Farrall, M. et al. (2007) A genome-wideassociation study of global gene expression. Nat. Genet., 39, 1202–1207.
58. Liang, L., Morar, N., Dixon, A.L., Lathrop, G.M., Abecasis, G.R., Moffatt,M.F. and Cookson, W.O.C. (2013) A cross-platform analysis of 14,177expression quantitative trait loci derived from lymphoblastoid cell lines.Genome Res., 23, 716–726.
59. Stranger, B.E., Nica, A.C., Forrest, M.S., Dimas, A., Bird, C.P., Beazley, C.,Ingle, C.E., Dunning, M., Flicek, P., Koller, D. et al. (2007) Populationgenomics of human gene expression. Nat. Genet., 39, 1217–1224.
60. Kwan, T., Benovoy, D., Dias, C., Gurd, S., Provencher, C., Beaulieu, P.,Hudson, T.J., Sladek, R. and Majewski, J. (2008) Genome-wide analysis oftranscript isoform variation in humans. Nat. Genet., 40, 225–231.
61. Dimas, A.S., Deutsch, S., Stranger, B.E., Montgomery, S.B., Borel, C.,Attar-Cohen, H., Ingle, C., Beazley, C., Gutierrez Arcelus, M., Sekowska,M. et al. (2009) Common regulatory variation impacts gene expression in acell type-dependent manner. Science, 325, 1246–1250.
62. Cusanovich, D.A., Billstrand, C., Zhou, X., Chavarria, C., De Leon, S.,Michelini, K., Pai, A.A., Ober, C. and Gilad, Y. (2012) The combination of agenome-wide association study of lymphocyte count and analysis of geneexpression data reveals novel asthma candidate genes. Hum. Mol. Genet., 21,2111–2123.
63. Grundberg, E., Small, K.S., Hedman, A.K., Nica, A.C., Buil, A., Keildson,S., Bell, J.T., Yang, T.-P., Meduri, E., Barrett, A. et al. (2012) Mapping cis-and trans-regulatory effects across multiple tissues in twins. Nat. Genet., 44,1084–1089.
64. Fairfax, B.P., Makino, S., Radhakrishnan, J., Plant, K., Leslie, S., Dilthey,A., Ellis, P., Langford, C., Vannberg, F.O. and Knight, J.C. (2012) Geneticsof gene expression in primary immune cells identifies cell type-specificmaster regulators and roles of HLA alleles. Nat. Genet., 44, 502–510.
65. Murphy, A., Chu, J.-H., Xu, M., Carey, V.J., Lazarus, R., Liu, A., Szefler,S.J., Strunk, R., Demuth, K., Castro, M. et al. (2010) Mapping of numerousdisease-associated expression polymorphisms in primary peripheral bloodCD4+ lymphocytes. Hum. Mol. Genet., 19, 4745–4757.
66. Heinzen, E.L., Ge, D., Cronin, K.D., Maia, J.M., Shianna, K.V., Gabriel,W.N., Welsh-Bohmer, K.A., Hulette, C.M., Denny, T.N. and Goldstein,D.B. (2008) Tissue-specific genetic control of splicing: implications for thestudy of complex traits. PLoS Biol., 6, e1.
67. Barreiro, L.B., Tailleux, L., Pai, A.A., Gicquel, B., Marioni, J.C. and Gilad,Y. (2012) Deciphering the genetic architecture of variation in the immuneresponse to Mycobacterium tuberculosis infection. Proc. Natl. Acad. Sci.USA, 109, 1204–1209.
68. Huang, R.S., Gamazon, E.R., Ziliak, D., Wen, Y., Im, H.K., Zhang, W.,Wing, C., Duan, S., Bleibel, W.K., Cox, N.J. et al. (2011) Populationdifferences in microRNA expression and biological implications. RNA Biol.,8, 692–701.
6960 Human Molecular Genetics, 2014, Vol. 23, No. 25
at NIH
Library on May 26, 2015
http://hmg.oxfordjournals.org/
Dow
nloaded from
Supplemental Materials Working Groups CHARGE (Cohorts for Heart and Aging Research in Genome Epidemiology) Sampath Arepalli, Stefania Bandinelli, Alessandro Biffi, Joshua C. Bis, Eric Boerwinkle, Aravinda Chakravarti, Ming-Huei Chen, Sean Chong, Josef Coresh, David J. Couper, L. Adrienne Cupples, Abbas Dehghan, Angela Do’ring, Gudny Eiriksdottir, Janine F. Felix, Luigi Ferrucci, Aaron R. Folsom, Caroline S. Fox, Timothy M. Frayling, Santhi K. Ganesh, Melissa Garcia, Stephen F. Garner, Paolo Gasparini, Christian Gieger, Nicole L. Glazer, Natalia A. Gouskova, Andreas Greinacher, Vilmundur Gudnason, Tamara B. Harris, Dena G. Hernandez, Albert Hofman, Thomas Illig, Yoichiro Kamatani, Naoyuki Kamatani, Michiaki Kubo, Brigitte Kuhnel, Vasiliki Lagou, Guillaume Lettre, Daniel Levi, JingPing Lin, Yongmei Liu, Dan L. Longo, Thomas Lumley, Massimo Mangino, Koichi Matsuda, Christa Meisinger, David Melzer, Stephan Menzel, Matt Moore, Yusuke Nakamura, Michael A. Nalls, Matthias Nauck, Christopher J. O’Donnell, Yukinori Okada, Ben A. Oostra, Willem H. Ouwehand, Kushang V. Patel, Nicola Pirastu, Giorgio Pistis, Holger Prokisch, Inga Prokopenko, Bruce M. Psaty, Alex P. Reiner, Augusto Rendon, Jennifer Sambrook, Andrew B. Singleton, Albert V. Smith, Nicole Soranzo, Tim D. Spector, Jonathan Stephens, Michael Stumvoll, Atsushi Takahashi, Toshiko Tanaka, Toshihiro Tanaka, Kent Taylor, Alexander Teumer, Swee Lay Thein, Anke To’njes, Daniela Toniolo, Tatsuhiko Tsunoda, Andre´ G. Uitterlinden, Cornelia M. van Duijn, Frank J. A. van Rooij, Uwe Vo’lker, Henry Vo’lzke, H.-Erich Wichmann, Kerri L. Wiggins, James G. Wilson, Jacqueline C. M. Witteman, Andrew R. Wood, Kazuhiko Yamamoto, Qiong Yang, Neil A. Zakai CHARGE genotyping platforms by study:
• AGES-Reykjavik Study - Illumina 370CNV BeadChip array • ARIC - Affymetrix Genome-Wide Human SNP Array 6.0 platform • RS - Illumina 550K BeadChip array • FHS - Affymetrix 500K array and an additional gene-focused 50K array • inChianti - Illumina 550K BeadChip array • BLSA - Infinium II HumanHap550 v. 1, Infinium II HumanHap550 v. 3, or a composite
of Infinium HumanHap300 and Infinium II 240S COGENT Sampath Arepalli, Melissa A. Austin, Diane M. Becker, Angela Britton, Zhao Chen, David Couper, J. David Curb, Eric Dean, Charles B. Eaton, Michele K. Evans, Aaron R. Folsom, Myriam Fornage, Santhi K. Ganesh, Struan F. A. Grant, Tamara B. Harris, Dena Hernandez, Naoyuki Kamatini, Brendan J. Keating, Michiaki Kubo, Andrea LaCroix, Leslie A. Lange, Guillaume Lettre, Simin Liu, Yongmei Liu, Kurt Lohman, Rasika Mathias, Yan Meng, Emile R. Mohler III, Solomon Musani, Yusuke Nakamura, Michael A. Nalls, Christopher J. O’Donnell, Yukinori Okada, Cameron D. Palmer, George J. Papanicolaou, Kushang V. Patel, Alexander P. Reiner, Andrew B. Singleton, Beverly M. Snively, Atsushi Takahashi, Hua Tang, Herman A. Taylor Jr., Kent Taylor, Cynthia Thomson, James G. Wilson, Lisa R. Yanek, Lingyao Yang, Elad Ziv, Alan B. Zonderman COGENT genotyping platforms by study: ARIC - Affymetrix Genome-Wide Human SNP Array 6.0 platform CARDIA - Affymetrix Genome-Wide Human SNP Array 6.0 platform GeneSTAR - Illumina BeadChip array
HANDLS - Illumina BeadChip array WHI - Affymetrix Affymetrix Genome-Wide Human SNP Array 6.0 platform HealthABC - Illumina Human1M-Duo BeadChip platform RIKEN Koichiro Higasa, Tomomitsu Hirota, Naoya Hosono, Yoichiro Kamatani, Naoyuki Kamatani, Michiaki Kubo, Natsuhiko Kumasaka, Koichi Matsuda, Yusuke Nakamura, Hiroko Ohmiya, Yukinori Okada, Atsushi Takahashi, Mayumi Tamari, Toshiko Tanaka, Toshihiro Tanaka, Tatsuhiko Tsunoda, Yumi Yamaguchi-Kabata, Kazuhiko Yamamoto Supplemental eQTL analysis We applied expression quantitative trait loci (eQTL) analysis to significant index SNPs using SNAP(18974171), and identified proxy SNPs in high linkage disequilibrium (r2>0.8). Index and proxy SNPs were searched for within a collected database of expression SNP (eSNP) results including the following tissues: fresh lymphocytes (17873875), fresh leukocytes (19966804), leukocyte samples in individuals with Celiac disease (19128478), whole blood samples (18344981, 21829388, 22692066), lymphoblastoid cell lines (LCL) derived from asthmatic children (17873877, 23345460), HapMap LCL from 3 populations (17873874), a separate study on HapMap CEU LCL (18193047), additional LCL population samples (19644074, 22286170,22941192, Mangravite et al., unpublished), CD19+ B cells (22446964), primary PHA-stimulated T cells (19644074), CD4+ T cells (20833654), peripheral blood monocytes (19222302,20502693, 22446964), CD11+ dendritic cells before and after Mycobacterium tuberculosis infection (22233810), omental and subcutaneous adipose (18344981, 21602305, 22941192), stomach (21602305), endometrial carcinomas (21226949), ER+ and ER- breast cancer tumor cells (23374354), brain cortex (19222302, 19361613, 22685416), pre-frontal cortex (22031444, 20351726), frontal cortex (20485568), temporal cortex (20485568, 22685416), pons (20485568), cerebellum (20485568, 22685416), 3 additional large studies of brain regions including prefrontal cortex, visual cortex and cerebellum, respectively (Emilsson, Cell in press), liver (18462017, 21602305, 21637794), osteoblasts (19654370), lung (23209423), skin (21129726, 22941192) and primary fibroblasts (19644074). Micro-RNA QTLs were also queried for LCL (21691150), and gluteal and abdominal adipose (22102887). The cited original papers describe the criteria of association with gene transcript levels for eSNP results. The best eSNPs associated with a transcript were further examined using DIAGRAM, and LD between the DIAGRAM-selected eSNPs and the strongest associated eSNP was compared to determine the concordance of DIAGRAM and expression signals. Supplemental Figure Legends Figure S1 - 11. Locus plots for known hits. Vertical axis indicates Bayes Factor, and horizontal axes indicate both chromosomal position and gene location. Supplemental Table Legends Table S1. Random-effects meta-analysis of MANTRA identified loci. Table S2.* Genome-wide summary statistics of the primary MANTRA analyses of Monocyte, Neutrophil, and White Blood Cell counts. Table S3. Credible regions identified from MANTRA top hits are listed. Table S4. Summarized eQTL analysis are reported. *Located as a linked file through HMG’s sharing site.
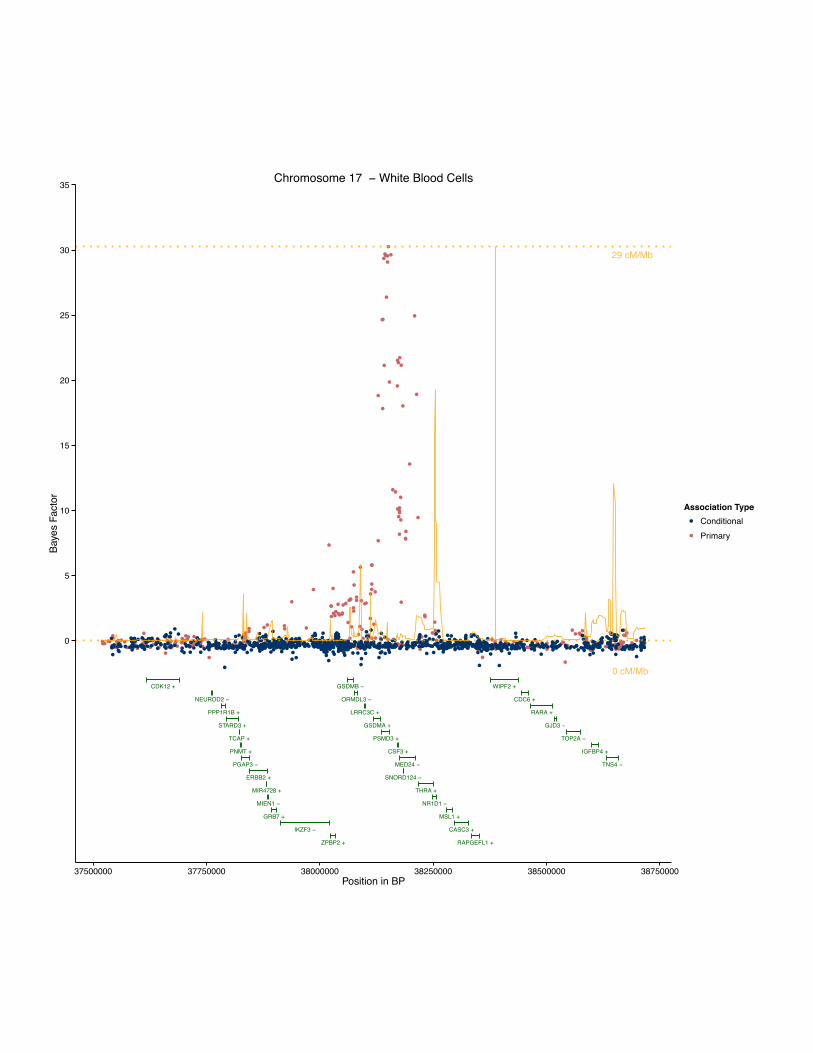
●
● ●●●●●
●
●●●
●●●●●
●●
●●
●●
●
●●●
●●●●● ●●
●●
●●●●
●●●●
●●● ●● ●●
●●● ●● ●● ●●● ●●●●● ●●● ●●●●● ●●● ●●
●● ●● ● ●●● ●● ● ● ● ●● ●● ● ●●● ●● ●●●● ●● ●● ●●● ● ● ●● ●● ●● ●●● ●●●● ● ●●● ●●● ●● ●●● ●● ●●● ● ● ●●● ●● ● ●●● ● ●● ●●● ●● ●● ● ●●● ●●● ●● ● ●●●●● ● ● ●●● ●●●● ●●● ●●● ●●● ●● ●● ●●● ● ●●● ●● ●● ●●● ● ● ●● ●●● ●●● ● ●● ● ● ●●● ● ●● ● ●● ● ●● ●● ● ●● ● ●● ● ●● ●●●● ●● ● ●● ● ●●● ● ●● ●● ●●● ● ●●● ● ●●● ●● ●● ●● ● ●●● ● ● ●●●● ●●● ●● ●●● ● ● ●● ● ● ●●●● ● ● ● ●●● ●●● ●● ●●● ● ●●● ● ●● ●● ● ●●● ●● ●●● ●●●
●●●
●●
● ●
●
●●●
● ●●●●
●● ●
●●● ●
●●
●
●●●
●
●●●
● ● ●●
●●
●
●
●● ●
●●
●●
●●
●●
● ●●
●
●●
●●
● ● ●● ●
●●
●● ●● ● ●●
●
● ●●
●●● ●●
●●
●
●
● ●●
●●● ●●●●●
●●● ●
●
●
●
●●● ●
●
●
●●
● ●
●●●
●● ●● ●●
●● ● ● ●
●●●
●
●
●●
● ●●
●●●
● ●
●●●
●
●●● ●
●
● ●●
●
● ● ●●●
●●● ●●●
●
●●
●●●●● ●
●
●● ●●
●
● ●
●
● ●
●
●● ● ●●● ●●●
●
●
●●
●● ●●●
●●●
●
●● ●● ●●●
● ●● ●●●●
●
●●
●
●
●
●
●● ●● ●●
●●● ●
●●●
●
●
●●
●●
●● ●●●●
●
●
●●
●
●
●●
●●● ●●●●
● ●●
●
●● ●● ● ● ●
●●
●
● ●●
●
●●
●
●●
●●●●● ●●● ●●
●
● ●● ●●● ●●
●
● ●● ●●
● ●●
●
●
●●●●
●
●●
●●
●
●●
●●● ● ●
●●●
●●●●●
●●
●
●●●●
●
●●●●
●●
●
●●●
●●
●●●●
●●
●●●
●
●
● ●●
●●●●●●●
●●●
● ●
●
●●
●
●
● ●●●
● ●● ●● ●
●●●
●
●●
●● ●
●●
●● ●● ●●
●●●●
●
●●●●● ● ●●● ●
●
●●
● ●
●
●●●●
●
●
●● ●● ●
● ●●●●●
●●
●●● ●●●●
●
●
●●
●●●
●●●● ●●●
●
●● ●●●● ● ●
●
●
●
●
●● ● ● ●
●●
●
● ●● ●●
●
●●●● ● ●
●●●●
● ● ●● ●●●● ●
●
●● ● ●●● ● ●●
●●●
●●● ● ●
●●
●●●●●
●●●●
●●● ●●●
●●●●●
●
●
●●●
●
●●●●
●●●●●
●●●
●
●●●●●
●●
● ●●●
● ●●
●●
●
●●
●
●●●●●●●
●
●●●●●●●● ●
●●●
●●
●
●●
●
●
●●●●●●
●●●● ●
●●●●
●●●●●●●
● ●●●●●
●●●●●●●●●●
●●●
●●●●●
●
●●●●●
●●●●●●●
●●●●●
●●●●●
●
●
●●● ●●
●●●●●●●
●●●
●●●
●●●●●●
●
●●●●
●
●●●●
●
●●
● ●● ● ●● ●● ●
●● ●
●●●●
●
●●●
●
●●●
●●●●
●
●●●
●●●
●●
●●●●
●●●
●
●●●
● ●●●●●●
● ●●●●●●●● ●● ●●●
●●● ●
●●
●
●●●●
●●●●●●●●●●●
●● ●●●
● ●
● ●● ●●●
●
●●
●
●
●●
●●●●●
●
●●●●
●●● ●●●
●●
●
●
●
●●
●●
●●●
●
●●
●●
●●
●● ●●
●●● ● ●
●
●●●●●
●
● ●● ●● ●●●
●●
●●
●
●
●●
●
●●● ●
●●
●● ●
●
●
●●●●
●●● ● ●
● ●● ●
●
●
●
●●● ●●
●●
●
● ●
●
●●●●
●
●
● ●●
●
● ●
●● ●
●
●
●● ●● ● ●
●●
●●
●
●
●● ●● ●● ●●●●
●●●
●
●● ●● ●
●
●●
● ● ●● ●●●
●
●
●
●
●
●●●
●●●● ●
●●
●
●
● ●●●
● ● ●●●
●●●
●
●●●
●
●●
●
●
●●
●● ●●
●
●●●●●●
●
●
●●●
●●
●
●
●●
●
●
● ●●●
●●
●●● ●●
●●●
●●●● ●●●
●●●
●
● ●● ● ●●
● ● ●● ●
●
●● ●
●
● ●●●
●● ● ●●
● ●●●
0 cM/Mb
29 cM/Mb
CDK12 +
NEUROD2 −
PPP1R1B +
STARD3 +
TCAP +
PNMT +
PGAP3 −
ERBB2 +
MIR4728 +
MIEN1 −
GRB7 +
IKZF3 −
ZPBP2 +
GSDMB −
ORMDL3 −
LRRC3C +
GSDMA +
PSMD3 +
CSF3 +
MED24 −
SNORD124 −
THRA +
NR1D1 −
MSL1 +
CASC3 +
RAPGEFL1 +
WIPF2 +
CDC6 +
RARA +
GJD3 −
TOP2A −
IGFBP4 +
TNS4 −
0
5
10
15
20
25
30
35
37500000 37750000 38000000 38250000 38500000 38750000Position in BP
Baye
s Fa
ctor
Association Type●
●
ConditionalPrimary
Chromosome 17 − White Blood Cells
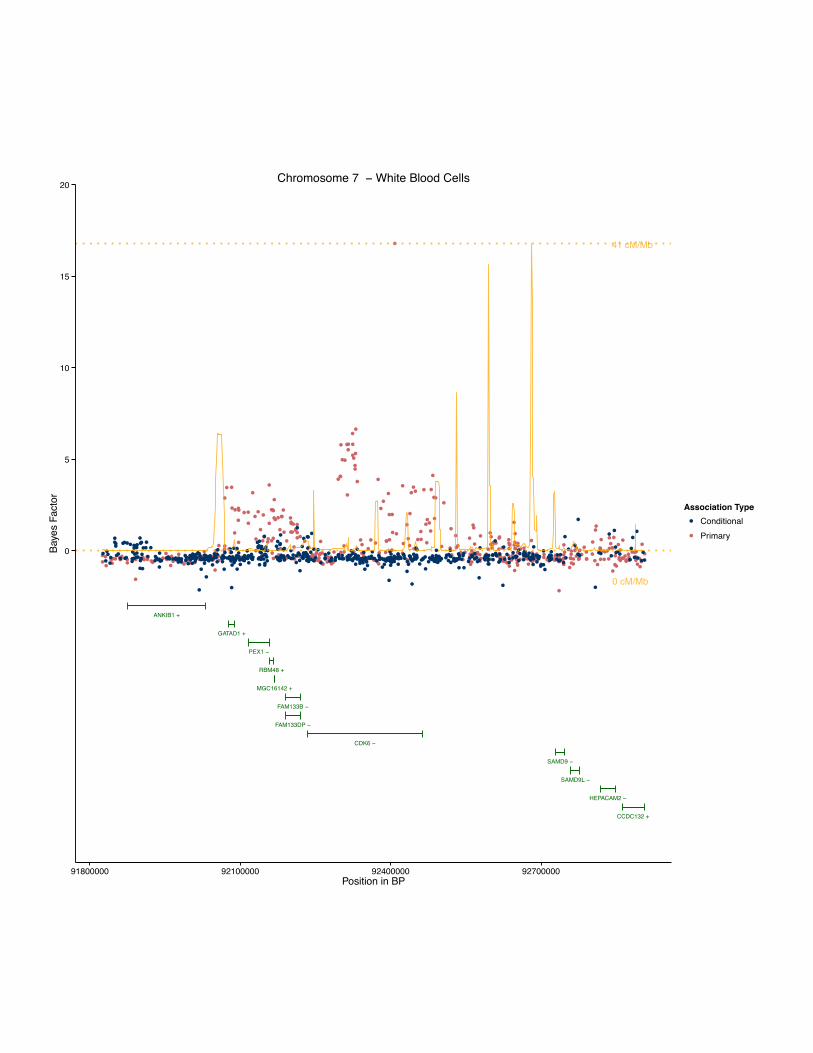
●
●●
●●●●●
●●●●●●●
●●●● ●●
● ● ●●● ●●●●● ●●●●● ● ● ●
● ● ●●● ● ●● ●●●● ●●●● ●● ●● ●● ●● ●● ● ●●● ● ●● ●● ● ● ●●●●● ● ●● ●●●●● ●● ●● ●● ● ●● ●● ● ●●● ●●● ●●● ●● ●●●●● ●●●● ● ●●● ●● ●●● ●●● ● ● ●●● ●●●● ●● ●● ●●●● ● ● ●●● ●● ●● ● ●●● ● ●●● ●●●● ●● ●● ● ●● ●●● ●● ● ●●●● ●● ● ●●●● ●●●●● ● ●●● ●● ●● ● ●● ● ●● ● ●●●● ● ●● ●● ● ●●● ● ● ●●● ● ●● ●●●●●●●● ●●● ●●●● ●● ● ● ●● ●●● ●●● ●●● ●●●●● ●● ● ●● ●●● ● ●●● ●● ● ●●● ●● ●●● ● ● ●●● ●●● ● ● ●●● ●● ●●● ● ●● ● ● ●● ●● ●● ●●● ●● ●● ●●●● ●●● ●● ● ●●● ●● ●●● ● ●● ●●● ●●● ●● ● ● ●●● ●● ● ●●● ● ●●● ● ●● ● ●●● ● ●●●●● ●●● ●● ●● ● ●●● ● ●●● ● ● ●● ● ●● ● ●● ●● ● ●●●● ●● ●● ●●● ● ●● ●● ●● ●●●● ●● ● ●● ●● ● ●● ● ●●● ● ●● ● ●● ● ● ●● ● ● ●●●● ●● ●●● ● ●
●
●
●●
●● ● ●
●
●●●
●● ● ●●●
●
●
●●
●
●
●
●
●
●●
●
●
●● ●
●
● ●●●
● ● ●
●●
●
●●●●
● ●●● ● ●
●●
●●
●
●
●
●
●
●
●● ● ●
● ●●
● ●
●
●●
●●
●
● ● ●●● ●●●
●●
●●●
●●
●
●
●
●
●●
● ●●●
● ●
●
●●●
●
●●
●●●●
●●●
●●
●●
●● ●●
●●
● ● ●●
●
● ●
● ●●
●
●●●
●
●
●
●
●●●
●
● ●●
●
●
●
●
●
●
●●
●● ●●
●●
●
●
●
●
●
●●
●
●
●●
●●●
●●●
●
●
● ●●●●
●●●●
●●
●● ●●●
●● ●
●
●
●●
●
●●●●
●
●●●●
●
●
●●
●
●●● ● ●●
● ●
●
●●●
●●● ●
●●● ●●●
●
●● ●●
●●● ●● ●●● ●
●●● ● ●
●● ●
●
●●
●
●
●●
●●
●●
●●
●
●
●
●
●●●
●
●●● ●
●
● ● ● ●●●
●
●
●●●
●●●●
●●●
●●●●
●
● ● ●
●
●
●●●
●
●● ●●● ●●● ●●
●
●
●
●
● ●● ●●●
●
●
●●●●●
●
●
●
● ●●
●●
●●
●● ●●●
●
●
●●
●●
●
●
●
●●●
●● ●
●●● ●●
●
●
●● ●
●
●
●
● ●●
● ●●
●
●
●
●●
●●
● ●●
●
●
●●●● ● ●
●●
●●
●●●●
●
● ● ●●
●● ●
● ●
●●
●
● ● ●●
●
●
● ●● ●●
●● ● ●
●
●
●●●
● ●
●
●●●● ●
●
●●
● ●●●
●
●
●
●●●
●● ●
●
●
●
●●●
●
●
●●
●●
●●●●
●
●●●
●● ●●
●●
●●
●
●
●
● ●●
●
●
●●
●
●
●●
●
●
●
●●
●●
●●● ●
●
●● ●●
●
●
●
●
●
●
●●●●●
●
●●
● ●●
● ●● ●
●
●
●
●
● ●●● ● ●●
● ●●●
●●
●
0 cM/Mb
41 cM/Mb
ANKIB1 +
GATAD1 +
PEX1 −
RBM48 +
MGC16142 +
FAM133B −
FAM133DP −
CDK6 −
SAMD9 −
SAMD9L −
HEPACAM2 −
CCDC132 +
0
5
10
15
20
91800000 92100000 92400000 92700000Position in BP
Baye
s Fa
ctor
Association Type●
●
ConditionalPrimary
Chromosome 7 − White Blood Cells
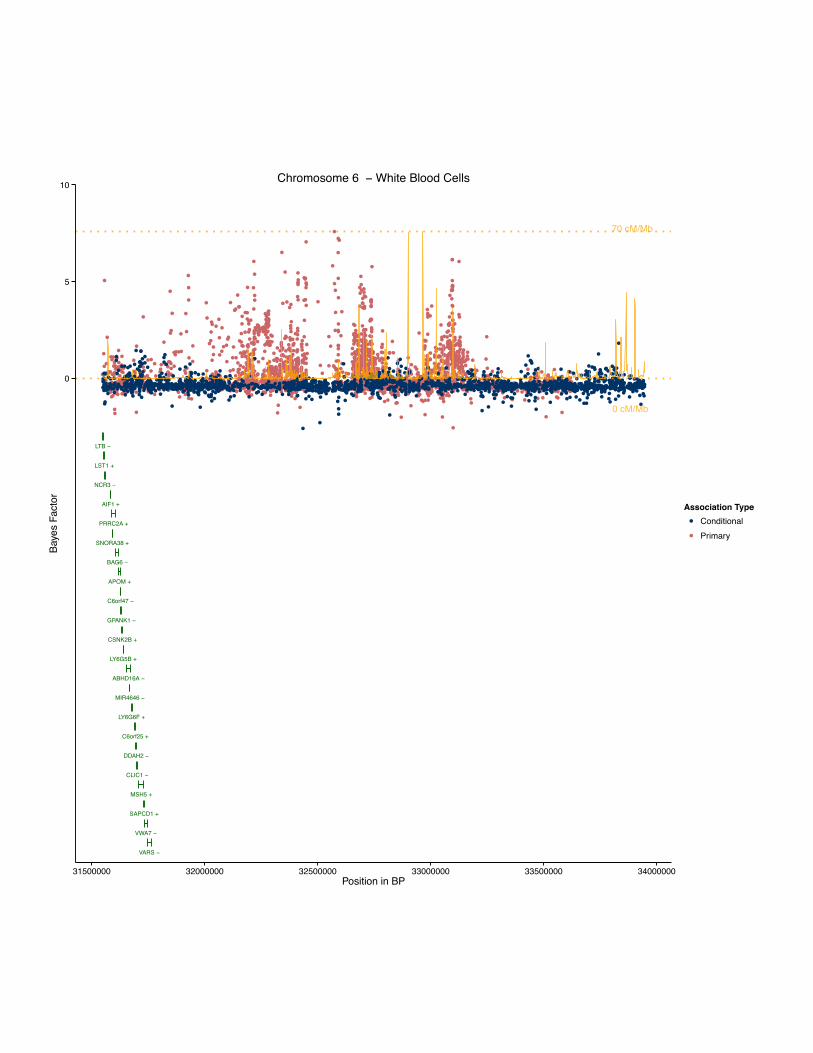
●
●●●
● ●
●●● ●● ●
● ●●● ●●● ●●●● ●●● ● ●●● ● ●●●●● ●●● ● ●●●● ●●● ●●● ●● ●● ●● ● ●●● ●● ●● ● ●●●● ●●● ●● ●● ● ●● ●● ●● ●●● ● ●●●● ●● ● ●● ●●● ●● ●● ●●● ●●●●●● ● ●●● ●●●● ●● ● ●●● ● ●● ●● ●●● ● ●● ●●●● ● ●●● ● ●●●● ●●● ●●●● ●●●●● ● ●●● ●●●● ●●● ●● ●● ● ●●● ●●● ●●● ● ●● ●● ●● ● ●● ● ●●● ●● ● ●● ●● ●●● ● ●● ●● ●●● ●●● ● ●● ● ●●● ●● ● ●●● ●●●● ●● ●● ●●● ●●● ● ●● ●● ●●● ●●● ●● ●● ● ●●● ●●●● ● ●●● ●●● ●● ●●●● ● ● ● ●●● ●●● ● ● ●●●● ● ●● ●● ● ●● ●●● ●●● ● ● ●●● ● ●● ●● ●● ●● ●● ●● ● ●●● ● ●●● ● ●●● ●●● ● ●●● ●●●● ●● ●● ●● ● ●● ●●●●● ● ●● ●●● ● ● ● ●● ●● ●● ●●● ● ●●●● ● ●● ●●●● ● ●● ● ●●● ●● ●● ●●● ● ●● ●●● ●●● ●● ●● ●●●● ● ●●●● ●● ●● ●● ●● ●● ● ●●● ● ●● ●●● ● ●● ● ● ●● ●●● ●●●● ●●● ●● ●● ● ● ●●●●●●● ●● ●●●● ● ●● ●● ●● ●● ●● ●● ●● ● ● ●● ● ●● ●● ● ●●● ●● ●●● ●● ●●● ●● ●● ●●●● ●● ● ●● ●● ● ●● ●●● ●● ●● ●● ●●●●●●●● ● ●● ● ●●● ● ●● ● ● ●● ● ●● ●● ●● ●●● ●● ●● ●●●● ● ● ●● ● ●● ●●●● ●● ●● ●● ●● ● ●● ●● ●● ●●●● ●● ●● ●●● ● ● ●● ●●●● ● ●●●● ● ●● ●● ●● ●● ●● ●● ● ●●●● ●●● ●● ● ● ●●● ● ●● ●● ●●●●● ● ●● ●● ●●● ● ●● ●● ● ●● ● ●●●● ● ● ●● ●●●● ● ●● ● ●● ● ●●● ●●● ●● ●●● ●● ●●● ●● ●●● ●● ● ●● ● ●● ● ●●●● ●● ●● ● ●● ● ●●●●● ●● ●●● ● ● ●● ●● ●● ●● ●●● ●●●● ●● ●● ●●● ● ●●●● ● ● ●●● ●● ●●● ● ●●● ● ●●● ●●● ●●●● ● ●●●● ● ●●●● ●●● ●● ● ●●●● ● ●● ●●● ● ●●●● ●● ●●● ●● ●● ● ●●● ● ●●●● ●● ●● ●● ●●● ●●● ● ● ●●● ● ●● ●●● ●● ●● ● ● ●●●● ●● ●● ● ●● ●●● ●●●● ●● ●●● ●● ● ●● ● ●●● ●● ● ● ●● ●●●● ● ●● ●●● ●● ●● ●● ●● ●●● ●● ●● ●●● ●●● ●●●● ● ●●● ●● ●● ● ●● ●●● ● ●●●●●● ●● ●●● ●●● ●● ●●●● ●●● ●●● ●●● ●● ●● ●●●● ●● ●● ●●● ● ●● ● ● ●●● ●● ●● ● ●●●●● ● ● ●●● ● ● ●● ●●● ●● ●●● ●●● ●●● ●●● ● ● ●● ●● ●● ●● ●●● ●●● ●●●● ●●● ●● ●●● ● ●●●●● ● ●● ●●●● ●●● ●● ● ●● ●●●●●● ●●● ●● ● ●● ● ●●●● ●● ● ●●●● ●● ●● ●● ●● ●●●● ● ● ● ●●● ●● ●● ●●● ● ●●● ●● ●●● ●● ●●●● ●●● ●● ●● ● ●● ●● ●● ●● ●● ●● ●●● ● ●●● ●● ● ●● ●● ● ●● ●●● ● ●● ●●● ● ●● ● ●●● ●● ● ●● ●● ● ●●●●● ●●●● ●● ●●● ●●● ●● ●● ● ● ●● ●●● ●●● ●●● ●●●● ●● ●● ● ●● ●●● ●●● ●● ●●● ●●● ●●● ●● ●●● ●● ●●● ●● ● ●●●● ●● ● ●● ●● ●●●● ● ●● ●●● ●● ● ●● ● ●● ●● ●● ●●● ● ●●● ●●● ●● ●● ●● ●● ●● ●● ●●● ●●●● ●●● ● ●● ●● ●●● ●●●● ●● ●●●● ●● ●●● ●●●● ●● ●● ● ● ●● ●●● ●●●● ● ●●● ● ●●● ●● ●●● ●● ●● ●●● ●● ● ●●●● ● ●● ●● ●●●●● ●●●● ●● ● ●● ●●●● ●●● ●● ●●● ● ●● ●● ●● ●● ●● ●● ●●● ●● ●● ● ● ●● ● ●●● ●●● ●● ●●●● ● ●●● ●● ●● ●● ● ●● ● ● ●●● ● ●●● ● ●●●● ●● ●●●●● ● ●● ● ●● ●● ● ●●●● ●● ● ●● ●● ●●● ●●●● ●● ●● ●● ●●●● ●● ●● ●● ● ●●● ●●● ●●●●● ●●●● ● ●●●● ● ●● ● ●●● ●● ●● ●● ●● ●● ● ●●●●● ●● ●● ●● ● ●● ●● ●● ● ●● ●● ●●●● ● ●● ●● ● ●●●● ● ● ●●● ●● ●● ●● ●● ● ●● ●● ●● ● ● ●● ●●●● ●●●● ●● ●●●●● ●●●● ●● ● ●● ● ●● ●● ● ● ●●●● ●●●● ●● ● ●● ●● ●●● ●● ●● ●● ● ● ● ●● ●●● ●●● ● ●● ● ●●● ● ●● ● ●●●● ●● ●●● ●● ●● ●● ●● ●● ●● ● ●●● ●● ●●● ● ●● ●●● ●●● ● ● ●● ●● ● ●●●● ●●● ●●● ● ●●● ●● ●● ●●● ●● ● ●● ●● ●●● ● ● ●● ●● ●● ● ●●● ●● ● ●●● ● ● ●●● ● ●●● ●● ●● ● ● ●● ●●● ●● ●●●● ●● ●● ● ● ● ●● ●●● ●●● ●●● ●●● ●● ●● ● ● ●● ● ● ●●●● ●●●● ●● ●● ● ●● ●●● ● ●● ●● ●● ● ●●●● ● ●●● ● ● ●● ●● ●●●● ●● ● ● ●●● ● ●●● ●● ●●● ●●● ●●● ● ●●● ●●● ●● ●●● ●●● ● ●●● ●● ●● ●●● ●●● ●● ●●● ● ●●●● ●● ●●●● ●●● ●●● ●● ●● ●● ●●●● ● ● ●●● ●●● ● ●● ● ● ●●●● ●●● ●● ● ●● ● ●● ●● ●● ●● ●● ● ●● ● ● ●● ●● ●● ●●● ●● ● ● ●● ●● ● ●●● ●● ● ●● ●●● ●● ● ●● ●● ● ● ●● ● ● ●● ● ● ●● ● ●● ●● ● ●●● ●● ● ●●● ●● ● ● ●●● ● ● ●●● ● ● ● ●●● ●● ●● ●● ● ●● ●● ●● ●●● ●●● ●●● ●● ●●● ●●● ●● ● ●● ●● ● ●● ●● ● ● ●● ●● ● ● ●● ●● ●●● ● ●● ●●● ●●●● ●●● ● ● ●●● ● ●●● ●● ●● ●● ● ●●●●●●● ●● ●● ● ●● ● ●● ● ●● ●● ● ●● ●● ●●● ●● ● ● ●●● ●●● ● ●● ●● ●●● ●● ●●● ●● ●● ●● ●●●●● ●● ● ●● ● ●●● ●●●● ● ●●● ●●● ●● ● ●●● ● ●●● ●● ● ●● ●● ●● ●●●●● ● ● ● ●● ●●● ●●● ●● ●● ●● ●● ● ●● ●●●●● ●● ● ●●● ●●●● ● ●● ●● ●● ●●● ●● ●●● ●●● ●● ●● ●●●● ● ●● ●● ● ●●● ● ●● ●●● ● ●● ●●● ● ● ●● ● ● ●●● ●● ●●● ●●● ● ●● ●● ● ●● ● ●●●● ●● ●● ●● ● ●● ●● ●● ●●● ● ●● ●● ●●● ●●● ●● ●● ●● ●●● ●● ● ● ●● ●● ●● ●●● ●● ●● ●● ●●● ●● ●● ● ●● ●● ●● ●● ●●●● ●●● ● ● ●●●●● ●● ●● ● ●● ●●●●●● ● ●●● ● ●● ●● ● ●● ● ●● ●● ●●● ●● ● ●● ●● ●● ●● ●●● ● ●●●●● ●●●● ● ●●● ●●● ●●●● ●● ●●●● ●● ●● ● ●●● ●● ● ●●● ●●● ● ●●● ●●●●● ●●●● ●● ●● ●●● ● ●●● ● ●● ●●●● ●● ● ●●● ● ●●● ●● ●● ●●● ●● ●●●● ●● ● ● ●● ● ●● ●● ●● ●● ●●● ●● ● ● ●● ●●● ●● ●●● ● ●●●●● ●● ●● ●●● ●● ●● ●●● ● ●●● ● ●● ●●● ● ● ● ● ●● ●● ●● ●●●● ●● ●● ●●● ●●●● ●● ●● ●● ● ●● ●● ●●● ●● ●●●● ●● ●●● ●●●● ● ● ●● ●● ●● ●●● ● ●● ●● ●● ● ●● ● ●● ●● ●● ●●● ●● ● ● ●● ●●● ● ●● ● ●● ● ●● ●● ●●● ● ●● ●● ●● ●●● ●● ●● ●● ●● ●● ●●● ● ● ●● ● ● ●●● ●●●● ●● ●● ●●● ●● ●● ●●● ● ●●●● ● ●● ●●● ●● ●● ● ● ●● ●● ●● ●● ●●●● ● ● ● ●● ●● ●●● ● ●● ●●● ●● ●●● ● ● ●●●● ●● ●● ●● ●●● ●● ● ● ●●● ●● ●● ● ● ●●● ●●●● ● ●● ● ● ●● ● ● ●●●● ●●● ● ●● ● ●● ●● ● ●●● ●●● ●●● ●●● ● ●● ●●● ●●● ●●● ● ●●●●● ● ● ●● ●● ●● ● ●● ● ●● ●● ● ●●● ● ●● ● ●●● ●● ●●● ●●● ● ●● ● ●● ● ●●●● ●● ●●● ●●●● ●●● ● ●●●
●
●
●
●
●
●
●●
●
●
●
●●
●
●
●
●
●●●
●
●●●
● ●●
●
● ●●●
●
●
●
●● ●●
●● ●
●●
●●●
●
●
●
● ●●● ●
●
●●●●
●
●●
●●
●
●
●●●●●
● ●●
●
●
●●
●●●●●●●● ● ●
●
●
●●
●
●
●
●
●● ●
●●
● ●
●
●
●● ● ●● ●
●
●●●●● ●●●● ●●
●
●●
●●
●●●●●
●●● ●●
●
●●● ●
●
●
●
● ●● ●● ●
●
●
●
●●
●
●●●
●●
●
●
● ●●
●
● ●●
●● ●● ●
●●
●
●●
●●
●
●
●
●
●●●●
●
● ●
●
●●
●●●
●●
● ● ● ● ●●●●●
●
●
●
●
●
●●●
●
● ●● ●●●
● ●●
● ●●●●● ● ●●●
●
●
●●
●
●
● ●● ●
●
●
●
●●
●
●●
●●
●●
●●
●●
●
●●●
● ●●
●
●
●
●
●
●●●
●
●●
●
●●●●●●●
●●
●
●
●●
●●
●
●●
●
●
●●●
●
● ●●
●
●
● ●●
● ●
●● ●
● ●
●●
●
●
●
●●
●
●●
●
●●
●●● ● ●●
●
●●● ●●
●
●
●
● ●● ●
●
●● ●●
●●
●
●●●●
●
●
●
●
●
●●
● ●●●
●●●
●● ●●
●●
●
●●
●●
●● ●
●
●● ●●●
●
●
● ●●
● ●
●●●
● ●●
●
●● ●●
●●
●
●
●●
●●
●
●
●●
●
●●●
●
●●●●
●
●●●
●
●●● ●●
●●
●●
●
●
●
●●
●● ●
●●
●
●● ●●● ● ●
●
●● ●
●
●
●
●
●●●
●●
●●
● ● ●●
●●●
●●●
●
● ●
●● ●●
●
●
●●●
●●
● ●
●● ●
●
● ●● ●●
●
●
●●
●●
●●
●●
●● ●●
●
●●●
●
●
● ●●●
●●
●
●
●
●●●
●●
●●● ●
●
●
●
●●
●
●
●
●
● ●
●
●
●
●
●
●●●
●●
●
●●●●
●●●
●
● ●●
●
●●
●
●●●●
●●●●●
●
●
●●●
●●●
●●●
●
●
●●
●●●
●●
●
●● ●● ● ●
●
●
●
●
●
●●
●
● ●●
●
●
●● ●●
●
●
●
●
●●
●● ●●●●
●
●
●●
●
●●●
●●
●●●
●●
●
● ●
●
● ●●●●
●●●●
● ●●●
●
●●
●●
●●
●●
●●
●●
●●
●
●
●●
●●●● ● ●● ●
●●●
●
● ●
●●
● ●●
●
●●●
● ●●●● ●
●
●
● ●
●
●
●
●
●●●
●
●●
●●●●
●
●
●●
●●●●
●●
●● ●
●
● ●●
●
●
●
●
●
●
●●
●
●●● ●●
●●●
●●
●
●●
●● ●●
●● ●●●
●
●
●
●● ● ●
●
●●● ●●
●●
●●
●●● ●●●
●●●●
●●
● ●●
●
●● ●
●
●●
● ●●
●
●●●●●
●●
●
●
●●●
●
●
●●●
●
●
●
●
● ●
●●
●
●● ●
●●
●
●
●
● ●
●
●
●●● ● ●
●
●●
●● ●●●
●●
●● ●
● ● ●●●●
●
●●
● ●
●
●●
●
●
●●
●●
●
●●
● ●● ●●
●
●● ●●●
●
●●●●
●
●●●● ●
●
●
●● ● ●
●
●●●
●●
●●
●
●
●
●
●●●
●●
●●● ●
●
●●
●
●●
●
●
● ●● ● ● ● ● ●●
●
● ●● ●●●●●●
● ●● ●
●
●●●●●●
●●
●
●●●
●
●
●
●
●●●
●
●
●●●●
●●●
●
●●●●
●
●● ● ●●●
●● ●●
●
●●●●
●●●
●
●
●●●●
●
●
●
●
●●
●
●
●●●
●●
●
●●●●●
●
●
●
●●
●●●●●●●●●
●●●●
●●●● ●●●
●●●●●
●
●
●
●
●
●
● ●● ●
●
●●
●●●●● ●
●● ●
●
●
●
●● ●●●●
●●●●
●
●
●●●●●●
●
● ●●●●
●
●●
●
●
●●●●●
●●
●●●
● ●●●●●●●●●●●● ●
●
●●●●
●
●
●
● ●●
●
●
●
●
●●●●●●
●
●●
●
●●●●●●
●
●
●●
●●
●
●●●
●
●● ● ●
● ●●●●
●
●●
●
●● ●●
●
●
● ● ●●●●
●● ●
●
●● ●● ●●● ●●
●● ●●
●
● ●●●●● ●●
●●
●
● ●● ●
●
●
●●● ●●
●
●
●
●
●
●●●
●●
●
●●
●
●
● ●●
●●
●
●● ●●●
●
● ●●
●
●
●● ●● ●
●●
●
●●
●
●
●●● ●
●
●● ●
●●
●
●
● ●
●
●●
●
●
●
●
●
●
●●
●●●
●
● ●●●
●● ●
●
●
●●
●
●●
●● ● ●● ●
●●●● ●
●
●
●●●●●
●
●●
●●
●●
●●
●
●
●
● ●
●●
●
● ●●●
●●●●
●
●
●● ● ● ● ● ●●
●
●●
●
●●
●●● ●
●
●●
●
●
●●
●
● ●● ●● ●
●
●●●
●● ●
●●●
● ● ●●
●●
● ●●●●●● ●
●
● ●●
●
●
●●●
●●●
●● ●●●●
●●●●
●●●
●●●
●●
●●
●●
●
●●
●●●●
●●●
●
●●
●● ●
●● ●
●●
● ●
●
●●● ●
●
●●●●●●
●
●
●●● ●
●●● ●
●●
● ●●●
●
●
●●●
●
●●
● ●
●
●●
●● ●●
●
● ● ●●
●●●
●●●
●●●
●
●
●●
●
●●
● ●●
●●
●●●●
●
●
● ●●
●●●
●
●●
●
● ●● ●
●● ●
●●
●●
●●●
●
●● ● ●
●
●● ●
●
● ●● ●● ● ●●
●● ●
●
●●
●●
●
●●
●● ●●●
●●
●
●● ●
●
●
●
●
●● ●
●●
●
●●
●●●● ●●●
●
● ● ●●
●●
●● ●● ●
●
●●
●●●
●● ● ●●●●
●
●
●●●●
● ●
●
●●
●●
●
●●●●
●
●●●
●
●
●● ●●●●●●●
●● ●
●● ●
●●
●
●● ●
●● ●●
●●●● ● ● ●●●
●
●
●● ●
●
●
●
●● ●
●
●●●●
●●
●
●
●●
●
●
● ●●●
●●
●
●●● ●●●
●
●
● ●●●
●
●● ●●
●●
●
●
●●
●●●
●● ●●
●●●
●
●●
● ●●●● ●● ●● ●
●
●●
●●
●●●
●
●●
●●●
●
●
●●
●
● ● ●●●
●●
●●
●●
●
●
●●
●● ●●
●●● ●
●●
● ●
●
●●
●● ● ●●● ●
●
● ● ●
●
●
●
●
●
●●
●● ●●● ●
●
● ● ●●
●
●●●●
●
●● ●● ●● ● ●
●
●●
●●
●
●
●●●
●●
●
●● ●
●●●
●●●●● ●●
●
●●●
● ●
●●●
● ●● ●● ●
●
●●
●
●●
●●
●●
●●●
●
●
●
●●
●●
●●
●●
●
●●
●●
●
●
● ●●●● ●
●●
●
●
●
●● ●●●
●●● ●
●
●
●●
●
●
●●●
●
●
●
●
●●●
●
●●
●
●● ●●●
●
●
●● ●
●● ●
●
● ●
0 cM/Mb
70 cM/Mb
LTB −
LST1 +
NCR3 −
AIF1 +
PRRC2A +
SNORA38 +
BAG6 −
APOM +
C6orf47 −
GPANK1 −
CSNK2B +
LY6G5B +
ABHD16A −
MIR4646 −
LY6G6F +
C6orf25 +
DDAH2 −
CLIC1 −
MSH5 +
SAPCD1 +
VWA7 −
VARS −
0
5
10
31500000 32000000 32500000 33000000 33500000 34000000Position in BP
Baye
s Fa
ctor
Association Type●
●
ConditionalPrimary
Chromosome 6 − White Blood Cells
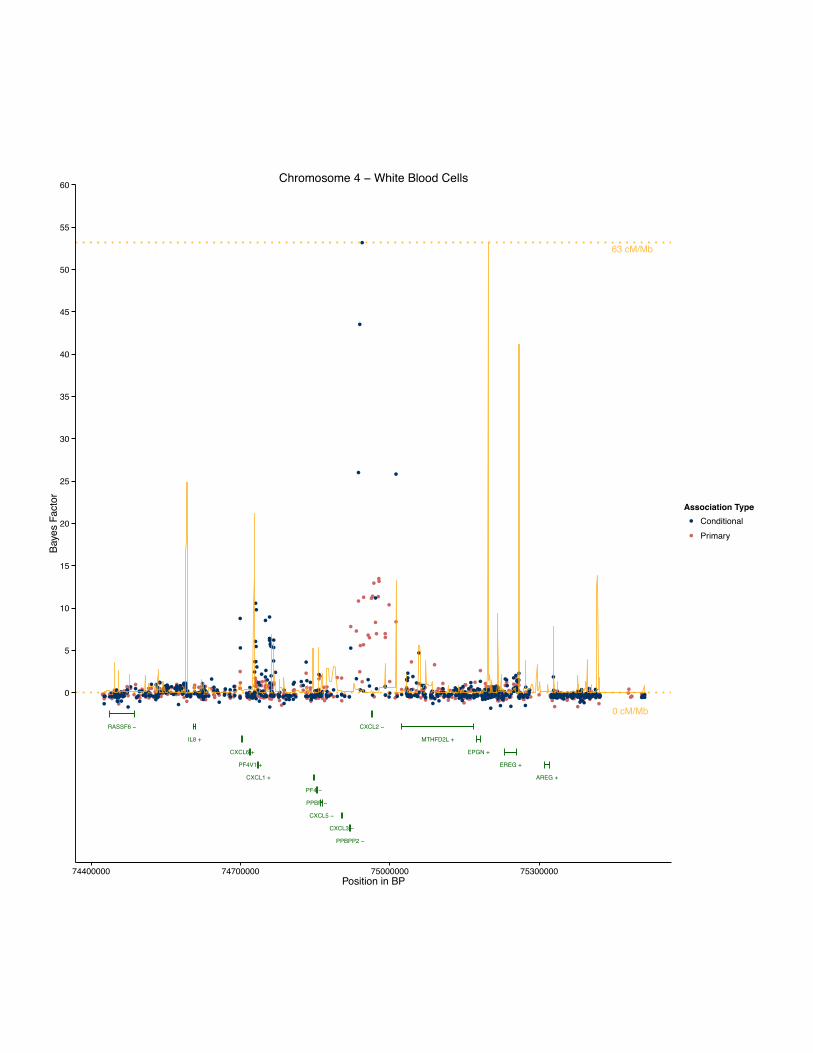
●●●
● ●● ●●
●
●●●
●●●● ●●
●●
●●
●● ●●● ● ●●● ● ●● ● ●●●● ● ● ●●●● ● ●●● ● ● ●●●● ●●●● ●● ● ● ●● ●● ●●● ● ●● ●● ● ● ●●● ●●● ●● ●● ●●●● ●● ●● ●● ●● ●●● ● ●●● ●●●● ●● ●●●●● ● ● ●● ●● ●●● ●● ●● ●●● ●● ●● ●● ● ●● ● ●● ● ● ●● ● ● ●●● ●● ●●●● ● ● ●● ● ●●● ● ●●● ●●●● ●● ●● ● ●●● ● ● ●● ●●● ●●●●● ●● ●● ●●● ● ● ●● ●● ● ●● ● ●● ●● ●●● ●● ● ●● ●● ● ● ● ●●● ●● ● ● ●● ●●● ● ●●●●● ● ●● ●●●●● ●● ●● ●●● ●●● ●● ●●● ●● ●●●●● ●●● ● ● ●● ●● ●● ● ● ●●● ● ●●●●● ●● ● ●● ●● ●● ●●●● ●● ●● ● ●●● ●●● ●●● ●● ●● ●● ●● ● ●●● ●●● ●● ● ●● ●● ● ●●● ●●● ● ●●●● ● ●●● ● ●●●● ●● ●● ●● ●● ● ●● ● ●● ●●● ●● ● ●●● ●● ●●● ● ● ●● ●● ●●●●● ●● ●● ● ●●● ●● ●●● ●● ●● ●●● ●● ● ●●● ●●●● ● ●● ● ● ● ●● ●● ●● ● ●● ● ●●● ● ● ●●● ●● ●● ●● ●●● ●●● ●●● ● ●●●● ●●● ●● ●● ●● ●● ● ●● ●●● ●●● ●● ●●● ● ●●● ●●●● ● ●● ●● ●● ● ●● ● ●● ● ● ●●● ●● ●● ● ●●● ●● ● ●●● ● ●●● ● ●● ● ● ●● ●● ●●●● ●● ● ●● ● ●●●● ● ●●●●● ● ●● ●●● ● ●●● ● ●●●● ●● ● ● ●● ●● ●● ●●● ● ●● ● ●● ●● ●●● ●● ●●● ● ●● ●● ● ● ●●● ● ●● ● ●● ●●● ●●● ●●● ● ●● ●● ● ●●●● ●● ● ●● ●●●● ●● ● ●● ●● ●●●● ● ●●● ●●● ● ●●●● ●●● ●●● ● ● ●●●● ● ● ●●● ●● ●● ● ●● ●●● ●●●● ● ●●●● ● ●● ●●● ●● ●● ●●●● ●● ●● ●●● ●● ●● ● ● ●● ●● ●●● ● ●● ●●● ● ● ●● ●● ●● ● ●●●● ●● ●● ●●● ●●● ●● ● ●● ●● ● ●● ●●● ●● ● ●● ● ● ●● ●●● ● ●●●● ● ●● ● ● ●
●●●●
● ● ●● ● ● ●● ●●●
●●
●
●
●
●
●
●● ●●●
●
● ●
●
●●
●
● ●● ●●
●● ●●●
●
●
●● ●
●
●
●
●
●● ●
●
●●
●● ●
● ●
●●● ●
●●●●●●●●
●
●
●● ●●●●●
●●
●●
●● ●●●●●
●● ●
●
●●
●●●●●●●●●
●●
●●●●●
●●
●
●
●
●●●●●
●●●●
●●●● ●
●●●● ●
●●●● ●●
●
●
●●●
●
●
●
●●
●●●●
●
●
●
●
●●●
●●●
●●●
●
●●
●●
●
●●
●
● ●●●
●
●
● ●●
●
●
●● ●
●● ●●
●
●
●●
● ●● ●
●●●●
●●●
●●
●
●
●
●
●
●●
●●●●●●●●
●
●●
● ●●●
● ●●●●
●
●
●●
●
● ● ●
●
● ●●● ●●●●
●
●●●●
● ●●●
●●●
●
●
●
●
●
●
● ●
●●●●●
●●●●●●●●
●●●
●●●
●● ●●●●
●
●●
●
●
●●● ●
● ●● ●●●●●●
●●
●
●
● ●●
●●
●●
●●
●
●●●
●●●●
●● ●
●
●
●
●●●●
●● ● ●●●●
●● ●●
●
●●●
●●
●
●
●● ●
●
●●●● ●● ●
●
●●
●
●
●●
●
●●● ●
●
●
● ● ●●●
●
●
●
●
●
●
●
●●●●●
●
●
●●
●
●●●●●●●
●
●
●
●
●●●
●●●
●●●
●●●
●
●● ● ●●
●●
●● ●●●
●
●●●
●● ●● ●●●● ● ●●● ●● ●
●
●
●
●
●
● ●●●●●
● ● ●●
● ● ●●●
● ●
●
●
●● ●
● ●●●●●●
●
●
●
●●●
●
●
●
●
●
●
●
● ●●
●
●
●
●
●●
● ●
●
●
●
●●●
●
●●●
●●●
●●
●●
●●
●
●
●●●
●●●
●●
●●●●●●
●●
●
●
●●
●
●●● ●
●
●●
●
●
● ●●●
●
●● ●● ●
●
●●●
●●
●
● ●
●
●
●●
●
●
● ●
●
● ●●
● ●● ●
●
● ●● ● ●●● ●● ●
●
●●
●
●●
●●
● ●
●●
●
●
●●●
●● ● ●●
●
●●●
●●●
●
●●
●
●
●●
●●●
●●●
● ●●
●
●●
●
●●
●
●
●● ●● ● ●● ●●
●
●●
●●●
●●●●●
●●
●
●●
●
●
●
●
●●
●●●● ●● ●●
●●●
●●
● ●●
●●
● ●
●● ●
●
●●
0 cM/Mb
63 cM/Mb
RASSF6 −
IL8 +
CXCL6 +
PF4V1 +
CXCL1 +
PF4 −
PPBP −
CXCL5 −
CXCL3 −
PPBPP2 −
CXCL2 −
MTHFD2L +
EPGN +
EREG +
AREG +
0
5
10
15
20
25
30
35
40
45
50
55
60
74400000 74700000 75000000 75300000Position in BP
Baye
s Fa
ctor
Association Type●
●
ConditionalPrimary
Chromosome 4 − White Blood Cells
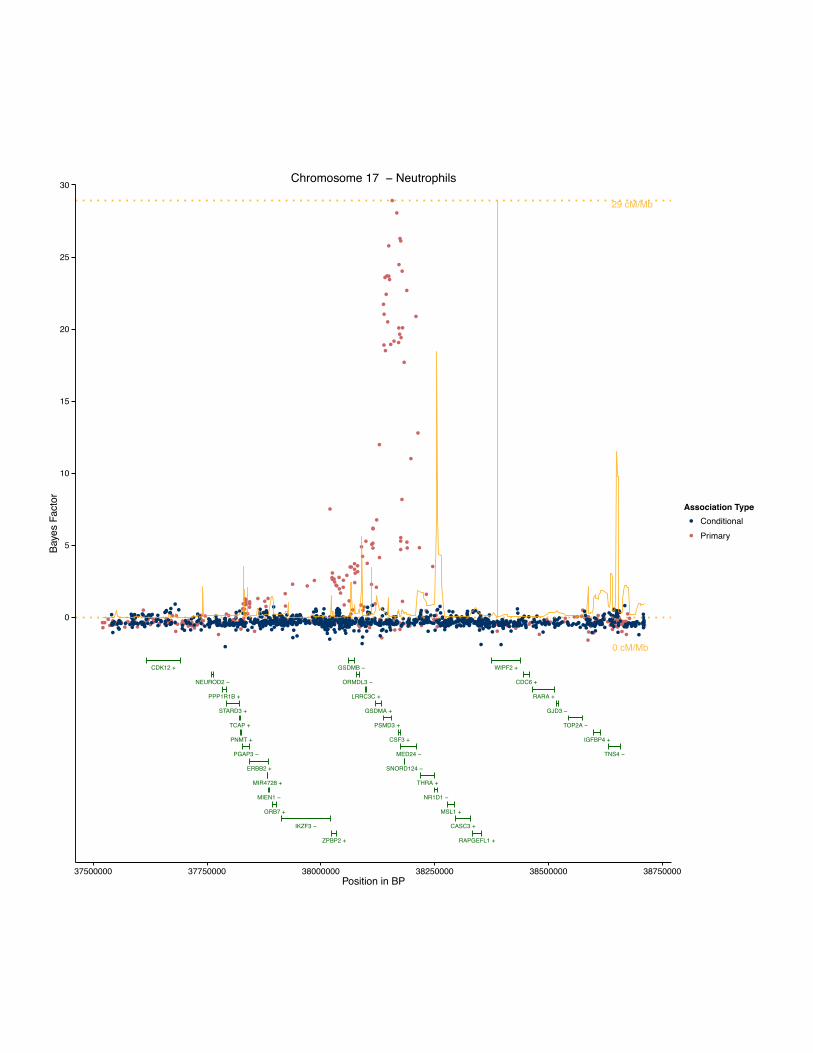
●
●
●●
●
●
●●●●●
●●
●
● ●●
●●
●●
●●●●●
●
●
●
●
●
●
●
●●
●●● ●●●
● ●●● ●
● ●●●● ●●●●
●● ●●●●●● ●● ● ●● ●●●● ●●●●● ●
●●●● ●● ●●●● ●● ●●● ● ●●● ●●●● ●● ●● ●●●●●● ●●● ●●● ● ●● ● ●●●● ● ● ●●●● ● ●● ●●● ● ● ●● ●● ●●● ● ● ●● ●● ●●● ●● ●● ●●● ● ● ●● ●● ● ●● ● ● ● ●● ●●●● ●● ●● ●●● ● ● ●●●● ●● ●●● ● ●●● ●● ●● ●●●● ●● ●● ● ●● ●● ●● ● ●● ●● ● ●● ● ●● ●●●●●● ● ●●●●● ● ●● ● ● ● ● ●● ●● ●● ● ●●● ●● ●● ●●● ● ●●●● ●●● ● ● ●● ●● ●● ●● ●● ● ●● ●●● ●● ● ●●● ● ●● ●●● ●●● ●●● ● ● ● ●● ●● ●● ●● ●●● ●●● ● ●●● ●● ●● ●●● ●●● ●●●● ●●● ●
●●
● ●
●
●●●
● ●●●●
●●●
●●● ●
●●
●
●●●
●
●●
●● ● ●
●●
●
●
●
●●
●●
●
●
●●
● ●●
●
●●
●●
● ● ●● ●
●●
●● ●● ● ●●
●
● ●●
●●● ●●
●●
●
●
● ●●
●
●● ●●●●●
●●● ●
●
●
●
●●● ●
●
●
●●
● ●
●●●
●● ●●●
●● ● ● ●
●●
●
●
●
●●
● ●●
●●●
● ●
●●●
●
●●● ●
●
● ●●
●
● ● ●●●
●●● ●●●
●
●●
●●●●
● ●
●
●● ●●
●
● ●
●
●●
●
●● ● ●●● ●●●
●
●
●●
●● ●●●
●●●
●
●● ●● ●●●
● ●● ●●●●
●
●
●
●
●
●
●
●● ●● ●●
●●● ●
●●●
●
●
●●
●●
●● ●●●●
●
●
●●
●
●
●●
●●● ●●●●
● ●●
●
●● ●● ● ● ●
●●
●
●●
●
●
●●
●
●●
●●●●● ●●● ●●
●
● ●● ●●●
●●●
● ●● ●●
● ●●
●
●
●●●●
●
●●
●●
●
●●
●●● ● ●
●●●
●●●●●
●●
●
●●●●
●
●●
●●●●
●
●●
●●●
●●●●
●●
●
●●
●
●
● ●●
●●●●●●●
●●
●● ●
●
●●
●
●
● ●●●
● ●● ●● ●
●●●
●
●●
●● ●
●●
●●
●● ●●
●●●●
●
●●●●● ●
●●● ●
●
●
●● ●
●
●●●●
●
●
●● ●● ●
● ●●●●●
●●
●●● ●●●●
●
●
●●
●●●
●●●● ●●●
●
●● ●●●● ● ●
●
●
●
●
●● ● ● ●
●●
●
● ●● ●●
●
●●●● ● ●
●●●
●● ● ●● ●●●● ●
●
●● ● ●●● ● ●●
●●●
●●● ● ●
●●
●●●●●
●●●●
●●● ●●●
●●●●●
●
●
●●●
●
●●●●
●●●●●●●
●
●
●●●●
●
●●
●●●●
● ●●
●●
●
●●
●
●●●●●●●
●
●●●●●●●● ●
●●●
●●
●
●
●
●
●
●●●●●●
●●●● ●
●●●●
●
●●●●●●
● ●●●●●
●●●●●●●●●
●
●●
●
●●●●●
●
●●●●●
●●●●●●●
●●●●●
●●●●●
●
●
●
●● ●●
●●●●●●●
●●●
●●
●●●●●●●
●
●●●●
●
●●
●●
●
●●
●●
● ● ●● ●● ●●
● ●●●●●
●
●●●
●
●●●
●●●●
●
●●●
●●●
●●
●
●●●●●
●●
●●●
● ●●●●●●
● ●●●●●●●● ●● ●●●
●●● ●
●
●
●
●●●●
●●●●●●
●
●●●●
●● ●●●
● ●
● ●● ●●●
●
●●
●
●
●
●●●●●
●
●
●●●●
●●● ●●●
●●
●
●
●
●●
●●
●●●
●
●●
●●
●●
●● ●●
●●● ● ●
●
●●●●●
●
● ●● ●
● ●●●●
●●●
●
●
●●
●
●●● ●
●
●●
● ●
●
●
●●●●
●●● ● ●
● ●● ●
●
●●●● ●●
●●
●
● ●
●
●●●
●
●
● ●●
●
● ●
●● ●
●
●
●● ●● ● ●
●
●
●●
●
●
●● ●● ●●
●●●●●
●●
●
●● ●● ●
●
●●
● ● ●●●
●●
●
●
●
●
●
●●●
●●●● ●
●●
●
●
● ●●
●
● ● ●●●
●●●
●
●●●
●
●●
●
●
●●
●● ●●
●
●●●●
●●●
●
●●
●
●●
●
●
●●
●
●
● ●●●
●●
●●●
●●
●●●
●●●
● ●●●
●●●
●
● ●● ● ●●
● ● ●●
●
●
●● ●
●
● ●●
●●● ● ●●
● ●●●
0 cM/Mb
29 cM/Mb
CDK12 +
NEUROD2 −
PPP1R1B +
STARD3 +
TCAP +
PNMT +
PGAP3 −
ERBB2 +
MIR4728 +
MIEN1 −
GRB7 +
IKZF3 −
ZPBP2 +
GSDMB −
ORMDL3 −
LRRC3C +
GSDMA +
PSMD3 +
CSF3 +
MED24 −
SNORD124 −
THRA +
NR1D1 −
MSL1 +
CASC3 +
RAPGEFL1 +
WIPF2 +
CDC6 +
RARA +
GJD3 −
TOP2A −
IGFBP4 +
TNS4 −
0
5
10
15
20
25
30
37500000 37750000 38000000 38250000 38500000 38750000Position in BP
Baye
s Fa
ctor
Association Type●
●
ConditionalPrimary
Chromosome 17 − Neutrophils
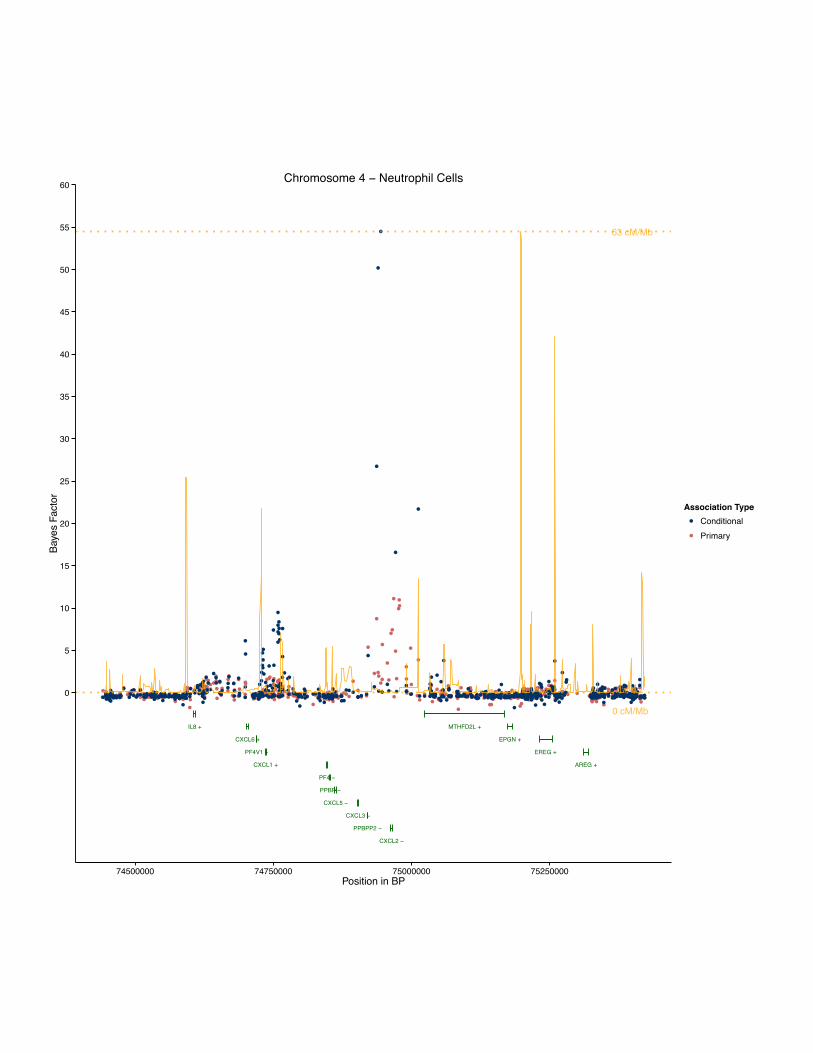
● ●●●
●
●●
●● ●
●
●●
●●●
● ●● ●● ●● ●● ●● ●● ●●● ●● ● ●●●●●●● ●● ●● ● ●●● ●●● ●●● ●●● ●● ● ●● ●● ● ●●●● ● ●● ●● ●● ●●●●● ● ●●● ●● ●●● ●● ●●● ● ●●● ●●● ● ●●●● ● ●● ●● ● ●●● ● ●●● ● ● ●●● ●●●● ●● ●● ● ●● ● ●●● ●●●● ●● ●●● ● ●● ● ●●●●● ●●● ● ●● ●● ● ●● ● ●●●● ● ● ●● ●● ● ●●● ●●● ●● ● ●●● ● ● ●●● ●● ●●●● ●● ●● ●● ●●●● ●● ●● ●● ●● ●●● ● ●●● ●● ●● ●● ●● ●● ● ●●● ● ●● ●● ●●●●● ●● ●● ●● ●● ●● ● ●● ●● ● ●● ●● ●● ● ● ●●● ● ●● ●● ●● ● ●●●● ●●●● ●●● ● ●●● ●●● ●●● ●● ● ●● ● ●● ●● ● ●● ●●●●● ● ●● ●● ●● ●● ● ●● ●● ●● ● ●● ●●● ● ●● ● ● ●● ● ●●● ● ●● ●●●● ● ● ●● ●●● ● ●● ●● ●●● ● ● ● ●●●● ● ●●● ●●● ●● ● ●●●●● ●● ●● ●●● ●●●● ●● ●●● ●● ●● ●● ●● ●● ●● ● ●● ●● ●●● ●● ● ●● ●●● ●● ●● ●● ●● ●● ● ●● ●●● ● ●● ●●● ● ● ●● ● ●●● ●●●● ●● ●●●● ●●● ●● ●●● ● ● ●●● ●● ●●● ●● ●● ●● ● ●●● ●●● ● ●● ●●● ●● ●● ● ●● ● ●● ● ●●● ● ●● ●● ●● ●● ● ●● ●● ●● ●●● ●● ●●● ●● ●● ●●● ● ●● ●● ● ●● ●● ● ●●●● ● ● ●●● ● ●●● ● ●● ●● ●● ●● ●● ● ● ●● ●●● ●● ●● ● ●●●●● ● ●●● ● ●● ● ● ●●●● ● ●●● ●●● ●● ● ● ●●● ● ●● ● ● ●● ●●● ●●● ●● ●●● ● ●●● ●● ●● ● ●● ●● ● ●●●●●● ●●●● ● ●●●● ●● ● ●● ●● ●●● ●● ●●● ●● ●● ●● ●● ●●● ●● ● ●● ●●● ●● ● ●● ● ●● ●● ●● ●● ●● ●● ●●● ●●● ●●●● ● ●●●● ●● ● ●●● ●●● ● ● ●● ● ●● ●●● ●● ● ●●●●● ●●● ●● ● ●●● ●● ●●● ●
●
●
●●
● ●●● ● ●● ●●●
●
● ●●●
● ●● ● ●●
● ●
●
●
●
●
● ●● ●●
●● ●●
● ●●
●● ●
●
●●
●●
●
●
●
●●
●● ● ● ●● ●● ● ●
●●●●●● ● ●
● ●● ●●
●
●●
●
●
●●●
●
● ●●● ●●●
●
●
●
●●
●●
●●●●● ●●● ●●●●●
●●
●
●●●●●●●●
●●●●●● ● ●●●●
●●●
●
●
●●●●
●
●●●●
●
● ●●●
●●● ●●
●
●
●● ●●● ●● ●
●
●●
●●●●
●●●●●
●●●●●
●
●
●
●
●●
●●
●
●
●
●●
● ● ● ●●
●●
●
●● ●●●
●
●●
●
●
●● ●●●●●●●●
●
●
●
● ●●●
● ●●●●●●●
●●
● ● ●
●
● ●●●
●●●
●●●●●● ● ●
●
●
● ● ●
●
●●
●
●
● ●
●●●●●●●●●●●●
●●●●
●●●●
●● ●●●
●●●●
●● ●●● ●● ● ●
●●●●●●●
● ●●
●
●
●●●
●●
●
●
●●●●●
●●●
●
●
●
●
● ●
●● ●● ● ● ● ●● ●●●●●● ● ●●
● ●●
●
●
●
● ●
●●
●●● ●● ●
●
●●
●
●
●●
●
●●● ●
● ●
● ● ●●●●
●
●
●
●
●●●●●●●
●
●
●●●●●●●●
●●
●
●
● ●
● ●●
●
●●● ●●●
●●
●
●● ● ●● ●● ●●
●
●
●
● ●● ●
●● ●● ●● ●
●●●
●●●
●
●
●
●
● ●
●●●●
●
● ●
●
● ●● ●● ● ●
●●●●
●● ●●
● ●
● ●●
●
●●●●
●
●
●
●
●
●
●
●●●
●
●
●
●
●● ● ●
●
●
●
●●
●
●
●
●
●●●
● ●●
●
●
●
●
●● ● ●●
●
●
●
● ● ●●●●●●●●
●
●
●●
●●
●●
●●●● ●
● ● ●
●
● ●●●●
●●
●
●
●●
●
●
●
●
●
●
●
●
●
●
●● ●●
● ●●●
●
●
●●
●
●● ●●●
●●● ●
●
●● ● ●●
●●
● ●● ● ●●●●
● ●● ● ●●
●
●●●●●
● ●●● ●●
●●
●●●
● ●
●●
● ●
●
●
●
●
●
●●
●
● ●
●●
●●
● ●●●●● ● ●●●●
●●
●●
●●●● ●● ●●●
●
●● ●●●●●
●
●
●●●
●●
●●● ●●
●
●
0 cM/Mb
63 cM/Mb
IL8 +
CXCL6 +
PF4V1 +
CXCL1 +
PF4 −
PPBP −
CXCL5 −
CXCL3 −
PPBPP2 −
CXCL2 −
MTHFD2L +
EPGN +
EREG +
AREG +
0
5
10
15
20
25
30
35
40
45
50
55
60
74500000 74750000 75000000 75250000Position in BP
Baye
s Fa
ctor
Association Type●
●
ConditionalPrimary
Chromosome 4 − Neutrophil Cells
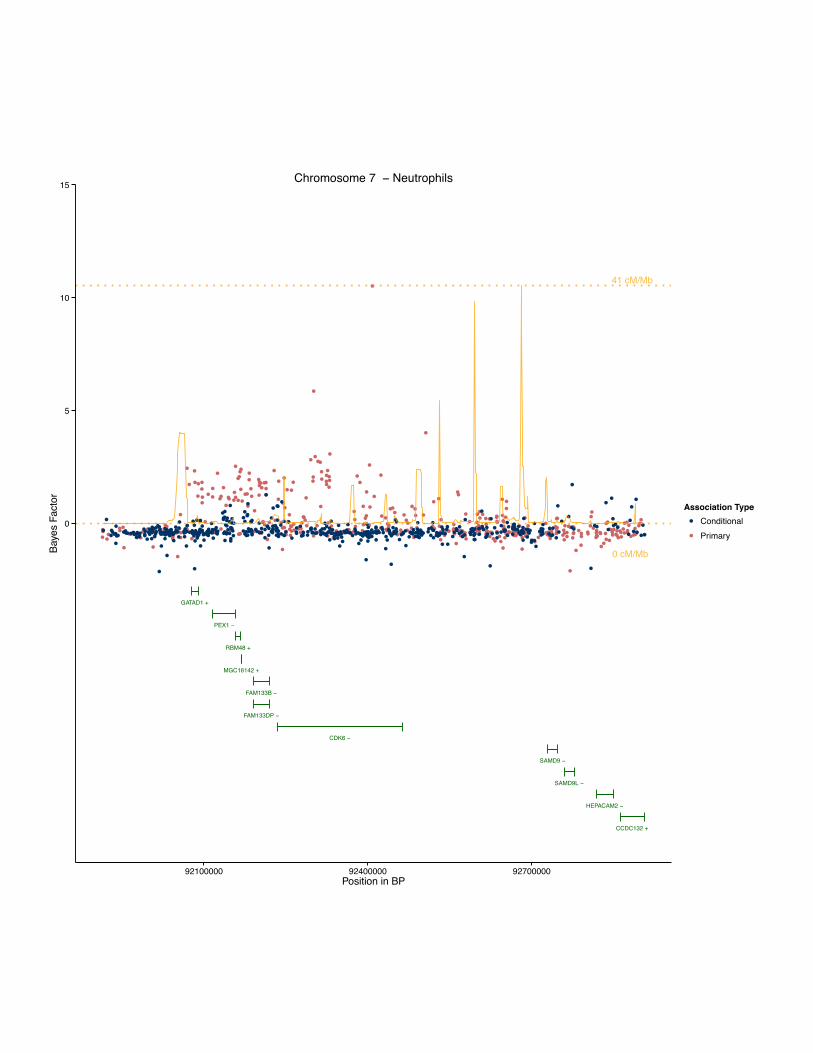
●
●
●
●●
● ●●●●● ● ●●● ● ●●● ●● ●●● ●●● ●●● ●●● ●● ●●● ●●●●●● ●● ●● ●● ●●● ● ●● ● ●● ●●● ● ●●● ●● ●●● ●● ● ●● ● ● ●●●● ●●● ●● ● ● ●● ●● ● ●● ●● ● ● ●● ● ● ●● ● ● ●● ●● ● ● ●● ● ●● ● ●●● ●● ●●● ● ●● ●● ●●●● ●●● ●●●● ●●● ● ● ● ●● ● ●● ●● ●●●● ● ●●● ●● ● ●● ●●●● ● ● ●● ●● ●●● ● ●●● ●●● ●●●● ●●● ● ●●● ●●●●● ●●●●● ●● ● ● ●● ● ●● ● ●●● ●● ● ●● ●● ●●● ● ●● ●●● ● ● ●● ●●● ● ●● ● ●●● ●● ●●● ●●● ●●● ● ●●● ● ●●● ●● ●●●● ●● ●●●● ●● ●●● ● ●● ●● ●●● ● ●● ● ●● ●● ● ● ● ●● ● ●● ●● ●●● ● ●● ●●● ●● ●● ● ●●● ● ●●● ● ●● ●● ● ● ●● ● ●● ●●● ●●● ● ●● ● ●● ●●● ●● ●●●● ● ●●● ●●●●● ● ● ● ● ●●● ●●● ●● ●● ● ●●● ●● ● ●●● ●●●● ● ● ●● ● ●● ●● ●● ●●● ● ●●● ●●● ● ●● ● ● ●● ● ● ●● ● ●●● ● ●● ●
●
●
●●
●● ●
●
●● ●
●● ●●●
●
●● ●
●
●
●
●
● ●
●
● ●●●
● ● ● ●
●
●
●●●
● ●●● ●
●●●
●●
●
●
●
●
●
●● ● ●
● ●●
● ●
●
●●
●
●●
●●● ●●●
●●
●●●
●●
●
●
●
●
●●
● ●●●
● ●
●
●
●
●
●
●●●
●●●
●
●●
●●
●● ●●
●
●● ● ●
●
●
● ●
● ●
●●
●●●
●
●
●
●
●●
● ● ●●
●
●
●●
●● ●
●
●●
●
●
●
●
●●
●
●
●●
●●●
●
●●
●
●
●●
●●●●●●
●●●●
●●●
●●
●
●
●
●●
●
●●●●
●
●●●●
●
●
●●
●
●●
●●
●
●
●●●
●●●
●●●●
●●●
●
●● ●●
●●● ●
● ●●●
●
●●
● ● ●
●
● ●
●
●●
●
●
●●
●●
●●
●●
●
●
●
●
●●●
●
●●● ●
●
● ● ●●●●
●
●
●
●●
●●●●
●●●
●●●●
●
● ● ●
●
●
●●●
●
●● ●
●● ●●● ●●
●
●
●
●
●●● ●
●
●●
●
●●●●●
●
●
●
●●●
●●
●
●●● ●●●
●
●
●●
●●
●
●
●
●●●
●●●
●
●● ●●
●
●
●
●●
●
●
●
● ●●
● ●●
●
●
●
●
●●
●● ●
●●
●
●●●● ● ●
●●
●●
●●●●
●● ●
●
●● ●
●●
●●● ● ●
●●
●
●●● ●●
●
● ●
●
●
●●●
● ●
●
●
●●● ●
●
●●
● ●●●
●
●
●
●●
●
●
●
●●
●●
●
●
●●
●●●●
●
●●
●●
● ●●●
●●
●
●
● ●
●
●●
●
●●
●
●
●●●
●● ● ●● ●●
●
●
●
●
●
●
●
●●●●●
● ●●
● ●● ●
●
●
●
●
●●● ● ●●
● ●●● ●
●
●
0 cM/Mb
41 cM/Mb
GATAD1 +
PEX1 −
RBM48 +
MGC16142 +
FAM133B −
FAM133DP −
CDK6 −
SAMD9 −
SAMD9L −
HEPACAM2 −
CCDC132 +
0
5
10
15
92100000 92400000 92700000Position in BP
Baye
s Fa
ctor
Association Type●
●
ConditionalPrimary
Chromosome 7 − Neutrophils
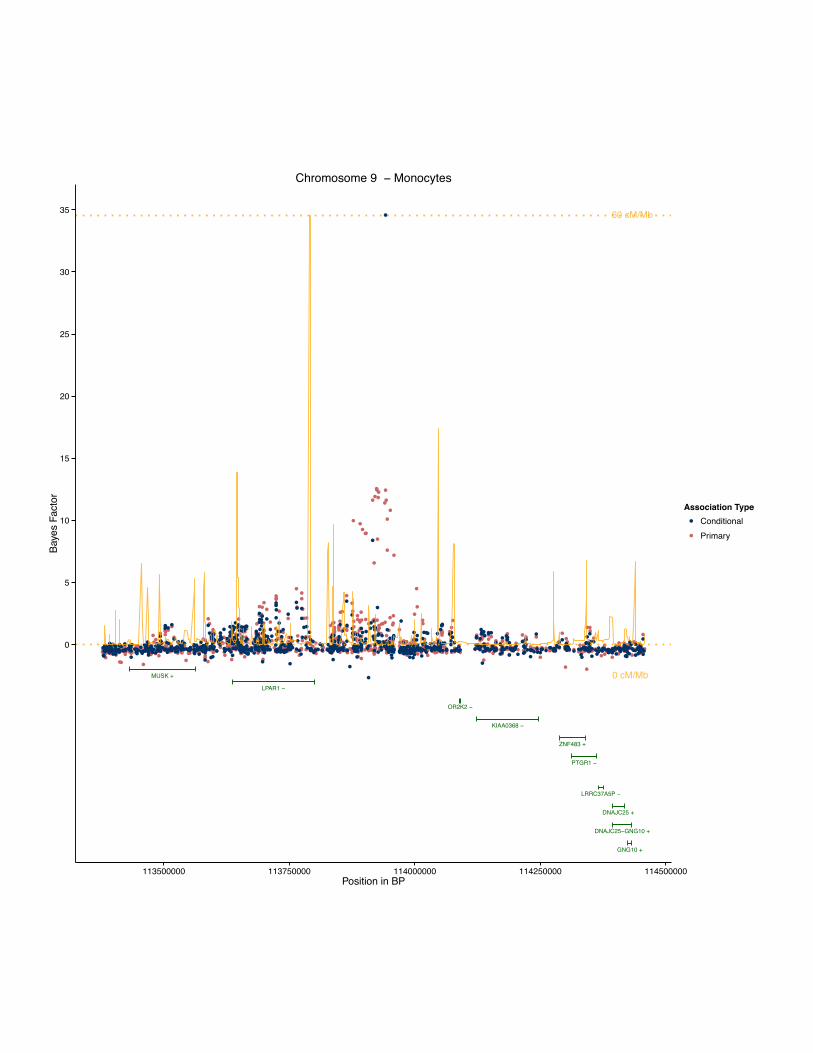
●● ●●●●● ●
●
●
●●●●●●
●
●●
●
●●●
●●● ●●● ●●● ●●● ●● ● ●● ●● ●●●●● ● ●● ●●●●● ● ●● ●● ● ●● ●●● ● ●● ●●● ●● ● ●●● ● ● ●●● ●●● ●● ● ●● ●●●● ●●●●● ●● ●● ●● ● ●● ●●● ● ●● ●● ●●● ● ●●● ●●● ● ●●● ● ●●● ●● ●●● ●● ●●● ●●● ● ●● ●● ●● ●● ● ●●● ● ●● ●● ●●● ●● ●● ●● ●● ●●● ● ● ●●● ● ●● ● ● ●●●●●●● ●● ● ● ●● ●●● ●● ●● ●●● ●●●● ●● ●●● ●● ●●●●● ● ● ●● ●●●● ●●● ●●● ●● ●● ● ●●● ●● ● ●●●● ●● ●● ●● ●● ●●● ●● ●●●● ●● ●● ● ● ●● ●● ● ●● ● ●●●● ●● ● ● ●● ●● ●● ● ●● ●● ● ●● ●● ●● ● ● ●●● ●● ●● ●●● ● ●●● ● ●● ●●●● ●●● ● ● ● ●● ●● ●●●● ●●● ●● ●● ● ● ●●● ● ●●● ●●●● ●● ●● ● ● ● ●● ● ●●●●● ● ● ● ●● ● ● ●●● ● ●● ● ●● ● ●● ●● ●● ● ●●● ●● ● ●● ● ●● ● ●● ●●● ●●● ●● ● ●● ● ● ●● ● ●● ●● ● ●●● ●●● ● ●● ●● ●● ● ●● ● ● ●● ●● ●● ●● ●●● ●●●● ●● ● ●● ●●● ● ● ●●● ●●●● ●● ●●● ● ●● ● ●●● ●● ●● ● ●● ● ●●● ●● ● ●●● ●● ● ● ●●●●● ●●●●● ●● ●● ●● ● ●●● ●● ●● ●● ● ●●●● ●●●●● ●● ●● ●● ●● ●●● ● ●● ● ●● ●● ●● ●● ●● ●●● ●●● ● ●● ● ● ●● ●● ●● ●●● ● ●● ● ●● ●● ●● ● ●●● ●● ● ●●● ●● ●● ●● ● ● ● ●● ●●●● ● ● ● ●● ● ● ●● ●●● ●● ●● ●● ●● ●● ● ●● ●●● ● ●●●● ● ● ●●● ●● ● ●● ●● ●●● ● ● ●● ●●●●● ●●● ●●● ●● ●● ●●●● ●● ● ●● ●● ●● ●●●● ●● ●● ● ● ●● ●●● ● ● ●● ●● ●●●● ●● ●●● ●● ●●● ● ● ●● ●●● ●● ● ● ●●● ●●● ●●● ●●● ● ● ●● ●● ●●● ● ●● ●●●●● ●● ●● ●● ● ●● ●● ●● ●● ●●● ●●●●● ●● ●● ●● ●● ● ●● ● ●●● ●●● ●● ● ●● ● ●● ●●● ●● ●● ● ●● ●● ● ●● ●●●● ●●● ●● ●● ●●● ● ●●● ●● ●● ●● ●● ●● ●● ●● ● ● ● ●● ●● ●●● ●●●● ●●● ● ●● ●●●● ●● ●●●● ●● ●● ● ●● ●● ●● ● ●● ●● ● ●● ●● ●● ● ●●● ●● ● ●● ● ●● ●●●● ●●● ● ● ● ●● ●● ●● ●● ●● ●● ●●● ●●● ● ●● ● ● ●● ●● ●● ● ● ●● ● ●●●● ● ●● ●● ●● ●● ● ●● ●● ● ● ● ●● ● ●● ●●● ● ●●● ●● ●●● ●
● ●
●
●
●
●
● ●●●
●
●
●
●
●● ●
●
● ●
●
●●●
●●●
●
●
●
●●●
●
●
●
●
●
●
●●●
● ● ●● ●
●
●●
●
●●
●● ●●●
●
●●● ● ●
●●
●
●
●●●
●●
● ●
●
●● ●
● ●●●●●●●● ● ●
● ●●●
●●
●
●
●●
●●
●●
●
●
●
●
●
●
●
●
●
●
●
●
● ●●●
●
●
●
●●
●
●●● ● ●● ●
●●●
●●●
●●● ●● ●
●●●
●●●●●
●●
●●●
●
●●●
●
●●●
●●●●●●
●
●●
●●
●
●●●
●●
●
●
●●●●●
● ●
●
●
●
●
●●●
●
●
●
●●
●●
●
●
● ● ● ● ●
●
●
●●●
●
●
●
●
●●
●
● ● ●
●
●● ●● ● ●● ●●●●● ●●●●● ●●●
●
●
●
●●
●
●●
●●●●●● ●● ●● ●
●●●
●●●
●
●
●●●
●
●
●
●
●
●
●
●
●
●●●
●●●
●
●
● ●
●
●
●
●
●●
●
●
● ●●
●
●● ●
●
●
●
●
●
●
●
●●
●
●
●
● ●●●
●
● ●● ●● ● ●
●
●●●
●
●● ●
●●
●
●
●
●●
● ● ●●
● ●
●
●●
●●
●
●●
●
●
●●
●
●
●●
●●
●●●● ●
●
●●
●●
●
●●●
●
●
●
●
●
●●●
●
●●
●
●●●● ● ●● ● ●●●
●●●●●●●
● ●●
●●
●●●
●
●
●●
●
●●
● ●●
●●
●
●●
●
●●
●
●●
●●
●●
●●
●●
●
●
●
●●●
●● ●
●
● ● ●●●
●
●
● ● ●●●
●
●●
●
●
●
●
●
●
●●
●
●
● ●● ●
●
●
●
●
●●
●
●●●●
●
●●
●
●
●●
●
●●
●
●●
●
●●
●●
●●●●
●●
●
●●● ● ● ●●●
●
●
●
●●●● ●
●●●●●
●
●● ●● ●●● ●
●● ●●●●
●
●●●
●
●●●
●
●●
●●
●
●
●
●
●
● ●●● ●●●
● ●●●
● ●
●
● ●●●
●
●●
●●
●●●●●
●● ● ●●● ●
●
●
●
●●●
●
●
●●
●●
●
●●●
●
● ●●● ●
●●
●●● ●●
●
●●
●●●● ● ●●
●
● ●
●
●
●●
●● ●
●
●
●
●●●
●● ●●●●●
●
●
●
●●●
●●●
●
●
●
●
●
●● ●
●●
●●
●
●●
●
●●● ●
●
● ●
●
●●● ●
●● ●●●●●●
●●●●●
●
●●
●
●
●
●
●
●
●●
●
●●●
●● ●
●
●
● ●●●
●
●
●
●● ●
●
●●
●●
●
●
●
●
● ●
●
●
●
● ● ● ●●●
●●
●●
●
●
●
●●● ● ●
●
●
●
●●
●● ●
●●
●
●●
●
●●●●
●
●●
●
●●●
●
●●
●
●
●● ● ●
●●
●
●
●
●
●●●
●
●●
●●
● ●
●
●●●
●●●
●
●●●
●
●●
● ●●
●
●●● ●●● ● ●
●
●
●●
●
●
● ●
●
● ●
● ●● ● ●
●
●
● ●●
●●
● ●● ●
●
●● ●●●● ● ●
●
●●●●●●
●● ●●
●●●
●●
●●
●
●
● ●
●
● ●●●
●
●● ●
● ●●
●● ●
●
●
●
●
●●
●●
●
●
●
●
●
●
●
●●
●●
●
●
●
0 cM/Mb
60 cM/Mb
MUSK +
LPAR1 −
OR2K2 −
KIAA0368 −
ZNF483 +
PTGR1 −
LRRC37A5P −
DNAJC25 +
DNAJC25−GNG10 +
GNG10 +
0
5
10
15
20
25
30
35
113500000 113750000 114000000 114250000 114500000Position in BP
Baye
s Fa
ctor
Association Type●
●
ConditionalPrimary
Chromosome 9 − Monocytes
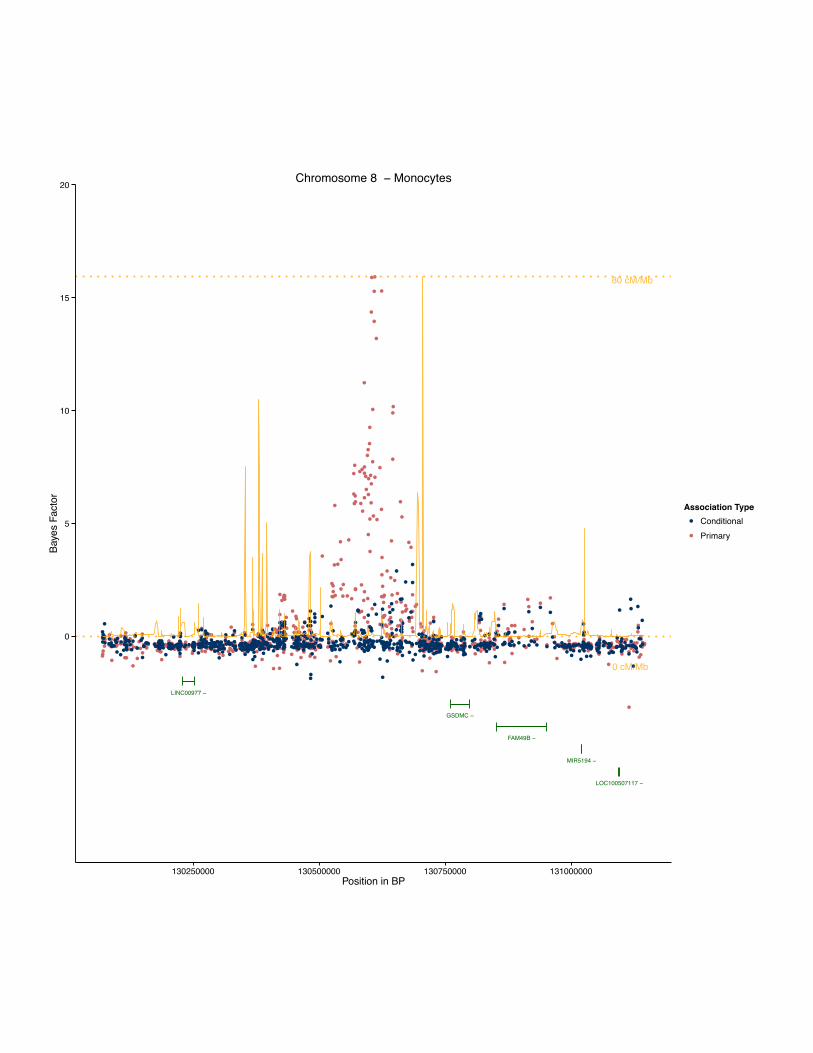
●●
●●
●
●
●
●
●●
●
●
●
●●
●●
● ● ●●●●● ●● ●●●
●● ●● ●
●● ●●●●●●
● ●● ●
●● ●● ●
●●
● ●●●●
●●
●●
● ● ●● ●●● ●● ● ●● ●●●● ● ●● ●● ●●●●● ●●● ●● ●●● ●●● ●●●● ● ●●● ●● ●● ● ●●●● ●● ●● ●● ●●● ● ● ●●● ● ●● ● ●● ● ●● ● ● ●●● ●●● ●●●● ● ●● ●● ●● ● ●●● ●● ●● ●● ●● ●● ●●●● ● ● ●●●● ●●●● ●● ● ●● ●● ●●●● ●● ● ●● ●● ●●● ●●● ●● ●●● ●● ● ●● ●● ● ●● ●●● ●● ● ● ●● ●● ●● ●●● ●● ● ●●● ●●● ●●● ●●●● ● ●● ●●●● ●● ● ● ● ●●● ● ● ● ● ●● ● ●● ●●●● ● ●●● ●●● ● ● ●● ● ●● ● ●● ●●●● ● ●● ●● ●● ●● ●● ● ●●● ● ● ●●● ●● ●● ●● ●● ●●● ●●●● ●●●● ●● ● ● ●●● ●● ●● ●●●● ● ●● ●● ●● ●●● ● ●●● ● ● ●● ●● ●● ●● ●● ●● ● ● ●●●● ● ●● ●● ●● ●●● ●● ●● ● ●● ● ●●●● ●●●●● ●● ●● ● ●●●● ● ●● ●●● ●●● ● ●● ● ● ●● ● ●●●● ●● ●● ●●● ●● ● ●●● ●● ● ●● ● ● ● ●● ● ●● ●● ●● ●● ● ●● ●● ● ●●● ● ●●● ● ● ●● ●● ●●●● ●●● ● ● ●●● ● ●● ● ●● ●● ●● ●●● ●●● ●●● ●● ● ● ●● ●● ●●● ● ● ●●● ● ●●●●● ●● ● ●● ●● ● ●●● ●● ●●●● ●●●● ● ●●● ●● ●●●● ● ●●● ● ●● ●●● ● ●●●● ● ● ●● ● ●●● ●● ●● ●● ● ●● ●● ● ●● ●●●● ● ●●● ●● ●●●● ● ●● ● ●● ● ●● ● ●● ●● ●● ●●●● ● ●●●● ●● ●● ●● ●● ●●● ● ●● ● ●●●● ●● ●●●● ●● ●●●● ●● ●●● ●● ●●● ●●● ●● ● ● ●● ● ●●●● ●● ● ●●● ●● ● ●● ● ● ●● ●● ● ●●● ●●● ●● ●● ● ●●● ●● ● ●● ●● ● ●●● ●●● ● ●● ●● ●● ● ●● ●● ●●●● ● ● ● ●●● ●● ●● ● ●● ●● ●● ●● ●● ●● ●●● ● ●●●●● ●●● ●●●●● ● ●●● ●● ●● ● ●●● ● ● ●●●● ● ●● ●● ●● ● ●● ●● ●●● ●● ● ● ●●● ●● ● ● ●● ●● ●● ● ● ●●● ● ●● ●● ●●● ● ● ●● ●● ●● ● ●●●●● ●● ●●●● ● ● ●● ●● ● ●● ● ●
●
●
●
● ●●
●●
●●
●●● ● ●●
●
●
●
●●
●
●
●
●●
●
● ●
●
●
●
●
●
●
●
●
●
●●
●● ●●
●
●●●
●●●
●●
●●
● ●
●
●
● ●
●
●●
●
●
●
●●
●
●●
●
●● ●● ●
●
●●● ●
● ●●
●●
● ●●
●
●● ● ●●●
●● ●●
●●
●
●● ●
●●
●●
●● ●●●
●●
● ●●●●
●●
●●●●
●●
●●
●
●●● ●
●
●
●
●●
●●
●
●
●●
●● ●
●
●
●
●
●●
●
●
●●
●● ●●●
●
●●
●●
●
●
●
● ●●
●
●●●
●
●
●
●
●
●
●
●
●
●
●
●●
●●
●
●● ●
●
● ●● ●
●
●
●
●
● ●
●
●
●
●
●●●
●
●
●
●●
●
●●
●
●
● ● ●●● ●
●
●
●
●
●●●●●
●●
●●
●
●
●● ●
●●●
●●
●●
●
●
●●●
●
●●●●●
● ●
●
● ●●
●● ● ●●
●
● ●●
● ● ●
●
●●
●
● ● ●●
●
●●●
●
●
●
● ●
● ●●
●
●●
●●● ●●
●
●
●●
●
●●
●●
●
●
●
●
●●
●
●
●●● ● ●●
●
●●
●
●
●
●● ●
●●
●
●
●
●
●
●●
●●
●●
●●●
●
●
●
●●●●●
●●
●●●●
● ●●●
●●
●
●
●
●
●●
●●
●
●●
●
●●●●
●●●
●
●●●
●
●● ●●
●
●
●
●●●
●
●●●
●
●
●● ●●●
●●
●
●
●
●● ● ●●●
●●
●
●
●
●●
●●
●●●
●●
●●
● ●●● ●● ●
●●
●
●●●
●●●
● ●
●
●
●
● ●●● ●●
●● ●
●
●●
●●●
●●
●●●
●
●●
●
●● ●●
● ●
●
●
●
●
●
●
●
●
●●
●
●●
●●●
● ●
●
● ● ●
●
●
●●
●
●● ●
●●●●
● ● ● ●●
● ●●
●● ●● ●
●● ●
●●●
● ●●● ●
●●
●
●●
●●
●
●
● ● ● ●●
●
● ●●
●●
●
●● ●●●
●
●
●
●
●
● ●
●
●●
●●
●
●
●
●● ●●● ● ●
●● ●●●
●●
●
●●
●
●
●
●
●
●
●
●●
●
●
●
●
●
● ●
●● ●
●
●● ●
●
● ●● ●● ●
●● ●
●
●●● ●
●●
●
●
●
●● ●
●
●●● ●●●
●●
●●
●
●
●
●
●
●
●
●●
●
●
●●
●●
●●
●● ●
●
● ●
●
●●
●
●
●
●● ●
●
●
●●
●● ●●
●●●●●
●●●● ●
● ●●●
●
●
●
● ●●
●●●●
●
●
●
●●
●●●
●●
●●
●●
● ●● ●
●
●
●●
●
●● ●●
●●
●●
● ●
●
●● ●
●
●
●
●● ●
●
●
●●●
●
● ●●●
●
● ●● ●●
●
●
●●
●●
●
●●
●
●●
●
●●●
●
●●
●
●
●
●●
●
●
●●
●
●
●
●
●
● ●
●
●
●●
●●● ●
●
0 cM/Mb
80 cM/Mb
LINC00977 −
GSDMC −
FAM49B −
MIR5194 −
LOC100507117 −
0
5
10
15
20
130250000 130500000 130750000 131000000Position in BP
Baye
s Fa
ctor
Association Type●
●
ConditionalPrimary
Chromosome 8 − Monocytes
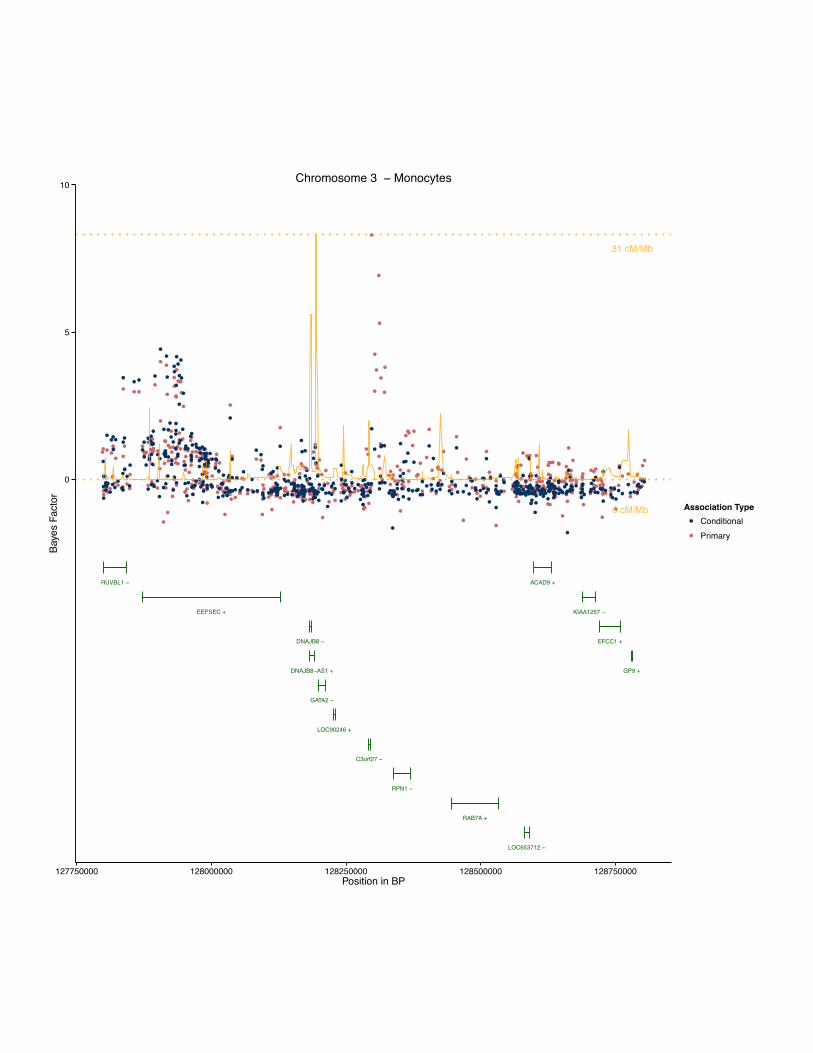
●
●
●
●
●● ●
● ●
● ●●●●
● ●● ●●● ●●● ●●
●●
●
● ●● ● ●●●● ●●●● ●● ●●●● ●●● ●● ● ● ●●● ●●● ●● ●●●● ●●● ●● ●●● ●● ●● ● ● ●●● ●●● ●●●●● ●●●● ● ● ●●●● ●● ●●● ●●●● ● ●● ●● ●●● ● ●● ● ● ●● ● ● ●●●● ● ● ● ●● ●● ● ● ●● ● ●● ● ●● ● ● ●●● ● ●●● ●● ●● ● ●●● ●●●● ● ● ●●● ●●● ●● ● ●●● ●●● ● ●● ● ● ●● ●●●● ●● ●●● ●● ● ●●● ●●●●●● ●● ●● ● ●●●●●● ● ● ●● ●● ● ● ●● ● ●● ●● ● ●● ●● ● ● ●●●● ● ●● ●● ●●● ● ●●● ●●● ●● ●● ●● ●● ● ●● ● ●● ● ●● ●●● ● ●● ● ●●● ●● ● ● ●● ● ●● ●● ●● ● ●● ●● ● ●●● ● ●●● ● ●●●● ●●● ●●● ●● ● ●● ● ● ●●● ●● ●●● ●● ●● ●● ●● ●●● ●● ●● ● ●● ● ●● ●●● ●●● ● ●● ●●● ●●● ●●● ●● ●●● ●● ● ●● ● ●●●● ● ●● ●● ●● ● ●● ● ●● ●●● ● ●●●● ●● ●●● ●● ●●● ●● ●● ●● ●●●● ●● ●● ●●● ●● ● ● ● ●● ● ●●● ●● ● ● ●●● ●● ●●●● ● ●● ● ●●● ● ●●●● ●● ●● ● ●●● ●●● ●● ●●● ● ● ●●● ●● ●● ●● ●● ●● ●●● ●● ● ●● ● ●● ● ●● ●●● ● ● ●● ●●● ●●●●● ● ●●●●● ● ●● ●● ● ● ●● ●● ●●●● ● ●● ● ●●● ●● ●●●● ● ●● ● ●● ●●
● ●●● ●● ● ● ● ●●●●
●
●
●
●●
●
●
●
●
●
●
●
●
●
●
●
●
●
●●●
●
●
●●
●●
●
●
●
●
●
●●
●●●
●
●●
●
●
● ●●
●
●●
●●
●
●●
●●●
●
●
●●
●●●
●
●
●
●●● ●●●
●
●
●●●
●
● ●● ●
● ●
●
●
●
●●
●●
●
●●●●●
●●●
●● ●
●●
●
●●
●●●
●
● ●●●
●
●●●
●●
●
●●
●●● ●●
●
●
●
●
●
● ●●●
●
●
●
●● ●
●
●
●● ●●
●
●
●
●
●
●●●
●
●
●
●
●
●●
●
●
●
●
●
●
●●●
●●
●
●
●
●
●
●
●
●● ●●●
●●
●●
●●● ●●
●●●
●
●
●
●
●
●
●●
●
●
●
●
●
●●●
●
●
●
●
●
●
●
●
●
●●
●
●
●
●
●
●
●●
●
●
●●
●●●
●
●
●
●
●
● ●●
●●
●
●
●
●
● ●
●
●
●
●●
●●●
●●
●
● ●
●
●
●
●
●●
●
●
●
●
●●
●
●●
●●●●
●
●●
●
●
●
●●
●
●
●●
●
●●
●
●
●
●●
●●●
●
●
●
●●
●●
●●
●
●
●●
●
●
●●
●
●●
●
●●
●
●
●
● ●
●
●
●
●
●
●
●
●●
●●
●
●
●
●
●●●
●
●
●
●
●●
●●
●●
●
●●
●
●
●
●
●
●
● ● ●
●
●
● ●●●
●
●● ● ●
●
●
●
●
●
●●●
●
●
●
●
●
● ●
●
●
●
●
●
●
●●
●
●●
●●
●●●●
●
●
●●
●
●
●
●
●
●
●●
●
●●
● ● ●●
●
●
●
●
●
●●
●
●●●
●
● ●●●
●●
●
●●
●
● ●●
●
●
●
●●
●●●●●
●●
●
●
●
●●
●
● ●
●
●
●
●
●● ●
●●
●●
●
●
●●
●
●● ●
●
●●
●
●●
●
●
●
●
●●
●● ●
●
●
●
●
●●
●
●
●
●●
●
●●
●
●
●
●
● ●
●
●
●
●
●
●
●
0 cM/Mb
31 cM/Mb
RUVBL1 −
EEFSEC +
DNAJB8 −
DNAJB8−AS1 +
GATA2 −
LOC90246 +
C3orf27 −
RPN1 −
RAB7A +
LOC653712 −
ACAD9 +
KIAA1257 −
EFCC1 +
GP9 +
0
5
10
127750000 128000000 128250000 128500000 128750000Position in BP
Baye
s Fa
ctor
Association Type●
●
ConditionalPrimary
Chromosome 3 − Monocytes
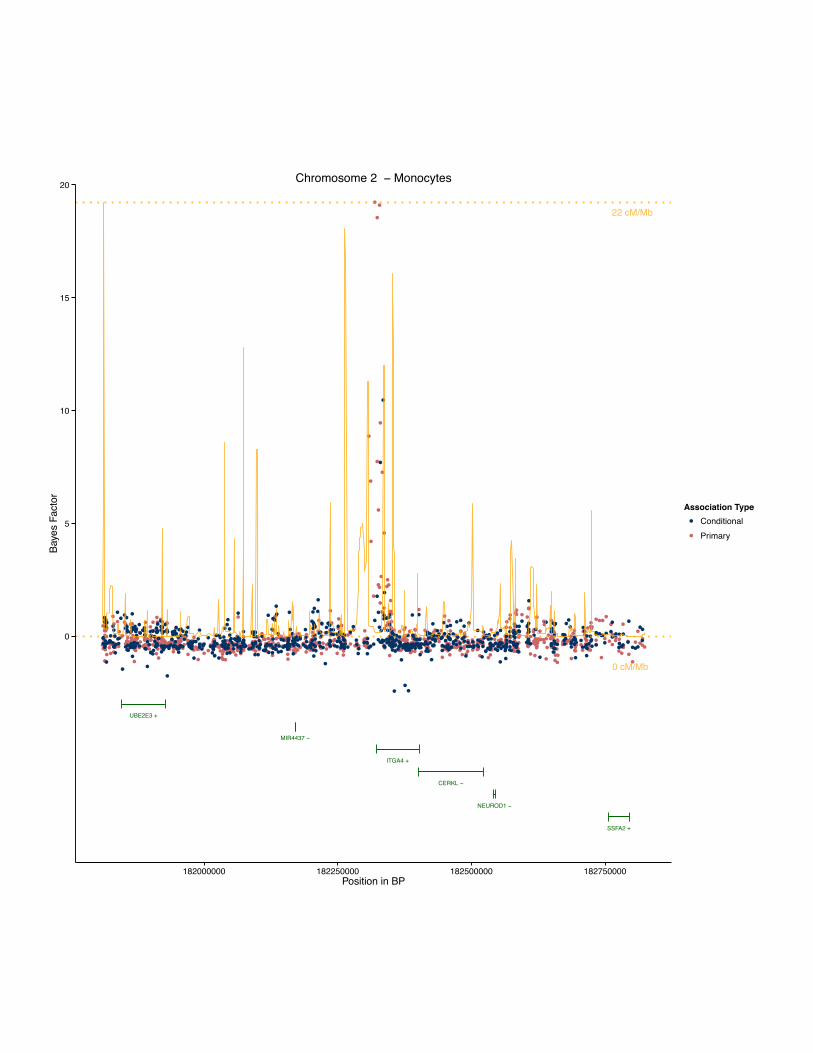
●●
●
●
●
●
●
●
●
●
●
●●
● ●●●
●●●
● ●●●● ●● ●●● ●● ● ● ●●● ●● ●● ●● ●● ● ●● ●● ● ●●● ● ●●● ●●●● ●● ● ●●● ●●●● ● ●● ●● ● ●●● ● ●● ● ●● ●● ● ●●● ● ●● ● ●●●● ●● ● ●● ● ●● ●● ●● ● ●● ● ●● ●● ●● ● ● ● ●● ●●● ●● ●● ● ● ●●●● ●● ● ● ● ●●● ●● ●● ●● ● ● ●● ●● ● ●●● ●●● ●●●● ● ●●●● ●●● ●● ● ● ●●● ● ●● ●●●● ● ● ●● ● ●● ●●● ● ●●● ●●● ● ●● ●● ●● ●● ●● ● ●● ●●● ●●● ●●● ● ●● ●● ●● ●● ● ●●● ●● ●●● ● ●●●● ●● ●● ●●● ●● ● ●● ●●● ● ● ● ●●● ● ● ●● ● ● ●● ● ● ●●● ●● ●● ●●● ●●● ●●● ●● ● ●●● ●●● ●●● ● ●●● ●● ●● ●● ● ●● ● ● ●●● ●●● ●● ● ●● ● ●● ●●●● ● ● ●●●● ●● ●● ● ●● ● ● ●● ●● ●●● ●● ●●●● ● ●● ●● ●● ● ● ●● ●● ●●● ●●●● ●●●● ● ● ●● ●● ●● ●● ● ● ●● ●● ●● ●●●●● ● ●●●● ●● ●●●● ●●● ●● ●●● ●● ●●●● ● ● ● ●●● ● ● ●●● ● ●● ●●● ●● ● ●●● ● ●●● ●● ●● ● ●● ● ● ●●● ●● ●● ●● ● ● ● ●●● ●● ●● ● ●● ● ●●● ● ● ● ●●● ●● ●● ●● ● ●● ●●● ●●● ●● ●●● ●●● ●●● ● ●● ●●● ● ●● ● ●● ●● ●●●●● ●● ● ●●● ●●● ● ● ●● ● ●●● ● ●●● ●● ●● ●● ●● ● ●● ● ● ●●●● ●●● ● ●●●● ●● ●●● ●● ● ●● ●● ●●● ●● ● ● ●● ●● ● ●● ●● ● ●● ● ●●●●● ● ●● ● ●●●● ●● ●● ●● ● ●● ● ●● ● ●●● ●● ●●● ●● ● ●● ● ●● ●●●● ● ●● ●● ●● ● ●● ●●● ●●●● ●● ●●● ●● ● ●● ●● ● ●● ● ●● ● ●● ● ● ● ●●●●●● ●● ● ●● ●● ●● ●●● ●●● ●● ●●● ●●●● ●● ● ●● ● ●● ●● ● ●● ●● ●●● ● ●●●●● ● ●● ● ●●● ●●●● ●●● ● ●●●●●● ● ●●● ●●● ●● ●●● ●●● ●●● ●● ● ●●● ●● ●● ●●● ●●● ● ●●● ●● ●● ●● ●●● ●● ●● ●●●● ●●●●● ● ●● ● ●●
●●
●●
●●●
●
●
●
●
●
●●
●
●●
●
●
●
●
● ●
●
●
●
●
●
●
●
●●
●
●●
●
●
●●
●
●
●
●
●
● ●●
●●
●●
●
●●
●
●
●●
● ●
● ●
●
●
●
●
●
●
●●●●
●●
●●●
●
●
● ●
●●
●●●
●
●
●●
●
●
●
●●
● ●●
●
●
●●
●●
●● ● ●
●
● ●●●
●
●●
●● ●
●
●●●
●
●
●
●
●
●
●
●●
●
●● ●
●
●●
●●
●●
●●
●●
●
●
●●
●
●●
●
●●
● ●
●
●●
●
● ●●
●●
●●
●●
●●●
●
●
●
●
●
●
●●
●●●
●
●●
●
●●
●
●
●●● ●
●
●
● ●● ●●
●
●●
●
●●
●
● ●●
●
●
● ●●
●
●
●
●●
●
●
●
●
●
●
●
● ●●
●●
●●
●
●●●
●
●
●●
●●●●
●
●●
●●
●
●●●●
●
● ● ●●
● ●
●
●●●
●
●●
●
●●●
● ●
●●
●
●
●
●●
●
●
●●
●
●
●
●
●
●
●●●
●
●
●●● ●
●
●
●●
●
●
●
●●
●
●
●
●●●● ●
●
●●●● ●●
●●●●
●
●
●●●
●
●●●
●
●
●●●
● ●●
●
●
●
●
●
●
●
●
●
●● ●●
●
●●
●●
●
●
●
●●
●●●
●
●
●●
● ●●
●
●●●
●● ●●
●
●
●
●
●●
● ●
●●
●
●
●●●
●
●
●
●
●●
●
●
●
●
●
●
●●
●●
●
●
●
●
●
●
●●
●●
●●
●●
●
●
●
●●
●
●
● ●
●●
●
●
●
●●●●
●
●
●
●●
●●●●
●
●
●
●
●●●
●●
●●
●
●
●
●
●●●
●
●
●
●●
●
●●●
●
●
●
●
●
●●
●
●
●
●
●
●●
●●●
●● ●
● ●
●
●●
●
●
●
●
●
●
●
●
●
●●
●
●●●
●
●●
●
● ● ●
●
●
●
●●●●
●
●
●
●
●
●
●●
●
●
●
●
●●●●●
●
● ●
●
●
●
●
●
●●
●
●
●
●
●
●●
●●●
●●● ●
●
● ●
●
●
●
●●●
●
●
●● ● ●
●●
●
●
●●
●
●
●●●●
●
●●
●
●
●
●
●
●●
●●●
●
●
●●
●
●
● ●
●
●
●●
●
●
● ●
●
●●
● ●
●
●
●
●●
● ●●
●
●
●
●●●
●
●●
●●
●●
●●
●
●● ●
●
●
● ●●●●
●
●
●
●●●
●
●
●
●●
●●●
●●●
●●
●
●
●
●
●
●
●
●
●
●
●●
●
●●
●●
● ●
●●
●●●
●●
●
●
●●
●
●●
●
●●●
●
●
●●●
●●
●
●
●
●●
●
●●
●
●●●
●●
●●
●●
●●
●
●●
●
●●
●●●
●●
●
●
●
●
0 cM/Mb
22 cM/Mb
UBE2E3 +
MIR4437 −
ITGA4 +
CERKL −
NEUROD1 −
SSFA2 +
0
5
10
15
20
182000000 182250000 182500000 182750000Position in BP
Baye
s Fa
ctor
Association Type●
●
ConditionalPrimary
Chromosome 2 − Monocytes
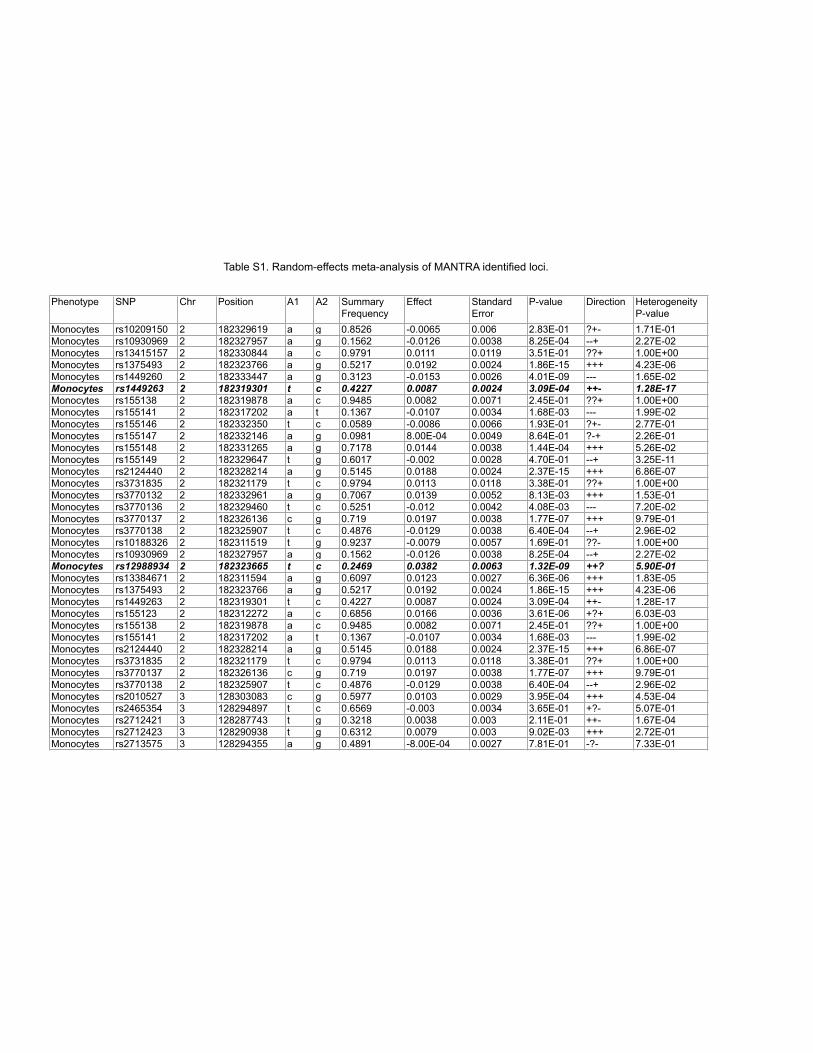
Table S1. Random-effects meta-analysis of MANTRA identified loci.
Phenotype SNP Chr Position A1 A2 Summary Frequency
Effect Standard Error
P-value Direction Heterogeneity P-value
Monocytes rs10209150 2 182329619 a g 0.8526 -0.0065 0.006 2.83E-01 ?+- 1.71E-01Monocytes rs10930969 2 182327957 a g 0.1562 -0.0126 0.0038 8.25E-04 --+ 2.27E-02Monocytes rs13415157 2 182330844 a c 0.9791 0.0111 0.0119 3.51E-01 ??+ 1.00E+00Monocytes rs1375493 2 182323766 a g 0.5217 0.0192 0.0024 1.86E-15 +++ 4.23E-06Monocytes rs1449260 2 182333447 a g 0.3123 -0.0153 0.0026 4.01E-09 --- 1.65E-02Monocytes rs1449263 2 182319301 t c 0.4227 0.0087 0.0024 3.09E-04 ++- 1.28E-17Monocytes rs155138 2 182319878 a c 0.9485 0.0082 0.0071 2.45E-01 ??+ 1.00E+00Monocytes rs155141 2 182317202 a t 0.1367 -0.0107 0.0034 1.68E-03 --- 1.99E-02Monocytes rs155146 2 182332350 t c 0.0589 -0.0086 0.0066 1.93E-01 ?+- 2.77E-01Monocytes rs155147 2 182332146 a g 0.0981 8.00E-04 0.0049 8.64E-01 ?-+ 2.26E-01Monocytes rs155148 2 182331265 a g 0.7178 0.0144 0.0038 1.44E-04 +++ 5.26E-02Monocytes rs155149 2 182329647 t g 0.6017 -0.002 0.0028 4.70E-01 --+ 3.25E-11Monocytes rs2124440 2 182328214 a g 0.5145 0.0188 0.0024 2.37E-15 +++ 6.86E-07Monocytes rs3731835 2 182321179 t c 0.9794 0.0113 0.0118 3.38E-01 ??+ 1.00E+00Monocytes rs3770132 2 182332961 a g 0.7067 0.0139 0.0052 8.13E-03 +++ 1.53E-01Monocytes rs3770136 2 182329460 t c 0.5251 -0.012 0.0042 4.08E-03 --- 7.20E-02Monocytes rs3770137 2 182326136 c g 0.719 0.0197 0.0038 1.77E-07 +++ 9.79E-01Monocytes rs3770138 2 182325907 t c 0.4876 -0.0129 0.0038 6.40E-04 --+ 2.96E-02Monocytes rs10188326 2 182311519 t g 0.9237 -0.0079 0.0057 1.69E-01 ??- 1.00E+00Monocytes rs10930969 2 182327957 a g 0.1562 -0.0126 0.0038 8.25E-04 --+ 2.27E-02Monocytes rs12988934 2 182323665 t c 0.2469 0.0382 0.0063 1.32E-09 ++? 5.90E-01Monocytes rs13384671 2 182311594 a g 0.6097 0.0123 0.0027 6.36E-06 +++ 1.83E-05Monocytes rs1375493 2 182323766 a g 0.5217 0.0192 0.0024 1.86E-15 +++ 4.23E-06Monocytes rs1449263 2 182319301 t c 0.4227 0.0087 0.0024 3.09E-04 ++- 1.28E-17Monocytes rs155123 2 182312272 a c 0.6856 0.0166 0.0036 3.61E-06 +?+ 6.03E-03Monocytes rs155138 2 182319878 a c 0.9485 0.0082 0.0071 2.45E-01 ??+ 1.00E+00Monocytes rs155141 2 182317202 a t 0.1367 -0.0107 0.0034 1.68E-03 --- 1.99E-02Monocytes rs2124440 2 182328214 a g 0.5145 0.0188 0.0024 2.37E-15 +++ 6.86E-07Monocytes rs3731835 2 182321179 t c 0.9794 0.0113 0.0118 3.38E-01 ??+ 1.00E+00Monocytes rs3770137 2 182326136 c g 0.719 0.0197 0.0038 1.77E-07 +++ 9.79E-01Monocytes rs3770138 2 182325907 t c 0.4876 -0.0129 0.0038 6.40E-04 --+ 2.96E-02Monocytes rs2010527 3 128303083 c g 0.5977 0.0103 0.0029 3.95E-04 +++ 4.53E-04Monocytes rs2465354 3 128294897 t c 0.6569 -0.003 0.0034 3.65E-01 +?- 5.07E-01Monocytes rs2712421 3 128287743 t g 0.3218 0.0038 0.003 2.11E-01 ++- 1.67E-04Monocytes rs2712423 3 128290938 t g 0.6312 0.0079 0.003 9.02E-03 +++ 2.72E-01Monocytes rs2713575 3 128294355 a g 0.4891 -8.00E-04 0.0027 7.81E-01 -?- 7.33E-01
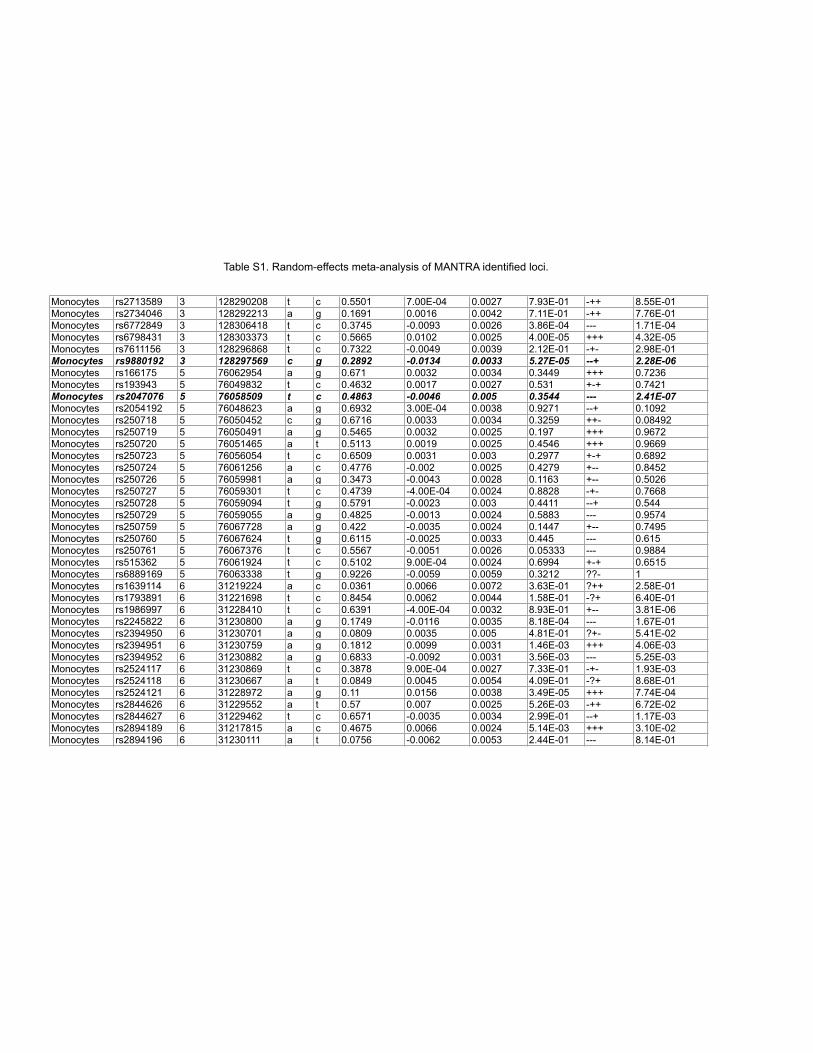
Table S1. Random-effects meta-analysis of MANTRA identified loci.
Monocytes rs2713589 3 128290208 t c 0.5501 7.00E-04 0.0027 7.93E-01 -++ 8.55E-01Monocytes rs2734046 3 128292213 a g 0.1691 0.0016 0.0042 7.11E-01 -++ 7.76E-01Monocytes rs6772849 3 128306418 t c 0.3745 -0.0093 0.0026 3.86E-04 --- 1.71E-04Monocytes rs6798431 3 128303373 t c 0.5665 0.0102 0.0025 4.00E-05 +++ 4.32E-05Monocytes rs7611156 3 128296868 t c 0.7322 -0.0049 0.0039 2.12E-01 -+- 2.98E-01Monocytes rs9880192 3 128297569 c g 0.2892 -0.0134 0.0033 5.27E-05 --+ 2.28E-06Monocytes rs166175 5 76062954 a g 0.671 0.0032 0.0034 0.3449 +++ 0.7236Monocytes rs193943 5 76049832 t c 0.4632 0.0017 0.0027 0.531 +-+ 0.7421Monocytes rs2047076 5 76058509 t c 0.4863 -0.0046 0.005 0.3544 --- 2.41E-07Monocytes rs2054192 5 76048623 a g 0.6932 3.00E-04 0.0038 0.9271 --+ 0.1092Monocytes rs250718 5 76050452 c g 0.6716 0.0033 0.0034 0.3259 ++- 0.08492Monocytes rs250719 5 76050491 a g 0.5465 0.0032 0.0025 0.197 +++ 0.9672Monocytes rs250720 5 76051465 a t 0.5113 0.0019 0.0025 0.4546 +++ 0.9669Monocytes rs250723 5 76056054 t c 0.6509 0.0031 0.003 0.2977 +-+ 0.6892Monocytes rs250724 5 76061256 a c 0.4776 -0.002 0.0025 0.4279 +-- 0.8452Monocytes rs250726 5 76059981 a g 0.3473 -0.0043 0.0028 0.1163 +-- 0.5026Monocytes rs250727 5 76059301 t c 0.4739 -4.00E-04 0.0024 0.8828 -+- 0.7668Monocytes rs250728 5 76059094 t g 0.5791 -0.0023 0.003 0.4411 --+ 0.544Monocytes rs250729 5 76059055 a g 0.4825 -0.0013 0.0024 0.5883 --- 0.9574Monocytes rs250759 5 76067728 a g 0.422 -0.0035 0.0024 0.1447 +-- 0.7495Monocytes rs250760 5 76067624 t g 0.6115 -0.0025 0.0033 0.445 --- 0.615Monocytes rs250761 5 76067376 t c 0.5567 -0.0051 0.0026 0.05333 --- 0.9884Monocytes rs515362 5 76061924 t c 0.5102 9.00E-04 0.0024 0.6994 +-+ 0.6515Monocytes rs6889169 5 76063338 t g 0.9226 -0.0059 0.0059 0.3212 ??- 1Monocytes rs1639114 6 31219224 a c 0.0361 0.0066 0.0072 3.63E-01 ?++ 2.58E-01Monocytes rs1793891 6 31221698 t c 0.8454 0.0062 0.0044 1.58E-01 -?+ 6.40E-01Monocytes rs1986997 6 31228410 t c 0.6391 -4.00E-04 0.0032 8.93E-01 +-- 3.81E-06Monocytes rs2245822 6 31230800 a g 0.1749 -0.0116 0.0035 8.18E-04 --- 1.67E-01Monocytes rs2394950 6 31230701 a g 0.0809 0.0035 0.005 4.81E-01 ?+- 5.41E-02Monocytes rs2394951 6 31230759 a g 0.1812 0.0099 0.0031 1.46E-03 +++ 4.06E-03Monocytes rs2394952 6 31230882 a g 0.6833 -0.0092 0.0031 3.56E-03 --- 5.25E-03Monocytes rs2524117 6 31230869 t c 0.3878 9.00E-04 0.0027 7.33E-01 -+- 1.93E-03Monocytes rs2524118 6 31230667 a t 0.0849 0.0045 0.0054 4.09E-01 -?+ 8.68E-01Monocytes rs2524121 6 31228972 a g 0.11 0.0156 0.0038 3.49E-05 +++ 7.74E-04Monocytes rs2844626 6 31229552 a t 0.57 0.007 0.0025 5.26E-03 -++ 6.72E-02Monocytes rs2844627 6 31229462 t c 0.6571 -0.0035 0.0034 2.99E-01 --+ 1.17E-03Monocytes rs2894189 6 31217815 a c 0.4675 0.0066 0.0024 5.14E-03 +++ 3.10E-02Monocytes rs2894196 6 31230111 a t 0.0756 -0.0062 0.0053 2.44E-01 --- 8.14E-01
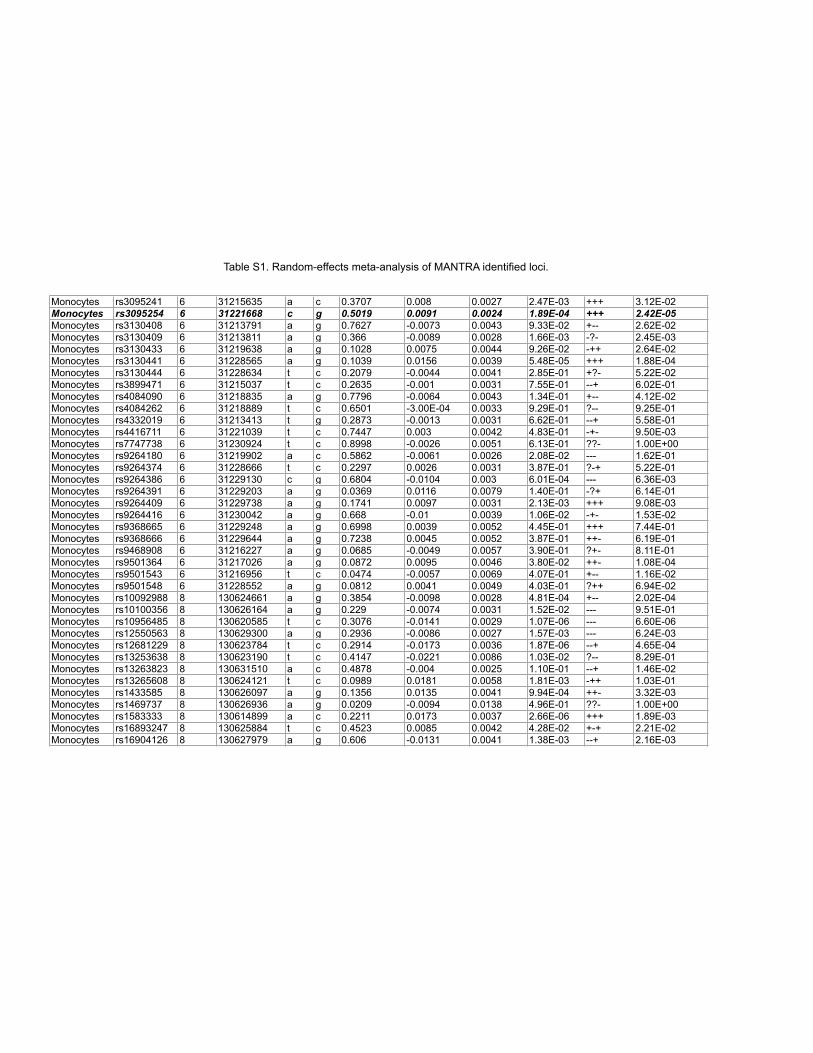
Table S1. Random-effects meta-analysis of MANTRA identified loci.
Monocytes rs3095241 6 31215635 a c 0.3707 0.008 0.0027 2.47E-03 +++ 3.12E-02Monocytes rs3095254 6 31221668 c g 0.5019 0.0091 0.0024 1.89E-04 +++ 2.42E-05Monocytes rs3130408 6 31213791 a g 0.7627 -0.0073 0.0043 9.33E-02 +-- 2.62E-02Monocytes rs3130409 6 31213811 a g 0.366 -0.0089 0.0028 1.66E-03 -?- 2.45E-03Monocytes rs3130433 6 31219638 a g 0.1028 0.0075 0.0044 9.26E-02 -++ 2.64E-02Monocytes rs3130441 6 31228565 a g 0.1039 0.0156 0.0039 5.48E-05 +++ 1.88E-04Monocytes rs3130444 6 31228634 t c 0.2079 -0.0044 0.0041 2.85E-01 +?- 5.22E-02Monocytes rs3899471 6 31215037 t c 0.2635 -0.001 0.0031 7.55E-01 --+ 6.02E-01Monocytes rs4084090 6 31218835 a g 0.7796 -0.0064 0.0043 1.34E-01 +-- 4.12E-02Monocytes rs4084262 6 31218889 t c 0.6501 -3.00E-04 0.0033 9.29E-01 ?-- 9.25E-01Monocytes rs4332019 6 31213413 t g 0.2873 -0.0013 0.0031 6.62E-01 --+ 5.58E-01Monocytes rs4416711 6 31221039 t c 0.7447 0.003 0.0042 4.83E-01 -+- 9.50E-03Monocytes rs7747738 6 31230924 t c 0.8998 -0.0026 0.0051 6.13E-01 ??- 1.00E+00Monocytes rs9264180 6 31219902 a c 0.5862 -0.0061 0.0026 2.08E-02 --- 1.62E-01Monocytes rs9264374 6 31228666 t c 0.2297 0.0026 0.0031 3.87E-01 ?-+ 5.22E-01Monocytes rs9264386 6 31229130 c g 0.6804 -0.0104 0.003 6.01E-04 --- 6.36E-03Monocytes rs9264391 6 31229203 a g 0.0369 0.0116 0.0079 1.40E-01 -?+ 6.14E-01Monocytes rs9264409 6 31229738 a g 0.1741 0.0097 0.0031 2.13E-03 +++ 9.08E-03Monocytes rs9264416 6 31230042 a g 0.668 -0.01 0.0039 1.06E-02 -+- 1.53E-02Monocytes rs9368665 6 31229248 a g 0.6998 0.0039 0.0052 4.45E-01 +++ 7.44E-01Monocytes rs9368666 6 31229644 a g 0.7238 0.0045 0.0052 3.87E-01 ++- 6.19E-01Monocytes rs9468908 6 31216227 a g 0.0685 -0.0049 0.0057 3.90E-01 ?+- 8.11E-01Monocytes rs9501364 6 31217026 a g 0.0872 0.0095 0.0046 3.80E-02 ++- 1.08E-04Monocytes rs9501543 6 31216956 t c 0.0474 -0.0057 0.0069 4.07E-01 +-- 1.16E-02Monocytes rs9501548 6 31228552 a g 0.0812 0.0041 0.0049 4.03E-01 ?++ 6.94E-02Monocytes rs10092988 8 130624661 a g 0.3854 -0.0098 0.0028 4.81E-04 +-- 2.02E-04Monocytes rs10100356 8 130626164 a g 0.229 -0.0074 0.0031 1.52E-02 --- 9.51E-01Monocytes rs10956485 8 130620585 t c 0.3076 -0.0141 0.0029 1.07E-06 --- 6.60E-06Monocytes rs12550563 8 130629300 a g 0.2936 -0.0086 0.0027 1.57E-03 --- 6.24E-03Monocytes rs12681229 8 130623784 t c 0.2914 -0.0173 0.0036 1.87E-06 --+ 4.65E-04Monocytes rs13253638 8 130623190 t c 0.4147 -0.0221 0.0086 1.03E-02 ?-- 8.29E-01Monocytes rs13263823 8 130631510 a c 0.4878 -0.004 0.0025 1.10E-01 --+ 1.46E-02Monocytes rs13265608 8 130624121 t c 0.0989 0.0181 0.0058 1.81E-03 -++ 1.03E-01Monocytes rs1433585 8 130626097 a g 0.1356 0.0135 0.0041 9.94E-04 ++- 3.32E-03Monocytes rs1469737 8 130626936 a g 0.0209 -0.0094 0.0138 4.96E-01 ??- 1.00E+00Monocytes rs1583333 8 130614899 a c 0.2211 0.0173 0.0037 2.66E-06 +++ 1.89E-03Monocytes rs16893247 8 130625884 t c 0.4523 0.0085 0.0042 4.28E-02 +-+ 2.21E-02Monocytes rs16904126 8 130627979 a g 0.606 -0.0131 0.0041 1.38E-03 --+ 2.16E-03
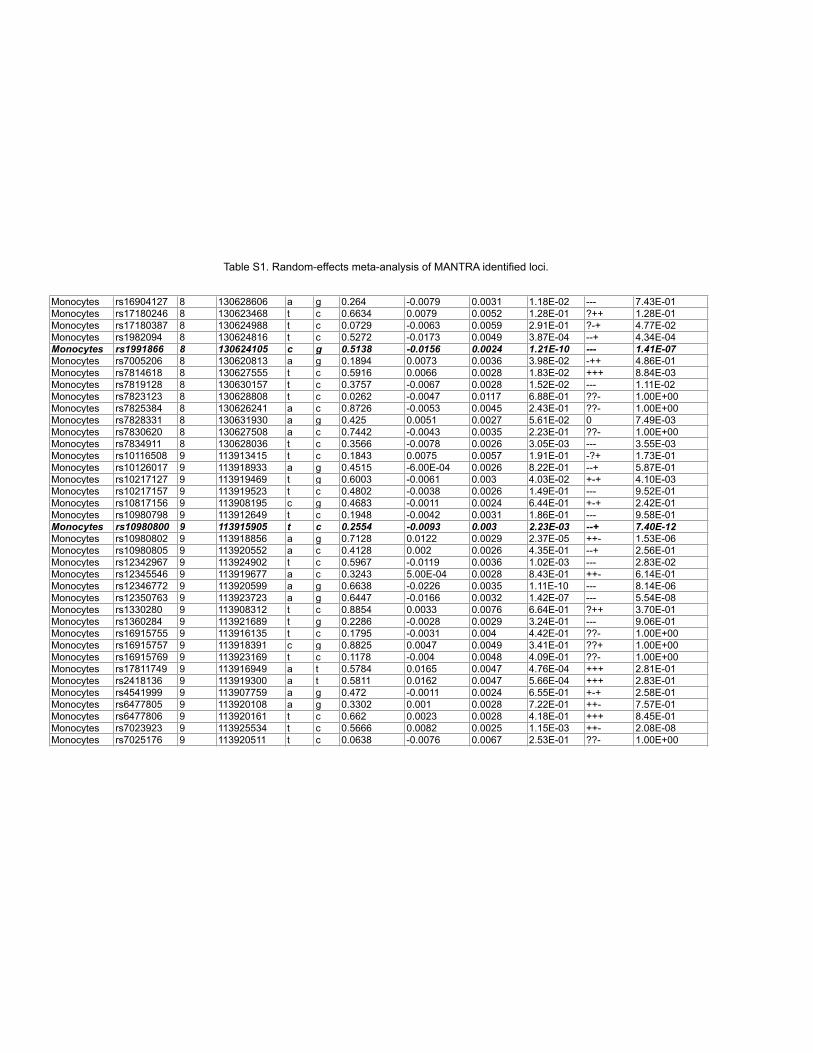
Table S1. Random-effects meta-analysis of MANTRA identified loci.
Monocytes rs16904127 8 130628606 a g 0.264 -0.0079 0.0031 1.18E-02 --- 7.43E-01Monocytes rs17180246 8 130623468 t c 0.6634 0.0079 0.0052 1.28E-01 ?++ 1.28E-01Monocytes rs17180387 8 130624988 t c 0.0729 -0.0063 0.0059 2.91E-01 ?-+ 4.77E-02Monocytes rs1982094 8 130624816 t c 0.5272 -0.0173 0.0049 3.87E-04 --+ 4.34E-04Monocytes rs1991866 8 130624105 c g 0.5138 -0.0156 0.0024 1.21E-10 --- 1.41E-07Monocytes rs7005206 8 130620813 a g 0.1894 0.0073 0.0036 3.98E-02 -++ 4.86E-01Monocytes rs7814618 8 130627555 t c 0.5916 0.0066 0.0028 1.83E-02 +++ 8.84E-03Monocytes rs7819128 8 130630157 t c 0.3757 -0.0067 0.0028 1.52E-02 --- 1.11E-02Monocytes rs7823123 8 130628808 t c 0.0262 -0.0047 0.0117 6.88E-01 ??- 1.00E+00Monocytes rs7825384 8 130626241 a c 0.8726 -0.0053 0.0045 2.43E-01 ??- 1.00E+00Monocytes rs7828331 8 130631930 a g 0.425 0.0051 0.0027 5.61E-02 0 7.49E-03Monocytes rs7830620 8 130627508 a c 0.7442 -0.0043 0.0035 2.23E-01 ??- 1.00E+00Monocytes rs7834911 8 130628036 t c 0.3566 -0.0078 0.0026 3.05E-03 --- 3.55E-03Monocytes rs10116508 9 113913415 t c 0.1843 0.0075 0.0057 1.91E-01 -?+ 1.73E-01Monocytes rs10126017 9 113918933 a g 0.4515 -6.00E-04 0.0026 8.22E-01 --+ 5.87E-01Monocytes rs10217127 9 113919469 t g 0.6003 -0.0061 0.003 4.03E-02 +-+ 4.10E-03Monocytes rs10217157 9 113919523 t c 0.4802 -0.0038 0.0026 1.49E-01 --- 9.52E-01Monocytes rs10817156 9 113908195 c g 0.4683 -0.0011 0.0024 6.44E-01 +-+ 2.42E-01Monocytes rs10980798 9 113912649 t c 0.1948 -0.0042 0.0031 1.86E-01 --- 9.58E-01Monocytes rs10980800 9 113915905 t c 0.2554 -0.0093 0.003 2.23E-03 --+ 7.40E-12Monocytes rs10980802 9 113918856 a g 0.7128 0.0122 0.0029 2.37E-05 ++- 1.53E-06Monocytes rs10980805 9 113920552 a c 0.4128 0.002 0.0026 4.35E-01 --+ 2.56E-01Monocytes rs12342967 9 113924902 t c 0.5967 -0.0119 0.0036 1.02E-03 --- 2.83E-02Monocytes rs12345546 9 113919677 a c 0.3243 5.00E-04 0.0028 8.43E-01 ++- 6.14E-01Monocytes rs12346772 9 113920599 a g 0.6638 -0.0226 0.0035 1.11E-10 --- 8.14E-06Monocytes rs12350763 9 113923723 a g 0.6447 -0.0166 0.0032 1.42E-07 --- 5.54E-08Monocytes rs1330280 9 113908312 t c 0.8854 0.0033 0.0076 6.64E-01 ?++ 3.70E-01Monocytes rs1360284 9 113921689 t g 0.2286 -0.0028 0.0029 3.24E-01 --- 9.06E-01Monocytes rs16915755 9 113916135 t c 0.1795 -0.0031 0.004 4.42E-01 ??- 1.00E+00Monocytes rs16915757 9 113918391 c g 0.8825 0.0047 0.0049 3.41E-01 ??+ 1.00E+00Monocytes rs16915769 9 113923169 t c 0.1178 -0.004 0.0048 4.09E-01 ??- 1.00E+00Monocytes rs17811749 9 113916949 a t 0.5784 0.0165 0.0047 4.76E-04 +++ 2.81E-01Monocytes rs2418136 9 113919300 a t 0.5811 0.0162 0.0047 5.66E-04 +++ 2.83E-01Monocytes rs4541999 9 113907759 a g 0.472 -0.0011 0.0024 6.55E-01 +-+ 2.58E-01Monocytes rs6477805 9 113920108 a g 0.3302 0.001 0.0028 7.22E-01 ++- 7.57E-01Monocytes rs6477806 9 113920161 t c 0.662 0.0023 0.0028 4.18E-01 +++ 8.45E-01Monocytes rs7023923 9 113925534 t c 0.5666 0.0082 0.0025 1.15E-03 ++- 2.08E-08Monocytes rs7025176 9 113920511 t c 0.0638 -0.0076 0.0067 2.53E-01 ??- 1.00E+00
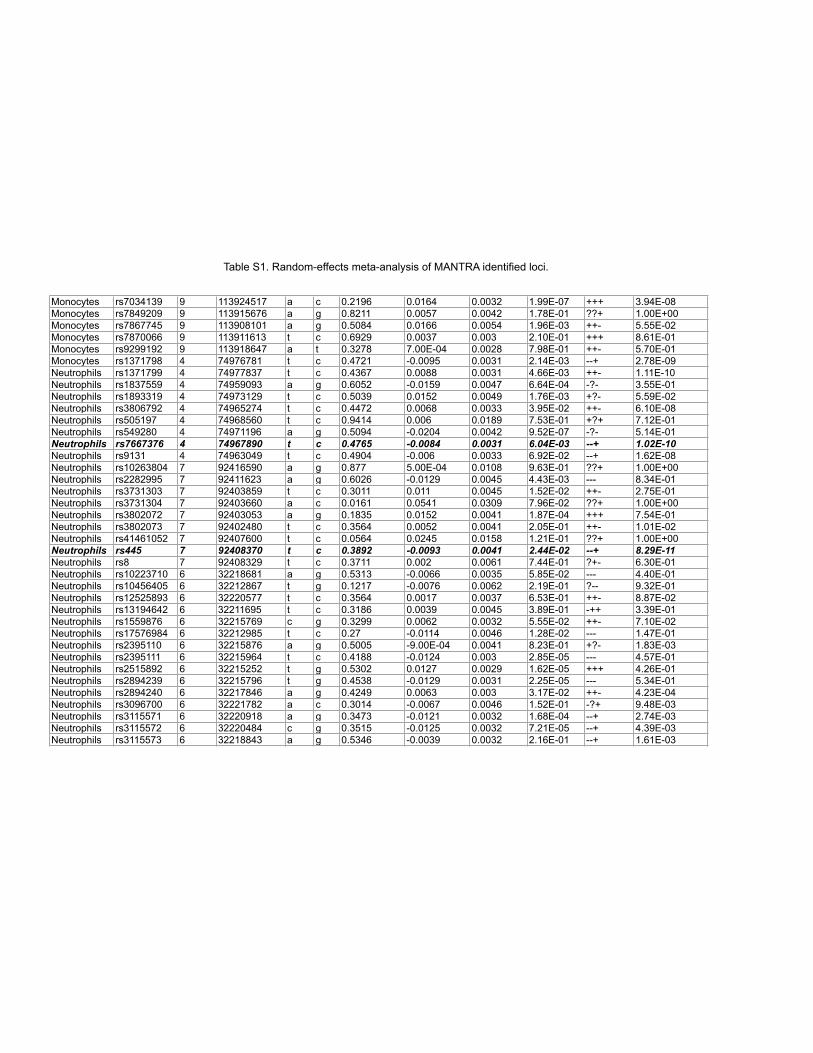
Table S1. Random-effects meta-analysis of MANTRA identified loci.
Monocytes rs7034139 9 113924517 a c 0.2196 0.0164 0.0032 1.99E-07 +++ 3.94E-08Monocytes rs7849209 9 113915676 a g 0.8211 0.0057 0.0042 1.78E-01 ??+ 1.00E+00Monocytes rs7867745 9 113908101 a g 0.5084 0.0166 0.0054 1.96E-03 ++- 5.55E-02Monocytes rs7870066 9 113911613 t c 0.6929 0.0037 0.003 2.10E-01 +++ 8.61E-01Monocytes rs9299192 9 113918647 a t 0.3278 7.00E-04 0.0028 7.98E-01 ++- 5.70E-01Monocytes rs1371798 4 74976781 t c 0.4721 -0.0095 0.0031 2.14E-03 --+ 2.78E-09Neutrophils rs1371799 4 74977837 t c 0.4367 0.0088 0.0031 4.66E-03 ++- 1.11E-10Neutrophils rs1837559 4 74959093 a g 0.6052 -0.0159 0.0047 6.64E-04 -?- 3.55E-01Neutrophils rs1893319 4 74973129 t c 0.5039 0.0152 0.0049 1.76E-03 +?- 5.59E-02Neutrophils rs3806792 4 74965274 t c 0.4472 0.0068 0.0033 3.95E-02 ++- 6.10E-08Neutrophils rs505197 4 74968560 t c 0.9414 0.006 0.0189 7.53E-01 +?+ 7.12E-01Neutrophils rs549280 4 74971196 a g 0.5094 -0.0204 0.0042 9.52E-07 -?- 5.14E-01Neutrophils rs7667376 4 74967890 t c 0.4765 -0.0084 0.0031 6.04E-03 --+ 1.02E-10Neutrophils rs9131 4 74963049 t c 0.4904 -0.006 0.0033 6.92E-02 --+ 1.62E-08Neutrophils rs10263804 7 92416590 a g 0.877 5.00E-04 0.0108 9.63E-01 ??+ 1.00E+00Neutrophils rs2282995 7 92411623 a g 0.6026 -0.0129 0.0045 4.43E-03 --- 8.34E-01Neutrophils rs3731303 7 92403859 t c 0.3011 0.011 0.0045 1.52E-02 ++- 2.75E-01Neutrophils rs3731304 7 92403660 a c 0.0161 0.0541 0.0309 7.96E-02 ??+ 1.00E+00Neutrophils rs3802072 7 92403053 a g 0.1835 0.0152 0.0041 1.87E-04 +++ 7.54E-01Neutrophils rs3802073 7 92402480 t c 0.3564 0.0052 0.0041 2.05E-01 ++- 1.01E-02Neutrophils rs41461052 7 92407600 t c 0.0564 0.0245 0.0158 1.21E-01 ??+ 1.00E+00Neutrophils rs445 7 92408370 t c 0.3892 -0.0093 0.0041 2.44E-02 --+ 8.29E-11Neutrophils rs8 7 92408329 t c 0.3711 0.002 0.0061 7.44E-01 ?+- 6.30E-01Neutrophils rs10223710 6 32218681 a g 0.5313 -0.0066 0.0035 5.85E-02 --- 4.40E-01Neutrophils rs10456405 6 32212867 t g 0.1217 -0.0076 0.0062 2.19E-01 ?-- 9.32E-01Neutrophils rs12525893 6 32220577 t c 0.3564 0.0017 0.0037 6.53E-01 ++- 8.87E-02Neutrophils rs13194642 6 32211695 t c 0.3186 0.0039 0.0045 3.89E-01 -++ 3.39E-01Neutrophils rs1559876 6 32215769 c g 0.3299 0.0062 0.0032 5.55E-02 ++- 7.10E-02Neutrophils rs17576984 6 32212985 t c 0.27 -0.0114 0.0046 1.28E-02 --- 1.47E-01Neutrophils rs2395110 6 32215876 a g 0.5005 -9.00E-04 0.0041 8.23E-01 +?- 1.83E-03Neutrophils rs2395111 6 32215964 t c 0.4188 -0.0124 0.003 2.85E-05 --- 4.57E-01Neutrophils rs2515892 6 32215252 t g 0.5302 0.0127 0.0029 1.62E-05 +++ 4.26E-01Neutrophils rs2894239 6 32215796 t g 0.4538 -0.0129 0.0031 2.25E-05 --- 5.34E-01Neutrophils rs2894240 6 32217846 a g 0.4249 0.0063 0.003 3.17E-02 ++- 4.23E-04Neutrophils rs3096700 6 32221782 a c 0.3014 -0.0067 0.0046 1.52E-01 -?+ 9.48E-03Neutrophils rs3115571 6 32220918 a g 0.3473 -0.0121 0.0032 1.68E-04 --+ 2.74E-03Neutrophils rs3115572 6 32220484 c g 0.3515 -0.0125 0.0032 7.21E-05 --+ 4.39E-03Neutrophils rs3115573 6 32218843 a g 0.5346 -0.0039 0.0032 2.16E-01 --+ 1.61E-03
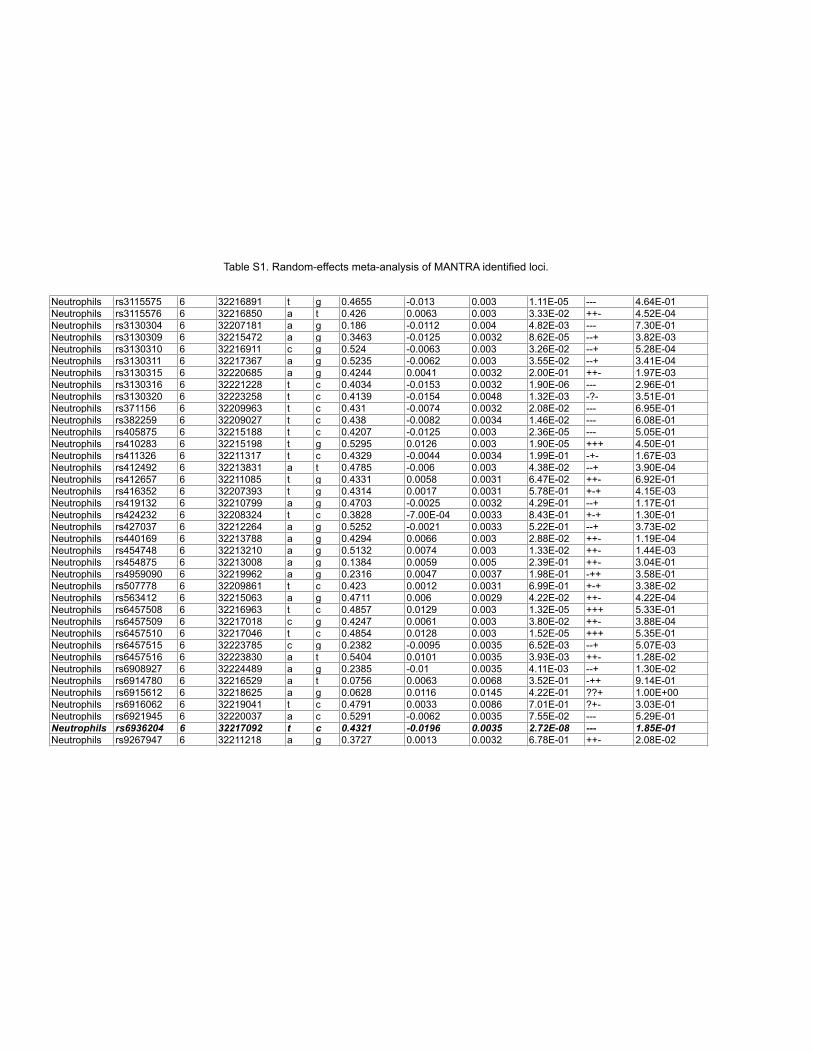
Table S1. Random-effects meta-analysis of MANTRA identified loci.
Neutrophils rs3115575 6 32216891 t g 0.4655 -0.013 0.003 1.11E-05 --- 4.64E-01Neutrophils rs3115576 6 32216850 a t 0.426 0.0063 0.003 3.33E-02 ++- 4.52E-04Neutrophils rs3130304 6 32207181 a g 0.186 -0.0112 0.004 4.82E-03 --- 7.30E-01Neutrophils rs3130309 6 32215472 a g 0.3463 -0.0125 0.0032 8.62E-05 --+ 3.82E-03Neutrophils rs3130310 6 32216911 c g 0.524 -0.0063 0.003 3.26E-02 --+ 5.28E-04Neutrophils rs3130311 6 32217367 a g 0.5235 -0.0062 0.003 3.55E-02 --+ 3.41E-04Neutrophils rs3130315 6 32220685 a g 0.4244 0.0041 0.0032 2.00E-01 ++- 1.97E-03Neutrophils rs3130316 6 32221228 t c 0.4034 -0.0153 0.0032 1.90E-06 --- 2.96E-01Neutrophils rs3130320 6 32223258 t c 0.4139 -0.0154 0.0048 1.32E-03 -?- 3.51E-01Neutrophils rs371156 6 32209963 t c 0.431 -0.0074 0.0032 2.08E-02 --- 6.95E-01Neutrophils rs382259 6 32209027 t c 0.438 -0.0082 0.0034 1.46E-02 --- 6.08E-01Neutrophils rs405875 6 32215188 t c 0.4207 -0.0125 0.003 2.36E-05 --- 5.05E-01Neutrophils rs410283 6 32215198 t g 0.5295 0.0126 0.003 1.90E-05 +++ 4.50E-01Neutrophils rs411326 6 32211317 t c 0.4329 -0.0044 0.0034 1.99E-01 -+- 1.67E-03Neutrophils rs412492 6 32213831 a t 0.4785 -0.006 0.003 4.38E-02 --+ 3.90E-04Neutrophils rs412657 6 32211085 t g 0.4331 0.0058 0.0031 6.47E-02 ++- 6.92E-01Neutrophils rs416352 6 32207393 t g 0.4314 0.0017 0.0031 5.78E-01 +-+ 4.15E-03Neutrophils rs419132 6 32210799 a g 0.4703 -0.0025 0.0032 4.29E-01 --+ 1.17E-01Neutrophils rs424232 6 32208324 t c 0.3828 -7.00E-04 0.0033 8.43E-01 +-+ 1.30E-01Neutrophils rs427037 6 32212264 a g 0.5252 -0.0021 0.0033 5.22E-01 --+ 3.73E-02Neutrophils rs440169 6 32213788 a g 0.4294 0.0066 0.003 2.88E-02 ++- 1.19E-04Neutrophils rs454748 6 32213210 a g 0.5132 0.0074 0.003 1.33E-02 ++- 1.44E-03Neutrophils rs454875 6 32213008 a g 0.1384 0.0059 0.005 2.39E-01 ++- 3.04E-01Neutrophils rs4959090 6 32219962 a g 0.2316 0.0047 0.0037 1.98E-01 -++ 3.58E-01Neutrophils rs507778 6 32209861 t c 0.423 0.0012 0.0031 6.99E-01 +-+ 3.38E-02Neutrophils rs563412 6 32215063 a g 0.4711 0.006 0.0029 4.22E-02 ++- 4.22E-04Neutrophils rs6457508 6 32216963 t c 0.4857 0.0129 0.003 1.32E-05 +++ 5.33E-01Neutrophils rs6457509 6 32217018 c g 0.4247 0.0061 0.003 3.80E-02 ++- 3.88E-04Neutrophils rs6457510 6 32217046 t c 0.4854 0.0128 0.003 1.52E-05 +++ 5.35E-01Neutrophils rs6457515 6 32223785 c g 0.2382 -0.0095 0.0035 6.52E-03 --+ 5.07E-03Neutrophils rs6457516 6 32223830 a t 0.5404 0.0101 0.0035 3.93E-03 ++- 1.28E-02Neutrophils rs6908927 6 32224489 a g 0.2385 -0.01 0.0035 4.11E-03 --+ 1.30E-02Neutrophils rs6914780 6 32216529 a t 0.0756 0.0063 0.0068 3.52E-01 -++ 9.14E-01Neutrophils rs6915612 6 32218625 a g 0.0628 0.0116 0.0145 4.22E-01 ??+ 1.00E+00Neutrophils rs6916062 6 32219041 t c 0.4791 0.0033 0.0086 7.01E-01 ?+- 3.03E-01Neutrophils rs6921945 6 32220037 a c 0.5291 -0.0062 0.0035 7.55E-02 --- 5.29E-01Neutrophils rs6936204 6 32217092 t c 0.4321 -0.0196 0.0035 2.72E-08 --- 1.85E-01Neutrophils rs9267947 6 32211218 a g 0.3727 0.0013 0.0032 6.78E-01 ++- 2.08E-02
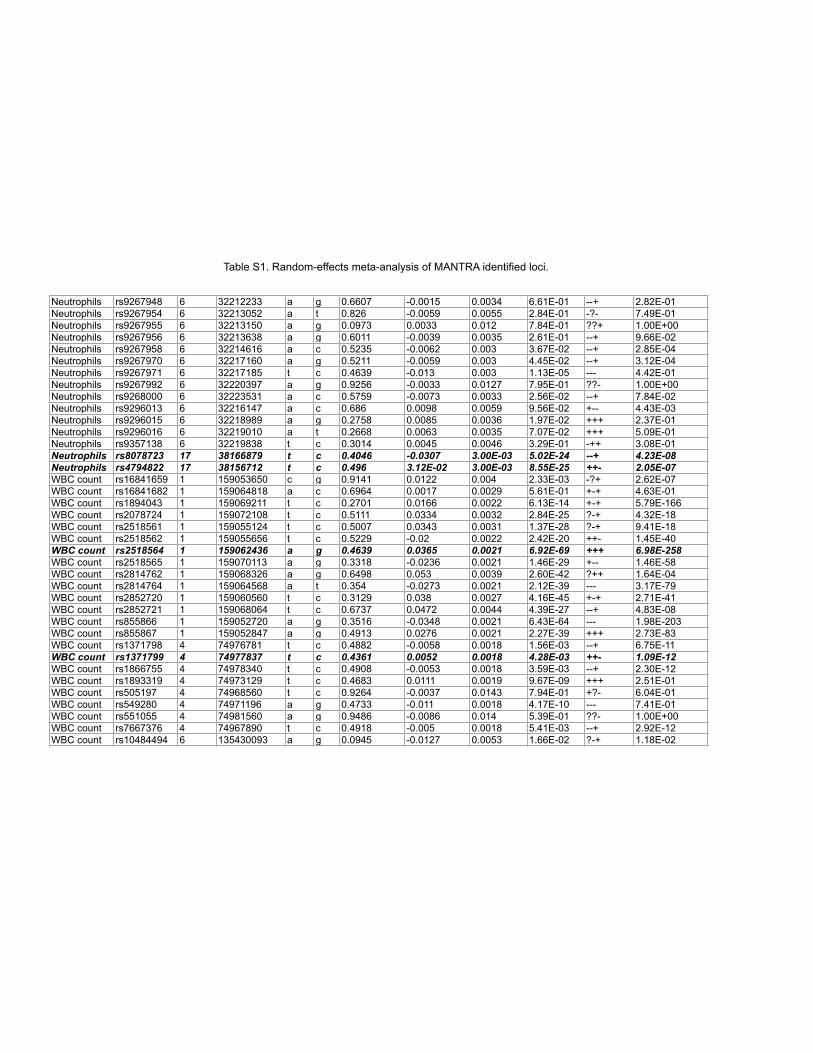
Table S1. Random-effects meta-analysis of MANTRA identified loci.
Neutrophils rs9267948 6 32212233 a g 0.6607 -0.0015 0.0034 6.61E-01 --+ 2.82E-01Neutrophils rs9267954 6 32213052 a t 0.826 -0.0059 0.0055 2.84E-01 -?- 7.49E-01Neutrophils rs9267955 6 32213150 a g 0.0973 0.0033 0.012 7.84E-01 ??+ 1.00E+00Neutrophils rs9267956 6 32213638 a g 0.6011 -0.0039 0.0035 2.61E-01 --+ 9.66E-02Neutrophils rs9267958 6 32214616 a c 0.5235 -0.0062 0.003 3.67E-02 --+ 2.85E-04Neutrophils rs9267970 6 32217160 a g 0.5211 -0.0059 0.003 4.45E-02 --+ 3.12E-04Neutrophils rs9267971 6 32217185 t c 0.4639 -0.013 0.003 1.13E-05 --- 4.42E-01Neutrophils rs9267992 6 32220397 a g 0.9256 -0.0033 0.0127 7.95E-01 ??- 1.00E+00Neutrophils rs9268000 6 32223531 a c 0.5759 -0.0073 0.0033 2.56E-02 --+ 7.84E-02Neutrophils rs9296013 6 32216147 a c 0.686 0.0098 0.0059 9.56E-02 +-- 4.43E-03Neutrophils rs9296015 6 32218989 a g 0.2758 0.0085 0.0036 1.97E-02 +++ 2.37E-01Neutrophils rs9296016 6 32219010 a t 0.2668 0.0063 0.0035 7.07E-02 +++ 5.09E-01Neutrophils rs9357138 6 32219838 t c 0.3014 0.0045 0.0046 3.29E-01 -++ 3.08E-01Neutrophils rs8078723 17 38166879 t c 0.4046 -0.0307 3.00E-03 5.02E-24 --+ 4.23E-08Neutrophils rs4794822 17 38156712 t c 0.496 3.12E-02 3.00E-03 8.55E-25 ++- 2.05E-07WBC count rs16841659 1 159053650 c g 0.9141 0.0122 0.004 2.33E-03 -?+ 2.62E-07WBC count rs16841682 1 159064818 a c 0.6964 0.0017 0.0029 5.61E-01 +-+ 4.63E-01WBC count rs1894043 1 159069211 t c 0.2701 0.0166 0.0022 6.13E-14 +-+ 5.79E-166WBC count rs2078724 1 159072108 t c 0.5111 0.0334 0.0032 2.84E-25 ?-+ 4.32E-18WBC count rs2518561 1 159055124 t c 0.5007 0.0343 0.0031 1.37E-28 ?-+ 9.41E-18WBC count rs2518562 1 159055656 t c 0.5229 -0.02 0.0022 2.42E-20 ++- 1.45E-40WBC count rs2518564 1 159062436 a g 0.4639 0.0365 0.0021 6.92E-69 +++ 6.98E-258WBC count rs2518565 1 159070113 a g 0.3318 -0.0236 0.0021 1.46E-29 +-- 1.46E-58WBC count rs2814762 1 159068326 a g 0.6498 0.053 0.0039 2.60E-42 ?++ 1.64E-04WBC count rs2814764 1 159064568 a t 0.354 -0.0273 0.0021 2.12E-39 --- 3.17E-79WBC count rs2852720 1 159060560 t c 0.3129 0.038 0.0027 4.16E-45 +-+ 2.71E-41WBC count rs2852721 1 159068064 t c 0.6737 0.0472 0.0044 4.39E-27 --+ 4.83E-08WBC count rs855866 1 159052720 a g 0.3516 -0.0348 0.0021 6.43E-64 --- 1.98E-203WBC count rs855867 1 159052847 a g 0.4913 0.0276 0.0021 2.27E-39 +++ 2.73E-83WBC count rs1371798 4 74976781 t c 0.4882 -0.0058 0.0018 1.56E-03 --+ 6.75E-11WBC count rs1371799 4 74977837 t c 0.4361 0.0052 0.0018 4.28E-03 ++- 1.09E-12WBC count rs1866755 4 74978340 t c 0.4908 -0.0053 0.0018 3.59E-03 --+ 2.30E-12WBC count rs1893319 4 74973129 t c 0.4683 0.0111 0.0019 9.67E-09 +++ 2.51E-01WBC count rs505197 4 74968560 t c 0.9264 -0.0037 0.0143 7.94E-01 +?- 6.04E-01WBC count rs549280 4 74971196 a g 0.4733 -0.011 0.0018 4.17E-10 --- 7.41E-01WBC count rs551055 4 74981560 a g 0.9486 -0.0086 0.014 5.39E-01 ??- 1.00E+00WBC count rs7667376 4 74967890 t c 0.4918 -0.005 0.0018 5.41E-03 --+ 2.92E-12WBC count rs10484494 6 135430093 a g 0.0945 -0.0127 0.0053 1.66E-02 ?-+ 1.18E-02
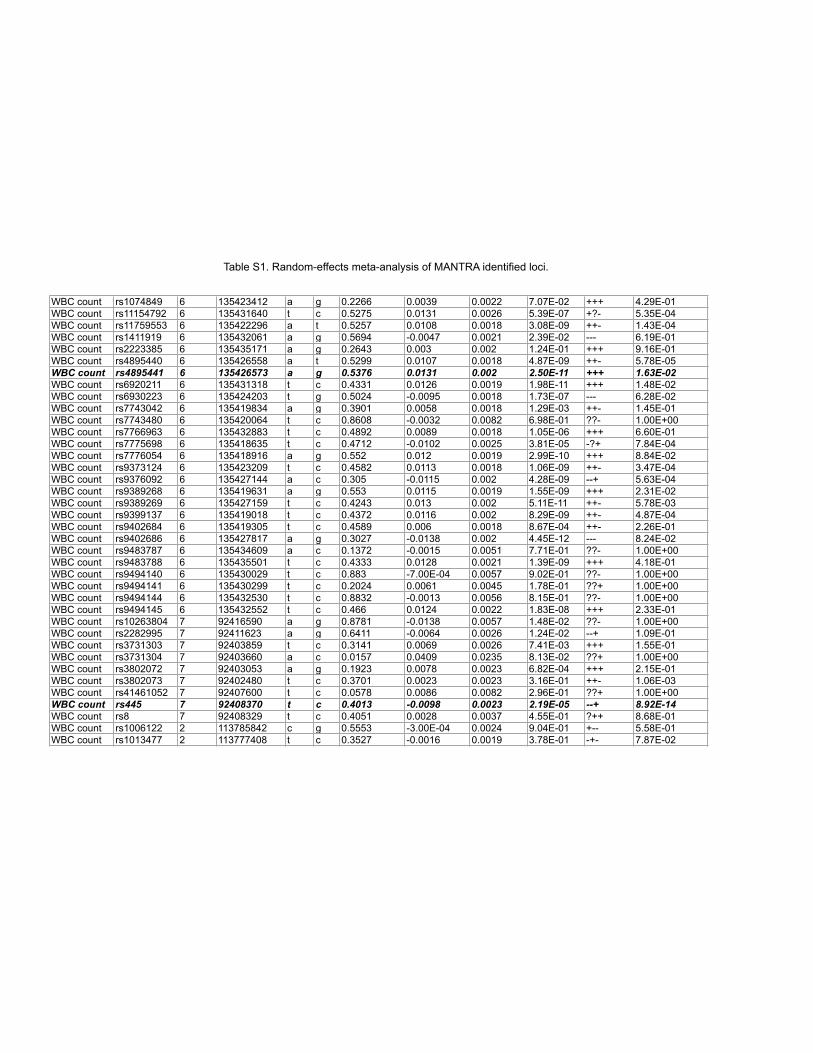
Table S1. Random-effects meta-analysis of MANTRA identified loci.
WBC count rs1074849 6 135423412 a g 0.2266 0.0039 0.0022 7.07E-02 +++ 4.29E-01WBC count rs11154792 6 135431640 t c 0.5275 0.0131 0.0026 5.39E-07 +?- 5.35E-04WBC count rs11759553 6 135422296 a t 0.5257 0.0108 0.0018 3.08E-09 ++- 1.43E-04WBC count rs1411919 6 135432061 a g 0.5694 -0.0047 0.0021 2.39E-02 --- 6.19E-01WBC count rs2223385 6 135435171 a g 0.2643 0.003 0.002 1.24E-01 +++ 9.16E-01WBC count rs4895440 6 135426558 a t 0.5299 0.0107 0.0018 4.87E-09 ++- 5.78E-05WBC count rs4895441 6 135426573 a g 0.5376 0.0131 0.002 2.50E-11 +++ 1.63E-02WBC count rs6920211 6 135431318 t c 0.4331 0.0126 0.0019 1.98E-11 +++ 1.48E-02WBC count rs6930223 6 135424203 t g 0.5024 -0.0095 0.0018 1.73E-07 --- 6.28E-02WBC count rs7743042 6 135419834 a g 0.3901 0.0058 0.0018 1.29E-03 ++- 1.45E-01WBC count rs7743480 6 135420064 t c 0.8608 -0.0032 0.0082 6.98E-01 ??- 1.00E+00WBC count rs7766963 6 135432883 t c 0.4892 0.0089 0.0018 1.05E-06 +++ 6.60E-01WBC count rs7775698 6 135418635 t c 0.4712 -0.0102 0.0025 3.81E-05 -?+ 7.84E-04WBC count rs7776054 6 135418916 a g 0.552 0.012 0.0019 2.99E-10 +++ 8.84E-02WBC count rs9373124 6 135423209 t c 0.4582 0.0113 0.0018 1.06E-09 ++- 3.47E-04WBC count rs9376092 6 135427144 a c 0.305 -0.0115 0.002 4.28E-09 --+ 5.63E-04WBC count rs9389268 6 135419631 a g 0.553 0.0115 0.0019 1.55E-09 +++ 2.31E-02WBC count rs9389269 6 135427159 t c 0.4243 0.013 0.002 5.11E-11 ++- 5.78E-03WBC count rs9399137 6 135419018 t c 0.4372 0.0116 0.002 8.29E-09 ++- 4.87E-04WBC count rs9402684 6 135419305 t c 0.4589 0.006 0.0018 8.67E-04 ++- 2.26E-01WBC count rs9402686 6 135427817 a g 0.3027 -0.0138 0.002 4.45E-12 --- 8.24E-02WBC count rs9483787 6 135434609 a c 0.1372 -0.0015 0.0051 7.71E-01 ??- 1.00E+00WBC count rs9483788 6 135435501 t c 0.4333 0.0128 0.0021 1.39E-09 +++ 4.18E-01WBC count rs9494140 6 135430029 t c 0.883 -7.00E-04 0.0057 9.02E-01 ??- 1.00E+00WBC count rs9494141 6 135430299 t c 0.2024 0.0061 0.0045 1.78E-01 ??+ 1.00E+00WBC count rs9494144 6 135432530 t c 0.8832 -0.0013 0.0056 8.15E-01 ??- 1.00E+00WBC count rs9494145 6 135432552 t c 0.466 0.0124 0.0022 1.83E-08 +++ 2.33E-01WBC count rs10263804 7 92416590 a g 0.8781 -0.0138 0.0057 1.48E-02 ??- 1.00E+00WBC count rs2282995 7 92411623 a g 0.6411 -0.0064 0.0026 1.24E-02 --+ 1.09E-01WBC count rs3731303 7 92403859 t c 0.3141 0.0069 0.0026 7.41E-03 +++ 1.55E-01WBC count rs3731304 7 92403660 a c 0.0157 0.0409 0.0235 8.13E-02 ??+ 1.00E+00WBC count rs3802072 7 92403053 a g 0.1923 0.0078 0.0023 6.82E-04 +++ 2.15E-01WBC count rs3802073 7 92402480 t c 0.3701 0.0023 0.0023 3.16E-01 ++- 1.06E-03WBC count rs41461052 7 92407600 t c 0.0578 0.0086 0.0082 2.96E-01 ??+ 1.00E+00WBC count rs445 7 92408370 t c 0.4013 -0.0098 0.0023 2.19E-05 --+ 8.92E-14WBC count rs8 7 92408329 t c 0.4051 0.0028 0.0037 4.55E-01 ?++ 8.68E-01WBC count rs1006122 2 113785842 c g 0.5553 -3.00E-04 0.0024 9.04E-01 +-- 5.58E-01WBC count rs1013477 2 113777408 t c 0.3527 -0.0016 0.0019 3.78E-01 -+- 7.87E-02
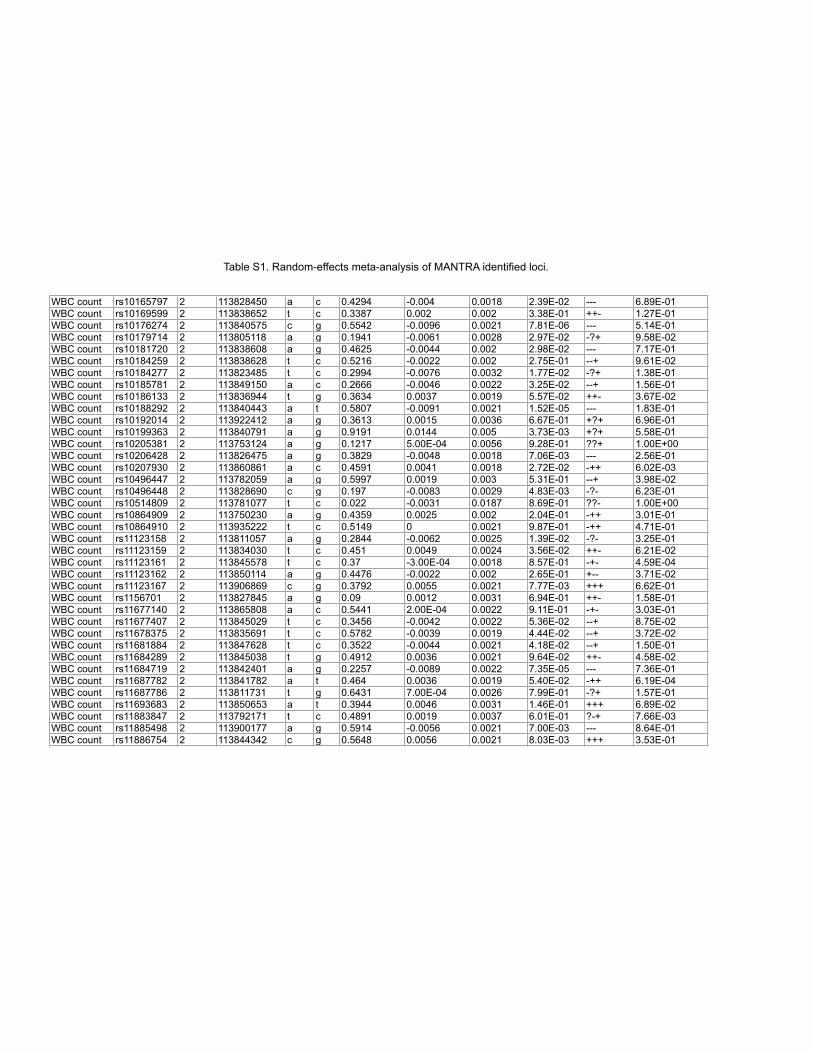
Table S1. Random-effects meta-analysis of MANTRA identified loci.
WBC count rs10165797 2 113828450 a c 0.4294 -0.004 0.0018 2.39E-02 --- 6.89E-01WBC count rs10169599 2 113838652 t c 0.3387 0.002 0.002 3.38E-01 ++- 1.27E-01WBC count rs10176274 2 113840575 c g 0.5542 -0.0096 0.0021 7.81E-06 --- 5.14E-01WBC count rs10179714 2 113805118 a g 0.1941 -0.0061 0.0028 2.97E-02 -?+ 9.58E-02WBC count rs10181720 2 113838608 a g 0.4625 -0.0044 0.002 2.98E-02 --- 7.17E-01WBC count rs10184259 2 113838628 t c 0.5216 -0.0022 0.002 2.75E-01 --+ 9.61E-02WBC count rs10184277 2 113823485 t c 0.2994 -0.0076 0.0032 1.77E-02 -?+ 1.38E-01WBC count rs10185781 2 113849150 a c 0.2666 -0.0046 0.0022 3.25E-02 --+ 1.56E-01WBC count rs10186133 2 113836944 t g 0.3634 0.0037 0.0019 5.57E-02 ++- 3.67E-02WBC count rs10188292 2 113840443 a t 0.5807 -0.0091 0.0021 1.52E-05 --- 1.83E-01WBC count rs10192014 2 113922412 a g 0.3613 0.0015 0.0036 6.67E-01 +?+ 6.96E-01WBC count rs10199363 2 113840791 a g 0.9191 0.0144 0.005 3.73E-03 +?+ 5.58E-01WBC count rs10205381 2 113753124 a g 0.1217 5.00E-04 0.0056 9.28E-01 ??+ 1.00E+00WBC count rs10206428 2 113826475 a g 0.3829 -0.0048 0.0018 7.06E-03 --- 2.56E-01WBC count rs10207930 2 113860861 a c 0.4591 0.0041 0.0018 2.72E-02 -++ 6.02E-03WBC count rs10496447 2 113782059 a g 0.5997 0.0019 0.003 5.31E-01 --+ 3.98E-02WBC count rs10496448 2 113828690 c g 0.197 -0.0083 0.0029 4.83E-03 -?- 6.23E-01WBC count rs10514809 2 113781077 t c 0.022 -0.0031 0.0187 8.69E-01 ??- 1.00E+00WBC count rs10864909 2 113750230 a g 0.4359 0.0025 0.002 2.04E-01 -++ 3.01E-01WBC count rs10864910 2 113935222 t c 0.5149 0 0.0021 9.87E-01 -++ 4.71E-01WBC count rs11123158 2 113811057 a g 0.2844 -0.0062 0.0025 1.39E-02 -?- 3.25E-01WBC count rs11123159 2 113834030 t c 0.451 0.0049 0.0024 3.56E-02 ++- 6.21E-02WBC count rs11123161 2 113845578 t c 0.37 -3.00E-04 0.0018 8.57E-01 -+- 4.59E-04WBC count rs11123162 2 113850114 a g 0.4476 -0.0022 0.002 2.65E-01 +-- 3.71E-02WBC count rs11123167 2 113906869 c g 0.3792 0.0055 0.0021 7.77E-03 +++ 6.62E-01WBC count rs1156701 2 113827845 a g 0.09 0.0012 0.0031 6.94E-01 ++- 1.58E-01WBC count rs11677140 2 113865808 a c 0.5441 2.00E-04 0.0022 9.11E-01 -+- 3.03E-01WBC count rs11677407 2 113845029 t c 0.3456 -0.0042 0.0022 5.36E-02 --+ 8.75E-02WBC count rs11678375 2 113835691 t c 0.5782 -0.0039 0.0019 4.44E-02 --+ 3.72E-02WBC count rs11681884 2 113847628 t c 0.3522 -0.0044 0.0021 4.18E-02 --+ 1.50E-01WBC count rs11684289 2 113845038 t g 0.4912 0.0036 0.0021 9.64E-02 ++- 4.58E-02WBC count rs11684719 2 113842401 a g 0.2257 -0.0089 0.0022 7.35E-05 --- 7.36E-01WBC count rs11687782 2 113841782 a t 0.464 0.0036 0.0019 5.40E-02 -++ 6.19E-04WBC count rs11687786 2 113811731 t g 0.6431 7.00E-04 0.0026 7.99E-01 -?+ 1.57E-01WBC count rs11693683 2 113850653 a t 0.3944 0.0046 0.0031 1.46E-01 +++ 6.89E-02WBC count rs11883847 2 113792171 t c 0.4891 0.0019 0.0037 6.01E-01 ?-+ 7.66E-03WBC count rs11885498 2 113900177 a g 0.5914 -0.0056 0.0021 7.00E-03 --- 8.64E-01WBC count rs11886754 2 113844342 c g 0.5648 0.0056 0.0021 8.03E-03 +++ 3.53E-01
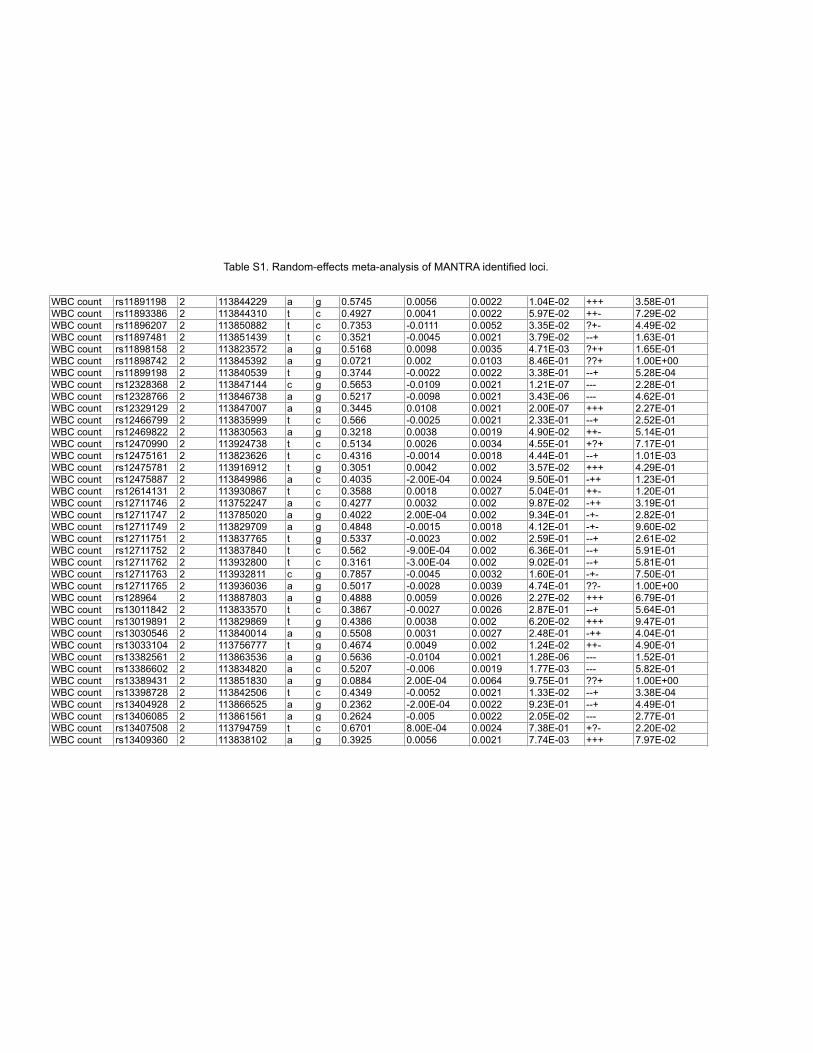
Table S1. Random-effects meta-analysis of MANTRA identified loci.
WBC count rs11891198 2 113844229 a g 0.5745 0.0056 0.0022 1.04E-02 +++ 3.58E-01WBC count rs11893386 2 113844310 t c 0.4927 0.0041 0.0022 5.97E-02 ++- 7.29E-02WBC count rs11896207 2 113850882 t c 0.7353 -0.0111 0.0052 3.35E-02 ?+- 4.49E-02WBC count rs11897481 2 113851439 t c 0.3521 -0.0045 0.0021 3.79E-02 --+ 1.63E-01WBC count rs11898158 2 113823572 a g 0.5168 0.0098 0.0035 4.71E-03 ?++ 1.65E-01WBC count rs11898742 2 113845392 a g 0.0721 0.002 0.0103 8.46E-01 ??+ 1.00E+00WBC count rs11899198 2 113840539 t g 0.3744 -0.0022 0.0022 3.38E-01 --+ 5.28E-04WBC count rs12328368 2 113847144 c g 0.5653 -0.0109 0.0021 1.21E-07 --- 2.28E-01WBC count rs12328766 2 113846738 a g 0.5217 -0.0098 0.0021 3.43E-06 --- 4.62E-01WBC count rs12329129 2 113847007 a g 0.3445 0.0108 0.0021 2.00E-07 +++ 2.27E-01WBC count rs12466799 2 113835999 t c 0.566 -0.0025 0.0021 2.33E-01 --+ 2.52E-01WBC count rs12469822 2 113830563 a g 0.3218 0.0038 0.0019 4.90E-02 ++- 5.14E-01WBC count rs12470990 2 113924738 t c 0.5134 0.0026 0.0034 4.55E-01 +?+ 7.17E-01WBC count rs12475161 2 113823626 t c 0.4316 -0.0014 0.0018 4.44E-01 --+ 1.01E-03WBC count rs12475781 2 113916912 t g 0.3051 0.0042 0.002 3.57E-02 +++ 4.29E-01WBC count rs12475887 2 113849986 a c 0.4035 -2.00E-04 0.0024 9.50E-01 -++ 1.23E-01WBC count rs12614131 2 113930867 t c 0.3588 0.0018 0.0027 5.04E-01 ++- 1.20E-01WBC count rs12711746 2 113752247 a c 0.4277 0.0032 0.002 9.87E-02 -++ 3.19E-01WBC count rs12711747 2 113785020 a g 0.4022 2.00E-04 0.002 9.34E-01 -+- 2.82E-01WBC count rs12711749 2 113829709 a g 0.4848 -0.0015 0.0018 4.12E-01 -+- 9.60E-02WBC count rs12711751 2 113837765 t g 0.5337 -0.0023 0.002 2.59E-01 --+ 2.61E-02WBC count rs12711752 2 113837840 t c 0.562 -9.00E-04 0.002 6.36E-01 --+ 5.91E-01WBC count rs12711762 2 113932800 t c 0.3161 -3.00E-04 0.002 9.02E-01 --+ 5.81E-01WBC count rs12711763 2 113932811 c g 0.7857 -0.0045 0.0032 1.60E-01 -+- 7.50E-01WBC count rs12711765 2 113936036 a g 0.5017 -0.0028 0.0039 4.74E-01 ??- 1.00E+00WBC count rs128964 2 113887803 a g 0.4888 0.0059 0.0026 2.27E-02 +++ 6.79E-01WBC count rs13011842 2 113833570 t c 0.3867 -0.0027 0.0026 2.87E-01 --+ 5.64E-01WBC count rs13019891 2 113829869 t g 0.4386 0.0038 0.002 6.20E-02 +++ 9.47E-01WBC count rs13030546 2 113840014 a g 0.5508 0.0031 0.0027 2.48E-01 -++ 4.04E-01WBC count rs13033104 2 113756777 t g 0.4674 0.0049 0.002 1.24E-02 ++- 4.90E-01WBC count rs13382561 2 113863536 a g 0.5636 -0.0104 0.0021 1.28E-06 --- 1.52E-01WBC count rs13386602 2 113834820 a c 0.5207 -0.006 0.0019 1.77E-03 --- 5.82E-01WBC count rs13389431 2 113851830 a g 0.0884 2.00E-04 0.0064 9.75E-01 ??+ 1.00E+00WBC count rs13398728 2 113842506 t c 0.4349 -0.0052 0.0021 1.33E-02 --+ 3.38E-04WBC count rs13404928 2 113866525 a g 0.2362 -2.00E-04 0.0022 9.23E-01 --+ 4.49E-01WBC count rs13406085 2 113861561 a g 0.2624 -0.005 0.0022 2.05E-02 --- 2.77E-01WBC count rs13407508 2 113794759 t c 0.6701 8.00E-04 0.0024 7.38E-01 +?- 2.20E-02WBC count rs13409360 2 113838102 a g 0.3925 0.0056 0.0021 7.74E-03 +++ 7.97E-02
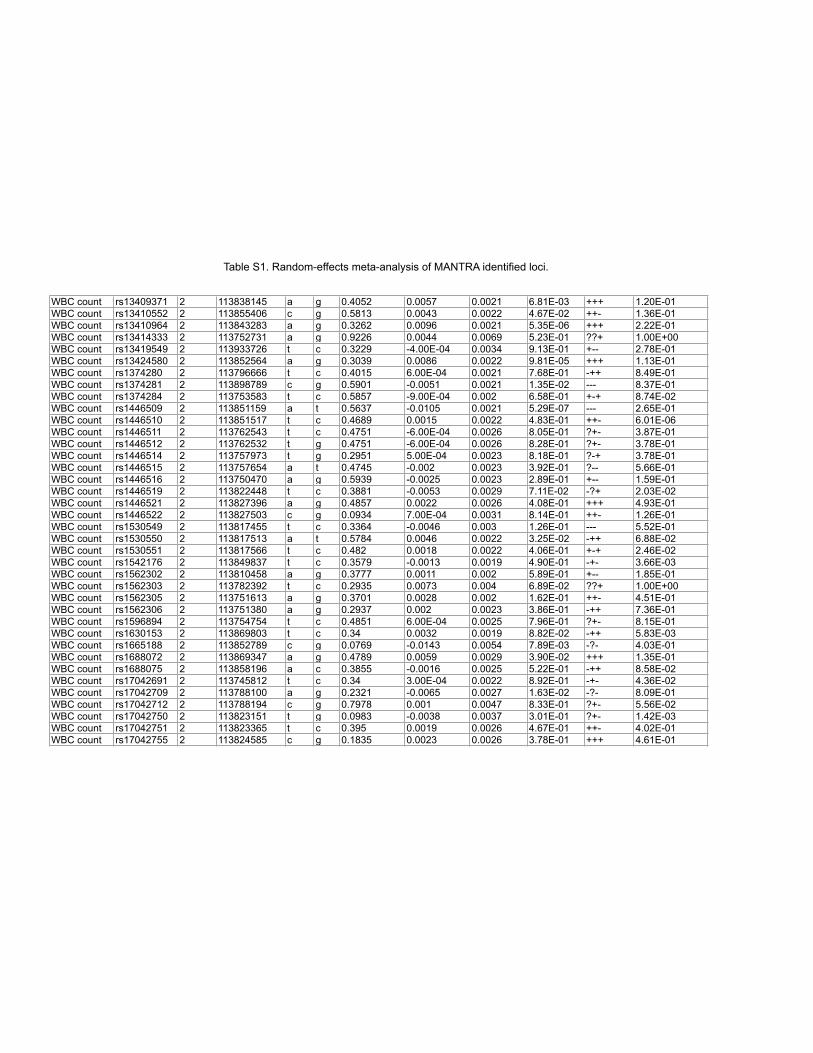
Table S1. Random-effects meta-analysis of MANTRA identified loci.
WBC count rs13409371 2 113838145 a g 0.4052 0.0057 0.0021 6.81E-03 +++ 1.20E-01WBC count rs13410552 2 113855406 c g 0.5813 0.0043 0.0022 4.67E-02 ++- 1.36E-01WBC count rs13410964 2 113843283 a g 0.3262 0.0096 0.0021 5.35E-06 +++ 2.22E-01WBC count rs13414333 2 113752731 a g 0.9226 0.0044 0.0069 5.23E-01 ??+ 1.00E+00WBC count rs13419549 2 113933726 t c 0.3229 -4.00E-04 0.0034 9.13E-01 +-- 2.78E-01WBC count rs13424580 2 113852564 a g 0.3039 0.0086 0.0022 9.81E-05 +++ 1.13E-01WBC count rs1374280 2 113796666 t c 0.4015 6.00E-04 0.0021 7.68E-01 -++ 8.49E-01WBC count rs1374281 2 113898789 c g 0.5901 -0.0051 0.0021 1.35E-02 --- 8.37E-01WBC count rs1374284 2 113753583 t c 0.5857 -9.00E-04 0.002 6.58E-01 +-+ 8.74E-02WBC count rs1446509 2 113851159 a t 0.5637 -0.0105 0.0021 5.29E-07 --- 2.65E-01WBC count rs1446510 2 113851517 t c 0.4689 0.0015 0.0022 4.83E-01 ++- 6.01E-06WBC count rs1446511 2 113762543 t c 0.4751 -6.00E-04 0.0026 8.05E-01 ?+- 3.87E-01WBC count rs1446512 2 113762532 t g 0.4751 -6.00E-04 0.0026 8.28E-01 ?+- 3.78E-01WBC count rs1446514 2 113757973 t g 0.2951 5.00E-04 0.0023 8.18E-01 ?-+ 3.78E-01WBC count rs1446515 2 113757654 a t 0.4745 -0.002 0.0023 3.92E-01 ?-- 5.66E-01WBC count rs1446516 2 113750470 a g 0.5939 -0.0025 0.0023 2.89E-01 +-- 1.59E-01WBC count rs1446519 2 113822448 t c 0.3881 -0.0053 0.0029 7.11E-02 -?+ 2.03E-02WBC count rs1446521 2 113827396 a g 0.4857 0.0022 0.0026 4.08E-01 +++ 4.93E-01WBC count rs1446522 2 113827503 c g 0.0934 7.00E-04 0.0031 8.14E-01 ++- 1.26E-01WBC count rs1530549 2 113817455 t c 0.3364 -0.0046 0.003 1.26E-01 --- 5.52E-01WBC count rs1530550 2 113817513 a t 0.5784 0.0046 0.0022 3.25E-02 -++ 6.88E-02WBC count rs1530551 2 113817566 t c 0.482 0.0018 0.0022 4.06E-01 +-+ 2.46E-02WBC count rs1542176 2 113849837 t c 0.3579 -0.0013 0.0019 4.90E-01 -+- 3.66E-03WBC count rs1562302 2 113810458 a g 0.3777 0.0011 0.002 5.89E-01 +-- 1.85E-01WBC count rs1562303 2 113782392 t c 0.2935 0.0073 0.004 6.89E-02 ??+ 1.00E+00WBC count rs1562305 2 113751613 a g 0.3701 0.0028 0.002 1.62E-01 ++- 4.51E-01WBC count rs1562306 2 113751380 a g 0.2937 0.002 0.0023 3.86E-01 -++ 7.36E-01WBC count rs1596894 2 113754754 t c 0.4851 6.00E-04 0.0025 7.96E-01 ?+- 8.15E-01WBC count rs1630153 2 113869803 t c 0.34 0.0032 0.0019 8.82E-02 -++ 5.83E-03WBC count rs1665188 2 113852789 c g 0.0769 -0.0143 0.0054 7.89E-03 -?- 4.03E-01WBC count rs1688072 2 113869347 a g 0.4789 0.0059 0.0029 3.90E-02 +++ 1.35E-01WBC count rs1688075 2 113858196 a c 0.3855 -0.0016 0.0025 5.22E-01 -++ 8.58E-02WBC count rs17042691 2 113745812 t c 0.34 3.00E-04 0.0022 8.92E-01 -+- 4.36E-02WBC count rs17042709 2 113788100 a g 0.2321 -0.0065 0.0027 1.63E-02 -?- 8.09E-01WBC count rs17042712 2 113788194 c g 0.7978 0.001 0.0047 8.33E-01 ?+- 5.56E-02WBC count rs17042750 2 113823151 t g 0.0983 -0.0038 0.0037 3.01E-01 ?+- 1.42E-03WBC count rs17042751 2 113823365 t c 0.395 0.0019 0.0026 4.67E-01 ++- 4.02E-01WBC count rs17042755 2 113824585 c g 0.1835 0.0023 0.0026 3.78E-01 +++ 4.61E-01
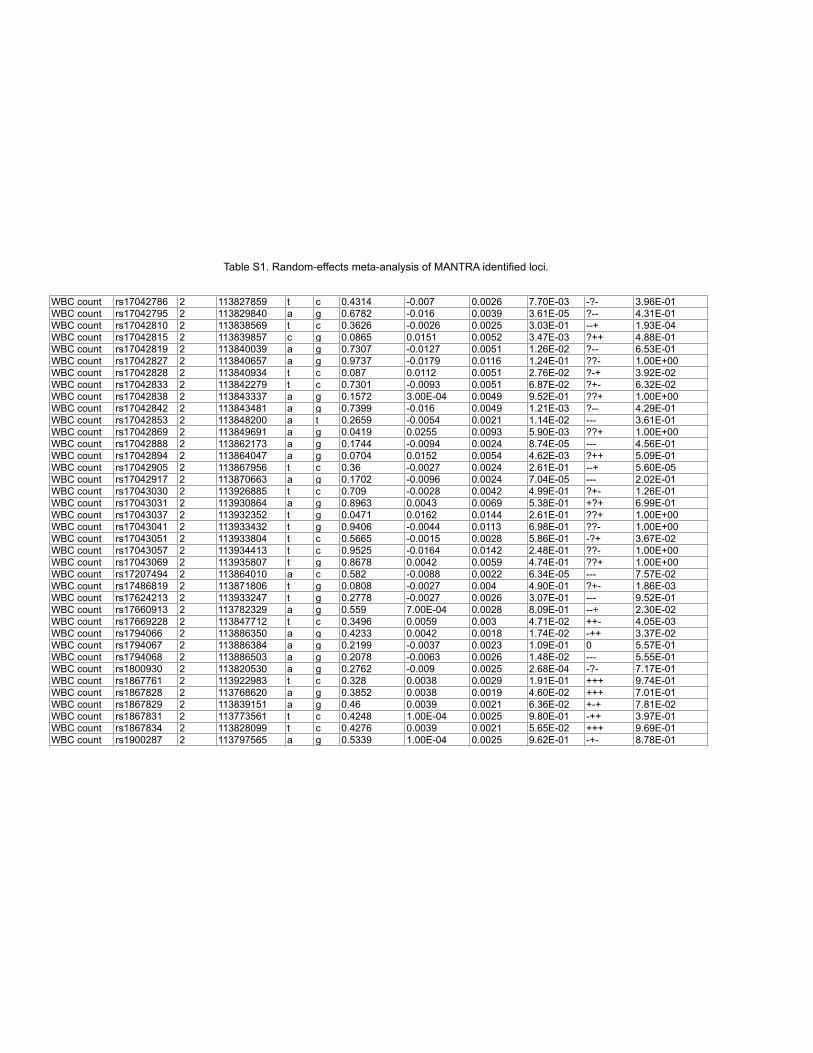
Table S1. Random-effects meta-analysis of MANTRA identified loci.
WBC count rs17042786 2 113827859 t c 0.4314 -0.007 0.0026 7.70E-03 -?- 3.96E-01WBC count rs17042795 2 113829840 a g 0.6782 -0.016 0.0039 3.61E-05 ?-- 4.31E-01WBC count rs17042810 2 113838569 t c 0.3626 -0.0026 0.0025 3.03E-01 --+ 1.93E-04WBC count rs17042815 2 113839857 c g 0.0865 0.0151 0.0052 3.47E-03 ?++ 4.88E-01WBC count rs17042819 2 113840039 a g 0.7307 -0.0127 0.0051 1.26E-02 ?-- 6.53E-01WBC count rs17042827 2 113840657 a g 0.9737 -0.0179 0.0116 1.24E-01 ??- 1.00E+00WBC count rs17042828 2 113840934 t c 0.087 0.0112 0.0051 2.76E-02 ?-+ 3.92E-02WBC count rs17042833 2 113842279 t c 0.7301 -0.0093 0.0051 6.87E-02 ?+- 6.32E-02WBC count rs17042838 2 113843337 a g 0.1572 3.00E-04 0.0049 9.52E-01 ??+ 1.00E+00WBC count rs17042842 2 113843481 a g 0.7399 -0.016 0.0049 1.21E-03 ?-- 4.29E-01WBC count rs17042853 2 113848200 a t 0.2659 -0.0054 0.0021 1.14E-02 --- 3.61E-01WBC count rs17042869 2 113849691 a g 0.0419 0.0255 0.0093 5.90E-03 ??+ 1.00E+00WBC count rs17042888 2 113862173 a g 0.1744 -0.0094 0.0024 8.74E-05 --- 4.56E-01WBC count rs17042894 2 113864047 a g 0.0704 0.0152 0.0054 4.62E-03 ?++ 5.09E-01WBC count rs17042905 2 113867956 t c 0.36 -0.0027 0.0024 2.61E-01 --+ 5.60E-05WBC count rs17042917 2 113870663 a g 0.1702 -0.0096 0.0024 7.04E-05 --- 2.02E-01WBC count rs17043030 2 113926885 t c 0.709 -0.0028 0.0042 4.99E-01 ?+- 1.26E-01WBC count rs17043031 2 113930864 a g 0.8963 0.0043 0.0069 5.38E-01 +?+ 6.99E-01WBC count rs17043037 2 113932352 t g 0.0471 0.0162 0.0144 2.61E-01 ??+ 1.00E+00WBC count rs17043041 2 113933432 t g 0.9406 -0.0044 0.0113 6.98E-01 ??- 1.00E+00WBC count rs17043051 2 113933804 t c 0.5665 -0.0015 0.0028 5.86E-01 -?+ 3.67E-02WBC count rs17043057 2 113934413 t c 0.9525 -0.0164 0.0142 2.48E-01 ??- 1.00E+00WBC count rs17043069 2 113935807 t g 0.8678 0.0042 0.0059 4.74E-01 ??+ 1.00E+00WBC count rs17207494 2 113864010 a c 0.582 -0.0088 0.0022 6.34E-05 --- 7.57E-02WBC count rs17486819 2 113871806 t g 0.0808 -0.0027 0.004 4.90E-01 ?+- 1.86E-03WBC count rs17624213 2 113933247 t g 0.2778 -0.0027 0.0026 3.07E-01 --- 9.52E-01WBC count rs17660913 2 113782329 a g 0.559 7.00E-04 0.0028 8.09E-01 --+ 2.30E-02WBC count rs17669228 2 113847712 t c 0.3496 0.0059 0.003 4.71E-02 ++- 4.05E-03WBC count rs1794066 2 113886350 a g 0.4233 0.0042 0.0018 1.74E-02 -++ 3.37E-02WBC count rs1794067 2 113886384 a g 0.2199 -0.0037 0.0023 1.09E-01 0 5.57E-01WBC count rs1794068 2 113886503 a g 0.2078 -0.0063 0.0026 1.48E-02 --- 5.55E-01WBC count rs1800930 2 113820530 a g 0.2762 -0.009 0.0025 2.68E-04 -?- 7.17E-01WBC count rs1867761 2 113922983 t c 0.328 0.0038 0.0029 1.91E-01 +++ 9.74E-01WBC count rs1867828 2 113768620 a g 0.3852 0.0038 0.0019 4.60E-02 +++ 7.01E-01WBC count rs1867829 2 113839151 a g 0.46 0.0039 0.0021 6.36E-02 +-+ 7.81E-02WBC count rs1867831 2 113773561 t c 0.4248 1.00E-04 0.0025 9.80E-01 -++ 3.97E-01WBC count rs1867834 2 113828099 t c 0.4276 0.0039 0.0021 5.65E-02 +++ 9.69E-01WBC count rs1900287 2 113797565 a g 0.5339 1.00E-04 0.0025 9.62E-01 -+- 8.78E-01
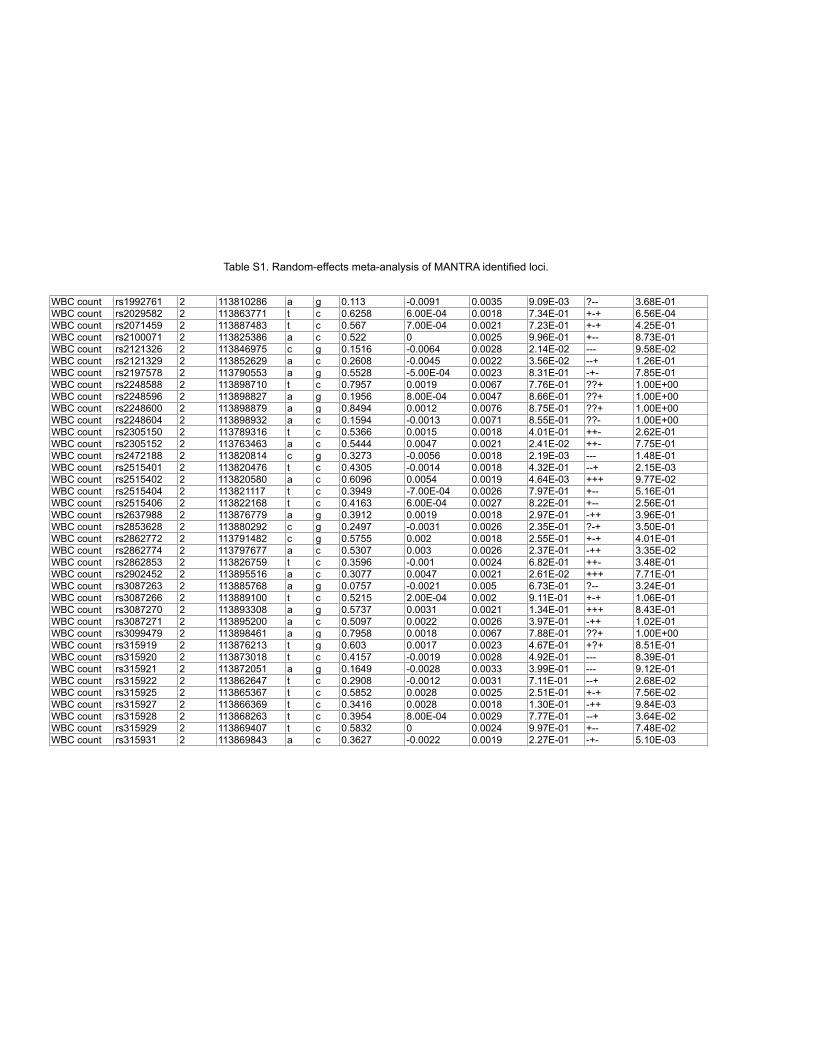
Table S1. Random-effects meta-analysis of MANTRA identified loci.
WBC count rs1992761 2 113810286 a g 0.113 -0.0091 0.0035 9.09E-03 ?-- 3.68E-01WBC count rs2029582 2 113863771 t c 0.6258 6.00E-04 0.0018 7.34E-01 +-+ 6.56E-04WBC count rs2071459 2 113887483 t c 0.567 7.00E-04 0.0021 7.23E-01 +-+ 4.25E-01WBC count rs2100071 2 113825386 a c 0.522 0 0.0025 9.96E-01 +-- 8.73E-01WBC count rs2121326 2 113846975 c g 0.1516 -0.0064 0.0028 2.14E-02 --- 9.58E-02WBC count rs2121329 2 113852629 a c 0.2608 -0.0045 0.0022 3.56E-02 --+ 1.26E-01WBC count rs2197578 2 113790553 a g 0.5528 -5.00E-04 0.0023 8.31E-01 -+- 7.85E-01WBC count rs2248588 2 113898710 t c 0.7957 0.0019 0.0067 7.76E-01 ??+ 1.00E+00WBC count rs2248596 2 113898827 a g 0.1956 8.00E-04 0.0047 8.66E-01 ??+ 1.00E+00WBC count rs2248600 2 113898879 a g 0.8494 0.0012 0.0076 8.75E-01 ??+ 1.00E+00WBC count rs2248604 2 113898932 a c 0.1594 -0.0013 0.0071 8.55E-01 ??- 1.00E+00WBC count rs2305150 2 113789316 t c 0.5366 0.0015 0.0018 4.01E-01 ++- 2.62E-01WBC count rs2305152 2 113763463 a c 0.5444 0.0047 0.0021 2.41E-02 ++- 7.75E-01WBC count rs2472188 2 113820814 c g 0.3273 -0.0056 0.0018 2.19E-03 --- 1.48E-01WBC count rs2515401 2 113820476 t c 0.4305 -0.0014 0.0018 4.32E-01 --+ 2.15E-03WBC count rs2515402 2 113820580 a c 0.6096 0.0054 0.0019 4.64E-03 +++ 9.77E-02WBC count rs2515404 2 113821117 t c 0.3949 -7.00E-04 0.0026 7.97E-01 +-- 5.16E-01WBC count rs2515406 2 113822168 t c 0.4163 6.00E-04 0.0027 8.22E-01 +-- 2.56E-01WBC count rs2637988 2 113876779 a g 0.3912 0.0019 0.0018 2.97E-01 -++ 3.96E-01WBC count rs2853628 2 113880292 c g 0.2497 -0.0031 0.0026 2.35E-01 ?-+ 3.50E-01WBC count rs2862772 2 113791482 c g 0.5755 0.002 0.0018 2.55E-01 +-+ 4.01E-01WBC count rs2862774 2 113797677 a c 0.5307 0.003 0.0026 2.37E-01 -++ 3.35E-02WBC count rs2862853 2 113826759 t c 0.3596 -0.001 0.0024 6.82E-01 ++- 3.48E-01WBC count rs2902452 2 113895516 a c 0.3077 0.0047 0.0021 2.61E-02 +++ 7.71E-01WBC count rs3087263 2 113885768 a g 0.0757 -0.0021 0.005 6.73E-01 ?-- 3.24E-01WBC count rs3087266 2 113889100 t c 0.5215 2.00E-04 0.002 9.11E-01 +-+ 1.06E-01WBC count rs3087270 2 113893308 a g 0.5737 0.0031 0.0021 1.34E-01 +++ 8.43E-01WBC count rs3087271 2 113895200 a c 0.5097 0.0022 0.0026 3.97E-01 -++ 1.02E-01WBC count rs3099479 2 113898461 a g 0.7958 0.0018 0.0067 7.88E-01 ??+ 1.00E+00WBC count rs315919 2 113876213 t g 0.603 0.0017 0.0023 4.67E-01 +?+ 8.51E-01WBC count rs315920 2 113873018 t c 0.4157 -0.0019 0.0028 4.92E-01 --- 8.39E-01WBC count rs315921 2 113872051 a g 0.1649 -0.0028 0.0033 3.99E-01 --- 9.12E-01WBC count rs315922 2 113862647 t c 0.2908 -0.0012 0.0031 7.11E-01 --+ 2.68E-02WBC count rs315925 2 113865367 t c 0.5852 0.0028 0.0025 2.51E-01 +-+ 7.56E-02WBC count rs315927 2 113866369 t c 0.3416 0.0028 0.0018 1.30E-01 -++ 9.84E-03WBC count rs315928 2 113868263 t c 0.3954 8.00E-04 0.0029 7.77E-01 --+ 3.64E-02WBC count rs315929 2 113869407 t c 0.5832 0 0.0024 9.97E-01 +-- 7.48E-02WBC count rs315931 2 113869843 a c 0.3627 -0.0022 0.0019 2.27E-01 -+- 5.10E-03
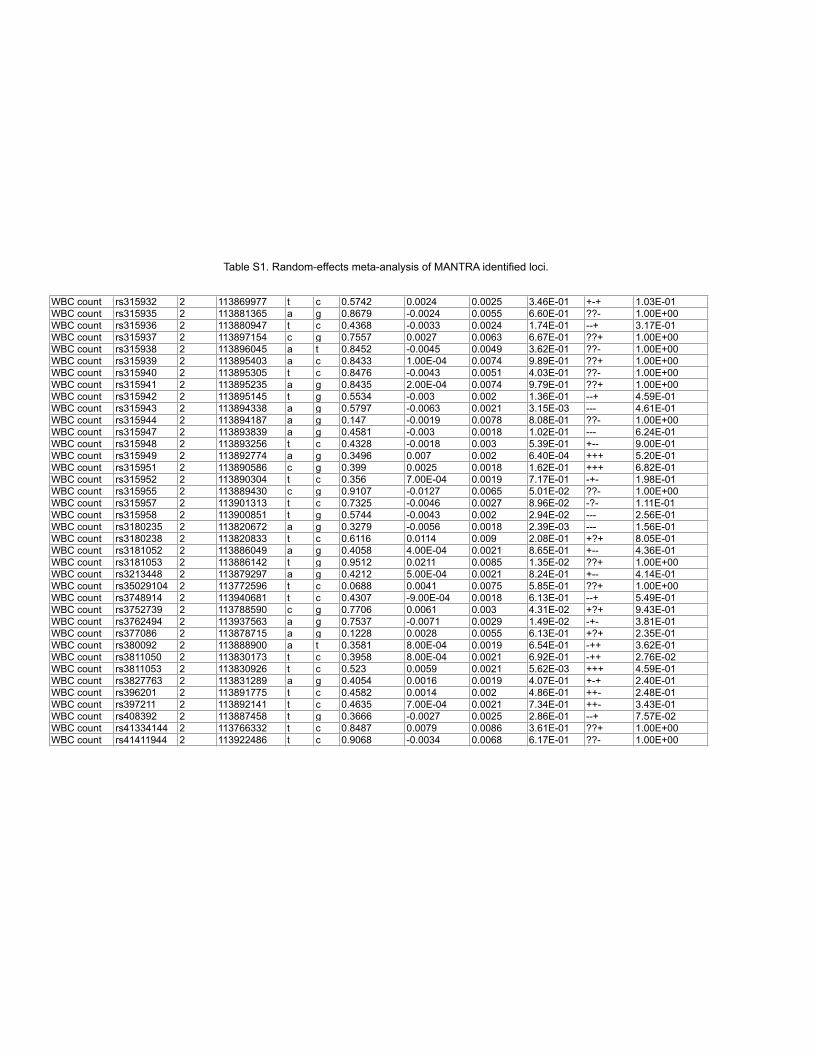
Table S1. Random-effects meta-analysis of MANTRA identified loci.
WBC count rs315932 2 113869977 t c 0.5742 0.0024 0.0025 3.46E-01 +-+ 1.03E-01WBC count rs315935 2 113881365 a g 0.8679 -0.0024 0.0055 6.60E-01 ??- 1.00E+00WBC count rs315936 2 113880947 t c 0.4368 -0.0033 0.0024 1.74E-01 --+ 3.17E-01WBC count rs315937 2 113897154 c g 0.7557 0.0027 0.0063 6.67E-01 ??+ 1.00E+00WBC count rs315938 2 113896045 a t 0.8452 -0.0045 0.0049 3.62E-01 ??- 1.00E+00WBC count rs315939 2 113895403 a c 0.8433 1.00E-04 0.0074 9.89E-01 ??+ 1.00E+00WBC count rs315940 2 113895305 t c 0.8476 -0.0043 0.0051 4.03E-01 ??- 1.00E+00WBC count rs315941 2 113895235 a g 0.8435 2.00E-04 0.0074 9.79E-01 ??+ 1.00E+00WBC count rs315942 2 113895145 t g 0.5534 -0.003 0.002 1.36E-01 --+ 4.59E-01WBC count rs315943 2 113894338 a g 0.5797 -0.0063 0.0021 3.15E-03 --- 4.61E-01WBC count rs315944 2 113894187 a g 0.147 -0.0019 0.0078 8.08E-01 ??- 1.00E+00WBC count rs315947 2 113893839 a g 0.4581 -0.003 0.0018 1.02E-01 --- 6.24E-01WBC count rs315948 2 113893256 t c 0.4328 -0.0018 0.003 5.39E-01 +-- 9.00E-01WBC count rs315949 2 113892774 a g 0.3496 0.007 0.002 6.40E-04 +++ 5.20E-01WBC count rs315951 2 113890586 c g 0.399 0.0025 0.0018 1.62E-01 +++ 6.82E-01WBC count rs315952 2 113890304 t c 0.356 7.00E-04 0.0019 7.17E-01 -+- 1.98E-01WBC count rs315955 2 113889430 c g 0.9107 -0.0127 0.0065 5.01E-02 ??- 1.00E+00WBC count rs315957 2 113901313 t c 0.7325 -0.0046 0.0027 8.96E-02 -?- 1.11E-01WBC count rs315958 2 113900851 t g 0.5744 -0.0043 0.002 2.94E-02 --- 2.56E-01WBC count rs3180235 2 113820672 a g 0.3279 -0.0056 0.0018 2.39E-03 --- 1.56E-01WBC count rs3180238 2 113820833 t c 0.6116 0.0114 0.009 2.08E-01 +?+ 8.05E-01WBC count rs3181052 2 113886049 a g 0.4058 4.00E-04 0.0021 8.65E-01 +-- 4.36E-01WBC count rs3181053 2 113886142 t g 0.9512 0.0211 0.0085 1.35E-02 ??+ 1.00E+00WBC count rs3213448 2 113879297 a g 0.4212 5.00E-04 0.0021 8.24E-01 +-- 4.14E-01WBC count rs35029104 2 113772596 t c 0.0688 0.0041 0.0075 5.85E-01 ??+ 1.00E+00WBC count rs3748914 2 113940681 t c 0.4307 -9.00E-04 0.0018 6.13E-01 --+ 5.49E-01WBC count rs3752739 2 113788590 c g 0.7706 0.0061 0.003 4.31E-02 +?+ 9.43E-01WBC count rs3762494 2 113937563 a g 0.7537 -0.0071 0.0029 1.49E-02 -+- 3.81E-01WBC count rs377086 2 113878715 a g 0.1228 0.0028 0.0055 6.13E-01 +?+ 2.35E-01WBC count rs380092 2 113888900 a t 0.3581 8.00E-04 0.0019 6.54E-01 -++ 3.62E-01WBC count rs3811050 2 113830173 t c 0.3958 8.00E-04 0.0021 6.92E-01 -++ 2.76E-02WBC count rs3811053 2 113830926 t c 0.523 0.0059 0.0021 5.62E-03 +++ 4.59E-01WBC count rs3827763 2 113831289 a g 0.4054 0.0016 0.0019 4.07E-01 +-+ 2.40E-01WBC count rs396201 2 113891775 t c 0.4582 0.0014 0.002 4.86E-01 ++- 2.48E-01WBC count rs397211 2 113892141 t c 0.4635 7.00E-04 0.0021 7.34E-01 ++- 3.43E-01WBC count rs408392 2 113887458 t g 0.3666 -0.0027 0.0025 2.86E-01 --+ 7.57E-02WBC count rs41334144 2 113766332 t c 0.8487 0.0079 0.0086 3.61E-01 ??+ 1.00E+00WBC count rs41411944 2 113922486 t c 0.9068 -0.0034 0.0068 6.17E-01 ??- 1.00E+00
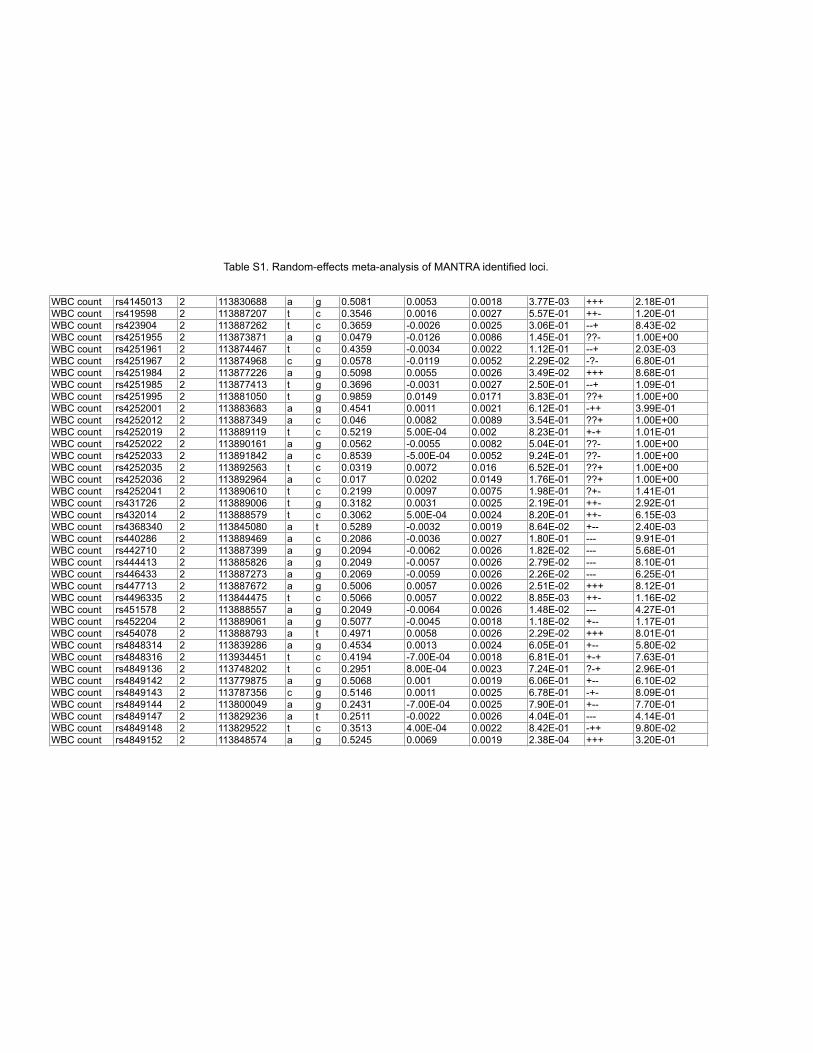
Table S1. Random-effects meta-analysis of MANTRA identified loci.
WBC count rs4145013 2 113830688 a g 0.5081 0.0053 0.0018 3.77E-03 +++ 2.18E-01WBC count rs419598 2 113887207 t c 0.3546 0.0016 0.0027 5.57E-01 ++- 1.20E-01WBC count rs423904 2 113887262 t c 0.3659 -0.0026 0.0025 3.06E-01 --+ 8.43E-02WBC count rs4251955 2 113873871 a g 0.0479 -0.0126 0.0086 1.45E-01 ??- 1.00E+00WBC count rs4251961 2 113874467 t c 0.4359 -0.0034 0.0022 1.12E-01 --+ 2.03E-03WBC count rs4251967 2 113874968 c g 0.0578 -0.0119 0.0052 2.29E-02 -?- 6.80E-01WBC count rs4251984 2 113877226 a g 0.5098 0.0055 0.0026 3.49E-02 +++ 8.68E-01WBC count rs4251985 2 113877413 t g 0.3696 -0.0031 0.0027 2.50E-01 --+ 1.09E-01WBC count rs4251995 2 113881050 t g 0.9859 0.0149 0.0171 3.83E-01 ??+ 1.00E+00WBC count rs4252001 2 113883683 a g 0.4541 0.0011 0.0021 6.12E-01 -++ 3.99E-01WBC count rs4252012 2 113887349 a c 0.046 0.0082 0.0089 3.54E-01 ??+ 1.00E+00WBC count rs4252019 2 113889119 t c 0.5219 5.00E-04 0.002 8.23E-01 +-+ 1.01E-01WBC count rs4252022 2 113890161 a g 0.0562 -0.0055 0.0082 5.04E-01 ??- 1.00E+00WBC count rs4252033 2 113891842 a c 0.8539 -5.00E-04 0.0052 9.24E-01 ??- 1.00E+00WBC count rs4252035 2 113892563 t c 0.0319 0.0072 0.016 6.52E-01 ??+ 1.00E+00WBC count rs4252036 2 113892964 a c 0.017 0.0202 0.0149 1.76E-01 ??+ 1.00E+00WBC count rs4252041 2 113890610 t c 0.2199 0.0097 0.0075 1.98E-01 ?+- 1.41E-01WBC count rs431726 2 113889006 t g 0.3182 0.0031 0.0025 2.19E-01 ++- 2.92E-01WBC count rs432014 2 113888579 t c 0.3062 5.00E-04 0.0024 8.20E-01 ++- 6.15E-03WBC count rs4368340 2 113845080 a t 0.5289 -0.0032 0.0019 8.64E-02 +-- 2.40E-03WBC count rs440286 2 113889469 a c 0.2086 -0.0036 0.0027 1.80E-01 --- 9.91E-01WBC count rs442710 2 113887399 a g 0.2094 -0.0062 0.0026 1.82E-02 --- 5.68E-01WBC count rs444413 2 113885826 a g 0.2049 -0.0057 0.0026 2.79E-02 --- 8.10E-01WBC count rs446433 2 113887273 a g 0.2069 -0.0059 0.0026 2.26E-02 --- 6.25E-01WBC count rs447713 2 113887672 a g 0.5006 0.0057 0.0026 2.51E-02 +++ 8.12E-01WBC count rs4496335 2 113844475 t c 0.5066 0.0057 0.0022 8.85E-03 ++- 1.16E-02WBC count rs451578 2 113888557 a g 0.2049 -0.0064 0.0026 1.48E-02 --- 4.27E-01WBC count rs452204 2 113889061 a g 0.5077 -0.0045 0.0018 1.18E-02 +-- 1.17E-01WBC count rs454078 2 113888793 a t 0.4971 0.0058 0.0026 2.29E-02 +++ 8.01E-01WBC count rs4848314 2 113839286 a g 0.4534 0.0013 0.0024 6.05E-01 +-- 5.80E-02WBC count rs4848316 2 113934451 t c 0.4194 -7.00E-04 0.0018 6.81E-01 +-+ 7.63E-01WBC count rs4849136 2 113748202 t c 0.2951 8.00E-04 0.0023 7.24E-01 ?-+ 2.96E-01WBC count rs4849142 2 113779875 a g 0.5068 0.001 0.0019 6.06E-01 +-- 6.10E-02WBC count rs4849143 2 113787356 c g 0.5146 0.0011 0.0025 6.78E-01 -+- 8.09E-01WBC count rs4849144 2 113800049 a g 0.2431 -7.00E-04 0.0025 7.90E-01 +-- 7.70E-01WBC count rs4849147 2 113829236 a t 0.2511 -0.0022 0.0026 4.04E-01 --- 4.14E-01WBC count rs4849148 2 113829522 t c 0.3513 4.00E-04 0.0022 8.42E-01 -++ 9.80E-02WBC count rs4849152 2 113848574 a g 0.5245 0.0069 0.0019 2.38E-04 +++ 3.20E-01
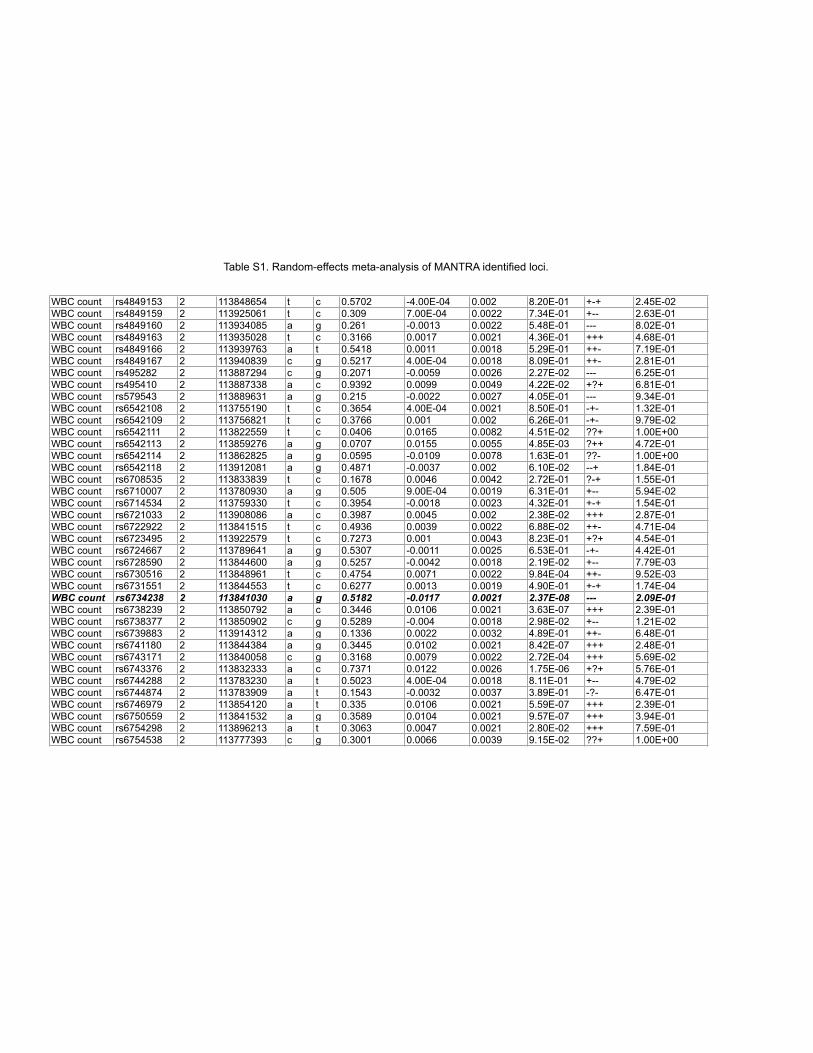
Table S1. Random-effects meta-analysis of MANTRA identified loci.
WBC count rs4849153 2 113848654 t c 0.5702 -4.00E-04 0.002 8.20E-01 +-+ 2.45E-02WBC count rs4849159 2 113925061 t c 0.309 7.00E-04 0.0022 7.34E-01 +-- 2.63E-01WBC count rs4849160 2 113934085 a g 0.261 -0.0013 0.0022 5.48E-01 --- 8.02E-01WBC count rs4849163 2 113935028 t c 0.3166 0.0017 0.0021 4.36E-01 +++ 4.68E-01WBC count rs4849166 2 113939763 a t 0.5418 0.0011 0.0018 5.29E-01 ++- 7.19E-01WBC count rs4849167 2 113940839 c g 0.5217 4.00E-04 0.0018 8.09E-01 ++- 2.81E-01WBC count rs495282 2 113887294 c g 0.2071 -0.0059 0.0026 2.27E-02 --- 6.25E-01WBC count rs495410 2 113887338 a c 0.9392 0.0099 0.0049 4.22E-02 +?+ 6.81E-01WBC count rs579543 2 113889631 a g 0.215 -0.0022 0.0027 4.05E-01 --- 9.34E-01WBC count rs6542108 2 113755190 t c 0.3654 4.00E-04 0.0021 8.50E-01 -+- 1.32E-01WBC count rs6542109 2 113756821 t c 0.3766 0.001 0.002 6.26E-01 -+- 9.79E-02WBC count rs6542111 2 113822559 t c 0.0406 0.0165 0.0082 4.51E-02 ??+ 1.00E+00WBC count rs6542113 2 113859276 a g 0.0707 0.0155 0.0055 4.85E-03 ?++ 4.72E-01WBC count rs6542114 2 113862825 a g 0.0595 -0.0109 0.0078 1.63E-01 ??- 1.00E+00WBC count rs6542118 2 113912081 a g 0.4871 -0.0037 0.002 6.10E-02 --+ 1.84E-01WBC count rs6708535 2 113833839 t c 0.1678 0.0046 0.0042 2.72E-01 ?-+ 1.55E-01WBC count rs6710007 2 113780930 a g 0.505 9.00E-04 0.0019 6.31E-01 +-- 5.94E-02WBC count rs6714534 2 113759330 t c 0.3954 -0.0018 0.0023 4.32E-01 +-+ 1.54E-01WBC count rs6721033 2 113908086 a c 0.3987 0.0045 0.002 2.38E-02 +++ 2.87E-01WBC count rs6722922 2 113841515 t c 0.4936 0.0039 0.0022 6.88E-02 ++- 4.71E-04WBC count rs6723495 2 113922579 t c 0.7273 0.001 0.0043 8.23E-01 +?+ 4.54E-01WBC count rs6724667 2 113789641 a g 0.5307 -0.0011 0.0025 6.53E-01 -+- 4.42E-01WBC count rs6728590 2 113844600 a g 0.5257 -0.0042 0.0018 2.19E-02 +-- 7.79E-03WBC count rs6730516 2 113848961 t c 0.4754 0.0071 0.0022 9.84E-04 ++- 9.52E-03WBC count rs6731551 2 113844553 t c 0.6277 0.0013 0.0019 4.90E-01 +-+ 1.74E-04WBC count rs6734238 2 113841030 a g 0.5182 -0.0117 0.0021 2.37E-08 --- 2.09E-01WBC count rs6738239 2 113850792 a c 0.3446 0.0106 0.0021 3.63E-07 +++ 2.39E-01WBC count rs6738377 2 113850902 c g 0.5289 -0.004 0.0018 2.98E-02 +-- 1.21E-02WBC count rs6739883 2 113914312 a g 0.1336 0.0022 0.0032 4.89E-01 ++- 6.48E-01WBC count rs6741180 2 113844384 a g 0.3445 0.0102 0.0021 8.42E-07 +++ 2.48E-01WBC count rs6743171 2 113840058 c g 0.3168 0.0079 0.0022 2.72E-04 +++ 5.69E-02WBC count rs6743376 2 113832333 a c 0.7371 0.0122 0.0026 1.75E-06 +?+ 5.76E-01WBC count rs6744288 2 113783230 a t 0.5023 4.00E-04 0.0018 8.11E-01 +-- 4.79E-02WBC count rs6744874 2 113783909 a t 0.1543 -0.0032 0.0037 3.89E-01 -?- 6.47E-01WBC count rs6746979 2 113854120 a t 0.335 0.0106 0.0021 5.59E-07 +++ 2.39E-01WBC count rs6750559 2 113841532 a g 0.3589 0.0104 0.0021 9.57E-07 +++ 3.94E-01WBC count rs6754298 2 113896213 a t 0.3063 0.0047 0.0021 2.80E-02 +++ 7.59E-01WBC count rs6754538 2 113777393 c g 0.3001 0.0066 0.0039 9.15E-02 ??+ 1.00E+00
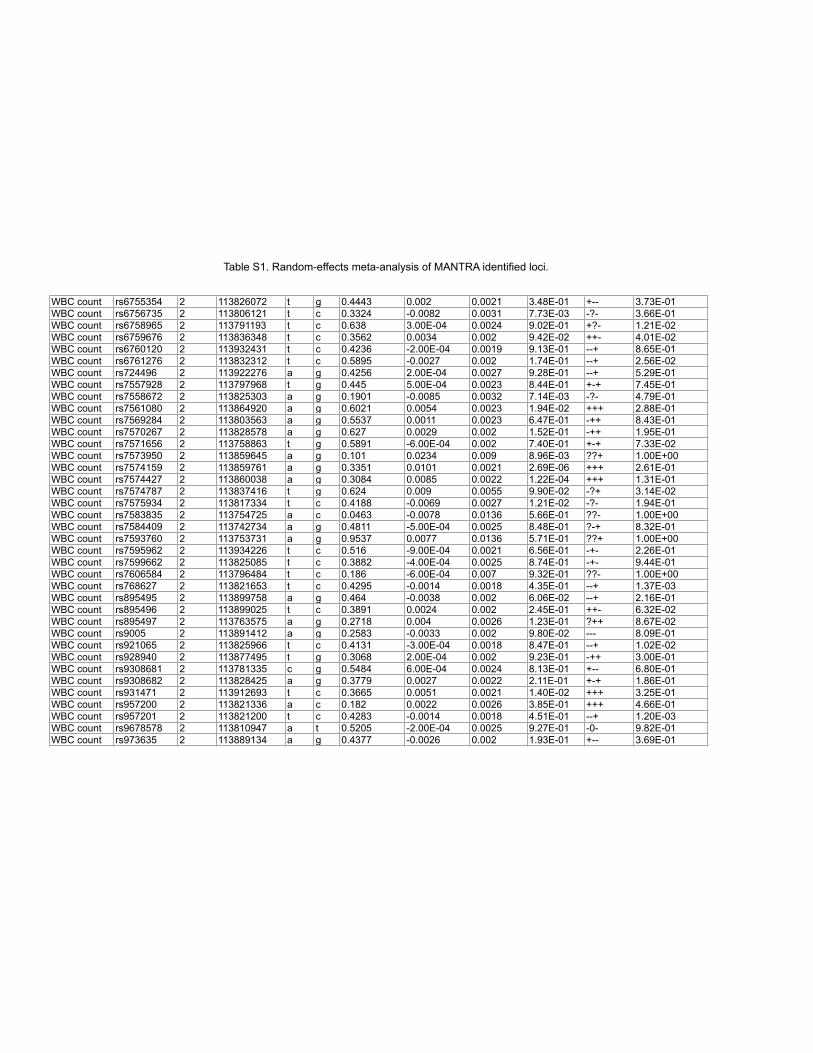
Table S1. Random-effects meta-analysis of MANTRA identified loci.
WBC count rs6755354 2 113826072 t g 0.4443 0.002 0.0021 3.48E-01 +-- 3.73E-01WBC count rs6756735 2 113806121 t c 0.3324 -0.0082 0.0031 7.73E-03 -?- 3.66E-01WBC count rs6758965 2 113791193 t c 0.638 3.00E-04 0.0024 9.02E-01 +?- 1.21E-02WBC count rs6759676 2 113836348 t c 0.3562 0.0034 0.002 9.42E-02 ++- 4.01E-02WBC count rs6760120 2 113932431 t c 0.4236 -2.00E-04 0.0019 9.13E-01 --+ 8.65E-01WBC count rs6761276 2 113832312 t c 0.5895 -0.0027 0.002 1.74E-01 --+ 2.56E-02WBC count rs724496 2 113922276 a g 0.4256 2.00E-04 0.0027 9.28E-01 --+ 5.29E-01WBC count rs7557928 2 113797968 t g 0.445 5.00E-04 0.0023 8.44E-01 +-+ 7.45E-01WBC count rs7558672 2 113825303 a g 0.1901 -0.0085 0.0032 7.14E-03 -?- 4.79E-01WBC count rs7561080 2 113864920 a g 0.6021 0.0054 0.0023 1.94E-02 +++ 2.88E-01WBC count rs7569284 2 113803563 a g 0.5537 0.0011 0.0023 6.47E-01 -++ 8.43E-01WBC count rs7570267 2 113828578 a g 0.627 0.0029 0.002 1.52E-01 -++ 1.95E-01WBC count rs7571656 2 113758863 t g 0.5891 -6.00E-04 0.002 7.40E-01 +-+ 7.33E-02WBC count rs7573950 2 113859645 a g 0.101 0.0234 0.009 8.96E-03 ??+ 1.00E+00WBC count rs7574159 2 113859761 a g 0.3351 0.0101 0.0021 2.69E-06 +++ 2.61E-01WBC count rs7574427 2 113860038 a g 0.3084 0.0085 0.0022 1.22E-04 +++ 1.31E-01WBC count rs7574787 2 113837416 t g 0.624 0.009 0.0055 9.90E-02 -?+ 3.14E-02WBC count rs7575934 2 113817334 t c 0.4188 -0.0069 0.0027 1.21E-02 -?- 1.94E-01WBC count rs7583835 2 113754725 a c 0.0463 -0.0078 0.0136 5.66E-01 ??- 1.00E+00WBC count rs7584409 2 113742734 a g 0.4811 -5.00E-04 0.0025 8.48E-01 ?-+ 8.32E-01WBC count rs7593760 2 113753731 a g 0.9537 0.0077 0.0136 5.71E-01 ??+ 1.00E+00WBC count rs7595962 2 113934226 t c 0.516 -9.00E-04 0.0021 6.56E-01 -+- 2.26E-01WBC count rs7599662 2 113825085 t c 0.3882 -4.00E-04 0.0025 8.74E-01 -+- 9.44E-01WBC count rs7606584 2 113796484 t c 0.186 -6.00E-04 0.007 9.32E-01 ??- 1.00E+00WBC count rs768627 2 113821653 t c 0.4295 -0.0014 0.0018 4.35E-01 --+ 1.37E-03WBC count rs895495 2 113899758 a g 0.464 -0.0038 0.002 6.06E-02 --+ 2.16E-01WBC count rs895496 2 113899025 t c 0.3891 0.0024 0.002 2.45E-01 ++- 6.32E-02WBC count rs895497 2 113763575 a g 0.2718 0.004 0.0026 1.23E-01 ?++ 8.67E-02WBC count rs9005 2 113891412 a g 0.2583 -0.0033 0.002 9.80E-02 --- 8.09E-01WBC count rs921065 2 113825966 t c 0.4131 -3.00E-04 0.0018 8.47E-01 --+ 1.02E-02WBC count rs928940 2 113877495 t g 0.3068 2.00E-04 0.002 9.23E-01 -++ 3.00E-01WBC count rs9308681 2 113781335 c g 0.5484 6.00E-04 0.0024 8.13E-01 +-- 6.80E-01WBC count rs9308682 2 113828425 a g 0.3779 0.0027 0.0022 2.11E-01 +-+ 1.86E-01WBC count rs931471 2 113912693 t c 0.3665 0.0051 0.0021 1.40E-02 +++ 3.25E-01WBC count rs957200 2 113821336 a c 0.182 0.0022 0.0026 3.85E-01 +++ 4.66E-01WBC count rs957201 2 113821200 t c 0.4283 -0.0014 0.0018 4.51E-01 --+ 1.20E-03WBC count rs9678578 2 113810947 a t 0.5205 -2.00E-04 0.0025 9.27E-01 -0- 9.82E-01WBC count rs973635 2 113889134 a g 0.4377 -0.0026 0.002 1.93E-01 +-- 3.69E-01
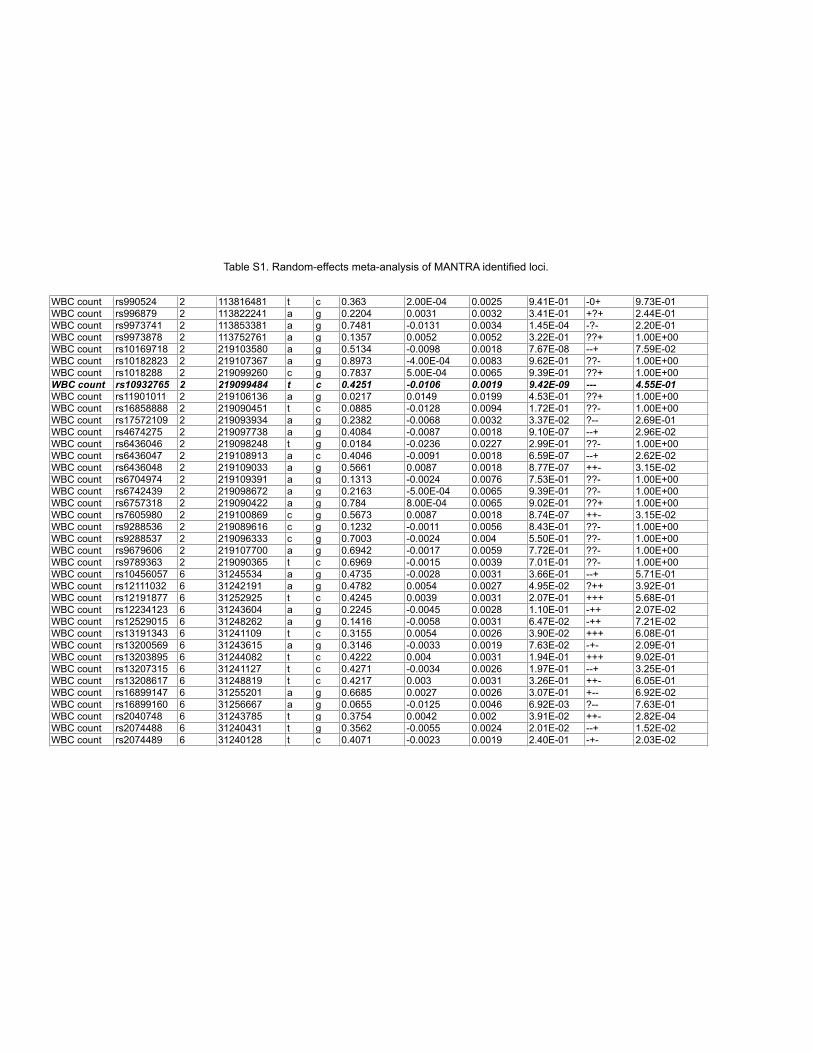
Table S1. Random-effects meta-analysis of MANTRA identified loci.
WBC count rs990524 2 113816481 t c 0.363 2.00E-04 0.0025 9.41E-01 -0+ 9.73E-01WBC count rs996879 2 113822241 a g 0.2204 0.0031 0.0032 3.41E-01 +?+ 2.44E-01WBC count rs9973741 2 113853381 a g 0.7481 -0.0131 0.0034 1.45E-04 -?- 2.20E-01WBC count rs9973878 2 113752761 a g 0.1357 0.0052 0.0052 3.22E-01 ??+ 1.00E+00WBC count rs10169718 2 219103580 a g 0.5134 -0.0098 0.0018 7.67E-08 --+ 7.59E-02WBC count rs10182823 2 219107367 a g 0.8973 -4.00E-04 0.0083 9.62E-01 ??- 1.00E+00WBC count rs1018288 2 219099260 c g 0.7837 5.00E-04 0.0065 9.39E-01 ??+ 1.00E+00WBC count rs10932765 2 219099484 t c 0.4251 -0.0106 0.0019 9.42E-09 --- 4.55E-01WBC count rs11901011 2 219106136 a g 0.0217 0.0149 0.0199 4.53E-01 ??+ 1.00E+00WBC count rs16858888 2 219090451 t c 0.0885 -0.0128 0.0094 1.72E-01 ??- 1.00E+00WBC count rs17572109 2 219093934 a g 0.2382 -0.0068 0.0032 3.37E-02 ?-- 2.69E-01WBC count rs4674275 2 219097738 a g 0.4084 -0.0087 0.0018 9.10E-07 --+ 2.96E-02WBC count rs6436046 2 219098248 t g 0.0184 -0.0236 0.0227 2.99E-01 ??- 1.00E+00WBC count rs6436047 2 219108913 a c 0.4046 -0.0091 0.0018 6.59E-07 --+ 2.62E-02WBC count rs6436048 2 219109033 a g 0.5661 0.0087 0.0018 8.77E-07 ++- 3.15E-02WBC count rs6704974 2 219109391 a g 0.1313 -0.0024 0.0076 7.53E-01 ??- 1.00E+00WBC count rs6742439 2 219098672 a g 0.2163 -5.00E-04 0.0065 9.39E-01 ??- 1.00E+00WBC count rs6757318 2 219090422 a g 0.784 8.00E-04 0.0065 9.02E-01 ??+ 1.00E+00WBC count rs7605980 2 219100869 c g 0.5673 0.0087 0.0018 8.74E-07 ++- 3.15E-02WBC count rs9288536 2 219089616 c g 0.1232 -0.0011 0.0056 8.43E-01 ??- 1.00E+00WBC count rs9288537 2 219096333 c g 0.7003 -0.0024 0.004 5.50E-01 ??- 1.00E+00WBC count rs9679606 2 219107700 a g 0.6942 -0.0017 0.0059 7.72E-01 ??- 1.00E+00WBC count rs9789363 2 219090365 t c 0.6969 -0.0015 0.0039 7.01E-01 ??- 1.00E+00WBC count rs10456057 6 31245534 a g 0.4735 -0.0028 0.0031 3.66E-01 --+ 5.71E-01WBC count rs12111032 6 31242191 a g 0.4782 0.0054 0.0027 4.95E-02 ?++ 3.92E-01WBC count rs12191877 6 31252925 t c 0.4245 0.0039 0.0031 2.07E-01 +++ 5.68E-01WBC count rs12234123 6 31243604 a g 0.2245 -0.0045 0.0028 1.10E-01 -++ 2.07E-02WBC count rs12529015 6 31248262 a g 0.1416 -0.0058 0.0031 6.47E-02 -++ 7.21E-02WBC count rs13191343 6 31241109 t c 0.3155 0.0054 0.0026 3.90E-02 +++ 6.08E-01WBC count rs13200569 6 31243615 a g 0.3146 -0.0033 0.0019 7.63E-02 -+- 2.09E-01WBC count rs13203895 6 31244082 t c 0.4222 0.004 0.0031 1.94E-01 +++ 9.02E-01WBC count rs13207315 6 31241127 t c 0.4271 -0.0034 0.0026 1.97E-01 --+ 3.25E-01WBC count rs13208617 6 31248819 t c 0.4217 0.003 0.0031 3.26E-01 ++- 6.05E-01WBC count rs16899147 6 31255201 a g 0.6685 0.0027 0.0026 3.07E-01 +-- 6.92E-02WBC count rs16899160 6 31256667 a g 0.0655 -0.0125 0.0046 6.92E-03 ?-- 7.63E-01WBC count rs2040748 6 31243785 t g 0.3754 0.0042 0.002 3.91E-02 ++- 2.82E-04WBC count rs2074488 6 31240431 t g 0.3562 -0.0055 0.0024 2.01E-02 --+ 1.52E-02WBC count rs2074489 6 31240128 t c 0.4071 -0.0023 0.0019 2.40E-01 -+- 2.03E-02
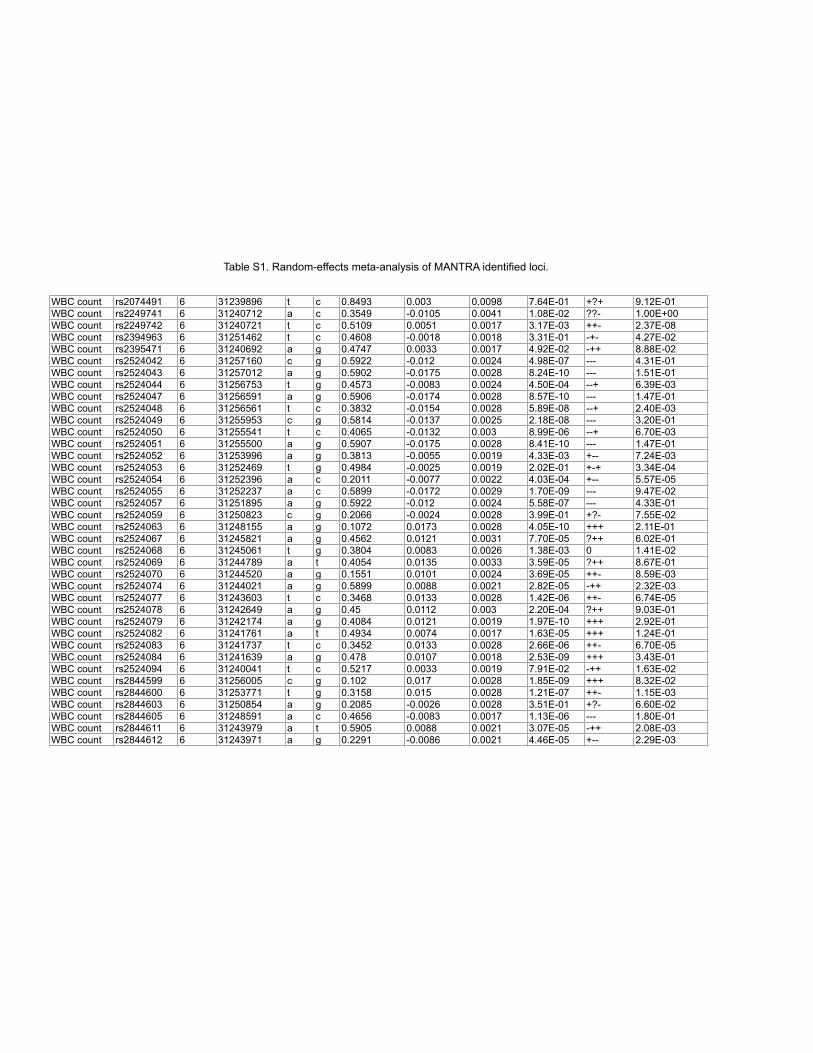
Table S1. Random-effects meta-analysis of MANTRA identified loci.
WBC count rs2074491 6 31239896 t c 0.8493 0.003 0.0098 7.64E-01 +?+ 9.12E-01WBC count rs2249741 6 31240712 a c 0.3549 -0.0105 0.0041 1.08E-02 ??- 1.00E+00WBC count rs2249742 6 31240721 t c 0.5109 0.0051 0.0017 3.17E-03 ++- 2.37E-08WBC count rs2394963 6 31251462 t c 0.4608 -0.0018 0.0018 3.31E-01 -+- 4.27E-02WBC count rs2395471 6 31240692 a g 0.4747 0.0033 0.0017 4.92E-02 -++ 8.88E-02WBC count rs2524042 6 31257160 c g 0.5922 -0.012 0.0024 4.98E-07 --- 4.31E-01WBC count rs2524043 6 31257012 a g 0.5902 -0.0175 0.0028 8.24E-10 --- 1.51E-01WBC count rs2524044 6 31256753 t g 0.4573 -0.0083 0.0024 4.50E-04 --+ 6.39E-03WBC count rs2524047 6 31256591 a g 0.5906 -0.0174 0.0028 8.57E-10 --- 1.47E-01WBC count rs2524048 6 31256561 t c 0.3832 -0.0154 0.0028 5.89E-08 --+ 2.40E-03WBC count rs2524049 6 31255953 c g 0.5814 -0.0137 0.0025 2.18E-08 --- 3.20E-01WBC count rs2524050 6 31255541 t c 0.4065 -0.0132 0.003 8.99E-06 --+ 6.70E-03WBC count rs2524051 6 31255500 a g 0.5907 -0.0175 0.0028 8.41E-10 --- 1.47E-01WBC count rs2524052 6 31253996 a g 0.3813 -0.0055 0.0019 4.33E-03 +-- 7.24E-03WBC count rs2524053 6 31252469 t g 0.4984 -0.0025 0.0019 2.02E-01 +-+ 3.34E-04WBC count rs2524054 6 31252396 a c 0.2011 -0.0077 0.0022 4.03E-04 +-- 5.57E-05WBC count rs2524055 6 31252237 a c 0.5899 -0.0172 0.0029 1.70E-09 --- 9.47E-02WBC count rs2524057 6 31251895 a g 0.5922 -0.012 0.0024 5.58E-07 --- 4.33E-01WBC count rs2524059 6 31250823 c g 0.2066 -0.0024 0.0028 3.99E-01 +?- 7.55E-02WBC count rs2524063 6 31248155 a g 0.1072 0.0173 0.0028 4.05E-10 +++ 2.11E-01WBC count rs2524067 6 31245821 a g 0.4562 0.0121 0.0031 7.70E-05 ?++ 6.02E-01WBC count rs2524068 6 31245061 t g 0.3804 0.0083 0.0026 1.38E-03 0 1.41E-02WBC count rs2524069 6 31244789 a t 0.4054 0.0135 0.0033 3.59E-05 ?++ 8.67E-01WBC count rs2524070 6 31244520 a g 0.1551 0.0101 0.0024 3.69E-05 ++- 8.59E-03WBC count rs2524074 6 31244021 a g 0.5899 0.0088 0.0021 2.82E-05 -++ 2.32E-03WBC count rs2524077 6 31243603 t c 0.3468 0.0133 0.0028 1.42E-06 ++- 6.74E-05WBC count rs2524078 6 31242649 a g 0.45 0.0112 0.003 2.20E-04 ?++ 9.03E-01WBC count rs2524079 6 31242174 a g 0.4084 0.0121 0.0019 1.97E-10 +++ 2.92E-01WBC count rs2524082 6 31241761 a t 0.4934 0.0074 0.0017 1.63E-05 +++ 1.24E-01WBC count rs2524083 6 31241737 t c 0.3452 0.0133 0.0028 2.66E-06 ++- 6.70E-05WBC count rs2524084 6 31241639 a g 0.478 0.0107 0.0018 2.53E-09 +++ 3.43E-01WBC count rs2524094 6 31240041 t c 0.5217 0.0033 0.0019 7.91E-02 -++ 1.63E-02WBC count rs2844599 6 31256005 c g 0.102 0.017 0.0028 1.85E-09 +++ 8.32E-02WBC count rs2844600 6 31253771 t g 0.3158 0.015 0.0028 1.21E-07 ++- 1.15E-03WBC count rs2844603 6 31250854 a g 0.2085 -0.0026 0.0028 3.51E-01 +?- 6.60E-02WBC count rs2844605 6 31248591 a c 0.4656 -0.0083 0.0017 1.13E-06 --- 1.80E-01WBC count rs2844611 6 31243979 a t 0.5905 0.0088 0.0021 3.07E-05 -++ 2.08E-03WBC count rs2844612 6 31243971 a g 0.2291 -0.0086 0.0021 4.46E-05 +-- 2.29E-03
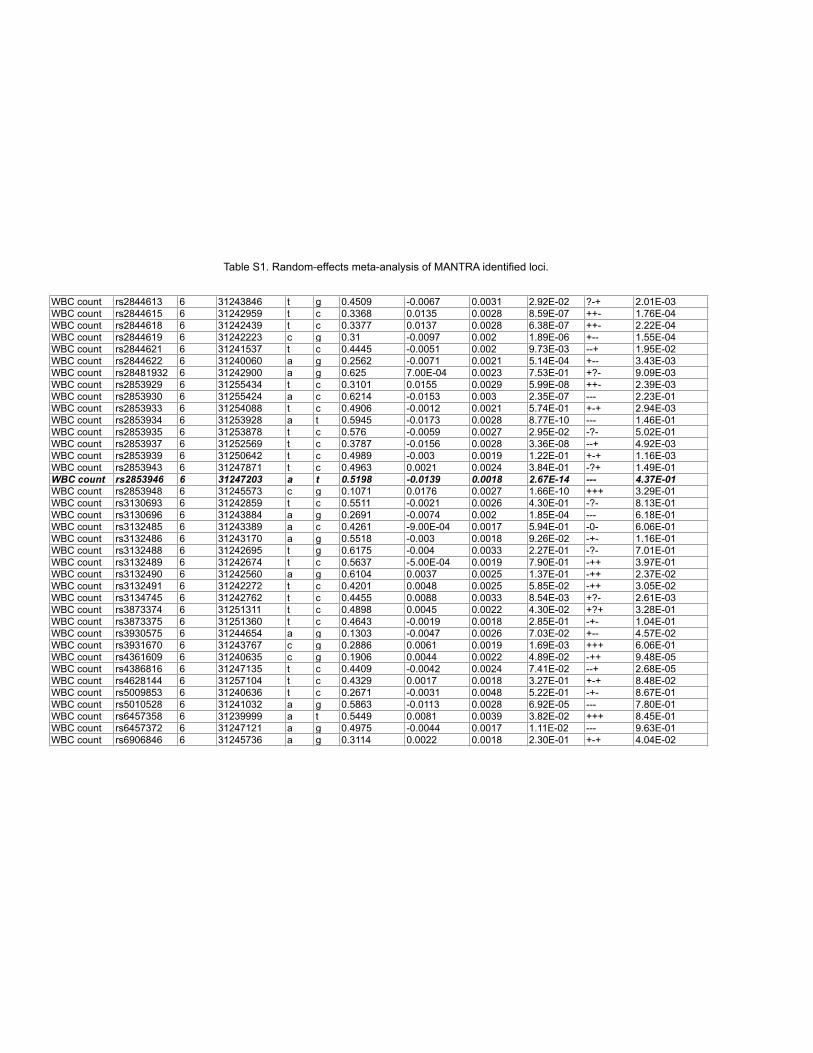
Table S1. Random-effects meta-analysis of MANTRA identified loci.
WBC count rs2844613 6 31243846 t g 0.4509 -0.0067 0.0031 2.92E-02 ?-+ 2.01E-03WBC count rs2844615 6 31242959 t c 0.3368 0.0135 0.0028 8.59E-07 ++- 1.76E-04WBC count rs2844618 6 31242439 t c 0.3377 0.0137 0.0028 6.38E-07 ++- 2.22E-04WBC count rs2844619 6 31242223 c g 0.31 -0.0097 0.002 1.89E-06 +-- 1.55E-04WBC count rs2844621 6 31241537 t c 0.4445 -0.0051 0.002 9.73E-03 --+ 1.95E-02WBC count rs2844622 6 31240060 a g 0.2562 -0.0071 0.0021 5.14E-04 +-- 3.43E-03WBC count rs28481932 6 31242900 a g 0.625 7.00E-04 0.0023 7.53E-01 +?- 9.09E-03WBC count rs2853929 6 31255434 t c 0.3101 0.0155 0.0029 5.99E-08 ++- 2.39E-03WBC count rs2853930 6 31255424 a c 0.6214 -0.0153 0.003 2.35E-07 --- 2.23E-01WBC count rs2853933 6 31254088 t c 0.4906 -0.0012 0.0021 5.74E-01 +-+ 2.94E-03WBC count rs2853934 6 31253928 a t 0.5945 -0.0173 0.0028 8.77E-10 --- 1.46E-01WBC count rs2853935 6 31253878 t c 0.576 -0.0059 0.0027 2.95E-02 -?- 5.02E-01WBC count rs2853937 6 31252569 t c 0.3787 -0.0156 0.0028 3.36E-08 --+ 4.92E-03WBC count rs2853939 6 31250642 t c 0.4989 -0.003 0.0019 1.22E-01 +-+ 1.16E-03WBC count rs2853943 6 31247871 t c 0.4963 0.0021 0.0024 3.84E-01 -?+ 1.49E-01WBC count rs2853946 6 31247203 a t 0.5198 -0.0139 0.0018 2.67E-14 --- 4.37E-01WBC count rs2853948 6 31245573 c g 0.1071 0.0176 0.0027 1.66E-10 +++ 3.29E-01WBC count rs3130693 6 31242859 t c 0.5511 -0.0021 0.0026 4.30E-01 -?- 8.13E-01WBC count rs3130696 6 31243884 a g 0.2691 -0.0074 0.002 1.85E-04 --- 6.18E-01WBC count rs3132485 6 31243389 a c 0.4261 -9.00E-04 0.0017 5.94E-01 -0- 6.06E-01WBC count rs3132486 6 31243170 a g 0.5518 -0.003 0.0018 9.26E-02 -+- 1.16E-01WBC count rs3132488 6 31242695 t g 0.6175 -0.004 0.0033 2.27E-01 -?- 7.01E-01WBC count rs3132489 6 31242674 t c 0.5637 -5.00E-04 0.0019 7.90E-01 -++ 3.97E-01WBC count rs3132490 6 31242560 a g 0.6104 0.0037 0.0025 1.37E-01 -++ 2.37E-02WBC count rs3132491 6 31242272 t c 0.4201 0.0048 0.0025 5.85E-02 -++ 3.05E-02WBC count rs3134745 6 31242762 t c 0.4455 0.0088 0.0033 8.54E-03 +?- 2.61E-03WBC count rs3873374 6 31251311 t c 0.4898 0.0045 0.0022 4.30E-02 +?+ 3.28E-01WBC count rs3873375 6 31251360 t c 0.4643 -0.0019 0.0018 2.85E-01 -+- 1.04E-01WBC count rs3930575 6 31244654 a g 0.1303 -0.0047 0.0026 7.03E-02 +-- 4.57E-02WBC count rs3931670 6 31243767 c g 0.2886 0.0061 0.0019 1.69E-03 +++ 6.06E-01WBC count rs4361609 6 31240635 c g 0.1906 0.0044 0.0022 4.89E-02 -++ 9.48E-05WBC count rs4386816 6 31247135 t c 0.4409 -0.0042 0.0024 7.41E-02 --+ 2.68E-05WBC count rs4628144 6 31257104 t c 0.4329 0.0017 0.0018 3.27E-01 +-+ 8.48E-02WBC count rs5009853 6 31240636 t c 0.2671 -0.0031 0.0048 5.22E-01 -+- 8.67E-01WBC count rs5010528 6 31241032 a g 0.5863 -0.0113 0.0028 6.92E-05 --- 7.80E-01WBC count rs6457358 6 31239999 a t 0.5449 0.0081 0.0039 3.82E-02 +++ 8.45E-01WBC count rs6457372 6 31247121 a g 0.4975 -0.0044 0.0017 1.11E-02 --- 9.63E-01WBC count rs6906846 6 31245736 a g 0.3114 0.0022 0.0018 2.30E-01 +-+ 4.04E-02
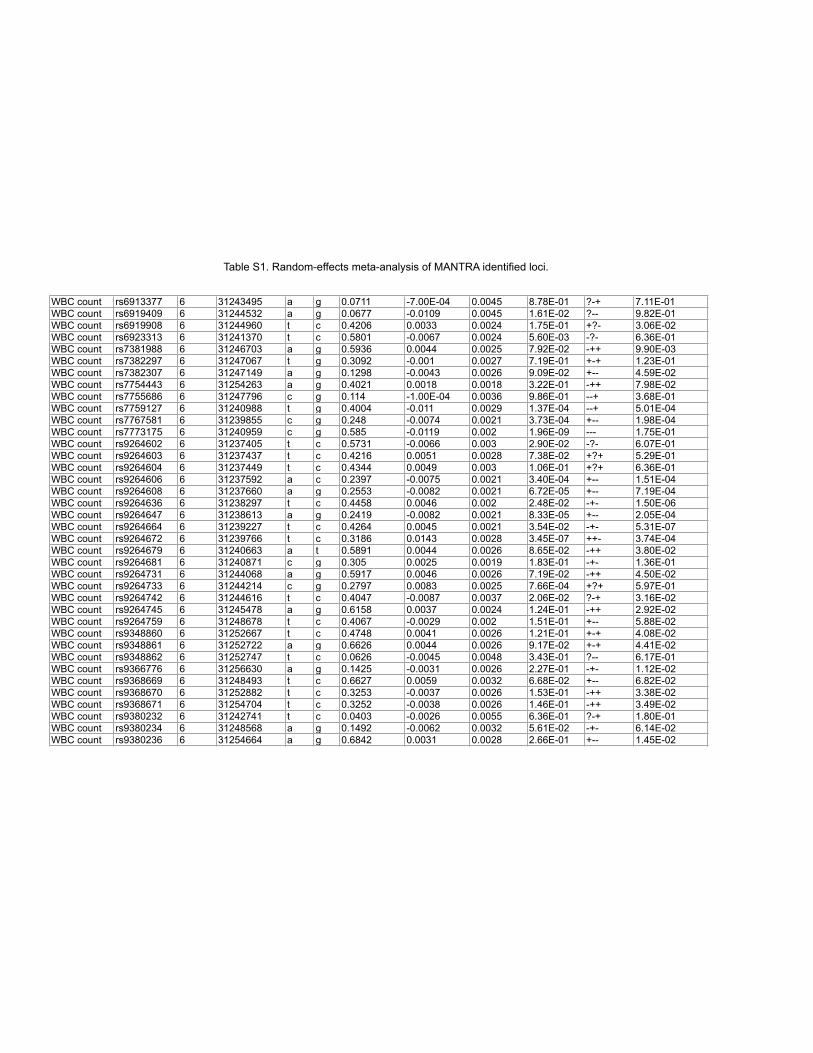
Table S1. Random-effects meta-analysis of MANTRA identified loci.
WBC count rs6913377 6 31243495 a g 0.0711 -7.00E-04 0.0045 8.78E-01 ?-+ 7.11E-01WBC count rs6919409 6 31244532 a g 0.0677 -0.0109 0.0045 1.61E-02 ?-- 9.82E-01WBC count rs6919908 6 31244960 t c 0.4206 0.0033 0.0024 1.75E-01 +?- 3.06E-02WBC count rs6923313 6 31241370 t c 0.5801 -0.0067 0.0024 5.60E-03 -?- 6.36E-01WBC count rs7381988 6 31246703 a g 0.5936 0.0044 0.0025 7.92E-02 -++ 9.90E-03WBC count rs7382297 6 31247067 t g 0.3092 -0.001 0.0027 7.19E-01 +-+ 1.23E-01WBC count rs7382307 6 31247149 a g 0.1298 -0.0043 0.0026 9.09E-02 +-- 4.59E-02WBC count rs7754443 6 31254263 a g 0.4021 0.0018 0.0018 3.22E-01 -++ 7.98E-02WBC count rs7755686 6 31247796 c g 0.114 -1.00E-04 0.0036 9.86E-01 --+ 3.68E-01WBC count rs7759127 6 31240988 t g 0.4004 -0.011 0.0029 1.37E-04 --+ 5.01E-04WBC count rs7767581 6 31239855 c g 0.248 -0.0074 0.0021 3.73E-04 +-- 1.98E-04WBC count rs7773175 6 31240959 c g 0.585 -0.0119 0.002 1.96E-09 --- 1.75E-01WBC count rs9264602 6 31237405 t c 0.5731 -0.0066 0.003 2.90E-02 -?- 6.07E-01WBC count rs9264603 6 31237437 t c 0.4216 0.0051 0.0028 7.38E-02 +?+ 5.29E-01WBC count rs9264604 6 31237449 t c 0.4344 0.0049 0.003 1.06E-01 +?+ 6.36E-01WBC count rs9264606 6 31237592 a c 0.2397 -0.0075 0.0021 3.40E-04 +-- 1.51E-04WBC count rs9264608 6 31237660 a g 0.2553 -0.0082 0.0021 6.72E-05 +-- 7.19E-04WBC count rs9264636 6 31238297 t c 0.4458 0.0046 0.002 2.48E-02 -+- 1.50E-06WBC count rs9264647 6 31238613 a g 0.2419 -0.0082 0.0021 8.33E-05 +-- 2.05E-04WBC count rs9264664 6 31239227 t c 0.4264 0.0045 0.0021 3.54E-02 -+- 5.31E-07WBC count rs9264672 6 31239766 t c 0.3186 0.0143 0.0028 3.45E-07 ++- 3.74E-04WBC count rs9264679 6 31240663 a t 0.5891 0.0044 0.0026 8.65E-02 -++ 3.80E-02WBC count rs9264681 6 31240871 c g 0.305 0.0025 0.0019 1.83E-01 -+- 1.36E-01WBC count rs9264731 6 31244068 a g 0.5917 0.0046 0.0026 7.19E-02 -++ 4.50E-02WBC count rs9264733 6 31244214 c g 0.2797 0.0083 0.0025 7.66E-04 +?+ 5.97E-01WBC count rs9264742 6 31244616 t c 0.4047 -0.0087 0.0037 2.06E-02 ?-+ 3.16E-02WBC count rs9264745 6 31245478 a g 0.6158 0.0037 0.0024 1.24E-01 -++ 2.92E-02WBC count rs9264759 6 31248678 t c 0.4067 -0.0029 0.002 1.51E-01 +-- 5.88E-02WBC count rs9348860 6 31252667 t c 0.4748 0.0041 0.0026 1.21E-01 +-+ 4.08E-02WBC count rs9348861 6 31252722 a g 0.6626 0.0044 0.0026 9.17E-02 +-+ 4.41E-02WBC count rs9348862 6 31252747 t c 0.0626 -0.0045 0.0048 3.43E-01 ?-- 6.17E-01WBC count rs9366776 6 31256630 a g 0.1425 -0.0031 0.0026 2.27E-01 -+- 1.12E-02WBC count rs9368669 6 31248493 t c 0.6627 0.0059 0.0032 6.68E-02 +-- 6.82E-02WBC count rs9368670 6 31252882 t c 0.3253 -0.0037 0.0026 1.53E-01 -++ 3.38E-02WBC count rs9368671 6 31254704 t c 0.3252 -0.0038 0.0026 1.46E-01 -++ 3.49E-02WBC count rs9380232 6 31242741 t c 0.0403 -0.0026 0.0055 6.36E-01 ?-+ 1.80E-01WBC count rs9380234 6 31248568 a g 0.1492 -0.0062 0.0032 5.61E-02 -+- 6.14E-02WBC count rs9380236 6 31254664 a g 0.6842 0.0031 0.0028 2.66E-01 +-- 1.45E-02
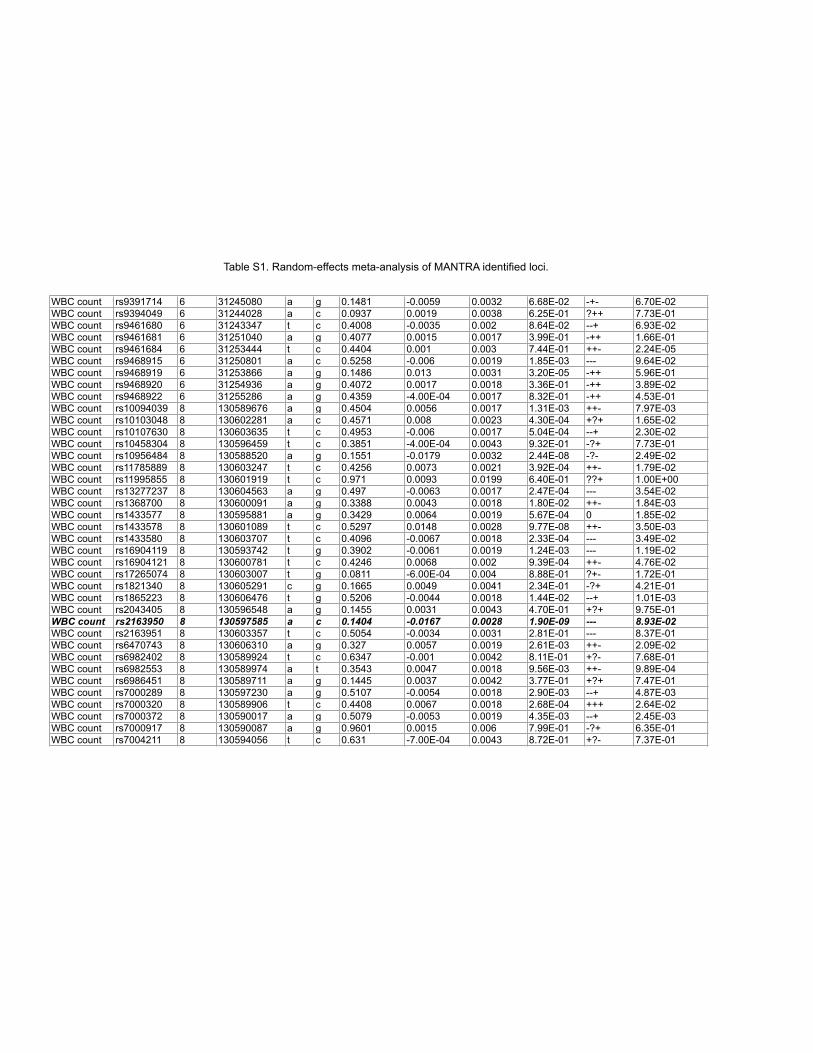
Table S1. Random-effects meta-analysis of MANTRA identified loci.
WBC count rs9391714 6 31245080 a g 0.1481 -0.0059 0.0032 6.68E-02 -+- 6.70E-02WBC count rs9394049 6 31244028 a c 0.0937 0.0019 0.0038 6.25E-01 ?++ 7.73E-01WBC count rs9461680 6 31243347 t c 0.4008 -0.0035 0.002 8.64E-02 --+ 6.93E-02WBC count rs9461681 6 31251040 a g 0.4077 0.0015 0.0017 3.99E-01 -++ 1.66E-01WBC count rs9461684 6 31253444 t c 0.4404 0.001 0.003 7.44E-01 ++- 2.24E-05WBC count rs9468915 6 31250801 a c 0.5258 -0.006 0.0019 1.85E-03 --- 9.64E-02WBC count rs9468919 6 31253866 a g 0.1486 0.013 0.0031 3.20E-05 -++ 5.96E-01WBC count rs9468920 6 31254936 a g 0.4072 0.0017 0.0018 3.36E-01 -++ 3.89E-02WBC count rs9468922 6 31255286 a g 0.4359 -4.00E-04 0.0017 8.32E-01 -++ 4.53E-01WBC count rs10094039 8 130589676 a g 0.4504 0.0056 0.0017 1.31E-03 ++- 7.97E-03WBC count rs10103048 8 130602281 a c 0.4571 0.008 0.0023 4.30E-04 +?+ 1.65E-02WBC count rs10107630 8 130603635 t c 0.4953 -0.006 0.0017 5.04E-04 --+ 2.30E-02WBC count rs10458304 8 130596459 t c 0.3851 -4.00E-04 0.0043 9.32E-01 -?+ 7.73E-01WBC count rs10956484 8 130588520 a g 0.1551 -0.0179 0.0032 2.44E-08 -?- 2.49E-02WBC count rs11785889 8 130603247 t c 0.4256 0.0073 0.0021 3.92E-04 ++- 1.79E-02WBC count rs11995855 8 130601919 t c 0.971 0.0093 0.0199 6.40E-01 ??+ 1.00E+00WBC count rs13277237 8 130604563 a g 0.497 -0.0063 0.0017 2.47E-04 --- 3.54E-02WBC count rs1368700 8 130600091 a g 0.3388 0.0043 0.0018 1.80E-02 ++- 1.84E-03WBC count rs1433577 8 130595881 a g 0.3429 0.0064 0.0019 5.67E-04 0 1.85E-02WBC count rs1433578 8 130601089 t c 0.5297 0.0148 0.0028 9.77E-08 ++- 3.50E-03WBC count rs1433580 8 130603707 t c 0.4096 -0.0067 0.0018 2.33E-04 --- 3.49E-02WBC count rs16904119 8 130593742 t g 0.3902 -0.0061 0.0019 1.24E-03 --- 1.19E-02WBC count rs16904121 8 130600781 t c 0.4246 0.0068 0.002 9.39E-04 ++- 4.76E-02WBC count rs17265074 8 130603007 t g 0.0811 -6.00E-04 0.004 8.88E-01 ?+- 1.72E-01WBC count rs1821340 8 130605291 c g 0.1665 0.0049 0.0041 2.34E-01 -?+ 4.21E-01WBC count rs1865223 8 130606476 t g 0.5206 -0.0044 0.0018 1.44E-02 --+ 1.01E-03WBC count rs2043405 8 130596548 a g 0.1455 0.0031 0.0043 4.70E-01 +?+ 9.75E-01WBC count rs2163950 8 130597585 a c 0.1404 -0.0167 0.0028 1.90E-09 --- 8.93E-02WBC count rs2163951 8 130603357 t c 0.5054 -0.0034 0.0031 2.81E-01 --- 8.37E-01WBC count rs6470743 8 130606310 a g 0.327 0.0057 0.0019 2.61E-03 ++- 2.09E-02WBC count rs6982402 8 130589924 t c 0.6347 -0.001 0.0042 8.11E-01 +?- 7.68E-01WBC count rs6982553 8 130589974 a t 0.3543 0.0047 0.0018 9.56E-03 ++- 9.89E-04WBC count rs6986451 8 130589711 a g 0.1445 0.0037 0.0042 3.77E-01 +?+ 7.47E-01WBC count rs7000289 8 130597230 a g 0.5107 -0.0054 0.0018 2.90E-03 --+ 4.87E-03WBC count rs7000320 8 130589906 t c 0.4408 0.0067 0.0018 2.68E-04 +++ 2.64E-02WBC count rs7000372 8 130590017 a g 0.5079 -0.0053 0.0019 4.35E-03 --+ 2.45E-03WBC count rs7000917 8 130590087 a g 0.9601 0.0015 0.006 7.99E-01 -?+ 6.35E-01WBC count rs7004211 8 130594056 t c 0.631 -7.00E-04 0.0043 8.72E-01 +?- 7.37E-01
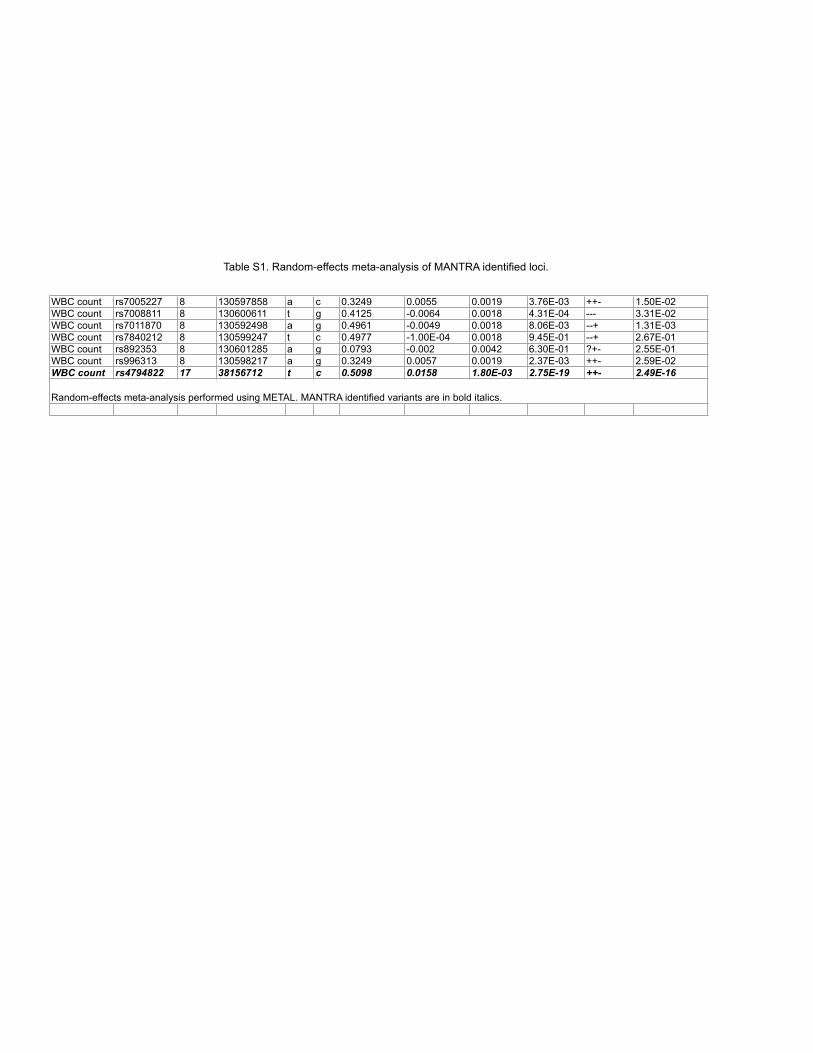
Table S1. Random-effects meta-analysis of MANTRA identified loci.
WBC count rs7005227 8 130597858 a c 0.3249 0.0055 0.0019 3.76E-03 ++- 1.50E-02WBC count rs7008811 8 130600611 t g 0.4125 -0.0064 0.0018 4.31E-04 --- 3.31E-02WBC count rs7011870 8 130592498 a g 0.4961 -0.0049 0.0018 8.06E-03 --+ 1.31E-03WBC count rs7840212 8 130599247 t c 0.4977 -1.00E-04 0.0018 9.45E-01 --+ 2.67E-01WBC count rs892353 8 130601285 a g 0.0793 -0.002 0.0042 6.30E-01 ?+- 2.55E-01WBC count rs996313 8 130598217 a g 0.3249 0.0057 0.0019 2.37E-03 ++- 2.59E-02WBC count rs4794822 17 38156712 t c 0.5098 0.0158 1.80E-03 2.75E-19 ++- 2.49E-16
Random-effects meta-analysis performed using METAL. MANTRA identified variants are in bold italics.
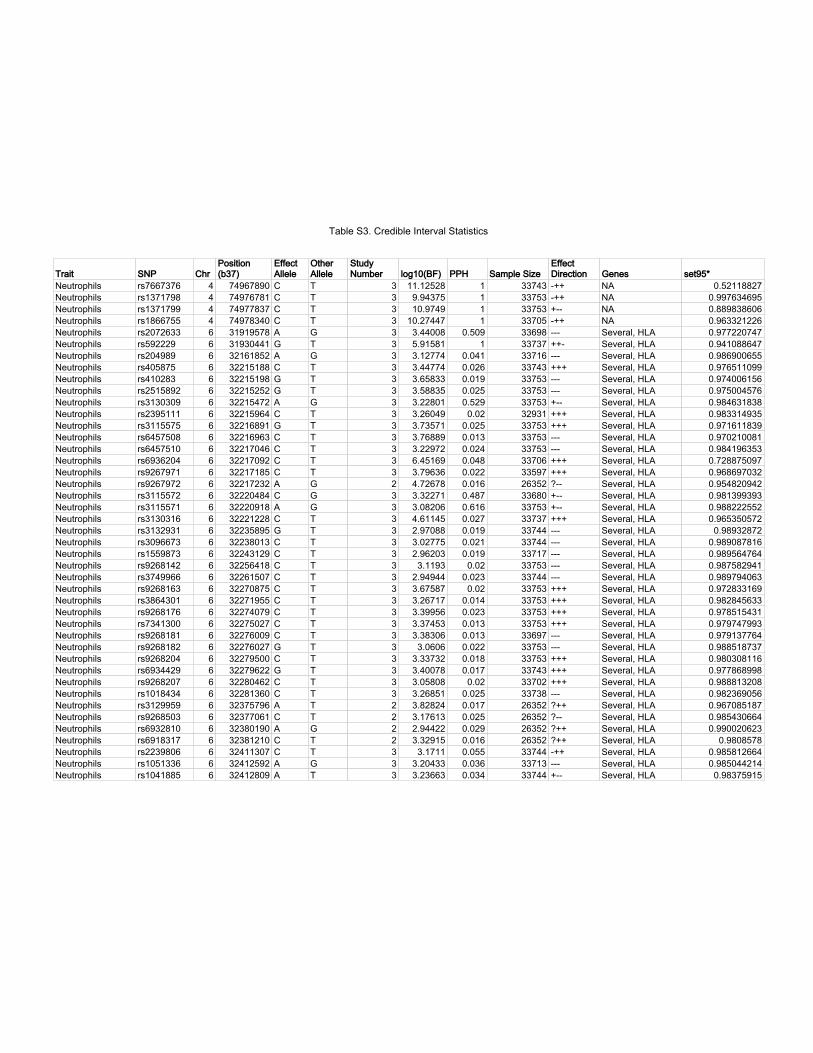
7UDLW 613 &KU3RVLWLRQ�E���
(IIHFW$OOHOH
2WKHU$OOHOH
6WXG\1XPEHU ORJ���%)� 33+ 6DPSOH�6L]H
(IIHFW'LUHFWLRQ *HQHV VHW��
1HXWURSKLOV UV������� � �������� & 7 � �������� � ����� ��� 1$ ����������1HXWURSKLOV UV������� � �������� & 7 � ������� � ����� ��� 1$ �����������1HXWURSKLOV UV������� � �������� & 7 � ������� � ����� ��� 1$ �����������1HXWURSKLOV UV������� � �������� & 7 � �������� � ����� ��� 1$ �����������1HXWURSKLOV UV������� � �������� $ * � ������� ����� ����� ��� 6HYHUDO��+/$ �����������1HXWURSKLOV UV������ � �������� * 7 � ������� � ����� ��� 6HYHUDO��+/$ �����������1HXWURSKLOV UV������ � �������� $ * � ������� ����� ����� ��� 6HYHUDO��+/$ �����������1HXWURSKLOV UV������ � �������� & 7 � ������� ����� ����� ��� 6HYHUDO��+/$ �����������1HXWURSKLOV UV������ � �������� * 7 � ������� ����� ����� ��� 6HYHUDO��+/$ �����������1HXWURSKLOV UV������� � �������� * 7 � ������� ����� ����� ��� 6HYHUDO��+/$ �����������1HXWURSKLOV UV������� � �������� $ * � ������� ����� ����� ��� 6HYHUDO��+/$ �����������1HXWURSKLOV UV������� � �������� & 7 � ������� ���� ����� ��� 6HYHUDO��+/$ �����������1HXWURSKLOV UV������� � �������� * 7 � ������� ����� ����� ��� 6HYHUDO��+/$ �����������1HXWURSKLOV UV������� � �������� & 7 � ������� ����� ����� ��� 6HYHUDO��+/$ �����������1HXWURSKLOV UV������� � �������� & 7 � ������� ����� ����� ��� 6HYHUDO��+/$ �����������1HXWURSKLOV UV������� � �������� & 7 � ������� ����� ����� ��� 6HYHUDO��+/$ �����������1HXWURSKLOV UV������� � �������� & 7 � ������� ����� ����� ��� 6HYHUDO��+/$ �����������1HXWURSKLOV UV������� � �������� $ * � ������� ����� ����� "�� 6HYHUDO��+/$ �����������1HXWURSKLOV UV������� � �������� & * � ������� ����� ����� ��� 6HYHUDO��+/$ �����������1HXWURSKLOV UV������� � �������� $ * � ������� ����� ����� ��� 6HYHUDO��+/$ �����������1HXWURSKLOV UV������� � �������� & 7 � ������� ����� ����� ��� 6HYHUDO��+/$ �����������1HXWURSKLOV UV������� � �������� * 7 � ������� ����� ����� ��� 6HYHUDO��+/$ ����������1HXWURSKLOV UV������� � �������� & 7 � ������� ����� ����� ��� 6HYHUDO��+/$ �����������1HXWURSKLOV UV������� � �������� & 7 � ������� ����� ����� ��� 6HYHUDO��+/$ �����������1HXWURSKLOV UV������� � �������� & 7 � ������ ���� ����� ��� 6HYHUDO��+/$ �����������1HXWURSKLOV UV������� � �������� & 7 � ������� ����� ����� ��� 6HYHUDO��+/$ �����������1HXWURSKLOV UV������� � �������� & 7 � ������� ���� ����� ��� 6HYHUDO��+/$ �����������1HXWURSKLOV UV������� � �������� & 7 � ������� ����� ����� ��� 6HYHUDO��+/$ �����������1HXWURSKLOV UV������� � �������� & 7 � ������� ����� ����� ��� 6HYHUDO��+/$ �����������1HXWURSKLOV UV������� � �������� & 7 � ������� ����� ����� ��� 6HYHUDO��+/$ �����������1HXWURSKLOV UV������� � �������� & 7 � ������� ����� ����� ��� 6HYHUDO��+/$ �����������1HXWURSKLOV UV������� � �������� * 7 � ������ ����� ����� ��� 6HYHUDO��+/$ �����������1HXWURSKLOV UV������� � �������� & 7 � ������� ����� ����� ��� 6HYHUDO��+/$ �����������1HXWURSKLOV UV������� � �������� * 7 � ������� ����� ����� ��� 6HYHUDO��+/$ �����������1HXWURSKLOV UV������� � �������� & 7 � ������� ���� ����� ��� 6HYHUDO��+/$ �����������1HXWURSKLOV UV������� � �������� & 7 � ������� ����� ����� ��� 6HYHUDO��+/$ �����������1HXWURSKLOV UV������� � �������� $ 7 � ������� ����� ����� "�� 6HYHUDO��+/$ �����������1HXWURSKLOV UV������� � �������� & 7 � ������� ����� ����� "�� 6HYHUDO��+/$ �����������1HXWURSKLOV UV������� � �������� $ * � ������� ����� ����� "�� 6HYHUDO��+/$ �����������1HXWURSKLOV UV������� � �������� & 7 � ������� ����� ����� "�� 6HYHUDO��+/$ ���������1HXWURSKLOV UV������� � �������� & 7 � ������ ����� ����� ��� 6HYHUDO��+/$ �����������1HXWURSKLOV UV������� � �������� $ * � ������� ����� ����� ��� 6HYHUDO��+/$ �����������1HXWURSKLOV UV������� � �������� $ 7 � ������� ����� ����� ��� 6HYHUDO��+/$ ����������
7DEOH�6���&UHGLEOH�,QWHUYDO�6WDWLVWLFV
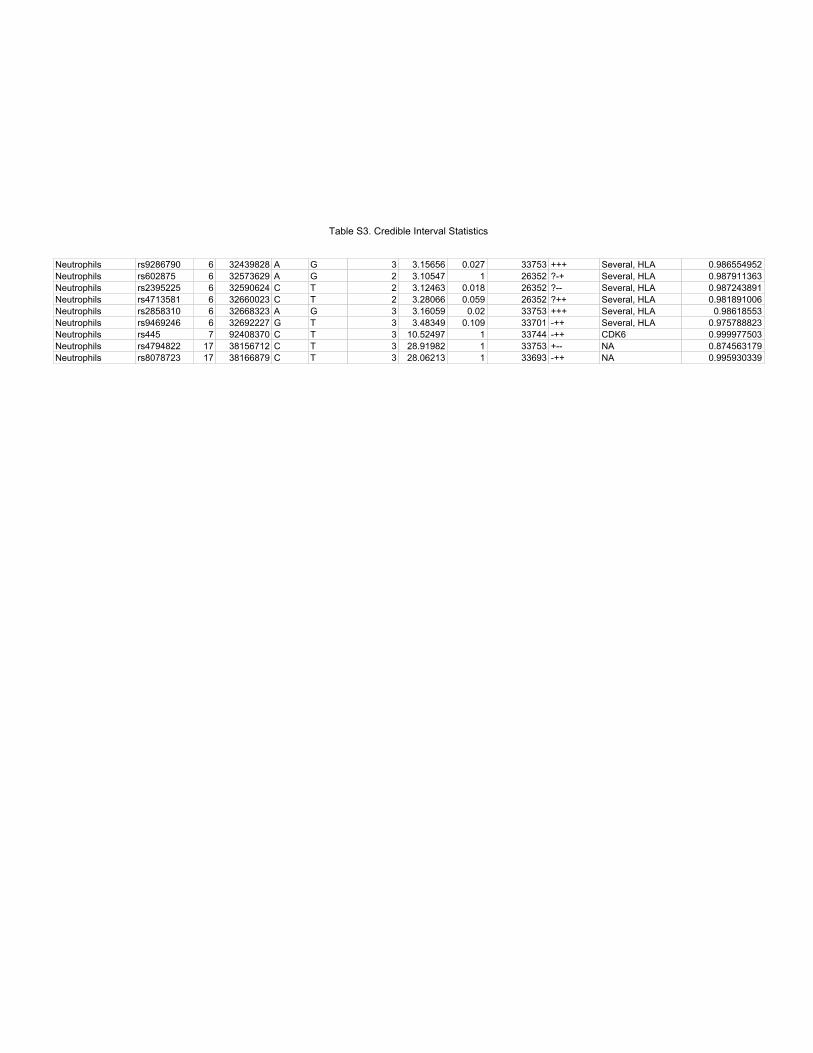
1HXWURSKLOV UV������� � �������� $ * � ������� ����� ����� ��� 6HYHUDO��+/$ �����������1HXWURSKLOV UV������ � �������� $ * � ������� � ����� "�� 6HYHUDO��+/$ �����������1HXWURSKLOV UV������� � �������� & 7 � ������� ����� ����� "�� 6HYHUDO��+/$ �����������1HXWURSKLOV UV������� � �������� & 7 � ������� ����� ����� "�� 6HYHUDO��+/$ �����������1HXWURSKLOV UV������� � �������� $ * � ������� ���� ����� ��� 6HYHUDO��+/$ ����������1HXWURSKLOV UV������� � �������� * 7 � ������� ����� ����� ��� 6HYHUDO��+/$ �����������1HXWURSKLOV UV��� � �������� & 7 � �������� � ����� ��� &'.� �����������1HXWURSKLOV UV������� �� �������� & 7 � �������� � ����� ��� 1$ �����������1HXWURSKLOV UV������� �� �������� & 7 � �������� � ����� ��� 1$ �����������
7DEOH�6���&UHGLEOH�,QWHUYDO�6WDWLVWLFV
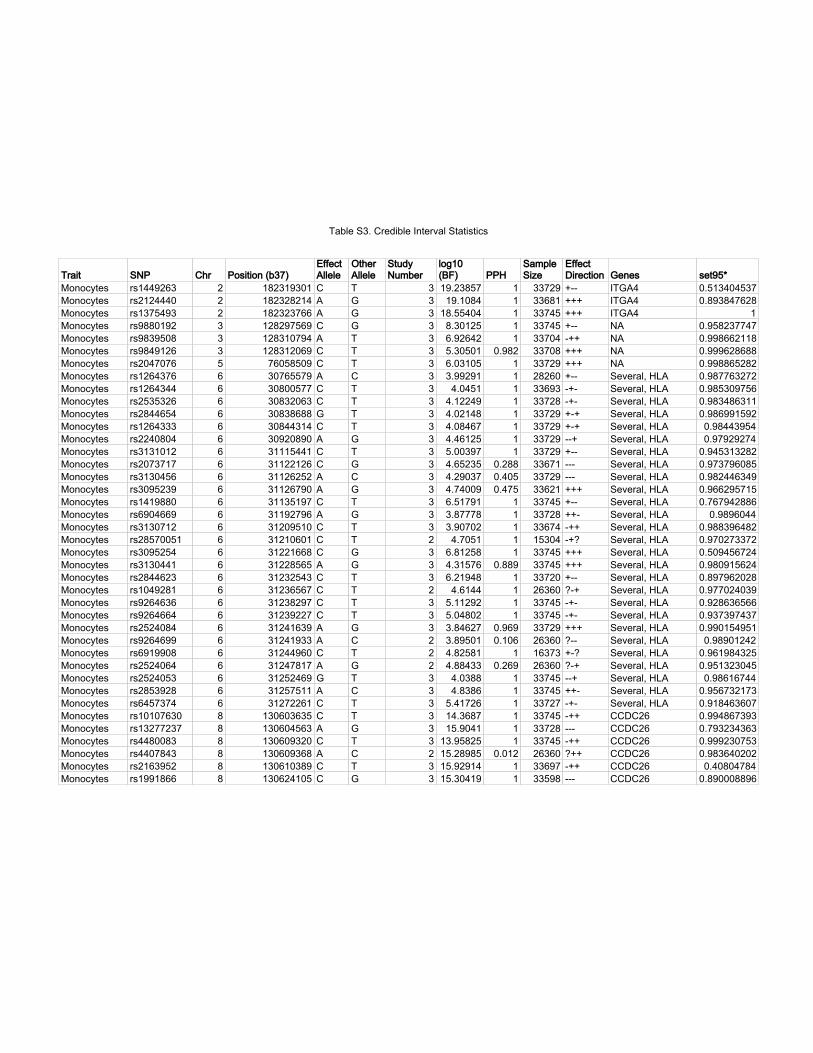
7UDLW 613 &KU 3RVLWLRQ��E���(IIHFW$OOHOH
2WKHU$OOHOH
6WXG\1XPEHU
ORJ���%)� 33+
6DPSOH6L]H
(IIHFW'LUHFWLRQ *HQHV VHW��
0RQRF\WHV UV������� � ��������� & 7 � �������� � ����� ��� ,7*$� �����������0RQRF\WHV UV������� � ��������� $ * � ������� � ����� ��� ,7*$� �����������0RQRF\WHV UV������� � ��������� $ * � �������� � ����� ��� ,7*$� �0RQRF\WHV UV������� � ��������� & * � ������� � ����� ��� 1$ �����������0RQRF\WHV UV������� � ��������� $ 7 � ������� � ����� ��� 1$ �����������0RQRF\WHV UV������� � ��������� & 7 � ������� ����� ����� ��� 1$ �����������0RQRF\WHV UV������� � �������� & 7 � ������� � ����� ��� 1$ �����������0RQRF\WHV UV������� � �������� $ & � ������� � ����� ��� 6HYHUDO��+/$ �����������0RQRF\WHV UV������� � �������� & 7 � ������ � ����� ��� 6HYHUDO��+/$ �����������0RQRF\WHV UV������� � �������� & 7 � ������� � ����� ��� 6HYHUDO��+/$ �����������0RQRF\WHV UV������� � �������� * 7 � ������� � ����� ��� 6HYHUDO��+/$ �����������0RQRF\WHV UV������� � �������� & 7 � ������� � ����� ��� 6HYHUDO��+/$ ����������0RQRF\WHV UV������� � �������� $ * � ������� � ����� ��� 6HYHUDO��+/$ ����������0RQRF\WHV UV������� � �������� & 7 � ������� � ����� ��� 6HYHUDO��+/$ �����������0RQRF\WHV UV������� � �������� & * � ������� ����� ����� ��� 6HYHUDO��+/$ �����������0RQRF\WHV UV������� � �������� $ & � ������� ����� ����� ��� 6HYHUDO��+/$ �����������0RQRF\WHV UV������� � �������� $ * � ������� ����� ����� ��� 6HYHUDO��+/$ �����������0RQRF\WHV UV������� � �������� & 7 � ������� � ����� ��� 6HYHUDO��+/$ �����������0RQRF\WHV UV������� � �������� $ * � ������� � ����� ��� 6HYHUDO��+/$ ���������0RQRF\WHV UV������� � �������� & 7 � ������� � ����� ��� 6HYHUDO��+/$ �����������0RQRF\WHV UV�������� � �������� & 7 � ������ � ����� ��" 6HYHUDO��+/$ �����������0RQRF\WHV UV������� � �������� & * � ������� � ����� ��� 6HYHUDO��+/$ �����������0RQRF\WHV UV������� � �������� $ * � ������� ����� ����� ��� 6HYHUDO��+/$ �����������0RQRF\WHV UV������� � �������� & 7 � ������� � ����� ��� 6HYHUDO��+/$ �����������0RQRF\WHV UV������� � �������� & 7 � ������ � ����� "�� 6HYHUDO��+/$ �����������0RQRF\WHV UV������� � �������� & 7 � ������� � ����� ��� 6HYHUDO��+/$ �����������0RQRF\WHV UV������� � �������� & 7 � ������� � ����� ��� 6HYHUDO��+/$ �����������0RQRF\WHV UV������� � �������� $ * � ������� ����� ����� ��� 6HYHUDO��+/$ �����������0RQRF\WHV UV������� � �������� $ & � ������� ����� ����� "�� 6HYHUDO��+/$ ����������0RQRF\WHV UV������� � �������� & 7 � ������� � ����� ��" 6HYHUDO��+/$ �����������0RQRF\WHV UV������� � �������� $ * � ������� ����� ����� "�� 6HYHUDO��+/$ �����������0RQRF\WHV UV������� � �������� * 7 � ������ � ����� ��� 6HYHUDO��+/$ ����������0RQRF\WHV UV������� � �������� $ & � ������ � ����� ��� 6HYHUDO��+/$ �����������0RQRF\WHV UV������� � �������� & 7 � ������� � ����� ��� 6HYHUDO��+/$ �����������0RQRF\WHV UV�������� � ��������� & 7 � ������� � ����� ��� &&'&�� �����������0RQRF\WHV UV�������� � ��������� $ * � ������� � ����� ��� &&'&�� �����������0RQRF\WHV UV������� � ��������� & 7 � �������� � ����� ��� &&'&�� �����������0RQRF\WHV UV������� � ��������� $ & � �������� ����� ����� "�� &&'&�� �����������0RQRF\WHV UV������� � ��������� & 7 � �������� � ����� ��� &&'&�� ����������0RQRF\WHV UV������� � ��������� & * � �������� � ����� ��� &&'&�� �����������
7DEOH�6���&UHGLEOH�,QWHUYDO�6WDWLVWLFV
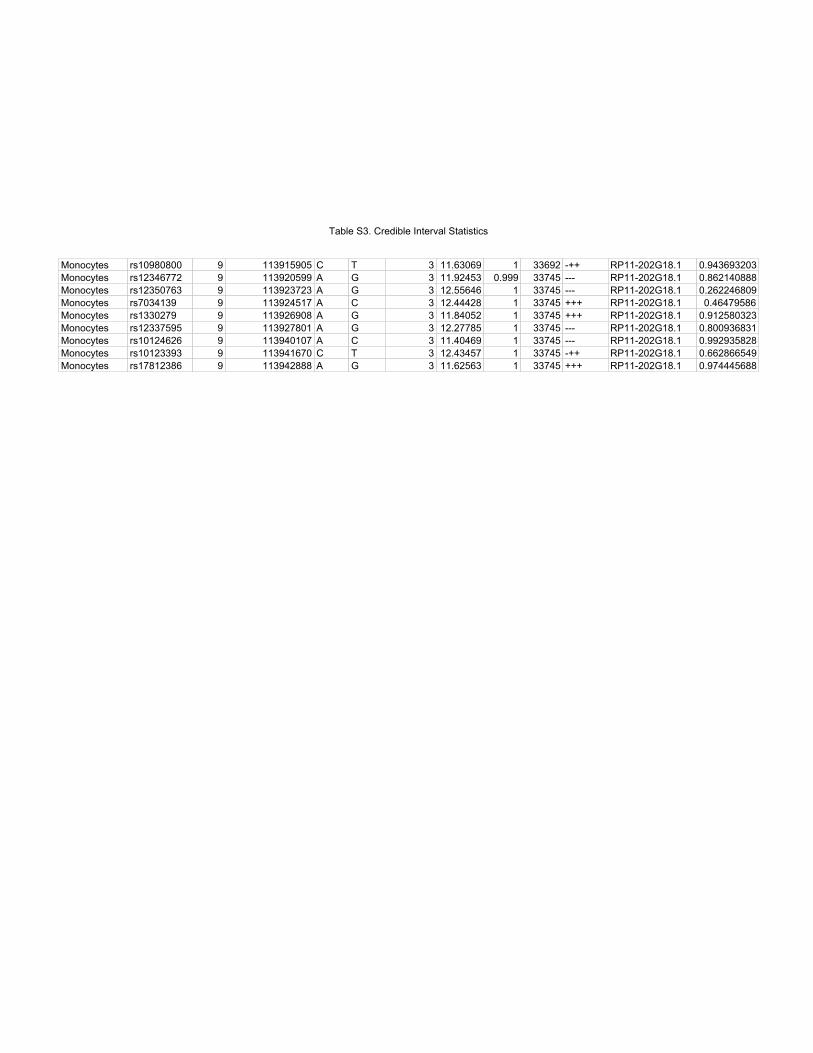
0RQRF\WHV UV�������� � ��������� & 7 � �������� � ����� ��� 53������*���� �����������0RQRF\WHV UV�������� � ��������� $ * � �������� ����� ����� ��� 53������*���� �����������0RQRF\WHV UV�������� � ��������� $ * � �������� � ����� ��� 53������*���� �����������0RQRF\WHV UV������� � ��������� $ & � �������� � ����� ��� 53������*���� ����������0RQRF\WHV UV������� � ��������� $ * � �������� � ����� ��� 53������*���� �����������0RQRF\WHV UV�������� � ��������� $ * � �������� � ����� ��� 53������*���� �����������0RQRF\WHV UV�������� � ��������� $ & � �������� � ����� ��� 53������*���� �����������0RQRF\WHV UV�������� � ��������� & 7 � �������� � ����� ��� 53������*���� �����������0RQRF\WHV UV�������� � ��������� $ * � �������� � ����� ��� 53������*���� �����������
7DEOH�6���&UHGLEOH�,QWHUYDO�6WDWLVWLFV
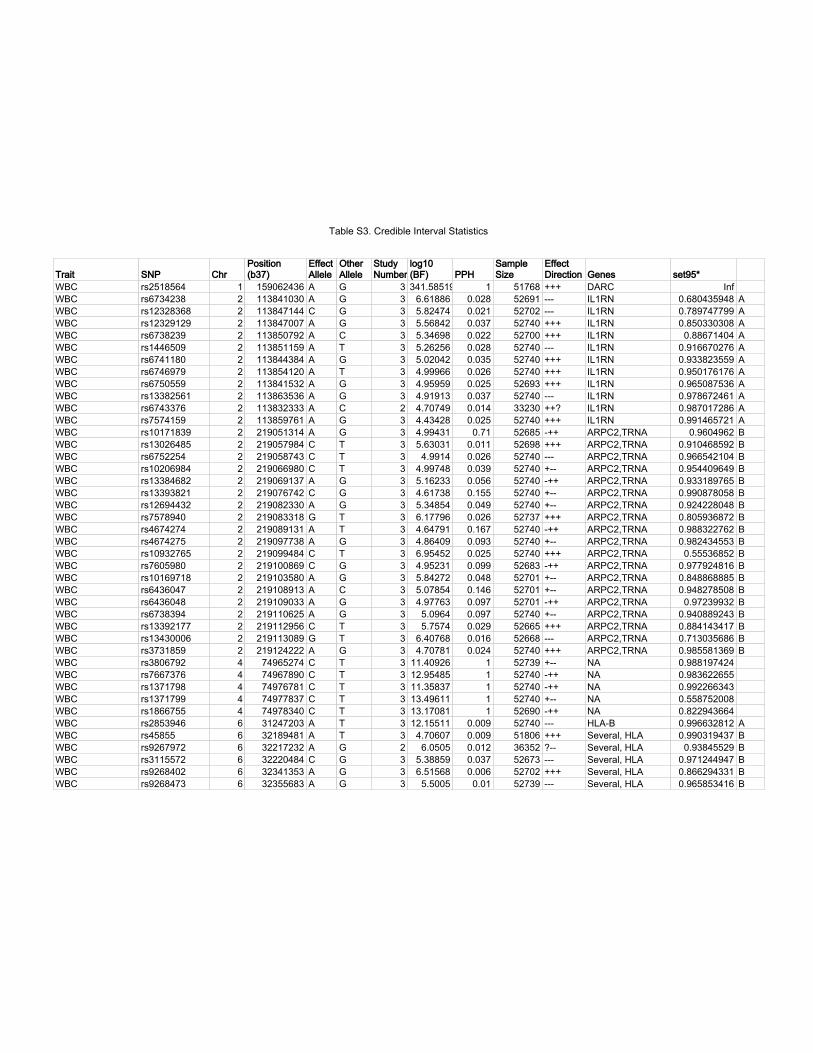
7UDLW 613 &KU3RVLWLRQ�E���
(IIHFW$OOHOH
2WKHU$OOHOH
6WXG\1XPEHU
ORJ���%)� 33+
6DPSOH6L]H
(IIHFW'LUHFWLRQ *HQHV VHW��
:%& UV������� � ��������� $ * � ��������� � ����� ��� '$5& ,QI:%& UV������� � ��������� $ * � ������� ����� ����� ��� ,/�51 ����������� $:%& UV�������� � ��������� & * � ������� ����� ����� ��� ,/�51 ����������� $:%& UV�������� � ��������� $ * � ������� ����� ����� ��� ,/�51 ����������� $:%& UV������� � ��������� $ & � ������� ����� ����� ��� ,/�51 ���������� $:%& UV������� � ��������� $ 7 � ������� ����� ����� ��� ,/�51 ����������� $:%& UV������� � ��������� $ * � ������� ����� ����� ��� ,/�51 ����������� $:%& UV������� � ��������� $ 7 � ������� ����� ����� ��� ,/�51 ����������� $:%& UV������� � ��������� $ * � ������� ����� ����� ��� ,/�51 ����������� $:%& UV�������� � ��������� $ * � ������� ����� ����� ��� ,/�51 ����������� $:%& UV������� � ��������� $ & � ������� ����� ����� ��" ,/�51 ����������� $:%& UV������� � ��������� $ * � ������� ����� ����� ��� ,/�51 ����������� $:%& UV�������� � ��������� $ * � ������� ���� ����� ��� $53&��751$ ��������� %:%& UV�������� � ��������� & 7 � ������� ����� ����� ��� $53&��751$ ����������� %:%& UV������� � ��������� & 7 � ������ ����� ����� ��� $53&��751$ ����������� %:%& UV�������� � ��������� & 7 � ������� ����� ����� ��� $53&��751$ ����������� %:%& UV�������� � ��������� $ * � ������� ����� ����� ��� $53&��751$ ����������� %:%& UV�������� � ��������� & * � ������� ����� ����� ��� $53&��751$ ����������� %:%& UV�������� � ��������� $ * � ������� ����� ����� ��� $53&��751$ ����������� %:%& UV������� � ��������� * 7 � ������� ����� ����� ��� $53&��751$ ����������� %:%& UV������� � ��������� $ 7 � ������� ����� ����� ��� $53&��751$ ����������� %:%& UV������� � ��������� $ * � ������� ����� ����� ��� $53&��751$ ����������� %:%& UV�������� � ��������� & 7 � ������� ����� ����� ��� $53&��751$ ���������� %:%& UV������� � ��������� & * � ������� ����� ����� ��� $53&��751$ ����������� %:%& UV�������� � ��������� $ * � ������� ����� ����� ��� $53&��751$ ����������� %:%& UV������� � ��������� $ & � ������� ����� ����� ��� $53&��751$ ����������� %:%& UV������� � ��������� $ * � ������� ����� ����� ��� $53&��751$ ���������� %:%& UV������� � ��������� $ * � ������ ����� ����� ��� $53&��751$ ����������� %:%& UV�������� � ��������� & 7 � ������ ����� ����� ��� $53&��751$ ����������� %:%& UV�������� � ��������� * 7 � ������� ����� ����� ��� $53&��751$ ����������� %:%& UV������� � ��������� $ * � ������� ����� ����� ��� $53&��751$ ����������� %:%& UV������� � �������� & 7 � �������� � ����� ��� 1$ �����������:%& UV������� � �������� & 7 � �������� � ����� ��� 1$ �����������:%& UV������� � �������� & 7 � �������� � ����� ��� 1$ �����������:%& UV������� � �������� & 7 � �������� � ����� ��� 1$ �����������:%& UV������� � �������� & 7 � �������� � ����� ��� 1$ �����������:%& UV������� � �������� $ 7 � �������� ����� ����� ��� +/$�% ����������� $:%& UV����� � �������� $ 7 � ������� ����� ����� ��� 6HYHUDO��+/$ ����������� %:%& UV������� � �������� $ * � ������ ����� ����� "�� 6HYHUDO��+/$ ���������� %:%& UV������� � �������� & * � ������� ����� ����� ��� 6HYHUDO��+/$ ����������� %:%& UV������� � �������� $ * � ������� ����� ����� ��� 6HYHUDO��+/$ ����������� %:%& UV������� � �������� $ * � ������ ���� ����� ��� 6HYHUDO��+/$ ����������� %
7DEOH�6���&UHGLEOH�,QWHUYDO�6WDWLVWLFV
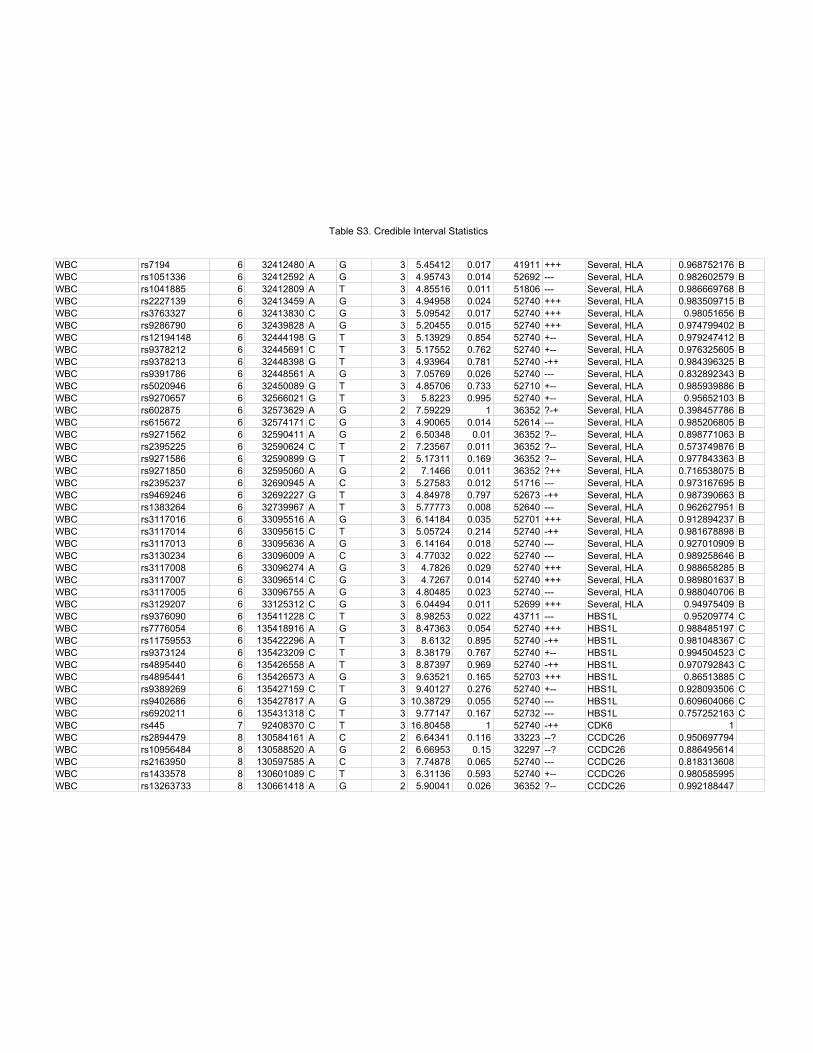
:%& UV���� � �������� $ * � ������� ����� ����� ��� 6HYHUDO��+/$ ����������� %:%& UV������� � �������� $ * � ������� ����� ����� ��� 6HYHUDO��+/$ ����������� %:%& UV������� � �������� $ 7 � ������� ����� ����� ��� 6HYHUDO��+/$ ����������� %:%& UV������� � �������� $ * � ������� ����� ����� ��� 6HYHUDO��+/$ ����������� %:%& UV������� � �������� & * � ������� ����� ����� ��� 6HYHUDO��+/$ ���������� %:%& UV������� � �������� $ * � ������� ����� ����� ��� 6HYHUDO��+/$ ����������� %:%& UV�������� � �������� * 7 � ������� ����� ����� ��� 6HYHUDO��+/$ ����������� %:%& UV������� � �������� & 7 � ������� ����� ����� ��� 6HYHUDO��+/$ ����������� %:%& UV������� � �������� * 7 � ������� ����� ����� ��� 6HYHUDO��+/$ ����������� %:%& UV������� � �������� $ * � ������� ����� ����� ��� 6HYHUDO��+/$ ����������� %:%& UV������� � �������� * 7 � ������� ����� ����� ��� 6HYHUDO��+/$ ����������� %:%& UV������� � �������� * 7 � ������ ����� ����� ��� 6HYHUDO��+/$ ���������� %:%& UV������ � �������� $ * � ������� � ����� "�� 6HYHUDO��+/$ ����������� %:%& UV������ � �������� & * � ������� ����� ����� ��� 6HYHUDO��+/$ ����������� %:%& UV������� � �������� $ * � ������� ���� ����� "�� 6HYHUDO��+/$ ����������� %:%& UV������� � �������� & 7 � ������� ����� ����� "�� 6HYHUDO��+/$ ����������� %:%& UV������� � �������� * 7 � ������� ����� ����� "�� 6HYHUDO��+/$ ����������� %:%& UV������� � �������� $ * � ������ ����� ����� "�� 6HYHUDO��+/$ ����������� %:%& UV������� � �������� $ & � ������� ����� ����� ��� 6HYHUDO��+/$ ����������� %:%& UV������� � �������� * 7 � ������� ����� ����� ��� 6HYHUDO��+/$ ����������� %:%& UV������� � �������� $ 7 � ������� ����� ����� ��� 6HYHUDO��+/$ ����������� %:%& UV������� � �������� $ * � ������� ����� ����� ��� 6HYHUDO��+/$ ����������� %:%& UV������� � �������� & 7 � ������� ����� ����� ��� 6HYHUDO��+/$ ����������� %:%& UV������� � �������� $ * � ������� ����� ����� ��� 6HYHUDO��+/$ ����������� %:%& UV������� � �������� $ & � ������� ����� ����� ��� 6HYHUDO��+/$ ����������� %:%& UV������� � �������� $ * � ������ ����� ����� ��� 6HYHUDO��+/$ ����������� %:%& UV������� � �������� & * � ������ ����� ����� ��� 6HYHUDO��+/$ ����������� %:%& UV������� � �������� $ * � ������� ����� ����� ��� 6HYHUDO��+/$ ����������� %:%& UV������� � �������� & * � ������� ����� ����� ��� 6HYHUDO��+/$ ���������� %:%& UV������� � ��������� & 7 � ������� ����� ����� ��� +%6�/ ���������� &:%& UV������� � ��������� $ * � ������� ����� ����� ��� +%6�/ ����������� &:%& UV�������� � ��������� $ 7 � ������ ����� ����� ��� +%6�/ ����������� &:%& UV������� � ��������� & 7 � ������� ����� ����� ��� +%6�/ ����������� &:%& UV������� � ��������� $ 7 � ������� ����� ����� ��� +%6�/ ����������� &:%& UV������� � ��������� $ * � ������� ����� ����� ��� +%6�/ ���������� &:%& UV������� � ��������� & 7 � ������� ����� ����� ��� +%6�/ ����������� &:%& UV������� � ��������� $ * � �������� ����� ����� ��� +%6�/ ����������� &:%& UV������� � ��������� & 7 � ������� ����� ����� ��� +%6�/ ����������� &:%& UV��� � �������� & 7 � �������� � ����� ��� &'.� �:%& UV������� � ��������� $ & � ������� ����� ����� ��" &&'&�� �����������:%& UV�������� � ��������� $ * � ������� ���� ����� ��" &&'&�� �����������:%& UV������� � ��������� $ & � ������� ����� ����� ��� &&'&�� �����������:%& UV������� � ��������� & 7 � ������� ����� ����� ��� &&'&�� �����������:%& UV�������� � ��������� $ * � ������� ����� ����� "�� &&'&�� �����������
7DEOH�6���&UHGLEOH�,QWHUYDO�6WDWLVWLFV
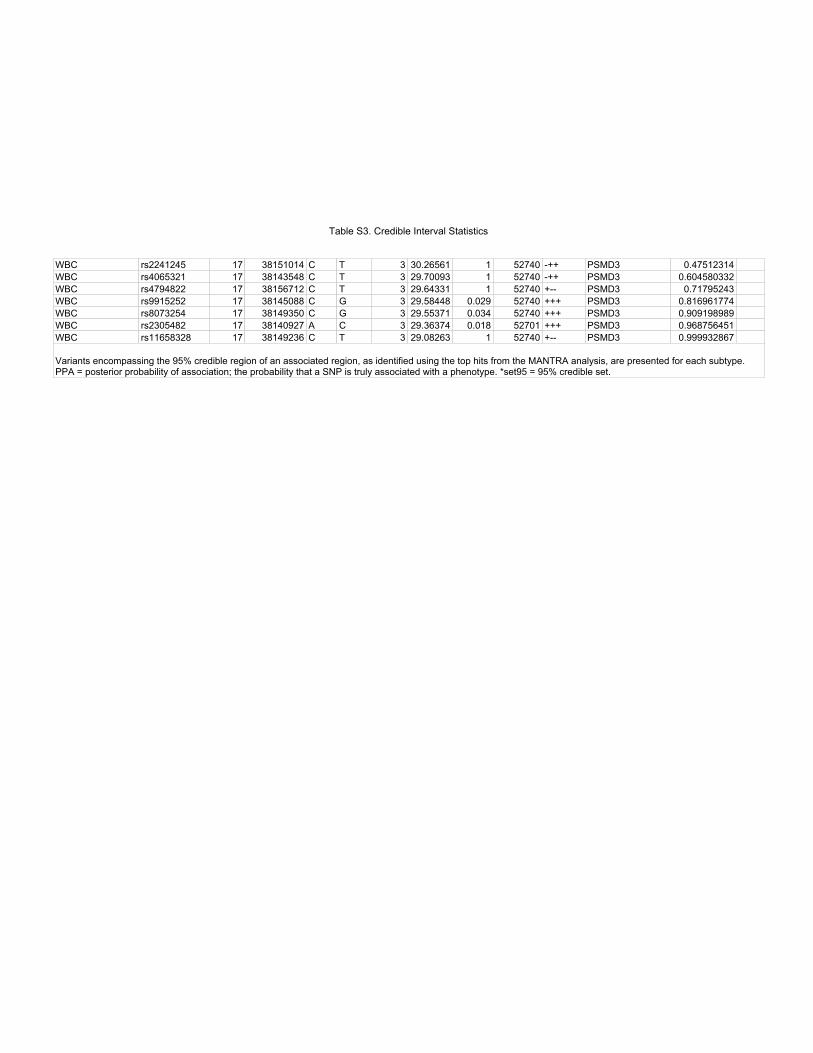
:%& UV������� �� �������� & 7 � �������� � ����� ��� 360'� ����������:%& UV������� �� �������� & 7 � �������� � ����� ��� 360'� �����������:%& UV������� �� �������� & 7 � �������� � ����� ��� 360'� ����������:%& UV������� �� �������� & * � �������� ����� ����� ��� 360'� �����������:%& UV������� �� �������� & * � �������� ����� ����� ��� 360'� �����������:%& UV������� �� �������� $ & � �������� ����� ����� ��� 360'� �����������:%& UV�������� �� �������� & 7 � �������� � ����� ��� 360'� �����������
9DULDQWV�HQFRPSDVVLQJ�WKH�����FUHGLEOH�UHJLRQ�RI�DQ�DVVRFLDWHG�UHJLRQ��DV�LGHQWLILHG�XVLQJ�WKH�WRS�KLWV�IURP�WKH�0$175$�DQDO\VLV��DUH�SUHVHQWHG�IRU�HDFK�VXEW\SH�33$� �SRVWHULRU�SUREDELOLW\�RI�DVVRFLDWLRQ��WKH�SUREDELOLW\�WKDW�D�613�LV�WUXO\�DVVRFLDWHG�ZLWK�D�SKHQRW\SH�� VHW��� �����FUHGLEOH�VHW�
7DEOH�6���&UHGLEOH�,QWHUYDO�6WDWLVWLFV
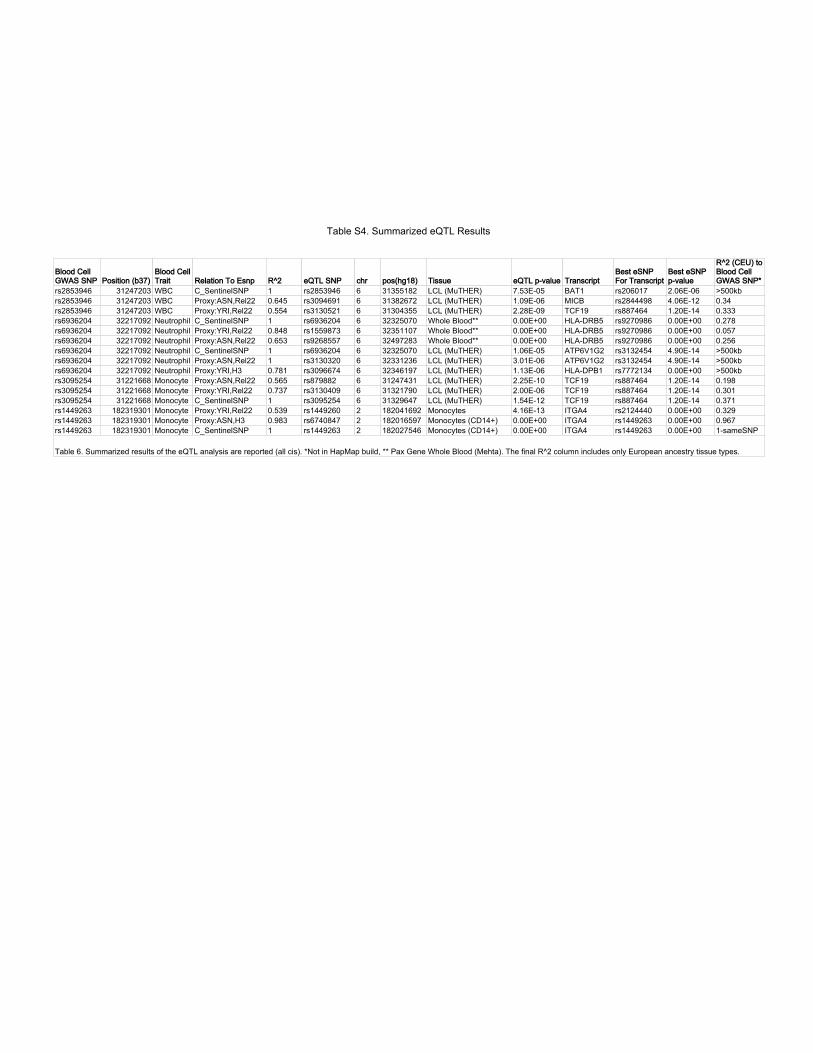
%ORRG�&HOO*:$6�613 3RVLWLRQ��E���
%ORRG�&HOO7UDLW 5HODWLRQ�7R�(VQS 5A� H47/�613 FKU SRV�KJ��� 7LVVXH H47/�S�YDOXH 7UDQVFULSW
%HVW�H613)RU�7UDQVFULSW
%HVW�H613S�YDOXH
5A���&(8��WR%ORRG�&HOO*:$6�613
UV������� �������� :%& &B6HQWLQHO613 � UV������� � �������� /&/��0X7+(5� ����(��� %$7� UV������ ����(��� !���NEUV������� �������� :%& 3UR[\�$61�5HO�� ����� UV������� � �������� /&/��0X7+(5� ����(��� 0,&% UV������� ����(��� ����UV������� �������� :%& 3UR[\�<5,�5HO�� ����� UV������� � �������� /&/��0X7+(5� ����(��� 7&)�� UV������ ����(��� �����UV������� �������� 1HXWURSKLO &B6HQWLQHO613 � UV������� � �������� :KROH�%ORRG ����(��� +/$�'5%� UV������� ����(��� �����UV������� �������� 1HXWURSKLO 3UR[\�<5,�5HO�� ����� UV������� � �������� :KROH�%ORRG ����(��� +/$�'5%� UV������� ����(��� �����UV������� �������� 1HXWURSKLO 3UR[\�$61�5HO�� ����� UV������� � �������� :KROH�%ORRG ����(��� +/$�'5%� UV������� ����(��� �����UV������� �������� 1HXWURSKLO &B6HQWLQHO613 � UV������� � �������� /&/��0X7+(5� ����(��� $73�9�*� UV������� ����(��� !���NEUV������� �������� 1HXWURSKLO 3UR[\�$61�5HO�� � UV������� � �������� /&/��0X7+(5� ����(��� $73�9�*� UV������� ����(��� !���NEUV������� �������� 1HXWURSKLO 3UR[\�<5,�+� ����� UV������� � �������� /&/��0X7+(5� ����(��� +/$�'3%� UV������� ����(��� !���NEUV������� �������� 0RQRF\WH 3UR[\�$61�5HO�� ����� UV������ � �������� /&/��0X7+(5� ����(��� 7&)�� UV������ ����(��� �����UV������� �������� 0RQRF\WH 3UR[\�<5,�5HO�� ����� UV������� � �������� /&/��0X7+(5� ����(��� 7&)�� UV������ ����(��� �����UV������� �������� 0RQRF\WH &B6HQWLQHO613 � UV������� � �������� /&/��0X7+(5� ����(��� 7&)�� UV������ ����(��� �����UV������� ��������� 0RQRF\WH 3UR[\�<5,�5HO�� ����� UV������� � ��������� 0RQRF\WHV ����(��� ,7*$� UV������� ����(��� �����UV������� ��������� 0RQRF\WH 3UR[\�$61�+� ����� UV������� � ��������� 0RQRF\WHV��&'���� ����(��� ,7*$� UV������� ����(��� �����UV������� ��������� 0RQRF\WH &B6HQWLQHO613 � UV������� � ��������� 0RQRF\WHV��&'���� ����(��� ,7*$� UV������� ����(��� ��VDPH613
7DEOH����6XPPDUL]HG�UHVXOWV�RI�WKH�H47/�DQDO\VLV�DUH�UHSRUWHG��DOO�FLV��� 1RW�LQ�+DS0DS�EXLOG�� �3D[�*HQH�:KROH�%ORRG��0HKWD���7KH�ILQDO�5A��FROXPQ�LQFOXGHV�RQO\�(XURSHDQ�DQFHVWU\�WLVVXH�W\SHV�
7DEOH�6���6XPPDUL]HG�H47/�5HVXOWV