
1 10 Years since the Merger: A Trajectory of Challenge and ...
International Journal of Social Science Studies
Vol. 6, No. 8; August 2018
ISSN 2324-8033 E-ISSN 2324-8041
Published by Redfame Publishing
URL: http://ijsss.redfame.com
54
Trajectory of Manufacturing Industry in India since Post Reform Period
Sneha Sharad Pawar1
1Assistant Professor, Nagindas Khandwala College, Road No. 1, Bhavishya Bharat Campus, Bhadran Nagar, Off S V
Road, Malad (W), Mumbai-400064, India
Correspondence: Sneha Sharad Pawar, Assistant Professor, Nagindas Khandwala College, Road No. 1, Bhavishya
Bharat Campus, Bhadran Nagar, Off S V Road, Malad (W), Mumbai-400064, India.
Received: June 8, 2018 Accepted: July 2, 2018 Available online: July 30, 2018
doi:10.11114/ijsss.v6i8.3344 URL: https://doi.org/10.11114/ijsss.v6i8.3344
Abstract
Manufacturing has been an engine of growth in India in the seventies and eighties. After the 1991 reforms the engine
appears to be slowing. This paper attempts to examine the reality behind the increased productivity by applying methods
that measure productivity per factor and returns to scale. The analysis reveals that manufacturing output growth in post
reform period is ‘input-driven’ rather than efficiency driven.
The growth in manufacturing sector is dependent on the investment climate. The structural reforms since 1990s have
made some progress. Despite recent setbacks, it is universally acknowledged that the reforms process in India cannot be
reversed and sooner or later these reforms will be implemented. However, the long term competitive ability of Indian
firms would depend on production efficiency. Production efficiency, in turn, is dependent on ability to develop, import
and adapt new technologies among other factors. Hence, for achieving the efficiency the theories have been critically
examined from Indian scenario and some measures have suggested in this paper.
Keywords: productivity, efficiency, technology, manufacturing industries, India
JEL CODE: C10, C87, D24, D33
1. Introduction
The manufacturing is an export driver and it creates employment and business opportunities. Its continued growth is an
absolute necessary for forward movement in economic development. The experience of many countries is testimony to
this fact. The Japanese manufacturing sector grew by leaps and bounds in 1970’s and 1980’s. South Korea and China
repeated the same story in 1980’s and 1990’s respectively. The export share of manufacturing sector of the USA is largest
in the world. China is also making its feet strong in the soil of manufacturing sector because of low per unit cost.
The contribution of manufacturing industry towards GDP in India is stagnant at 15 per cent for over two decades. The
target under make in India is to 10 crore new jobs by 2020. This can be achieved only by taking the manufacturing sector’s
growth to 25 per cent of the country’s GDP. It poses a big challenge for the government. Again, nearly 80 per cent of
manufacturing employment and 17 per cent of total manufacturing output in India is in the informal sector. All these
factors states that why manufacturing should be given much importance for its development which is lacking far behind as
compared to service sector industry. The literature always found contradiction on the argument of economic development
that production first shift from agriculture into manufacturing and only at a later stage of development -from
manufacturing into services. This hypothesis appears consistent with cross country evidence. But with the evidence from
India, the service sector has grown much faster than the manufacturing sector. But, is it really possible? still a mystery to
be resolved.
Many sub-sectors of manufacturing industry are dependent on agriculture and in turn manufacturing give further scope of
expansion for service sector. Each sector should be expanded to the extent a country is capable of. The Indian
demographic dividend is so well diversified if once given shape to can be utilizes for all three sectors of the economy. The
Fei-Ranis theory (1961) truly states that surplus labour if properly utilized can give large value addition to the economy.
India is blessed with all three sectors’ potential contribution towards economy.
The policy makers realized immediate after independence that any country to be self dependent requires its manufacturing
base to be strong. So that’s the reason why they given much importance to basic and capital goods industries. Some
failures were also met with the policy estimation but the initiative was worth taking. This was the time industries were

International Journal of Social Science Studies Vol. 6, No. 8; 2018
55
running under license raj. But in the post reform period many changes occurred that led to increased manufacturing
production and other opportunities in which manufacturing could be given scope to grow. The industries like automobiles,
engineering goods, petrochemicals and chemicals, textile, etc. have emerged as major export producing industries in
recent period. The trajectory of manufacturing industry during post reform period gives a picture of slow growth during
the initial periods of reforms followed by pick up and later shows stagnant contribution towards GDP around 16 per cent.
The reasons were many. Low FDI and that too invested for mergers and acquisitions. It is necessary to not just opened up
and attract the FDI inflows but to attract it towards expansion and diversification plan. Other reason was low productivity.
In initial years of reforms productivity increased steeply but in later period it remained quite stagnant. Low productivity
was the main cause of less skilled labour. Some industries which emerged as exporting industries largely became capital
intensive. As a consequence, TFP increased and gained advantage of low cost per unit. But in many other industries such
as textile industry displayed stagnant growth in later years of reform period. The government expenditure on
manufacturing sector was also low as a result of which the potentiality remained unearthed. India was ranked low in terms
of doing business though the ranking has improved in recent year.
The situation is on the verge of improvement now as many positive reforms by the government have been introduced. This
has created an atmosphere for growth and development of manufacturing industry. But, now it is to see how these factors
turn out to be beneficial for the economy.
2. Problem Statement
Though many researchers have traditionally and even in more advance way indulged in evaluating the Indian
manufacturing industries, the concept of measuring productivity and efficiency are different. Schumpeter (1934, 1942),
Hopenhayn (1992) states that how the productivity increases with new entrants in the market, However this has not
proved in case of India. Achieving higher growth rate by skipping development of manufacturing industries is possible for
short period but in the long run the growth get affected. It is also important to review manufacturing industry with the time
lag.
3. Review of Literature
The study of Bulent Unel (2003) states the pre and post reform period shows remarkable difference in factor productivity
in manufacturing sector. The comparisons indicate that the labour productivity and factor productivity increased by 24 per
cent and 46 per cent respectively. The study on productivity trend in India’s manufacturing sector shows that the sector
has improved after the post liberalization period but it has also shown sectoral differences in productivity which vary
considerably. Sean M. Doughterty, Richard Herd, Thomas Chalaux (2009), has added to the existing evidence on the
productivity of Indian firms. They argued that production shifts first from agricultural to manufacturing and only at a later
stage of development from manufacturing into services. The paper also highlights on the issue of institutional breakdown.
Goldar B., Aggarwal S, Das D, Erumban A, Das P(2016) a comparative analysis of growth in total factor productivity
(TFP) in the formal and informal segments of Indian manufacturing industries is undertaken. Comparison of level of TFP
between formal and informal segments of Indian manufacturing revealed that the informal manufacturing enterprises are
relatively less efficient. The study also states that enterprises with small size of employment tend to have lower TFP as
compared to large firms. The study of the Manpreet kaur and Ravi Kiran (2008) shows a comparative picture of pre
liberalisation and liberalisation period depict a slower growth of manufacturing sector of India in the post reform era for
aggregative as well as for disaggregative i.e. sectoral level. .P. Bhat (2014) emphasized on the backwardness of
manufacturing sector in terms of less progressive technology, skill development, education, innovations etc. The
Economic survey of India 2015-16 places emphasis on Indian manufacturing to a key policy objective of the new
government, identifying this sector as the engine of long-run growth. It brought back the early development thinking,
exemplified most famously in the two-sector model of Lewis (1954) was fixated on the idea of sectoral transformation:
moving resources from the agricultural/traditional sector to the manufacturing/ non-traditional sector. According to the
study there are two gains to shifting resources from the traditional to the new sectors: first, a compositional gain, which is
a gain in economy-wide productivity achieved by shifting the weight of the economy from low to high productivity
sectors; second, a subsequent dynamic gain as these resources experience rapid productivity growth. The economic
survey has advocated this phenomenon more explicitly. Pulapre Balakrishnan and M. Suresh Babu (2003) discussed
“Growth and Distribution in Indian Industry in the nineties”. In the study of the evolution of the Indian manufacturing
sector over close to three decades, the annual average rate of growth in the nineties is found to have risen almost across the
board at the two-digit level of industry. Nevertheless, the acceleration is not particularly impressive for what is often
hailed as the most significant policy-regime shift since 1950. There is a hefty rise in investment, however, though without
a corresponding increase in its efficiency.
K.S. Chalapati Rao, Biswajit Dhar, K.V.K. Ranganathan Rahul N. Choudhury and Vipin Negi, the foreign investment
study team (2014), focused on the direction of FDI inflows in manufacturing sector in India. Highlighting that Efficiency

International Journal of Social Science Studies Vol. 6, No. 8; 2018
56
and productivity in manufacturing sector matters the most for increasing employment, quality of product, demand for
product, and its value in world market. Instead of focusing on FDI, the policy makers need to address the problems faced
by the domestic enterprises.
According to Schumpeter (1934, 1942), innovative entry by entrepreneurs is the force that drives industry’s evolution and
sustains economic growth, even as it destroys the value of established companies that have enjoyed some degree of
monopoly power derived from previous technological, organizational, regulatory, and economic paradigms. The
implication is that the productivity growth of an industry is enhanced by the entry of new firms. In his seminal work,
Jovanovic (1982) departs from this line of thinking and suggests an alternative approach. He postulates that
heterogeneous firms enter the industry without knowing what their true productivity is. Once they enter the market, they
learn about the distribution of their own profitability, based on noisy information from realized profits. By continually
updating such learning, the firm decides to expand, contract, or to exit. Hopenhayn (1992) developed a model to capture
these market dynamics in long rum equilibrium of an industry composed of a large number of price-taking firms
producing a homogeneous output. His model predicts that surviving members of the entering firms have a higher
productivity than those members that exit. Thus only high productivity entering firms remain in the industry whereas the
less productive ones exit. Another important prediction of the model is that the productivity of any member of continuing
firms at time t is greater than that of the member of entering firms. This is because as the continuing firms age, more
selection takes place and surviving members concentrate a higher proportion of high productivity units. In both these
models, establishments are basically passive, acting in response to market signals. Pakes and Ericson (1989) investigate
how outcomes from a Jovanovic-style model of ‘passive learning’ would differ from results generated by a model
allowing for ‘active exploration’ of investment/innovation opportunities. They find that both types of models generate
similar results. Success is not guaranteed by investment in active learning. They conclude that new firms are either
passive learners or active explorers. If they survive they grow and enter in larger classes. One of the main theoretical
implications of these models is that new entrants will, on an average, have lower productivity and a higher probability of
exit than the incumbents. They survive if their productivity is higher than those who exit and if they survive their
productivity grows further through the selection process. The entry effects are therefore likely to be small.
Aghion et al. (2009) show that entry effects depend on the technological advancement of incumbent firms. While building
on Aghion et al. (2001) they assume that the potential entrant enters with a leading-edge technology. If the incumbent is
close to the technology frontier, it will innovate more to escape and survive entry. This is more likely to happen in
technologically laggard industries. But, if the incumbent is farther from the frontier, he cannot compete with the entrant
and will have to exit. Thus, in technological advanced industries where the incumbent firms cannot survive entry by more
productive firms and exit, entry will have only direct effects but in technologically laggard industries entry will induce
indirect effects. Thus, entry effects may be relatively smaller in laggard industries as compared with technologically
advanced countries.
4. Research Methodology
Based on the extensive literature survey and applying the relevant analysis to current data and the past data, this study
aims to analyse the behaviour of manufacturing industry since the reform period 1991 till the year 2015. It focuses on
different factors which are responsible for low productivity and stagnation in manufacturing Industry. Low productivity is
explained in terms of output per capital, output per labour and capital per labour. This elaborately gives detail regarding
the condition of manufacturing industry of India. And also explains how reforms in 1991 have remained unsustainable for
its growth in productivity and efficiency. The research has placed more emphasis on technology. How the Indian
manufacturing industries have lack behind due to age old use of technology.
The study involves the use of both qualitative and quantitative research methodology to understand containment in the
process of manufacturing industry. The research was undertaken in three phases: First, existing literature was reviewed to
investigate whether any similar studies have been conducted before and to determine the nature of views and thoughts
advocated. Second: it combines all the elements of different research to generally state the reasons behind stagnation in
the manufacturing sector and critically examine the new theory that the economic growth can be achieved through service
sector surpassing manufacturing industry, and the theory that new entrants are important agents of change. Third: it opens
up further scope of study in determining how to increase contribution towards GDP.
In the second phase productivity in terms of output per capita, output per labour and capital per labour is provided that
explain how increase in production has been possible over the years. In this phase it also states where India stands in terms
of productivity while comparing with the productivity of other countries. The variables used in the methodology are value
of output, capital invested and wages employed. With the use of Cobb-Douglas production function, returns to scale for
the period from 1991-2000 to 2000-01, 2001-02 to 2009-10 and 2010-11 to 2014-15 is explained. In the third phase, brief
details regarding government initiatives in the recent time have been explained with its likely impact on industries in

International Journal of Social Science Studies Vol. 6, No. 8; 2018
57
future period which gives further scope of studies in the trajectory of manufacturing industries. Further, recommendations
are also given that can be beneficial for the industry.
The main focus of the study is to put forward the real image of the industry in terms of efficiency gained over time since
the post-reform period.
5. Environment for Industrial Development pre and post 1991
After independence, India embarked on a strategy of state-led industrialization based on import substitution. An elaborate
set of controls were devised to direct the process of industrialization to suit the path of development envisaged in the
various 5-year Plans. The main instrument of industrial controls was the industrial licensing policy, 1951 which regulated
entry, exit and expansion of industrial units rather tightly. Private sector participation was excluded from a number of
sectors by reserving them only for the public sector companies. Maneuverability of private firms was regulated even in
those sectors where their entry was allowed. They needed a license to open a new factory, change location, produce a new
product or expand capacity by more than a specified margin. Such licenses were given in accordance with the
macro-economic plan targets. Over the years, the government added more tools to this basic instrument of industrial
policy, further tightening the entry and movement of industrial units. In 1973, the FERA act was enforced, which
restricted the entry of foreign companies only to high-tech core sectors and required them to reduce their share in equity
capital to below 40% in other sectors. Apart from this restrictions on foreign technology imports and high tariff and
non-tariff barriers on imports were levied. All efforts to start new businesses and /or expand the existing ones by both,
foreign and domestic entrepreneurs were restricted.
While entry was tightly regulated, exit was discouraged at any cost. Closure of an industrial unit was considered to be a
social loss due to loss of employment and, hence, this outcome was avoided wherever possible. In order to facilitate
operation of the sick industrial units, government owned banks and financial institutions were directed to provide them
credit at subsidized interest rates. In 1971, through an amendment in the Licensing Act, the central government was
empowered to take over industrial undertaking with special emphasis to sick units. In 1977, a merger policy was
announced which offered fiscal incentives to healthy industrial units to merge sick units with them. Several concessions
were also announced by the RBI from time to time to encourage banks to bail these units out.
The first tentative moves towards deregulation were made during the early 1980s, but the pace of deregulation accelerated
with the unveiling of the “new economic policies” in 1985. A series of piecemeal reforms were introduced with the
objective of improving productivity in existing units.
The process of reforms was accelerated in 1991 and marked a departure from the earlier development strategy. These
reforms laid a strong emphasis on enabling markets and globalization. Licensing was abolished for all industries except
those that were related to defence or were potentially environment-damaging. The number of industries reserved for the
public sector was cut down from 17 to 3. Both FERA and MRTP acts were repealed. By the end of the 1990s, most
manufacturing units were allowed 100 per cent FDI under automatic approval. Procedures for the procurement of
technology from abroad were also simplified. Until the end of the eighties, prices of most infrastructure and basic
intermediates were controlled by the government on a cost-plus basis, under the aegis of the administered price regime
(APR). In the nineties, the APR was also abandoned. Further, trade barriers were considerably relaxed and non-tariff
barriers were completely removed, intensifying import competition in the economy.
Since 1991, India has been initiating comprehensive reforms in pursuit of higher growth and development. The
wide-ranging reforms have included a major shift from a policy of inward looking industrialization towards outward
orientation in order to generate higher export growth and achieve higher rates of gross domestic product (GDP) and
development. The composition of the overall output of the Indian economy, in the period of 1993-94 to 2001-02, points to
the relatively large share of the non-agricultural sectors. Among the non-agricultural sectors, manufacturing accounts for
23 per cent; electricity, water supply and gas, mining and construction sub-sectors account for 9 per cent, and service
sector, comprising all other sub-sectors, accounts for the remaining 43 per cent. With GVA of Rs. 39.90 lakh crore,
manufacturing sector contributes 16.57% in 2016-17 which shows the Industry sector has travelled at slow rate since
reform period.
The large size of the population and the base for industrialization that was set up in the 1950s and 1960s enabled growth of
manufacturing in India in the subsequent two decades. However, the performance of the manufacturing sector in recent
times, particularly in the post 1991-reform period has been controversial and has attracted the attention of several
researchers. The sustained growth of this sector has now been threatened primarily by the lack of competitiveness of the
sector in a period where trade liberalization policies have been implemented. In fact, UNIDO report of 2002 provides
evidence for the stagnation of India’s competitiveness, while showing that China has sharply improved its global ranking
in the industrial sector’s competitiveness. One of the major determinants of international competitiveness of a country is
its productivity in comparison with that of its competing countries and trading partners. However, what is of foremost

International Journal of Social Science Studies Vol. 6, No. 8; 2018
58
importance for a country to improve its productivity is to operate on the production frontier by achieving the maximum
possible output from its chosen set of inputs and technology. Thus, it becomes imperative to examine the status of
manufacturing productivity in India in the post-reform period.
The average growth rate of manufacturing in the 1990s has been lower than in the 1980s. Nevertheless, the study by
Tendulkar (2003) and Goldar (2002) have argued that the 1991 trade reforms seem to have contributed to acceleration in
employment growth in organised manufacturing in the post-reform period, mainly due to better access to inputs including
capital through foreign direct investment and to the growth in export-oriented industries, which are more labour-intensive.
Thus, combining the larger employment with a lower growth in manufacturing between 1995-96 and 1999-2000 than in
eighties, one may infer that the manufacturing output growth has been input-driven from the mid-90s. A National
Manufacturing Survey conducted by Chandra and Sastry (2002) at the Indian Institute of Management in Ahmedabad
shows that material cost comprises about 65 per cent of the total production cost, direct labour accounts for about 9 per
cent and other costs including overheads account for the remaining 26 per cent between 1997 and 2001. The survey
clearly indicates that efforts to improve the competitiveness of the manufacturing sector need to be targeted on reduction
in material costs as well as overheads.
In other words, manufacturing firms in India appear to be operating inside their production frontier.
6. The Manufacturing Sector Has Contributed Little to Income, Export and Employment Growth
Production has been shifting away from agriculture, but mostly into services rather than manufacturing. Despite important
product market reforms in the early 1990s, such as trade liberalisation and abolition of industrial licensing, the share of
manufacturing in GDP has remained stagnant over the past decades. Economic growth in the last 15 years was led by
services, leaving manufacturing sector behind.
The manufacturing sector grew by 8.9% in 2004-05, comfortably outperforming the sector’s long term average growth
rate of 7%. The sector has remained one of the engines of economic growth since the start of 2005-06. Industrial growth
averaged 7.1% per annum in the 1980s. It accelerated slightly to 7.6% per year in the first five years following the
beginning of the economic policy reform process in 1991. In the second half of the 1990s industrial growth trended lower
at around 5% per annum. However, since 2002-03 industrial growth has accelerated markedly on the back of recent strong
GDP growth. This trajectory of manufacturing industry has elaborately explained in this research with the help of
Cobb-Douglas Production Function.
7. Efficiency and Growth in Manufacturing Industry
Technology development is critical to a country's efforts in improving productivity, efficiency and competitiveness of its
industrial sector. Factor cost advantages are being replaced by technology related factors such as zero-defect product
quality and international certification of firms' quality assurance systems (e.g., ISO 9000) in determining international
competitiveness. Central to maintaining competitiveness is the ability of producers to respond quickly and effectively to
the changing demands of the international market.
Technological capabilities can be best described in terms of three levels: the basic level involves the ability to operate and
maintain a new production plant based on imported technology, the intermediate level consists of the ability to duplicate
and adapt the design for an imported plant and technique elsewhere in the country or abroad, while an advanced level
involves a capability to undertake new designs and to develop new production systems and components.
Indian firms present a full spectrum of technological capabilities - while there are few firms close to the international
frontier in terms of product design capability and process technology, technological capabilities of most players are
extremely limited due to growing technological obsolescence, inferior quality, limited range and high costs. This
adversely affects the ability of the organizations to respond to the challenges, not only of increasing international
competition from other low-wage countries like China, but also from trade liberalization within the context of WTO.
Most Indian manufacturing firms appear to be stuck at the basic or intermediate level of technological capabilities.
Though Indian manufacturing industry has mastered standard techniques it has remained dependent for highly expensive
and complicated technologies. As a result of which productivity level has remained almost constant if it is measured in
terms of efficiency, even though it shows increased productivity in its trend. Total employment outside of agriculture rose
by about 51 million between 2004-05 and 2011-12, but only 6 million jobs were created in the manufacturing sector.
Moreover, most of them were informal labour.
International Journal of Social Science Studies Vol. 6, No. 8; 2018
59
Table 1. Sectoral Technology Capabilities
Sector Technology capability level Food Processing Basic Metal forming and forging Basic Steel Intermediate Machine Tools Basic Pharmaceuticals Intermediate Chemicals Basic Electrical and Electronics Basic Automotive Intermediate Auto Components Advance IT Advance Telecommunication Advance Petrochemicals Intermediate Light Engineering Basic
The structural transformation of the Indian economy over the last three decades has been presenting spectacular growth of
the services sector, which now accounts for about 52 per cent of the GDP. However, the rapid growth of the services sector
much before the manufacturing industry attaining maturity is not a healthy sign. A knowledge-based economy cannot be
sustained in the long run unless it is adequately supported by a growing manufacturing economy. Moreover, a service
economy cannot continue to thrive on a long-term basis in a country where the working population is increasing,
especially in a labour intensive country. Hence, to have more forward and backward linkages with agriculture and service
sector, the manufacturing sector should be given more attention.
Some sectors, such as IT, ITES and pharmaceuticals, will compete globally, employing perhaps 2% of the population and
bringing wealth to many parts of India. At the same time, around 50% of the population will remain dependent on the
agricultural sector, sharing less than one-quarter of India’s GDP. Without reform, agriculture will continue to suffer from
endemic underemployment, low wages and monsoon dependency. This will result in continued urban migration, but
without the development of an industrial sector this will lead to rising unemployment in the cities. This pattern is
unsustainable is growing.
It is estimated that India needs to create 7-8 million new jobs each year outside agriculture to stay at its current
unemployment level of 7 percent. Manufacturing jobs are ideal for workers transitioning out of agriculture as service jobs
require high level of education and professionalism. The revival of manufacturing sector can create close to 2.5 Million
new jobs every year.
With the removal of all quantitative restrictions on imports and the falling import tariffs under the WTO regime, it is all
the more important for the Indian industry to improve its competitive edge. The sheer volume of international trade with
over 70 per cent of the seven trillion dollar market being in processed manufacturing, strongly indicates the necessity of
developing global competitiveness in this sector.
Thus, growth of manufacturing industry in India is critical to ensure healthy balance of income parity, employment
generation and sustenance of growth. But, India’s productivity growth of manufacturing industry does not show
technology driven. It is mainly because of increased use of inputs. Productivity, as everyone knows, is the ability to
transform inputs into output. To allow measurement, this ability is often dressed as a ratio of output to inputs. In this
fashion productivity seems so transparent that its deeper meaning is easily lost sight of. However, a sense of mystery
unfolds when one wonders how the value of this ratio may be greater than one. Stating that the ratio is greater than one is
equivalent to stating that inputs fall short of “explaining” output. A positive growth rate of the ratio means that the
increment of output is more “generous” than would be expected from the mere increment of inputs.
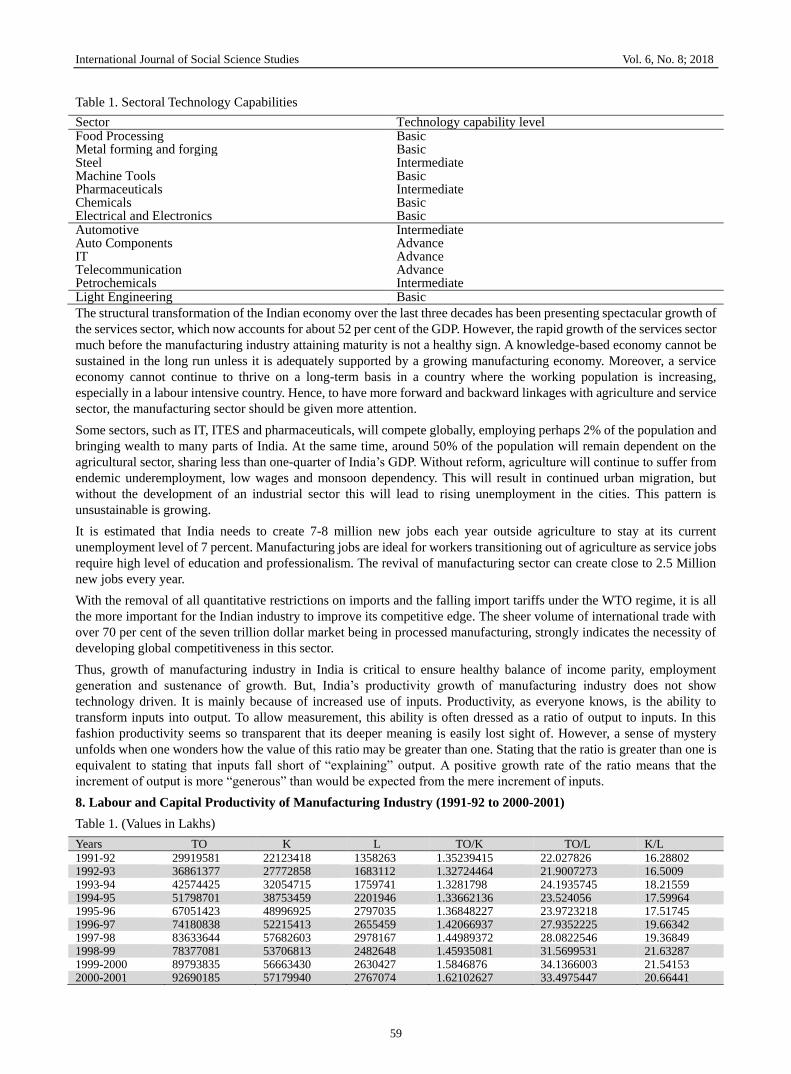
8. Labour and Capital Productivity of Manufacturing Industry (1991-92 to 2000-2001)
Table 1. (Values in Lakhs)
Years TO K L TO/K TO/L K/L
1991-92 29919581 22123418 1358263 1.35239415 22.027826 16.28802 1992-93 36861377 27772858 1683112 1.32724464 21.9007273 16.5009 1993-94 42574425 32054715 1759741 1.3281798 24.1935745 18.21559 1994-95 51798701 38753459 2201946 1.33662136 23.524056 17.59964 1995-96 67051423 48996925 2797035 1.36848227 23.9723218 17.51745 1996-97 74180838 52215413 2655459 1.42066937 27.9352225 19.66342 1997-98 83633644 57682603 2978167 1.44989372 28.0822546 19.36849 1998-99 78377081 53706813 2482648 1.45935081 31.5699531 21.63287 1999-2000 89793835 56663430 2630427 1.5846876 34.1366003 21.54153 2000-2001 92690185 57179940 2767074 1.62102627 33.4975447 20.66441

International Journal of Social Science Studies Vol. 6, No. 8; 2018
60
Source: Annual Survey of Industries 2014-2015
Table 2. Labour and Capital Productivity of Manufacturing Industry (2001-02 to 2009-2010)
Years TO K L TO/K TO/L K/L
2001-2002 96245663 60591285 2743824 1.588441 35.0772 22.0828 2002-2003 113056111 63747308 2968905 1.773504 38.08007 21.4717 2003-04 128740055 67959786 3047777 1.894356 42.24064 22.2982 2004-05 167256142 75941770 3363505 2.202426 49.72674 22.5782 2005-06 190835548 90157861 3766366 2.116682 50.66835 23.9376 2006-07 240854764 107150382 4429135 2.24782 54.37964 24.1922 2007-08 277570904 128012553 5103023 2.16831 54.39343 25.0856 2008-09 327279786 153517773 5977184 2.131869 54.75485 25.684 2009-10 373303593 193305395 6894071 1.93116 54.1485 28.0394
Source: Annual Survey of Industries 2014-2015
Table 3. Labour and Capital Productivity of Manufacturing Industry (2010-11 to 2014-15)
Years TO K L TO/K TO/L K/L
2010-11 467621696 239358002 8564552 1.95365 54.59967 27.9475 2011-12 (R ) 570366932 284114733 10001913 2.007523 57.02578 28.406 2012-13 602594536 314411215 11089620 1.916581 54.33861 28.3519 2013-14 655525116 338455535 12649644 1.936813 51.82163 26.7561 2014-15 688381205 351396431 14048488 1.958987 49.00038 25.0131
Source: Annual Survey of Industries 2014-2015
From the table it indicates that Tendulkar (2003) and Goldar’s (2002) argument of input driven growth in Indian
manufacturing industry has proved its relevance. The production has increased due to increased use of capital and labour.
It can be traced from the fifth and sixth column of given table. In the fifth column, productivity per capital is given. It has
not shown much improvement in the productivity level. It has remained almost constant hovering around 1.44 to 2.10.
The sixth column shows productivity per labour which is constantly increasing but at a slower rate. It has increased from
22.02 to 57.02. It clearly shows that manufacturing industry in India is labour-intensive which requires combination of
technological changes to improve productivity. And the seventh column shows capital per labour which is increasing with
the increase in time period.
9. Productivity Analysis Using Cobb-Douglas Production Function
Empirically, the dynamics of productivity growth are captured by productivity decomposition methodologies. A wide
range of decomposition methods are offered in the literature to assess sources of industry productivity growth. These
methodologies decompose productivity growth by using two input factor productivity. This gives the result of economic
scale of returns at specific time interval. The first time interval is the result of new economic policies that initiated in
1990’s. The second time interval is the economic growth that picked up after inflow of Foreign Direct Investment, rising
per capita income and reduced restrictions. The third time interval is policy initiatives by the government.
In(Y) = a0+∑aiIn(Ii)
Y = Output
a0 =Constant
Ii = Inputs (K+L)
ai = Model Coefficients
Table 3. Coefficients of Cobb-Douglas Production Function
Years Coefficients Column1 Column2 Total Economies of Scale
Intercept Log(K) Log(L) [log(K)+log(L)]
1991-92 to 2000-01 -1.5301 1.5398 -0.5195 1.020354 log(K)+log(L)>1 2001-02 to 2009-10 -3.3037 -0.8125 2.4529 1.640383 log(K)+log(L)>1 2010-11 to 2014-15 1.7567 0.89427 0.06029 0.9545651 log(K)+log(L)<1

International Journal of Social Science Studies Vol. 6, No. 8; 2018
61
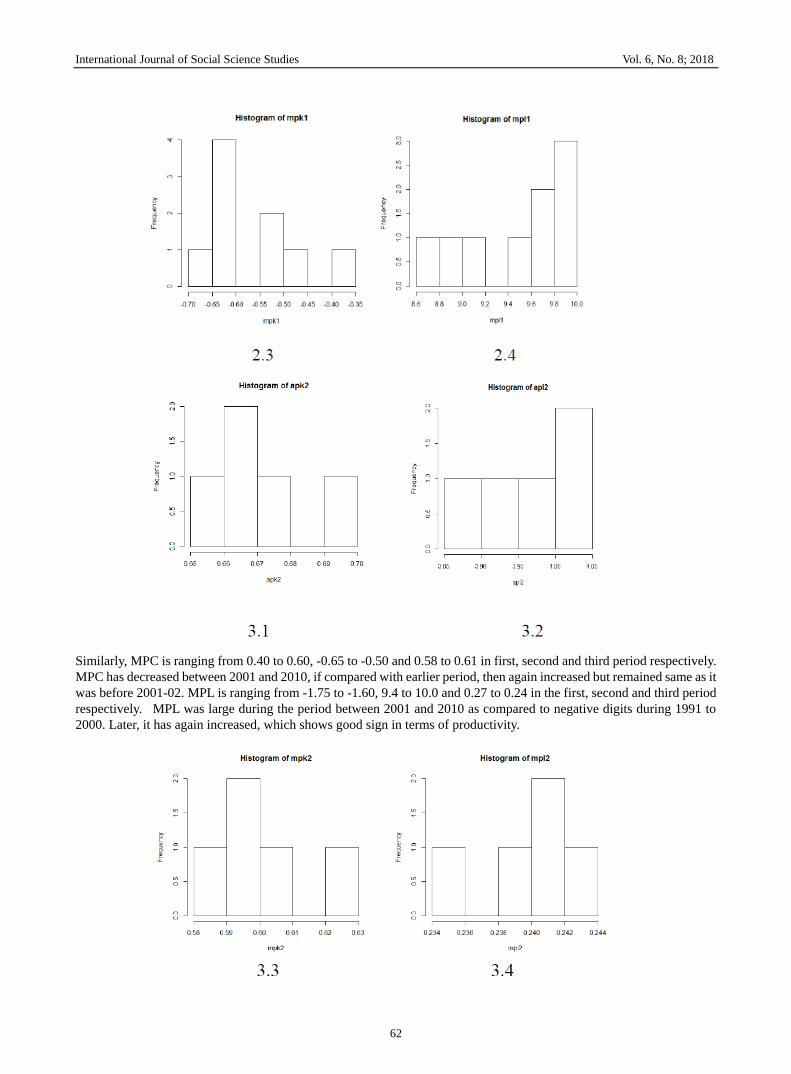
Marginal and Average productivity of capital and labour using Histogram
In the first period, APC is ranging from 0.25 to 0.40 then in th second period it has become 0.60 to 0.80 and then in the
third period, it rang from 0.65 to 0.68 which shows APC has been increasing but at very minimal rate.
In the same way APL is ranging from 3.1 to 3.4 in the first, 3.9 to 4.0 in the second and 3.85 to 4.05 in the third period.
Here, it states that APL is constant over many years since the reform period.
International Journal of Social Science Studies Vol. 6, No. 8; 2018
62
Similarly, MPC is ranging from 0.40 to 0.60, -0.65 to -0.50 and 0.58 to 0.61 in first, second and third period respectively.
MPC has decreased between 2001 and 2010, if compared with earlier period, then again increased but remained same as it
was before 2001-02. MPL is ranging from -1.75 to -1.60, 9.4 to 10.0 and 0.27 to 0.24 in the first, second and third period
respectively. MPL was large during the period between 2001 and 2010 as compared to negative digits during 1991 to
2000. Later, it has again increased, which shows good sign in terms of productivity.

International Journal of Social Science Studies Vol. 6, No. 8; 2018
63
The above histograms give details regarding the frequency of average and marginal product of factor utilized for the
production process mainly capital and labour for different time period i.e. three phases of time period. It makes clear that
how much capital and labour input is giving in return in terms of output.
10. Sectoral Composition of Manufacturing Industry: Its productivity and Growth
The growth of various manufacturing industries can be traced from chart 3 and chart 4 that show sectorial composition of
manufacturing industries from 2005 till 2015. The trend shows not much improvement in the productivity except certain
industries such as Motor Vehicles, Trailers Semi-Trailers, Other Transport Equipment, Machinery and Equipment N.E.C.,
Radio, Tv and Communication Equipment and Apparatus etc. This is because of technological changes in these industries
that have caused production level to increase at reduced input cost.
Automotive Industry:
The Indian auto-components industry has experienced healthy growth over the last few years. Some of the factors
attributable to this include: a buoyant end-user market, improved consumer sentiment and return of adequate liquidity in
the financial system.
The auto-components industry accounts for almost seven per cent of India’s Gross Domestic Product (GDP) and employs
as many as 19 million people, both directly and indirectly. A stable government framework, increased purchasing power,
large domestic market, and an ever increasing development in infrastructure have made India a favourable destination for
investment.
Automobile Industry:
The Indian auto industry is one of the largest in the world. The industry accounts for 7.1 per cent of the country's Gross
Domestic Product (GDP). The Two Wheelers segment with 81 per cent market share is the leader of the Indian
Automobile market owing to a growing middle class and a young population. Moreover, the growing interest of the
companies in exploring the rural markets further aided the growth of the sector. The overall Passenger Vehicle (PV)
segment has 13 per cent market share.
India is also a prominent auto exporter and has strong export growth expectations for the near future. In April-March 2016,
overall automobile exports grew by 1.91 per cent. PV, Commercial Vehicles (CV), and Two Wheelers (2W) registered a
growth of 5.24 per cent, 16.97 per cent, and 0.97 per cent respectively in April-March 2016 over April-March 2015.
Pharmaceutical Industry:
The Indian pharmaceuticals market is the third largest in terms of volume and thirteenth largest in terms of value, as per a
report by Equity Master. India is the largest provider of generic drugs globally with the Indian generics accounting for 20
per cent of global exports in terms of volume. Of late, consolidation has become an important characteristic of the Indian
pharmaceutical market as the industry is highly fragmented.
India enjoys an important position in the global pharmaceuticals sector. The country also has a large pool of scientists and
engineers who have the potential to steer the industry ahead to an even higher level. Presently over 80 per cent of the
antiretroviral drugs used globally to combat AIDS (Acquired Immuno Deficiency Syndrome) are supplied by Indian
pharmaceutical firms.
11. Findings
The division of years in three phases gives elaborate detail regarding how the manufacturing industry of India have been
working on its productivity and efficiency from 1991 which is the crucial era in terms of liberalisation. The analysis of
those three phases, among which the first period between 1991-92 and 2000-01 shows .02 value greater than the constant
returns to scale. The estimate for the input capital and labour is 1.0203 which is almost close to constant returns to scale.
The second period 2001-02 to 2009-10 shows value 1.6403 which reflects increasing returns to scale. Inputs give 0.64
more returns in terms of output than its value. It might be due to progress of certain industries. The third period 2010-11 to
2014-15 shows decreasing returns to scale with the coefficient 0.954 of both the inputs. The third period is very essential
for future study in the productivity analysis as this period have given two major initiative from the government side
mainly NAM 2011 and Make in India, 2014. The third phase include only five year period that becomes important for
comparison for the analysis of next five year period 2015-16 to 2019-20, as this period is crucial because of the initiatives
taken by the government.
The sectoral composition also states that the productivity is stagnant in almost every manufacturing industry except for
few industries. These industries have gained over technology and have managed to increase its productivity because of
which some relief have been gained over other low productive industrial sectors.
The estimate of total inputs varies from 0.945 to 0.957 for the period between 2010-11 and 2014-15. It is quite fluctuating

International Journal of Social Science Studies Vol. 6, No. 8; 2018
64
between these values and also remains hovering around stagnancy.
Development of manufacturing sector is needed especially when the large portion of population is poor and less literate.
12. Critical Issues for Growth
The primary reason for Indian manufacturing not being competitive enough is the significant presence of small-scale
unregistered manufacturing units across the entire spectrum, even in classically scale and capital-intensive segments.
Such unregistered manufacturing accounts for 23 per cent of the total capital employed and 84 per cent of the workforce.
Even the registered manufacturing sector is highly skewed towards low scale. Eighty five per cent of factories in India
have less than USD 200,000 invested in plant and machinery. While this is not to belittle the value of small and medium
enterprises, in India, a large number of such enterprises have been created because of artificial market distortions. The
deliberate fragmentation of units has been detrimental to competitiveness. Even though number of factories have
increased but it does not show increase in productivity as found in the study of Schumpeter (1934, 1942), Hopenhayn
(1992). The study shows that economies of scale has been diminishing over the years. The reason might be an
obsolescence and basic technology, labour-intensive productivity, less expenditure on R&D etc.
The other important reasons for the Indian manufacturing being not competitive enough include:
Poor ranking in higher education and training, goods market efficiency, health and primary education,
technological readiness, financial market development, labour market efficiency.
Poor quality of transport infrastructure across all sectors including port facilities (where productivity is among
the lowest in the world), surface roads, railways, airports and waterways.
High cost of power. Industrial power continues to be among the most expensive in the world. It is about 50 per
cent more expensive than in China.
High cost of capital: It continues to be 10-12 % against international average of 6-8 %. Capital per labour is
also rising as a result of which it can say that efficiency has not improved.
With the entry of new firms the efficiency has not improve, in fact the unregistered enterprises have gained in
numbers with higher capability of employing workers but at lower productivity.
13. Conclusion
The Government has to play a crucial role in providing the industry with a positive investment climate in terms of better
infrastructure support, institutional finance at affordable rates of interest, and designing fiscal policies aimed at endorsing
accelerated growth of the manufacturing sector. In particular, special efforts are needed to upgrade infrastructure facilities
and technological development.
At the same time, the manufacturing firms should concentrate on internal changes aimed at improving efficiency and
reducing costs. For E.g. a CII-Mckinsey study identifies the difference in labour productivity across multiple sectors
between India and China from 10% in TV assembly to 60% in footwear.
Upgrading manufacturing technology levels, redesigning organisation structures to enhance accountability and
responsiveness, enhanced emphasis on attracting and retaining talent, evolving product-mix strategies, explicitly
factoring in the opportunities in export markets, re-engineering core processes to dramatically improve efficiency and
drive business value, enhancing quality focus and customer orientation are very essential factors that should be adopted at
firm level.
Above mentioned tools are required for development process to take place in manufacturing industries. Hence, it can be
concluded that entry of new firm does not ensure efficiency to increase as far as industry alone is considered. The research
based on new entry of a firm in the industry remains unproductive, especially, in case of developing countries if the
economy consists mostly of unorganized sector and the role of government in the industry sector is minimal. And the
critical theory of achieving the higher growth rate by skipping manufacturing industry is also not valid for India, because
India is considered as labour intensive country and it becomes a big challenge to the country like India to provide
employment to growing labour population. Now, it is to see that under ‘National Manufacturing Policy’ (NMP), how the
government work on envisaged policy i.e. to increase the contribution of manufacturing from ~15% to 25% of GDP by
2022.
Productivity is a key to raise living standard of people. Without productivity there would be no social advancement. In an
economy that expanded only in the same proportion as the inputs absorbed in production, the size of the economy would
grow but welfare would not. Productivity is also a key to poverty reduction. Research is gathering evidence on the
fundamental solution to poverty which is productivity. The report by ILO, provides evidence of the impact of productivity
growth on poverty reduction in developing countries. According to this report, labour productivity growth accounts better
for changes in poverty than economic growth. Productivity does better against poverty than overall growth because
productivity specifically generates skilled jobs, which are sources of income and social participation. Therefore,
International Journal of Social Science Studies Vol. 6, No. 8; 2018
65
productivity improvement in terms of efficiency is necessary for mentioned factors.
Acknowledgements
This research paper is one of the chapter from the dissertation which were completed during the 2nd year of the master’s
program under the guidance of Dr. Vibhuti Patel, professor and chairperson, Advanced Center for women’s studies,
School of Development studies, Tata Institute of Social Sciences.
References
“Indian Manufacturing Industry: Technology status and prospect”, UNIDO,
https://www.unido.org/sites/default/files/2009-04/Indian_manufacturing_industry_technology_status_and_prospect
s_0.pdf
Aggarwal, A., & Sato, T. (2011) “Firm dynamics and productivity growth in Indian Manufacturing: Evidence from plant
level and panel dataset”, National Council of Applied Economic Research, New Delhi.
Aghion, P., Richard, B., Rachel, G., Peter, H., & Susanne, P. (2009). The effects of entry on incumbent innovation and
productivity. Review of Economics and Statistics, 91(1), 20-32. https://doi.org/10.1162/rest.91.1.20
Balakrishnan, P., & Babu, M. S. (2003). Growth and Distribution in Indian Industry in the nineties, Economic and
Political Weekly.
Bhat, T. P. (2014). INDIA Structural Changes in the Manufacturing Sector and Growth Prospect, Institute for Studies in
Industrial Development, New Delhi.
Deshmukh, J., & Pyne, K. P. (2013). “Labour productivity and export performance: Firmlevel evidence from Indian
manufacturing industries since 1991”, Asia-Pacific Research and Training Network on Trade, Bangkok, ESCAP.
Dougherty, S., Herd, R, & Chalaux, T. (2009). What is holding back productivity Growth in India? OECD journal, 2009,
ISSN 1995-2848.
Gera, N. (2012). Significance and future prospects of textile export in Indian economy. International Research Journal,
2(1), 2012.
Goldar, B., Aggarwal, S., Das, D., erumban, A., & Das, P. (2016). Productivity Growth and Levels - A comparison of
Formal and Informal Manufacturing in India, Centre f-or Development Economics, Delhi School of Economics.
Greene, W. (2007). The Emergence of India’s Pharmaceutical Industry and Implications for the U.S. Generic Drug Market,
U.S International Trade commission, Washington DC.
Hopenhayn, H. A. (1992). "Entry, Exit, and Firm Dynamics in Long Run Equilibrium." Econometrica, Econometric
Society, 60(5), 1127-1150, September. https://doi.org/10.2307/2951541
Indian manufacturing: overview and prospects (2015), Indian Brand Equity Foundation.
Isaksson, A., H Thiam, & R. Ghislain, (2005). “Productivity in Developing countries and trend”, United Nations
Industrial Development Organisation, Vienna.
Iyer, A., Koudal, P., Saranga, H., & Seshadri, S. (2011). “Indian Manufacturing–Strategic and Operational Decisions and
Business Performance”. Indian Institute of Management, Bangalore.
Joumard, I., Sila, U., & Morgavi, H. (2015). “Challenges and Opportunities of India's Manufacturing Sector”, OECD
Economics Department Working Papers No. 1183.
Kaliappa, K. (2004). “Is the manufacturing sector in India an engine of growth?”. Institute For Social And Economic
Change.
Kathuria, V., Raj, R. S. N., & Sen, K. (2010). Organised versus Unorganised Manufacturing Performance in the
Post-Reform Period. Economic and Political Weekly, June 12, 2010, xlv(24).
Kaur, M, & Kiran, R (2008). Indian Manufacturing Sector: Growth and Productivity under the New Policy Regime,
International Review of Business Research Papers, 4(2), March 2008, 136-150.
Pakes, A., & Ericson, R. (1989). Empirical Implications of Alternative Models Of Firm Dynamics, NBER Working Paper
No. 2893, Cambridge, MA 02138.
Ranis, G. (2004). Arthur lewis’ contribution to development thinking and policy, economic growth center, Yale
University.
Rao, K. S., Dhar, B., Ranganathan, K. V., Choudhury, R., & Negi, V. (2014). FDI into India’s Manufacturing Sector via
M&As: Trends and Composition (2014), Institute for Studies in Industrial Development.

International Journal of Social Science Studies Vol. 6, No. 8; 2018
66
Rodrik, D. (2013). The Past, Present, and Future of Economic Growth, Global citizen foundation.
Roy, T. (1999). Growth and Recession in Small-Scale Industry A Study of Tamil Nadu Powerlooms, Economic and
Political Weekly.
Tanna, B., Narwekar, N., & Singh, S. (2016). India Manufacturing Barometer: winds of change, FICCI.
The economic survey of India 2015-16, Department of economics, Ministry of finance, pp 102-114.
The Indian Automotive Industry Evolving Dynamics (2010), KPMG.
Unel, B. (2003). Productivity trend in India’s Manufacturing sector in last two decades, International Monetary Fund,
Asia Pasific Department.
Copyrights
Copyright for this article is retained by the author(s), with first publication rights granted to the journal.
This is an open-access article distributed under the terms and conditions of the Creative Commons Attribution license
which permits unrestricted use, distribution, and reproduction in any medium, provided the original work is properly
cited.