Training - What is Performance ?
48
MAXIME LEMAITRE – 07/04/2015 What is Performance ? Performance is a feature
-
Upload
betclic-everest-group-tech-team -
Category
Software
-
view
952 -
download
1
Transcript of Training - What is Performance ?

MAXIME LEMAITRE – 07/04/2015
What is Performance ?Performance is a feature

Agenda
• Introduction• Common Principles• Maths• Performance testing principles• Being Performance minded• Conclusion

Goals & Objectices
• Explain you common performance principles• Give you methodology• Talk about some tools

What is Performance ?
High CPU ?High memory usage ?IO ?
Slow Response Time ?Unresponsive ?
Scalability ?Pages /sec ?Deposits /sec ?

Pipe analogy
LatencyThe time to travel along the pipe
ThroughputThe volume of water that comes of the pipe every second
ConcurrencyThe volume of the pipe
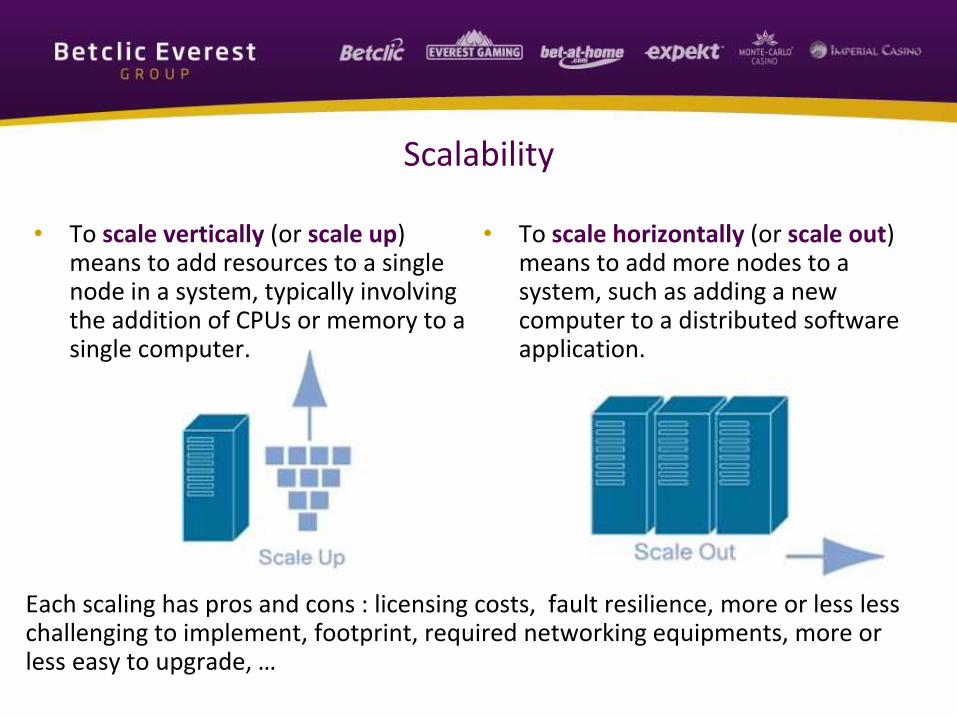
Scalability
• To scale vertically (or scale up) means to add resources to a single node in a system, typically involving the addition of CPUs or memory to a single computer.
• To scale horizontally (or scale out) means to add more nodes to a system, such as adding a new computer to a distributed software application.
Each scaling has pros and cons : licensing costs, fault resilience, more or less lesschallenging to implement, footprint, required networking equipments, more or less easy to upgrade, …
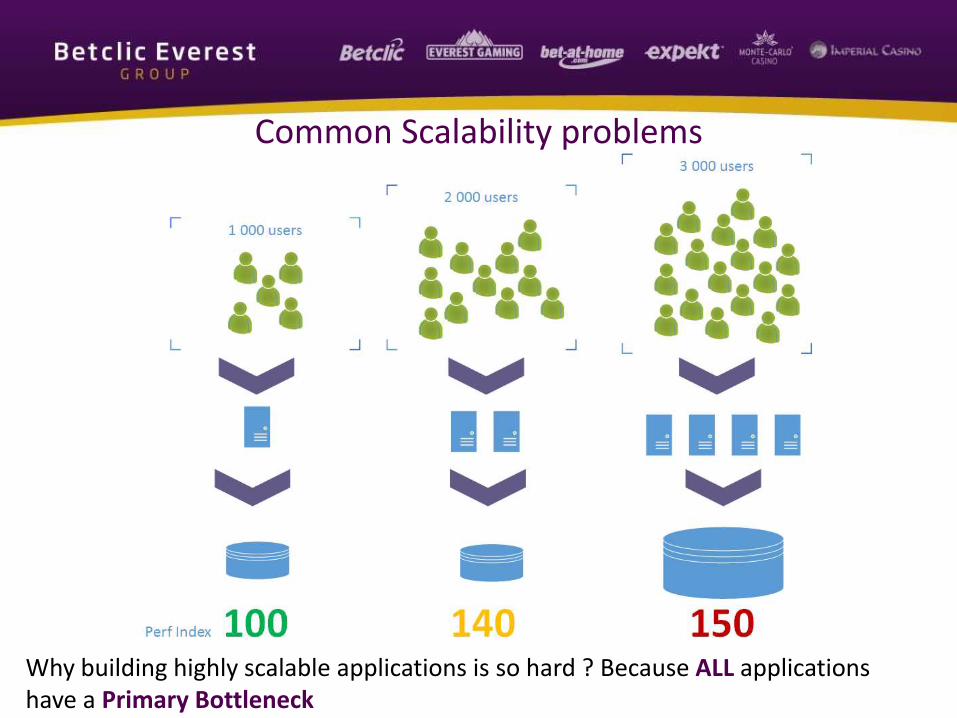
Common Scalability problems
Why building highly scalable applications is so hard ? Because ALL applications have a Primary Bottleneck


Big-O Notation
Big-O notation is a relative representation of the complexity of an algorithm.
• relative: you can only compare apples to apples. You can't compare an algorithm to do arithmetic multiplication to an algorithm that sorts a list of integers. But a comparison of two algorithms to do arithmetic operations (one multiplication, one addition) will tell you something meaningful;
• representation: Big-O (in its simplest form) reduces the comparison between algorithms to a single variable. That variable is chosen based on observations or assumptions. For example, sorting algorithms are typically compared based on comparison operations (comparing two nodes to determine their relative ordering). This assumes that comparison is expensive. But what if comparison is cheap but swapping is expensive? It changes the comparison; and
• complexity: if it takes me one second to sort 10,000 elements how long will it take me to sort one million? Complexity in this instance is a relative measure to something else.
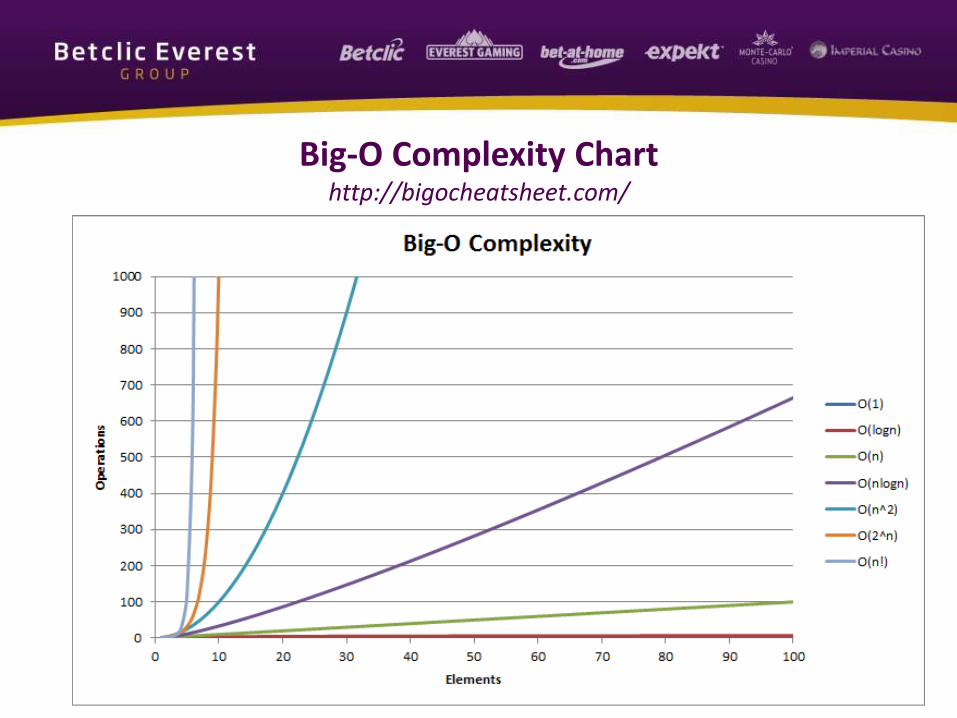
Big-O Complexity Charthttp://bigocheatsheet.com/
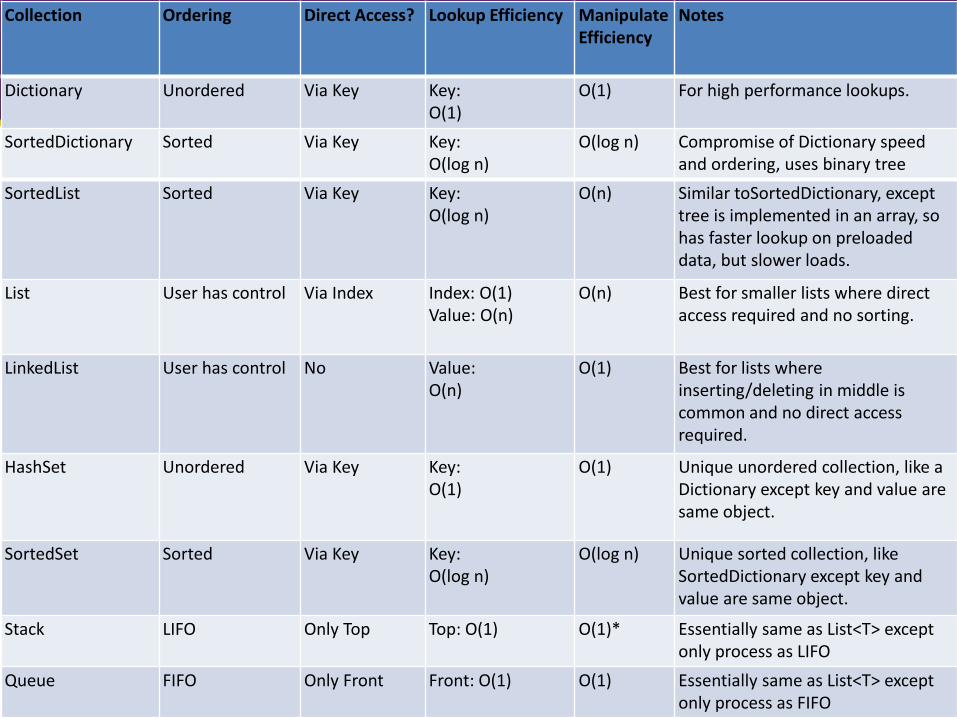
Collection Ordering Direct Access? Lookup Efficiency ManipulateEfficiency
Notes
Dictionary Unordered Via Key Key:O(1)
O(1) For high performance lookups.
SortedDictionary Sorted Via Key Key:O(log n)
O(log n) Compromise of Dictionary speed and ordering, uses binary tree
SortedList Sorted Via Key Key:O(log n)
O(n) Similar toSortedDictionary, except tree is implemented in an array, so has faster lookup on preloaded data, but slower loads.
List User has control Via Index Index: O(1)Value: O(n)
O(n) Best for smaller lists where direct access required and no sorting.
LinkedList User has control No Value:O(n)
O(1) Best for lists where inserting/deleting in middle is common and no direct access required.
HashSet Unordered Via Key Key:O(1)
O(1) Unique unordered collection, like a Dictionary except key and value are same object.
SortedSet Sorted Via Key Key:O(log n)
O(log n) Unique sorted collection, like SortedDictionary except key and value are same object.
Stack LIFO Only Top Top: O(1) O(1)* Essentially same as List<T> except only process as LIFO
Queue FIFO Only Front Front: O(1) O(1) Essentially same as List<T> except only process as FIFO

The problem of response time
Response time is not always the same !
Page loads in less than the average for 70% of users

What about spikes ?
Orange : 50th percentile
Green : average
Red : 90th percentile
Don’t forget spikes, it’s end-users too !
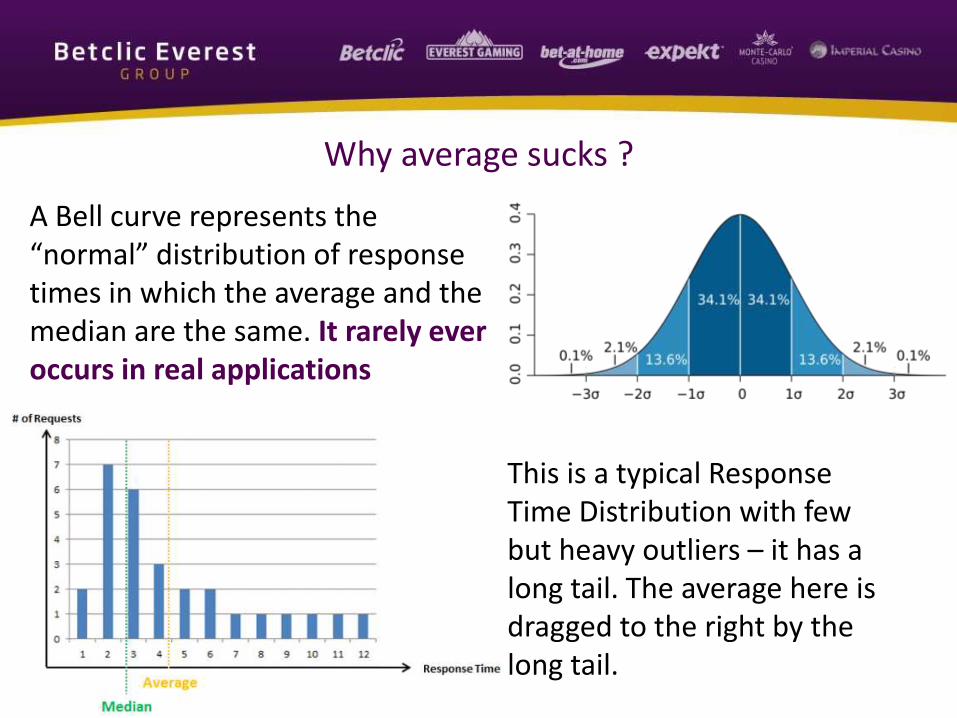
Why average sucks ?
A Bell curve represents the “normal” distribution of response times in which the average and the median are the same. It rarely ever occurs in real applications
This is a typical Response Time Distribution with few but heavy outliers – it has a long tail. The average here is dragged to the right by the long tail.

Percentiles ?
• Index of Pth in a sorted list = (P / 100 ) x N, – where P is the percentile and N is the length of
the list.
• In a set of 100 values that are sorted from best to worst, the 90th percentile simply means the 90th value in the list.
• Example 2,2,2,2,2, 2,2,2,2,2, 3,3,3,3,3, 4,10,10,10,20 – Average = 4.45 seconds
– 90th Percentile = 10 seconds
• Limitation : You need one “order of magnitude” more samples than the target percentile– For 0-99 => at least 100 samples
– For 99.9 => at least 1000 samples
– For 99.99 => at least 10000 samples
The average response time for each of these two lists is 1.000 seconds. List B represents a set of user experiences of which 40% were dissatisfactory. Percentile. Percentiles are more informative than average.90th percentile List A : .987 seconds List B : 1.273 seconds
Why percentiles ?
• The average/deviation attempt to describe the characteristics of a set of data assuming they describe a normal curve– but it’s never the case real world apps.
• Even small numbers of customers having a bad experience costs real money– We don’t want our website to be fast for only half of the users, but for all
• Percentiles values are usually far more important for high-availability services. The higher availability you require, the higher percentile you will want to track– Typical SLA for 99.9th percentile
• Percentiles are valuable because they give you an idea of how your metrics degrade across your entire execution context– Average can be good but 10% of your execution is being impacted more
negatively than the rest

Performance Testing Principles

Code PerformanceLayers of Optimizations
Algorithms
.Net Framework
CLR
Assembly Code
• Algorithms
your own software, your implementation to the business problem.
• .Net Framework
Set of classes provided by Microsoft or 3rd parties
• CLR
combination of managed and unmanaged components that provide .NET
• Assembly Code
where the code hits the metal. Once the CLR has JITted the code, you are actually running processor assembly code.
When doing performance investigation, always start at the top layer and move down. Make sure your program’s structure and algorithms make sense before digging into the details of the underlying code. Macro-optimizations are almost always more beneficial than micro-optimizations.

Measure, Measure, Measure!
• You can’t optimize everything• You don’t have the time to work only on performance
Measure !
• You do NOT know where your performance problems are if you have not measured accurately. – Don’t try to guess, but prove it
– Illustrate how much you improved the program
• Optimizing performance is meaningless if you do not have effective tools for measuring it.

Windows & .NET ecosystem• Visual Studio Profiler
Analyze CPU usage, memory allocations, and resource contentions during dev
• Performance Counters
Hundreds of counters including many for .NET or custom categories
• ETW Events
Fundamental blocks for all diagnostic logging in Windows, not just for perf
• Perfview
Collect and analyze ETW events
• CLR Profiler
Graphical representation of the heap and relationships between objects
• Windbg & Debug Diag
Dump analysis
• .NET IL Analyzers
Decompile .net assembly into IL, C#
• Code Instrumentation
The Old brute-force debugging via Stopwatch
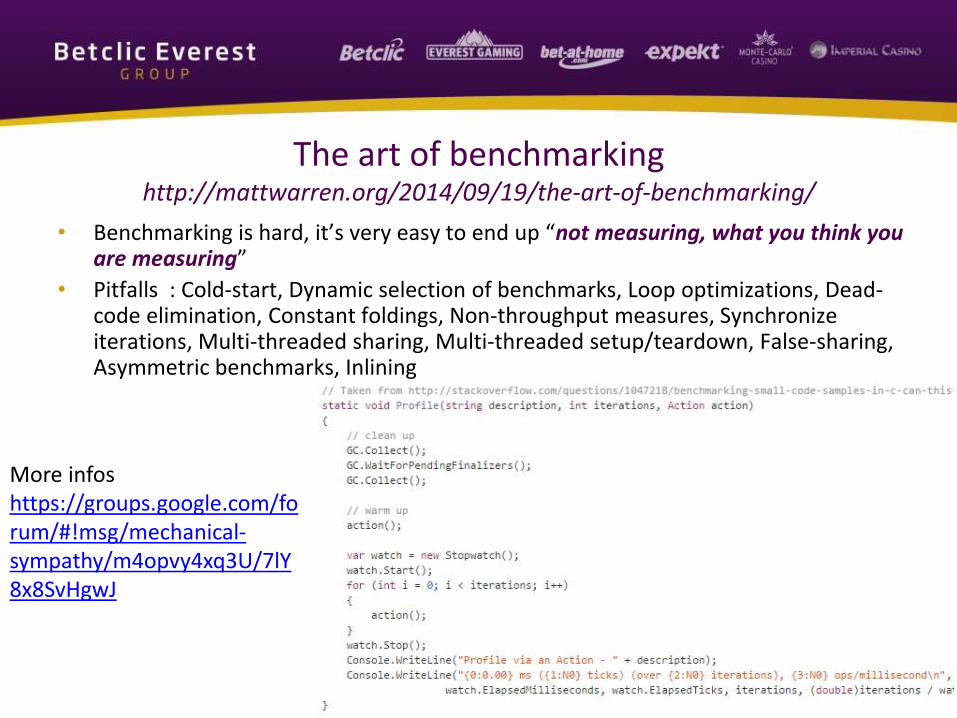
The art of benchmarkinghttp://mattwarren.org/2014/09/19/the-art-of-benchmarking/
• Benchmarking is hard, it’s very easy to end up “not measuring, what you think you are measuring”
• Pitfalls : Cold-start, Dynamic selection of benchmarks, Loop optimizations, Dead-code elimination, Constant foldings, Non-throughput measures, Synchronizeiterations, Multi-threaded sharing, Multi-threaded setup/teardown, False-sharing, Asymmetric benchmarks, Inlining
More infoshttps://groups.google.com/forum/#!msg/mechanical-sympathy/m4opvy4xq3U/7lY8x8SvHgwJ

Why Load testing ?
Its great if your site performs well for a single user. . .
But how will it do when a storm of users hits?
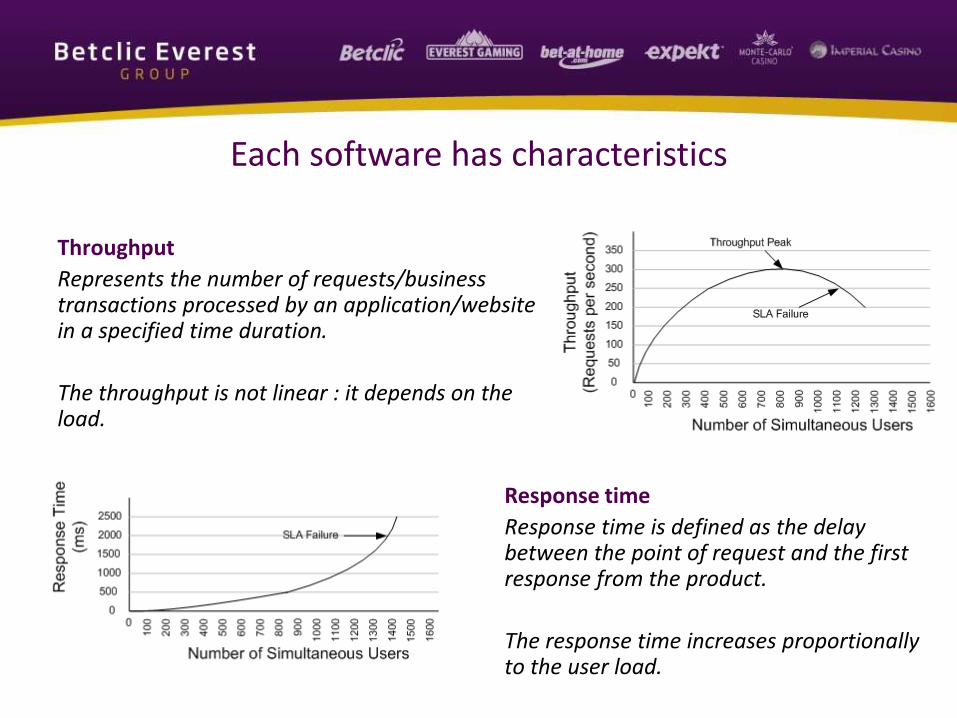
Each software has characteristics
Throughput
Represents the number of requests/business transactions processed by an application/website in a specified time duration.
The throughput is not linear : it depends on the load.
Response time
Response time is defined as the delay between the point of request and the first response from the product.
The response time increases proportionally to the user load.
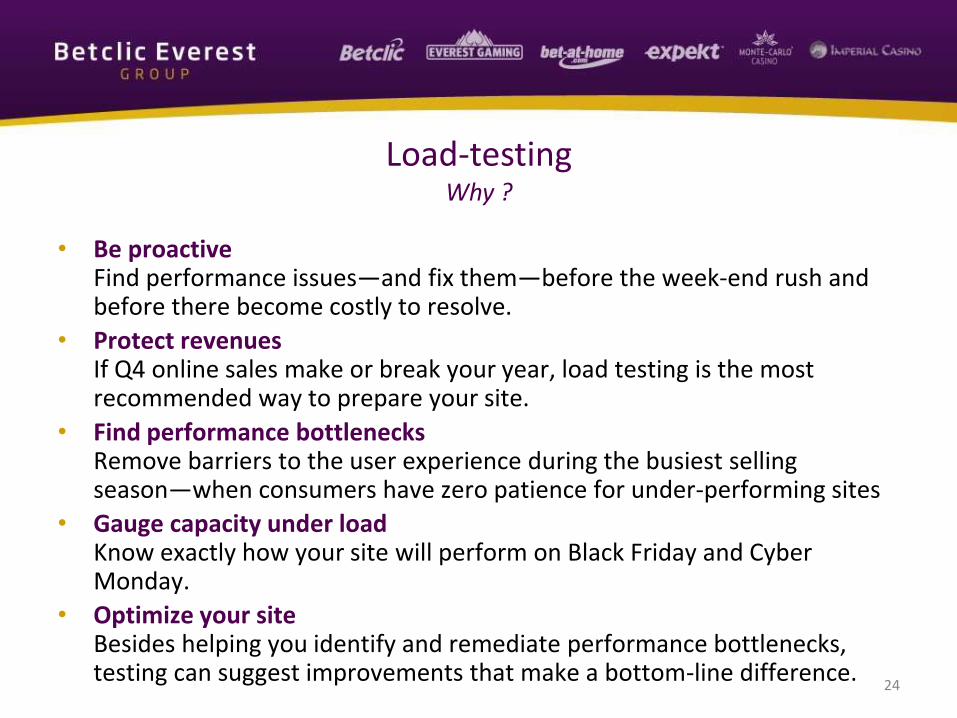
• Be proactiveFind performance issues—and fix them—before the week-end rush and before there become costly to resolve.
• Protect revenuesIf Q4 online sales make or break your year, load testing is the most recommended way to prepare your site.
• Find performance bottlenecksRemove barriers to the user experience during the busiest selling season—when consumers have zero patience for under-performing sites
• Gauge capacity under loadKnow exactly how your site will perform on Black Friday and Cyber Monday.
• Optimize your siteBesides helping you identify and remediate performance bottlenecks, testing can suggest improvements that make a bottom-line difference.
24
Load-testingWhy ?

• High frequency transactions
The most frequently used transactions have the potential to impact the performance of all of the other transactions if they are not efficient.
• Mission Critical transactions
The more important transactions that facilitate the core objectives of the system should be included, as failure under load of these transactions has, by definition, the greatest impact.
• Read Transactions
At least one READ ONLY transaction should be included, so that performance of such transactions can be differentiated from other more complex transactions.
• Update Transactions
At least one update transaction should be included so that performance of such transactions can be differentiated from other transactions. 25
Load testingWhat should be tested ?

Test Type Purpose
Smoke Test To test how your application performs under light loads for short durations.
Performance test To determine or validate speed, scalability, and/or stability.
Load test To verify application behavior under normal and peak load conditions.
Stress test To determine or validate an application’s behavior when it is pushed beyond normal or peak load conditions.
Capacity test To determine how many users and/or transactions a given system will support and still meet performance goals.
Regression test To make the load testing a part of the dev process by creatingregression load-tests.
26
Load-testing ConceptsNot just one test type
27
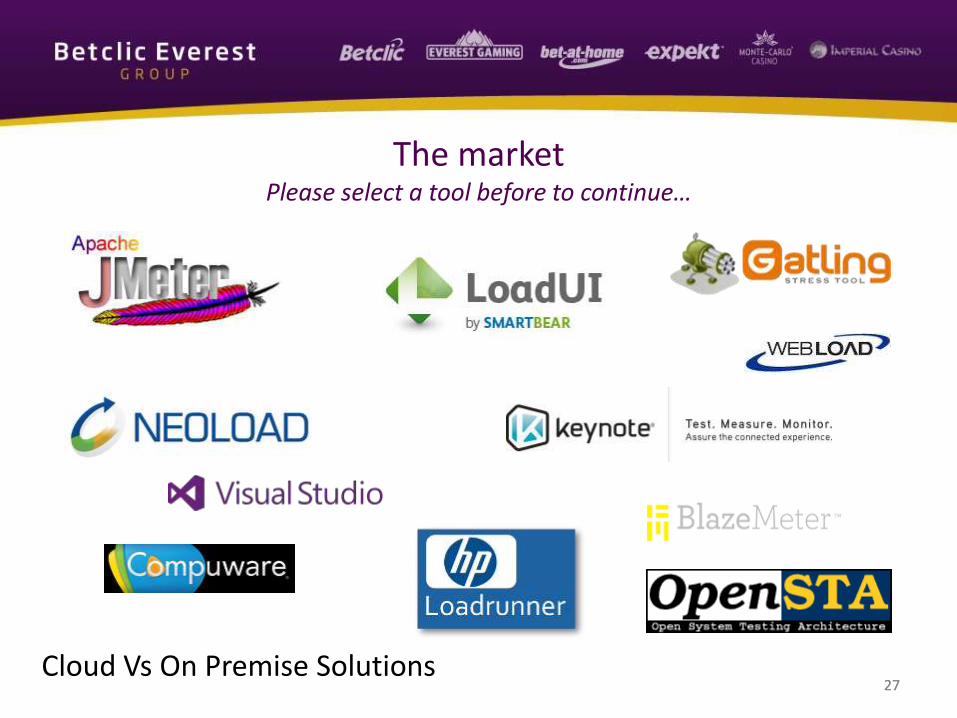
The marketPlease select a tool before to continue…
27Cloud Vs On Premise Solutions

28
Quick and simple local load testing
• Apache Benchmarking tool
ab.exe/abs.exe is a small executable that lets you hit a URL repeatedly and provides counter information about the number of requests, requests per second
• Tip : Use Perfview or Visual
Studio Profiler at the same time
• More info
http://httpd.apache.org/docs/2.2/programs/ab.html
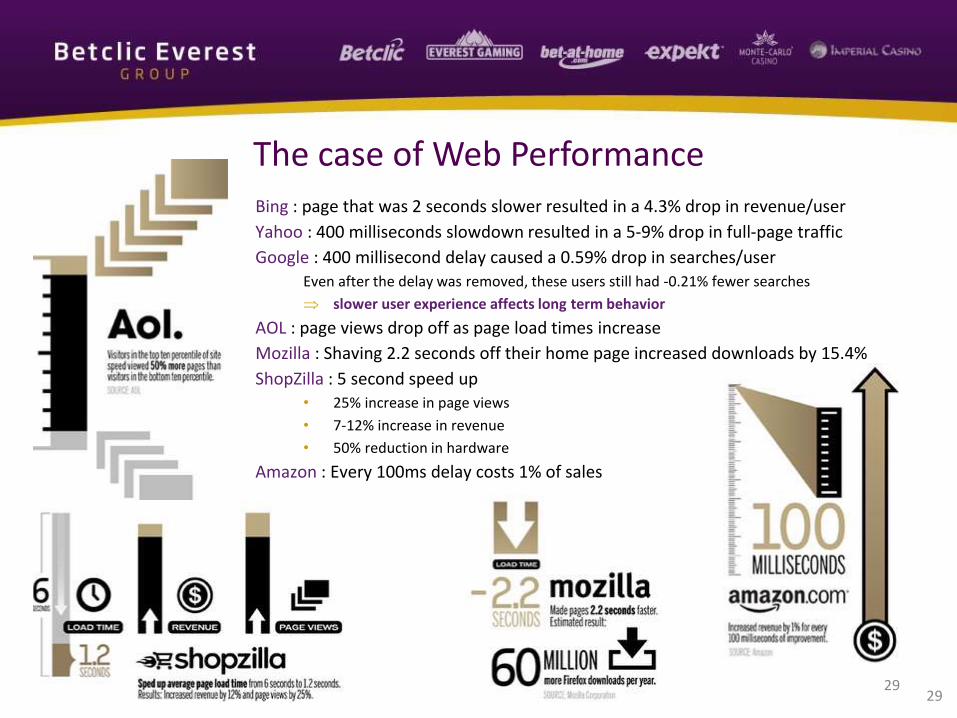
The case of Web Performance
29
Bing : page that was 2 seconds slower resulted in a 4.3% drop in revenue/user
Yahoo : 400 milliseconds slowdown resulted in a 5-9% drop in full-page traffic
Google : 400 millisecond delay caused a 0.59% drop in searches/userEven after the delay was removed, these users still had -0.21% fewer searches
slower user experience affects long term behavior
AOL : page views drop off as page load times increase
Mozilla : Shaving 2.2 seconds off their home page increased downloads by 15.4%
ShopZilla : 5 second speed up• 25% increase in page views
• 7-12% increase in revenue
• 50% reduction in hardware
Amazon : Every 100ms delay costs 1% of sales
29

Web Performance Optimizationwhere to start ?
80-90% of the end-user response time is spent on the frontend !

SpeedIndex
• For a long time, measuring web performance was all about minimizing the time it took for various browser events to fire (window.onload or the loadEventEnd )– This is not the actual user experience
• Speed index is a relatively new method of measuring web page performance that was originally developed for WebPagetest.org
• Measure how the user perceives the performance of a page
• Recommanded to be < 1000

SpeedIndex Example

Web Performance Monitoring
• Synthetic Monitoring – vendors provide remote (often global) infrastructure that visits a website periodically and records the performance data for each run. The measured traffic is not of your actual users, it iz traffic synthetically generated to collect data on page performance.
• Real User Monitoring (RUM) – vendors provide a javascript that is injected on each page and reports on the page load data for every request that is made for each page. As the name suggests, this technique monitors an application’s actual user interactions. Often based on HTML5 navigation timings API
Both RUM and synthetic monitoring give different views of our performance, and are useful for different things. RUM helps us understand long-term trends, and synthetic monitoring helps us diagnose and solve shorter-term performance problems.

Example from Etsy Q42014https://codeascraft.com
Synthetic Front-End Performance Real User Front-End Performance

WPO Ecosystem
• http://www.webpagetest.org/
• Pagespeed & Yslow recommandations
• Chrome/IE/FF Dev Tools, Firebug
• https://developers.google.com/web/fundamentals/performance/index?hl=en
• http://browserdiet.com/en/
• https://github.com/davidsonfellipe/awesome-wpo

Best Practices
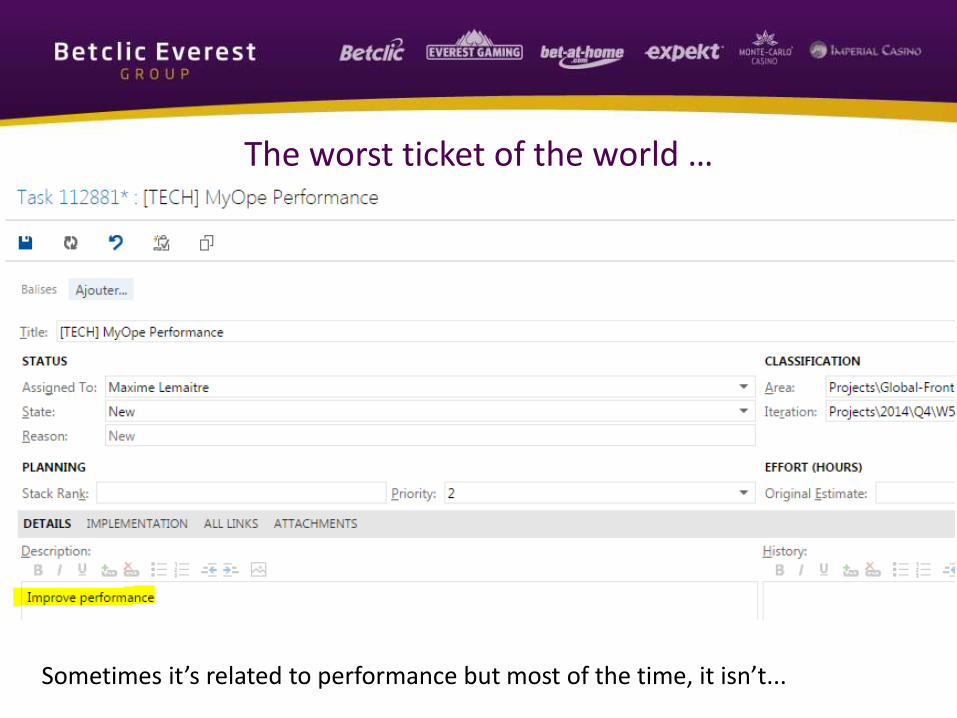
The worst ticket of the world …
Sometimes it’s related to performance but most of the time, it isn’t...

Investigating performance issues …
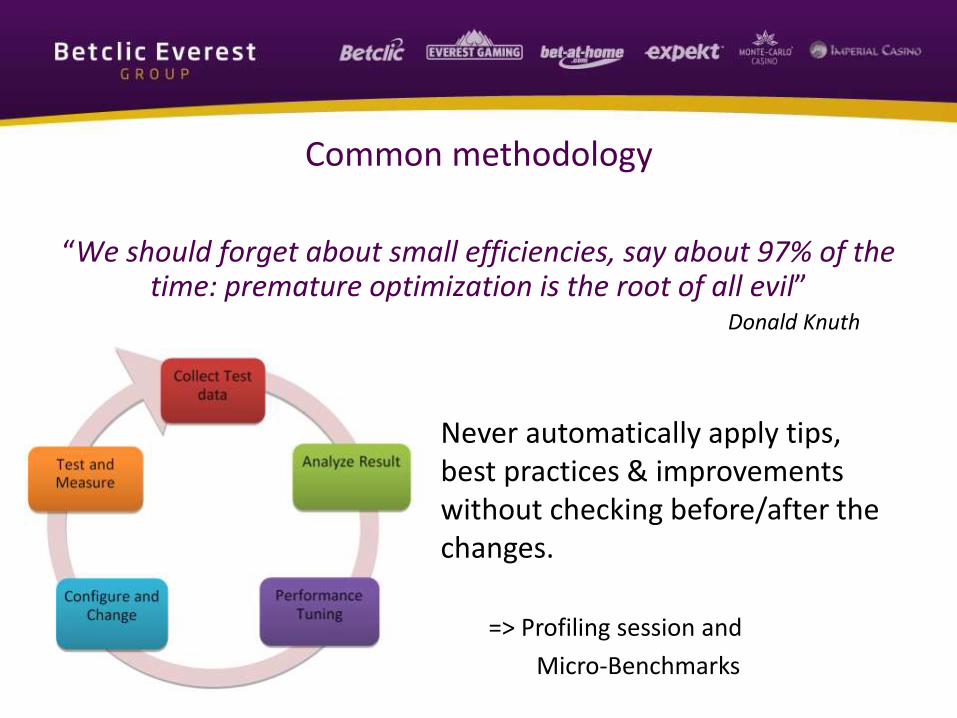
Common methodology
“We should forget about small efficiencies, say about 97% of the time: premature optimization is the root of all evil”
Donald Knuth
Never automatically apply tips, best practices & improvements without checking before/after the changes.
=> Profiling session and
Micro-Benchmarks

Performance evolution over time
• In each release, we– Add new features
– Update existing features
– Remove dead code
– Do refactoring
– Integrate new devs & juniors
– Update technical components & dependencies
– Create bugs
– …
• Performance regression is expected over time– Don’t wait perf issue, be pro-active
Building a Performance-Minded team
• Understand your critical path• Understand your prod activity & usage• Do effective testing• Setup Perf Infrastructure & Automation • Believe only numbers• Do regular code reviews• Educate your team• Celebrate your success !
The golden rules for scalable & high perf applications
• Never do anything more than once.Cache everything that is likely to be used more than once. It is a cardinal sin to retrieve the same data from a SQL Server, web service or configuration file twice!
• Don’t do anything you don’t need to.Don’t be tempted to reuse an existing stored procedure or web service which returns large quantities of data when only a small subset of what it returns is actually needed – create a new stored procedure or web service which gets just the data required.
• Get everything in one go.Don’t use lots of fine grained web service or database calls when one chunky call can be used instead – the fixed overheads of making such calls are very high and repeated use should be avoided. Aim for the panacea of one web page executes at most one web service or SQL call.
Performance FAQ
• Does improving performance requires advanced skills ?
No, most of the time
• Does build a high scalable app require a specific design ?
Yes, of course
• Is there any common methodology to follow ?
Observe, optimize, Measure, adopt it/put it back
• Should I have to review perf of my app just after this meeting ?
Do you have issues? Do you have perf goals ?
• When should I have to stop working on performance ?
Only when you reached your performance goals

To be continued …

Questions

References
• http://blogs.msdn.com/b/mcsuksoldev/archive/2011/01/19/common-performance-issues-on-asp-net-web-sites.aspx
• https://msdn.microsoft.com/en-us/library/hh156536.aspx
• https://msdn.microsoft.com/en-us/library/dn690114.aspx
• https://sites.google.com/a/webpagetest.org/docs/using-webpagetest/metrics/speed-index
• http://www.diaryofaninja.com/blog/2012/07/30/micro-benchmarking-aspnet-sites-using-apache-bench
• http://apmblog.dynatrace.com/2012/11/14/why-averages-suck-and-percentiles-are-great/
• http://method-r.com/papers/file/44-thinking-clearly-about-performance

About Us• Betclic Everest Group, one of the world leaders in online
gaming, has a unique portfolio comprising variouscomplementary international brands: Betclic, EverestPoker/Casino, Bet-at-home, Expekt, Imperial Casino, Monte-Carlo Casino…
• Through our brands, Betclic Everest Group places expertise,technological know-how and security at the heart of ourstrategy to deliver an on-line gaming offer attuned to thepassion of our players. We want our brands to be easy to usefor every gamer around the world. We’re building ourcompany to make that happen.
• Active in 100 countries with more than 12 million customersworldwide, the Group is committed to promoting secure andresponsible gaming and is a member of several internationalprofessional associations including the EGBA (EuropeanGaming and Betting Association) and the ESSA (EuropeanSports Security Association).

We want our Sports betting, Poker, Horse racing andCasino & Games brands to be easy to use for everygamer around the world. Code with us to make thathappen.
Look at all the challenges we offer HERE
Check our Employer Page
Follow us on LinkedIn
WE’RE HIRING !