Training material EPEA 19 th London group meeting November 2013 Nancy Steinbach, Environmental...
15
Training material EPEA 19 th London group meeting November 2013 Nancy Steinbach, Environmental accounts and natural resource unit, SCB
-
Upload
osbaldo-hickey -
Category
Documents
-
view
214 -
download
0
Transcript of Training material EPEA 19 th London group meeting November 2013 Nancy Steinbach, Environmental...

Training material EPEA
19th London group meeting November 2013Nancy Steinbach,
Environmental accounts and natural resource unit, SCB
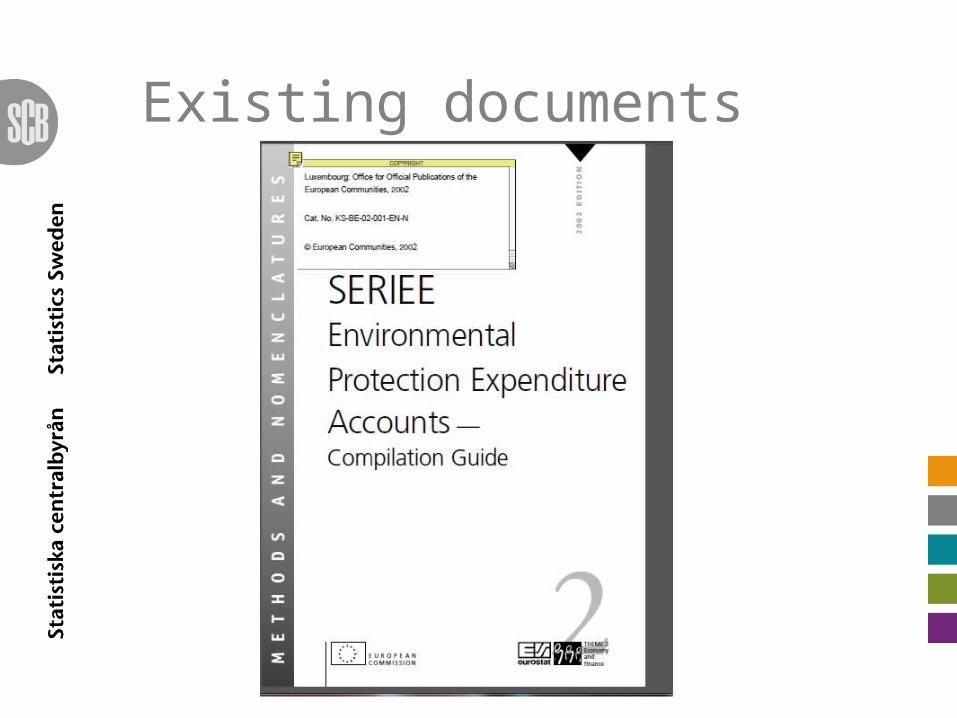
Existing documents


European training courses
• So called ESTP courses have been held for Europe on EPEA through Eurostat
• Most recent in 2012• New course on EPEA planned march 2014• Statistics Austria course trainer• The training material available on CircaB (see
technical note for link)• Regional training workshops (Balkan,
Mediterranean etc). • Bilateral training courses

Four approaches of tables
• EPEA á la SEEA CF• EPEA á la 2002• EPEA á la EU regulation 691/201X• OECD/Eurostat Joint Questionnaire on
Environmental Protection Expendiutre and Revenues

SEEA CF tables:

Continued…

Continued…
The other three tables…
Key indicators
• Depends on what tables to go for
But examples would be:• Net EP expenditure• Total GFCF • % GDP• % GFCF• % generated waste• % generated air pollutions• ..
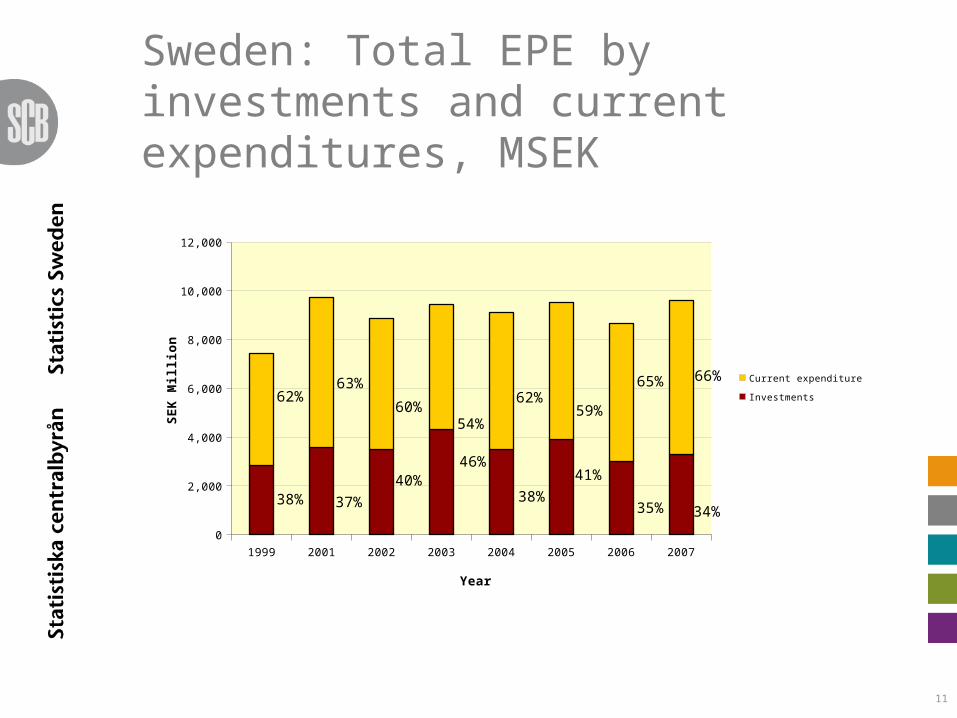
1999 2001 2002 2003 2004 2005 2006 20070
2,000
4,000
6,000
8,000
10,000
12,000
Current expenditure
Investments
Year
SE
K M
illi
on
38%
66%62%
34%35%
65%
41%
59%
38%
62%
46%
54%
40%
60%
37%
63%
11
Sweden: Total EPE by investments and current expenditures, MSEK
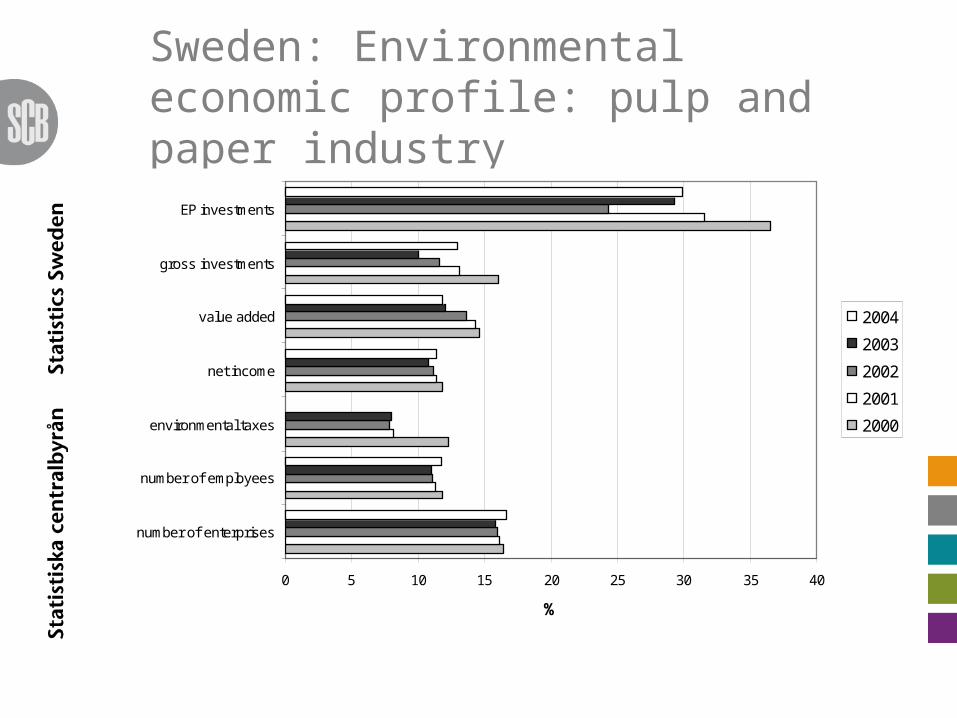
Sweden: Environmental economic profile: pulp and paper industry
0 5 10 15 20 25 30 35 40
number of enterprises
number of employees
environmental taxes
net income
value added
gross investments
EP investments
%
2004
2003
2002
2001
2000

How much does Italy spend for EP?
0
5.000
10.000
15.000
20.000
25.000
1997 1998 1999 2000 2001 2002 2003 2004 2005 2006
Mill
ions
eur
o - c
urre
nt p
rice
s
0,0%
0,2%
0,4%
0,6%
0,8%
1,0%
1,2%
1,4%
1,6%
1,8%
% o
f GD
P
Wastemanagement
Wastew atermanagement
Totalenvironmentalexpenditure
Wastemanagement
Wastew atermanagement
Totalenvironmentalexpenditure
Source: Istat, Falcitelli 2008

Waste management EPE versus physical quantity of waste - Italy
0
20.000
40.000
60.000
80.000
100.000
120.000
140.000
160.000
1997 1998 1999 2000 2001 2002 2003 2004 2005 2006
Th
ou
san
d t
on
s
0
2.000
4.000
6.000
8.000
10.000
12.000
14.000
16.000
18.000
Mil
lio
ns
euro
Urban solid w aste
Special w aste
Total w aste
Final consumption
Intermediateconsumption
National output ofw aste managementsector
Source: Istat, Falcitelli 2008

Some issues of discussions:
• Have you conducted any uncertainty analysis with regards to data gaps of EPEA?
• Have you examples of studies related to adapted products?
• Have you conducted any integrated analysis of EP results to physical accounts?
• Have you thought of how to integrate e.g. energy efficiency to EPEA type framework?

![Scb Overview[1]](https://static.fdocuments.us/doc/165x107/559075fe1a28abd6118b46e6/scb-overview1.jpg)