Comments on ECTEL’s proposed Principles, methodologies and ...

Training Manual on Methodologies for Data Collection on Energy Use by the Transport Sector
Economic and Social Commission for Western Asia

Distr.
LIMITED
E/ESCWA/SD/2015/1/Manual
17 February 2015
ORIGINAL: ENGLISH
ECONOMIC AND SOCIAL COMMISSION FOR WESTERN ASIA (ESCWA)
TRAINING MANUAL ON METHODOLOGIES FOR DATA COLLECTION
ON ENERGY USE BY THE TRANSPORT SECTOR
United Nations
New York, 2015
1500116

iii
Acknowledgements
This training manual was prepared in the framework of the Development Account Project on Energy
Statistics and Balance in the ESCWA Region. The project manager is Wafa Aboul Hosn (Chief, Economic
Statistics Section, ESCWA Statistics Division). The authors are Abdelaziz Bourahla, consultant in charge of
MEDSTAT III (energy sector), and Rafik Missaoui, General Director of the Tunisian sustainable
development company ALCOR.

iv

v
CONTENTS
Page Acknowledgements .............................................................................................................................. iii
Abbreviations and acronyms ................................................................................................................ vii
Executive summary .............................................................................................................................. ix
� �����ي� ............................................................................................................................................ x
Introduction .......................................................................................................................................... 1
Chapter
I. STANDARD TRANSPORT ORGANIZATION ................................................................... 2
A. Classification of the transport sector by type of actors .................................................... 2
B. Classification of the transport sector by mode ................................................................. 2
C. Classification by type of energy ....................................................................................... 3
D. Classification of road transport ........................................................................................ 3
E. Transport sector stakeholders ........................................................................................... 6
II. DATA COLLECTION METHODOLOGIES FOR THE TRANSPORT SECTOR ......... 7
A. Background ...................................................................................................................... 7
B. Data research and needs ................................................................................................... 8
C. Collection of energy use data ........................................................................................... 9
III. SURVEY DESIGNS ................................................................................................................. 11
A. Background ...................................................................................................................... 11
B. Benefits of harmonizing work on transport energy consumption surveys ....................... 11
C. Survey stages ................................................................................................................... 12
D. Significant variables ......................................................................................................... 13
E. Sample design .................................................................................................................. 14
IV. MODELS .................................................................................................................................. 21
A. Introduction ...................................................................................................................... 21
B. Category of models .......................................................................................................... 22
V. EXAMPLES OF ENERGY SURVEYS IN THE TRANSPORT SECTOR ........................ 31
A. Canada.............................................................................................................................. 31
B. Morocco ........................................................................................................................... 33
C. Palestine ........................................................................................................................... 40
D. Tunisia.............................................................................................................................. 41
VI. RECOMMANDATION FOR SURVEY PLAN .................................................................... 51
A. Short term......................................................................................................................... 51
B. Medium and long term ..................................................................................................... 51
C. Challenges ........................................................................................................................ 52
Annex. ................................................................................................................................................... 53
vi
CONTENTS (continued)
Page
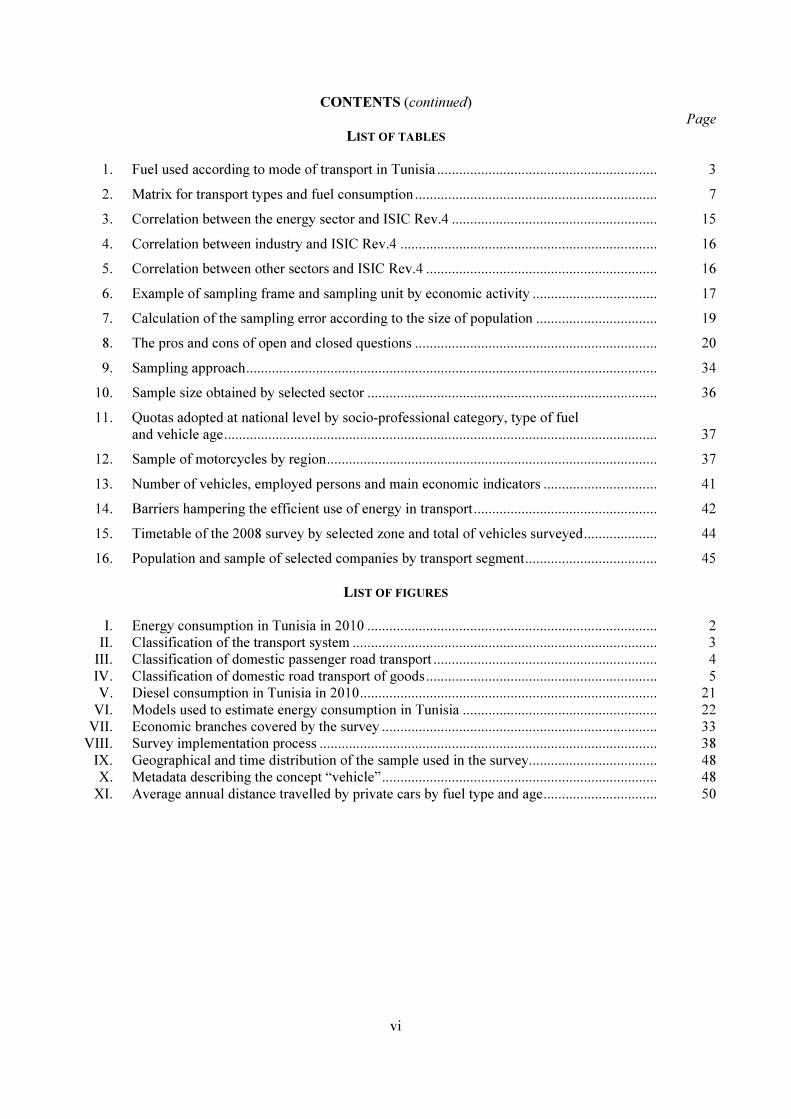
LIST OF TABLES
1. Fuel used according to mode of transport in Tunisia ............................................................ 3
2. Matrix for transport types and fuel consumption .................................................................. 7
3. Correlation between the energy sector and ISIC Rev.4 ........................................................ 15
4. Correlation between industry and ISIC Rev.4 ...................................................................... 16
5. Correlation between other sectors and ISIC Rev.4 ............................................................... 16
6. Example of sampling frame and sampling unit by economic activity .................................. 17
7. Calculation of the sampling error according to the size of population ................................. 19
8. The pros and cons of open and closed questions .................................................................. 20
9. Sampling approach ................................................................................................................ 34
10. Sample size obtained by selected sector ............................................................................... 36
11. Quotas adopted at national level by socio-professional category, type of fuel
and vehicle age ...................................................................................................................... 37
12. Sample of motorcycles by region .......................................................................................... 37
13. Number of vehicles, employed persons and main economic indicators ............................... 41
14. Barriers hampering the efficient use of energy in transport .................................................. 42
15. Timetable of the 2008 survey by selected zone and total of vehicles surveyed .................... 44
16. Population and sample of selected companies by transport segment .................................... 45
LIST OF FIGURES
I. Energy consumption in Tunisia in 2010 ............................................................................... 2
II. Classification of the transport system ................................................................................... 3
III. Classification of domestic passenger road transport ............................................................. 4
IV. Classification of domestic road transport of goods ............................................................... 5
V. Diesel consumption in Tunisia in 2010 ................................................................................. 21
VI. Models used to estimate energy consumption in Tunisia ..................................................... 22
VII. Economic branches covered by the survey ........................................................................... 33
VIII. Survey implementation process ............................................................................................ 38
IX. Geographical and time distribution of the sample used in the survey................................... 48
X. Metadata describing the concept “vehicle” ........................................................................... 48
XI. Average annual distance travelled by private cars by fuel type and age ............................... 50
vii
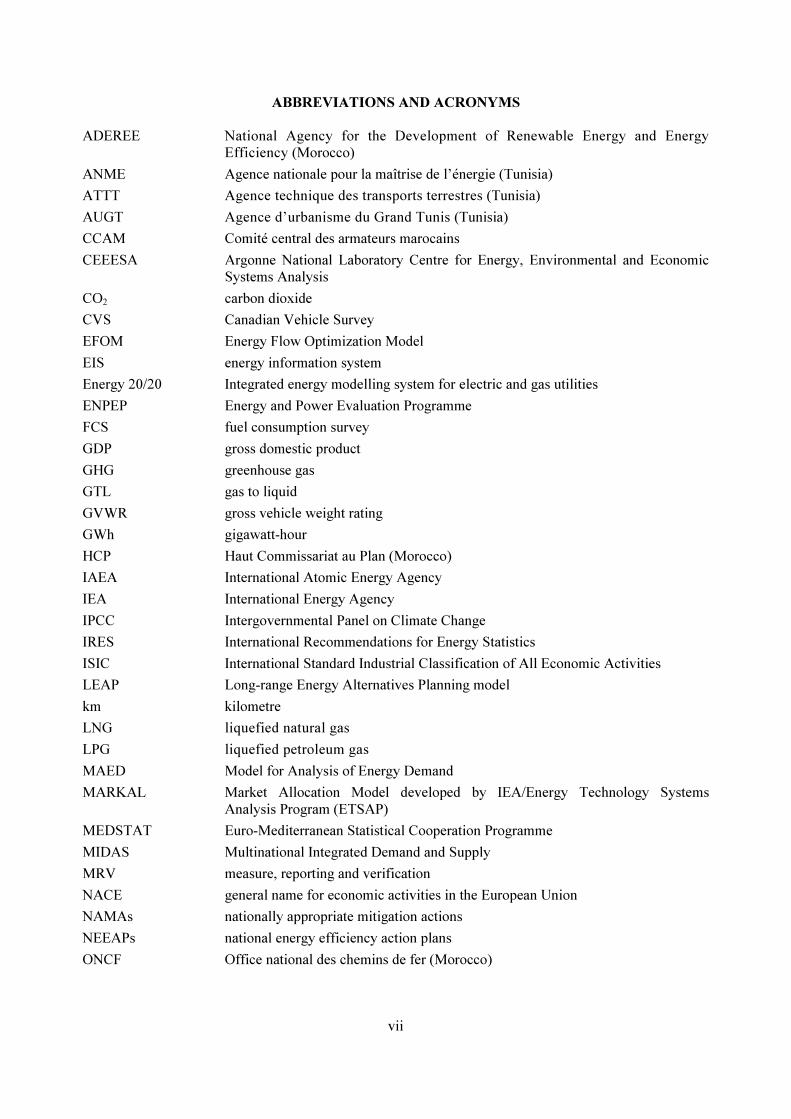
ABBREVIATIONS AND ACRONYMS
ADEREE National Agency for the Development of Renewable Energy and Energy
Efficiency (Morocco)
ANME Agence nationale pour la maîtrise de l’énergie (Tunisia)
ATTT Agence technique des transports terrestres (Tunisia)
AUGT Agence d’urbanisme du Grand Tunis (Tunisia)
CCAM Comité central des armateurs marocains
CEEESA Argonne National Laboratory Centre for Energy, Environmental and Economic
Systems Analysis
CO2 carbon dioxide
CVS Canadian Vehicle Survey
EFOM Energy Flow Optimization Model
EIS energy information system
Energy 20/20 Integrated energy modelling system for electric and gas utilities
ENPEP Energy and Power Evaluation Programme
FCS fuel consumption survey
GDP gross domestic product
GHG greenhouse gas
GTL gas to liquid
GVWR gross vehicle weight rating
GWh gigawatt-hour
HCP Haut Commissariat au Plan (Morocco)
IAEA International Atomic Energy Agency
IEA International Energy Agency
IPCC Intergovernmental Panel on Climate Change
IRES International Recommendations for Energy Statistics
ISIC International Standard Industrial Classification of All Economic Activities
LEAP Long-range Energy Alternatives Planning model
km kilometre
LNG liquefied natural gas
LPG liquefied petroleum gas
MAED Model for Analysis of Energy Demand
MARKAL Market Allocation Model developed by IEA/Energy Technology Systems
Analysis Program (ETSAP)
MEDSTAT Euro-Mediterranean Statistical Cooperation Programme
MIDAS Multinational Integrated Demand and Supply
MRV measure, reporting and verification
NACE general name for economic activities in the European Union
NAMAs nationally appropriate mitigation actions
NEEAPs national energy efficiency action plans
ONCF Office national des chemins de fer (Morocco)
viii
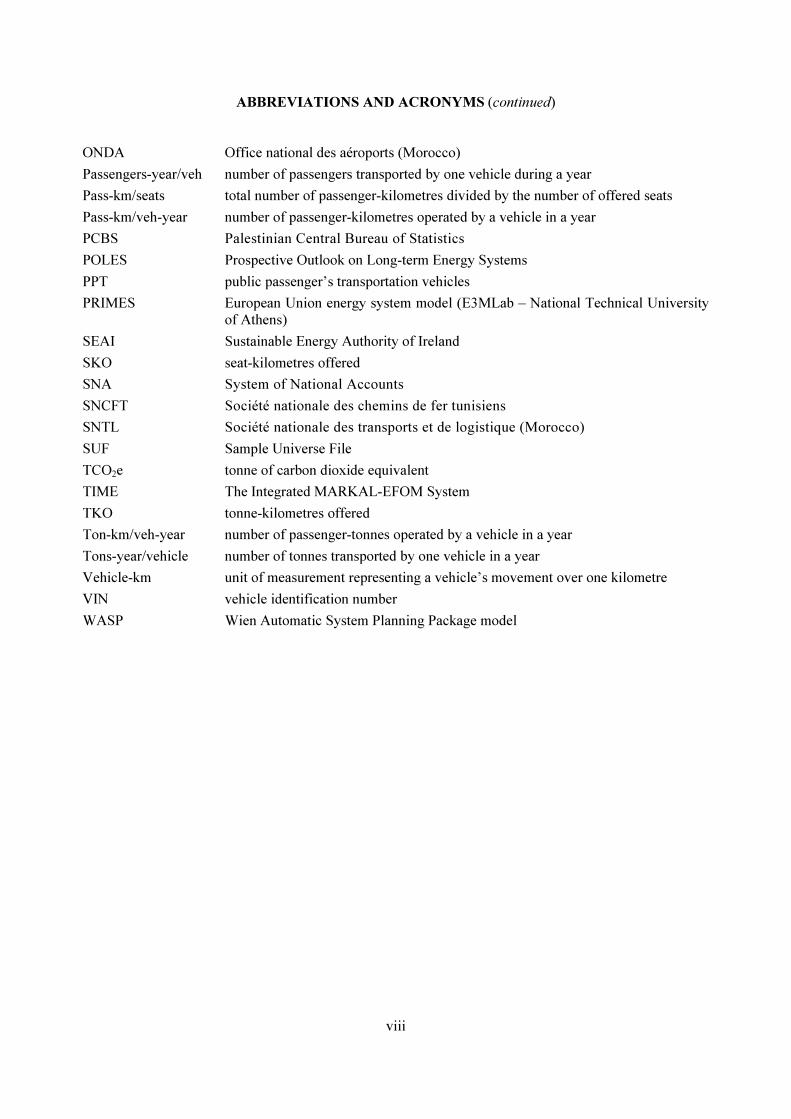
ABBREVIATIONS AND ACRONYMS (continued)
ONDA Office national des aéroports (Morocco)
Passengers-year/veh number of passengers transported by one vehicle during a year
Pass-km/seats total number of passenger-kilometres divided by the number of offered seats
Pass-km/veh-year number of passenger-kilometres operated by a vehicle in a year
PCBS Palestinian Central Bureau of Statistics
POLES Prospective Outlook on Long-term Energy Systems
PPT public passenger’s transportation vehicles
PRIMES European Union energy system model (E3MLab – National Technical University
of Athens)
SEAI Sustainable Energy Authority of Ireland
SKO seat-kilometres offered
SNA System of National Accounts
SNCFT Société nationale des chemins de fer tunisiens
SNTL Société nationale des transports et de logistique (Morocco)
SUF Sample Universe File
TCO2e tonne of carbon dioxide equivalent
TIME The Integrated MARKAL-EFOM System
TKO tonne-kilometres offered
Ton-km/veh-year number of passenger-tonnes operated by a vehicle in a year
Tons-year/vehicle number of tonnes transported by one vehicle in a year
Vehicle-km unit of measurement representing a vehicle’s movement over one kilometre
VIN vehicle identification number
WASP Wien Automatic System Planning Package model

ix
Executive summary
The design, implementation and monitoring of national energy policies require indicators on
energy consumption at the macro and sector levels. For developing countries, creating databases on
energy use and greenhouse gas (GHG) emissions will be a key factor in creating new funding
mechanisms for mitigation (such as Nationally Appropriate Mitigation Actions (NAMAs) and sectoral
mechanisms) being considered under the new international climate governance regime. Such
mechanisms will require measures, reporting and verification (MRV) systems. Similarly, such indicators
are crucial for assessing national energy efficiency action plans (NEEAPs) of members of the League of
Arab States. There is a particular need for systematized data collection on energy use in the transport
sector, for which defining and implementing energy efficiency policies is made especially complex by
the number of stakeholders, interest groups and operators, in addition to the prevailing lack of
information. The collection of such data will enhance understanding of the sector, enable assessment of
appropriate energy efficiency policies and programmes and allow projections of future consumption in
the light of measures that may be adopted by major stakeholders, including the State.
The purpose of the manual is to provide a starting point for those in government bodies responsible for
planning surveys; create a common understanding of terms and concepts; establish a common framework for
reviewing and evaluating final energy consumption surveys; and summarize regional experiences. It serves
as a reference on methodologies for data collection regarding energy use by the transport sector, as well as
providing models for estimation (supply and use) and case studies from Morocco, Palestine, Tunisia and
Canada.
Chapter I of the manual looks at standard transport organization in terms of stakeholders, mode of
transport and type of energy used. Chapter II explains commonly used methodologies for data collection in
the transport sector, focusing on road transport for passengers and goods. Chapter III looks in detail at survey
design, describing the principles requiring analysis in final transport energy consumption surveys and also
including a sample design for obtaining data on target variables. Sample questionnaires are contained in the
annex (part VI).
Chapter IV describes existing models for estimating energy statistics covering supply and demand, and
highlights, through widely used software, forecasting and planning details for the transport sector. In Chapter
V, case studies are presented from one developed country (Canada) and three Arab countries. Of the latter,
the Morocco case study includes all energy consumers in the transport sector, the Tunisia study looks at
transport companies and petrol stations, and the Palestine case study looks at the methodology used for the
survey of public transport companies.
The manual concludes with suggestions on obtaining energy use information in different sectors.

x
� �����ي�
�ه� ور��ه� و�� ����ات ��ل ا��ك ا����� ���' ا�&����ت ا��%��� $#"ن ا����� و �() *,ّ��-�2 ا�8,�ان ا������، -#93ّ و�� ��ا.� ا�8���7ت ا�)�0,/� $����6ام . .,1 ا�)&��ى ا�2,3 و.,1 �0�� ا�/��.�ت;
��ت �F-�ة ��)�-9 ا�&����ت وا��8ا�D ا��د;� إ�1 أ����ً� ا��;�@� .��ً اتا����� وا�087<�ت =�ز�G د�H-2 إ;�� ا�)��خ ّJ ر�>G K� L����ت ا�/��.���9M (ا��6�Nوا �ً��L ا�)O)� و%���2 �ّ' درا��� ;2 ا�) إ�Fاءات ا��6
��س واQ$غ وا��S/T. إ%�ر ا���Rم ا��و�2 ا�Q �-�Hدارة ��ون ا�)��خ/,� 'R7 )�د�,* ا.��ت ���Wا X�. وإّن ه
�� ه�X ا�)���ات $�وره� ا��ول ا�Z.Wء ;�0��F 2 ا��ول ا�$�0�� ;2 و�� ا�Y�6 ا��%��� ا�)�0,/� � [��آ3$��ءة ا����� .�,(. '�R� *&�3-2 و; ���] ���� ا�8���7ت ا�)�0,/� $����6ام ا����� ;2 ���ع ا��/9 أه)(H �
�ت ا���.,� . ا�)��/�Hًا إ�1 .�د ا��R7 �ً3$�# داد_- �/�;`.�اد ا�&����ت ا�)�0,/� 3$��ءة ا����� و �8�ت ا�)#J,� ا�)0��� $���Q;� إ�1 ا��/a ا��Tد ;2 ا�)0,���تHت وا��.�(H(وا� .'�R� وإّن ��(H ��,(.
3$��ءة ا�����، و-&)b $`.�اد ���' ��ى �ء�� اا�&����ت وا��8ا�D ا�)0��/ _�H-ا�/��ع و '; K&ّT- �7ت��ا�8 ،��&�Oا�� ���ت ا�)0�H)�ه� ا��2 �� 0�ا� �� إ�/�%�ت $#"ن ا��ك ا����� ;2 ا�)&�/98 ;2 ��ء ا���ا$
.$)� ;2 ذ�] ا��و��
� *���3�� ا�)&�و�� .K ا���6�Y �,�را��ت وا��ف �K ا�3�ّTت ا��@��� أ��س &���� $e ا�;�� �,�را��ت O���، و ���� ا�)(�,�Tت وا�)��ه�'، وو�� إ%�ر .)9 ��ّ�� �)�ا�0F ا�(�f ا��O�)/��gا
�� ا�)�0,/� $���ك ا�����، و ,6�a ا���Hرب .,1 �&��ى ا�)��/�O�)/��gا .�0F�� �/�� و-#93ّ ا�3��* و<�� ا�8���7ت ا�)�0,/� $����6ام ا����� ;2 ���ع ا��/9���ل ا�)(H 2; )�ة�ت ا�)0��Hآ)� -�;� 7)�ذج Q.�اد .
.ودرا��ت ���� .K ا�)�Jب و;,&��K و �k7 وآ��ا) $#"ن ا��0ض وا��,*(ا��/�-�ات
�l ا�. -/� ا�3�ّ�* ;2 [)&� ;(�ل � K� 9/�ع ا���� ��,3���0ض ;2 ا��(9 اWول ه; �,.���ت ا�H�� ا�8���7ت (H 2; 0)�ل��g�0 اO�#ت ا���Hوو��9O ا��/9 وأ�7اع ا����� ا�)&����6، و;2 ا��9) ا�27�M ا�(�
����ول . ا�)�0,/� $/��ع ا��/9، �� ا���آ�_ .,1 ا��/9 ا��8ي �,�آ�ب وا�&,�; *�أ�� ا��(9 ا�K� l��M ا�3�ّ،��O�)/��gا��را��ت ا '�() ��,(. 9�)����$ �0Fى ��ا�� �,�,T زم�0ض ا�)�8دئ ا��&�; ��O�ا�(�f ا��
�� ا�)�0,/� $���ك ا����� ;2 ���ع ا��/9O�)/��gرا�� . �,�را��ت ا�� '�() ���ّ. *�آ��] -/ّ�م ا�3�ّ��ات ا�)&��;�، و.ّ��� ا��8���7ت أدرK(� oF ا�)�;S ا��ا$�J�(�7ت ��ل ا����� ا�8(H�� ��O�)/��ا.
ا��(9 ا��ا$� �K ا�3�ّ�* .�ض �,�)�ذج ا�)0�)�ة ;2 إ.�اد /�-�ات إ�(�ءات ا����� ا��2 #)9 و;2 ��ت H��$ ���/9 $�ا�2 ���ع ا�; Y���ت ا����� وا���6,(. 9���� 1,. _�287�F ا��0ض وا��,*، و �آ
إ�1 $,� ��/�م ا��)� و-�0ض ا�3�ّ�* ;2 ا��(9 ا�k��6 أر$� درا��ت ����، ��ّ�ق إ��اه�. ���0O اg��0)�ل�ت ا�)&�,�3 )ه� آ��ا(Hا� ��و�1 .Wا L��� l�� ،��، وا��را��ت ا�Mث اW[�ى ���ول <<� $,�ان .�$
��H7�� .�� ��آ�ت ا��/9 و���Tت ا����د ;k7� 2، وا��M��M .�� ا�)��Mب، وا��J(/9 ;2 ا��2 ���ع ا�; ����,��Kا�)0�)�ة ;b&� 2 ��آ�ت ا��/9 ;2 ;,&�.
�� ا�8���7ت ا�)�0,/� $����6ام ا����� ;2 (H ا��ت ��ل��ا� �.�(H� 1إ� *� و-a,6 ا�3�ّ
�����.�ت ,�6�.
Introduction
Energy is crucial for development planning, particularly in member States of the Economic and Social
Commission for Western Asia (ESCWA). However, the quality of energy statistics in most ESCWA member
States should be improved so that requirements for national development planning and international
reporting are met.
Member States of ESCWA1 together accounted for 42.5 per cent of global oil reserves and 24 per cent
of natural gas reserves, according to 2011 statistics. They also accounted for 28.7 per cent of world crude oil
production and 13 per cent of natural gas production in 2011.2
Shortcomings in the availability and reliability of energy data in the Arab region underline the urgent
need to raise awareness, build capacity for data collection and harmonize definitions and the classification of
energy statistics.
Energy surveys are an essential method for providing data to improve energy and environment
management, especially in the context of climate change. ESCWA, in conjunction with the Euro-
Mediterranean Statistical Cooperation Programme (MEDSTAT), is seeking the cooperation of the Islamic
Development Bank to fund energy consumption surveys by national statistical offices of member States. This
will be an important component of the capacity-building process, providing improved indicators of trends
and measures that should be taken at the regional level.
The failure of many ESCWA member States to acquire primary data from surveys on energy supply
and use hampers the design of strategic policies for energy efficiency, the calculation of carbon dioxide
(CO2) emissions to mitigate climate change and sustainable development.
This training manual was prepared within the Development Account Project on Energy Statistics and
Balance in the ESCWA Region. It includes information on survey methodology, models for estimation
(supply and use), sample questionnaires, and case studies from three Arab countries (Morocco, Palestine and
Tunisia) and from one developed country (Canada).
1 ESCWA member States are the following: Bahrain; Egypt; Iraq; Jordan; Kuwait; Lebanon; Libya; Morocco; Oman; State
of Palestine; Qatar; Saudi Arabia; Sudan; Syrian Arab Republic; Tunisia; United Arab Emirates; and Yemen.
2 ESCWA, Statistical Abstract of the ESCWA Region, Issue No. 31 (2011, E/ESCWA/SD/2011/7).
I. STANDARD TRANSPO
A. CLASSIFICATION OF THE
The transport sector can be divided into two subsectors, which we will call the “
“organized” subsectors. The former includes
and ministries and vehicles run by
major obstacles to the design of energy efficiency policy:
activities, and the lack of data on such factors as
(gasoline, diesel or liquefied petroleum gas (
calculate energy consumption is through
goods and passenger transportation performed by companies
regulations. Its organized nature makes th
as information may be directly collected from companies or
B. CLASSIFICATION OF THE
Energy consumption in the transport sector can be
road), as in figure I, which takes Tunisia as an example
Figure I
Source: National Energy Conservation Agency (ANME
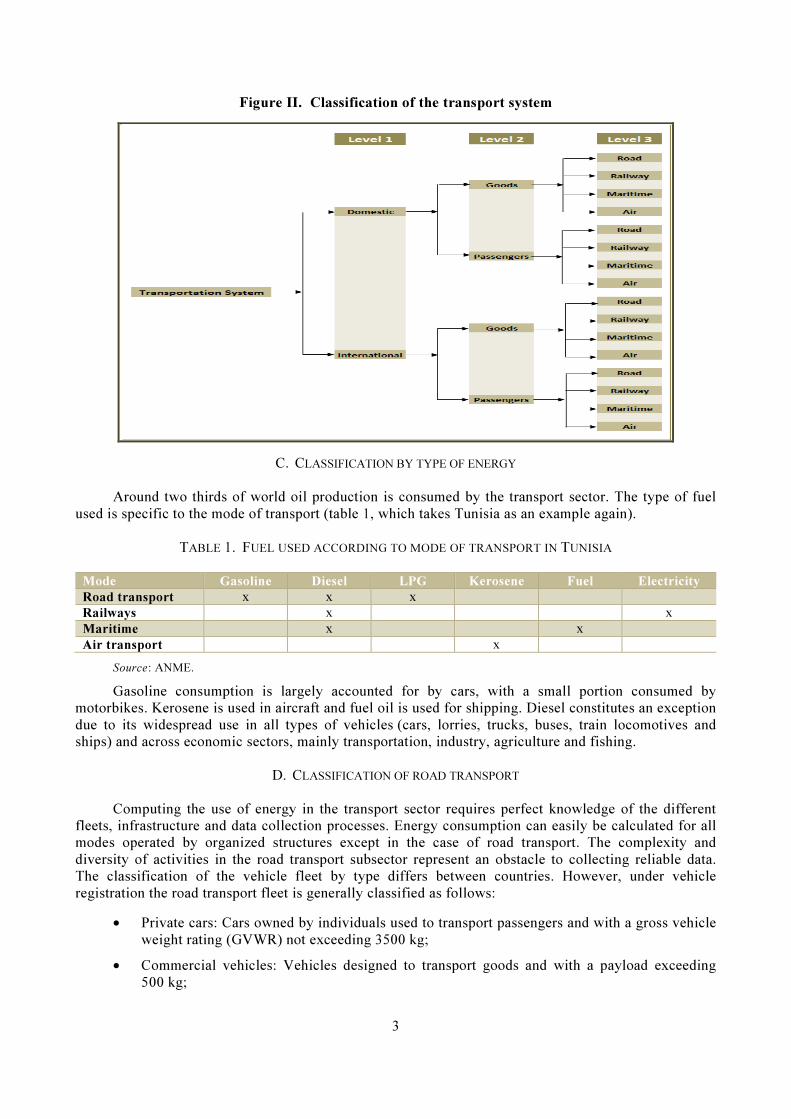
The transport sector is characterized by great diversity in terms of vehicle fleets and activities.
The transportation system can be broken down into three levels
• The territory covered: domestic or international
• The nature of the activity:
• The mode of transportation: ground
More detailed analysis takes into account the characteristics of each transportation mode,
corresponding activities and the field of operation.
2
I. STANDARD TRANSPORT ORGANIZATION
LASSIFICATION OF THE TRANSPORT SECTOR BY TYPE OF ACTORS
he transport sector can be divided into two subsectors, which we will call the “
sectors. The former includes private cars, taxi companies, cars operated by the Government
private companies for business purposes. Its loose
the design of energy efficiency policy: the large number of operators and their diverse
on such factors as vehicle composition and age, type of
liquefied petroleum gas (LPG)) and the downgrading rate.
calculate energy consumption is through targeted surveys. The latter subsector
goods and passenger transportation performed by companies under the country’s
makes the collection of data and calculation of energy consumption
as information may be directly collected from companies or regulatory institutions.
LASSIFICATION OF THE TRANSPORT SECTOR BY MODE
Energy consumption in the transport sector can be categorized by mode: air, sea and land (rail and
, which takes Tunisia as an example.
Figure I. Energy consumption in Tunisia in 2010
: National Energy Conservation Agency (ANME - Agence nationale pour la maîtrise de
is characterized by great diversity in terms of vehicle fleets and activities.
can be broken down into three levels:
: domestic or international;
ature of the activity: goods or passengers;
he mode of transportation: ground (road and rail), maritime or air.
More detailed analysis takes into account the characteristics of each transportation mode,
corresponding activities and the field of operation.
TYPE OF ACTORS
he transport sector can be divided into two subsectors, which we will call the “individual” and
private cars, taxi companies, cars operated by the Government
loose nature presents two
the large number of operators and their diverse
age, type of fuel used
downgrading rate. The only way to
subsector includes all types of
the country’s internal transport
e collection of data and calculation of energy consumption simpler,
air, sea and land (rail and
Agence nationale pour la maîtrise de l’énergie).
is characterized by great diversity in terms of vehicle fleets and activities.
More detailed analysis takes into account the characteristics of each transportation mode,
3
Figure II. Classification of the transport system
C. CLASSIFICATION BY TYPE OF ENERGY
Around two thirds of world oil production is consumed by the transport sector. The type of fuel
used is specific to the mode of transport (table 1, which takes Tunisia as an example again).
TABLE 1. FUEL USED ACCORDING TO MODE OF TRANSPORT IN TUNISIA
Mode Gasoline Diesel LPG Kerosene Fuel Electricity
Road transport x x x
Railways x x
Maritime x x
Air transport x
Source: ANME.
Gasoline consumption is largely accounted for by cars, with a small portion consumed by
motorbikes. Kerosene is used in aircraft and fuel oil is used for shipping. Diesel constitutes an exception
due to its widespread use in all types of vehicles (cars, lorries, trucks, buses, train locomotives and
ships) and across economic sectors, mainly transportation, industry, agriculture and fishing.
D. CLASSIFICATION OF ROAD TRANSPORT
Computing the use of energy in the transport sector requires perfect knowledge of the different
fleets, infrastructure and data collection processes. Energy consumption can easily be calculated for all
modes operated by organized structures except in the case of road transport. The complexity and
diversity of activities in the road transport subsector represent an obstacle to collecting reliable data.
The classification of the vehicle fleet by type differs between countries. However, under vehicle
registration the road transport fleet is generally classified as follows:
• Private cars: Cars owned by individuals used to transport passengers and with a gross vehicle
weight rating (GVWR) not exceeding 3500 kg;
• Commercial vehicles: Vehicles designed to transport goods and with a payload exceeding
500 kg;
4
• Trucks: Vehicles designed to transport goods and with a full payload not exceeding 3500 kg;
• Mixed cars: Engine-driven vehicles designed to transport passengers and goods, with a
payload not exceeding 3500 kg, and the number of seats, including the driver’s, ranging
between four and nine;
• Lorries: Vehicles used to transport goods;
• Buses or public passenger transport (PPT): Vehicles with more than nine seats and designed
for public transport of passengers;
• Road tractors: Engine-driven vehicles that can be combined with trailers, bearing part of the
overall weight;
• Agricultural tractors: Self-propelled vehicles designed to pull or operate machines commonly
used in agriculture.
When calculating the energy used by the transport sector, only vehicles transporting goods and
passengers are considered.
1. Road passenger transport
There are two main categories of road passenger transport:
• Individual transportation: Motorbikes or cars with fewer than nine seats (including the
driver’s) for private or public use;
• Collective transportation: Vehicles with more than nine seats.
Taking Tunisia as an example, the categories of domestic passenger transport can be broken down
as shown in figure III.
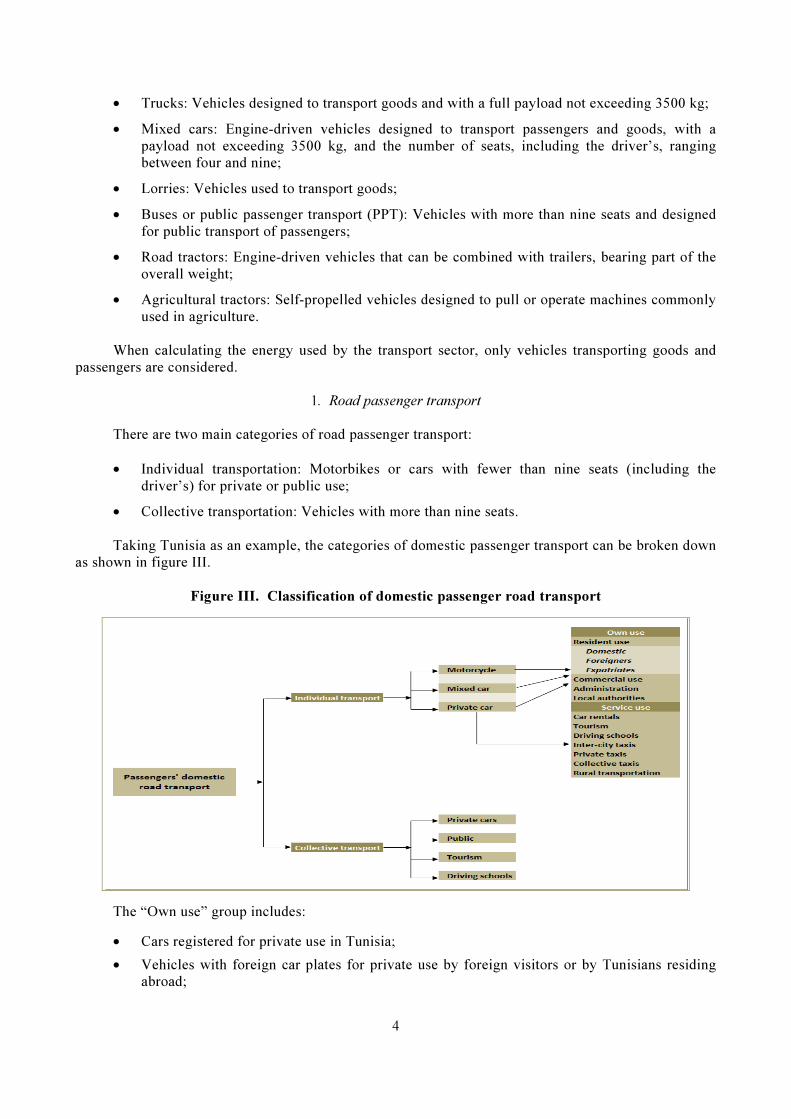
Figure III. Classification of domestic passenger road transport
The “Own use” group includes:
• Cars registered for private use in Tunisia;
• Vehicles with foreign car plates for private use by foreign visitors or by Tunisians residing
abroad;
5
• Vehicles for commercial use by companies;
• Vehicles used by administrations and local communities. The “Service use” group includes:
• Car rental companies;
• Tourism transport companies;
• Driving schools;
• Limousines;
• Private taxis;
• Collective taxis;
• Inter-city taxis;
• Rural taxis. Collective transportation is generally broken down into four categories:
• Vehicles used for transportation generally offered by private commercial companies or
associations;
• Vehicles used for public transport (non-profit);
• Vehicles used by travel agencies to transport tourists;
• Vehicles operated by driving schools.
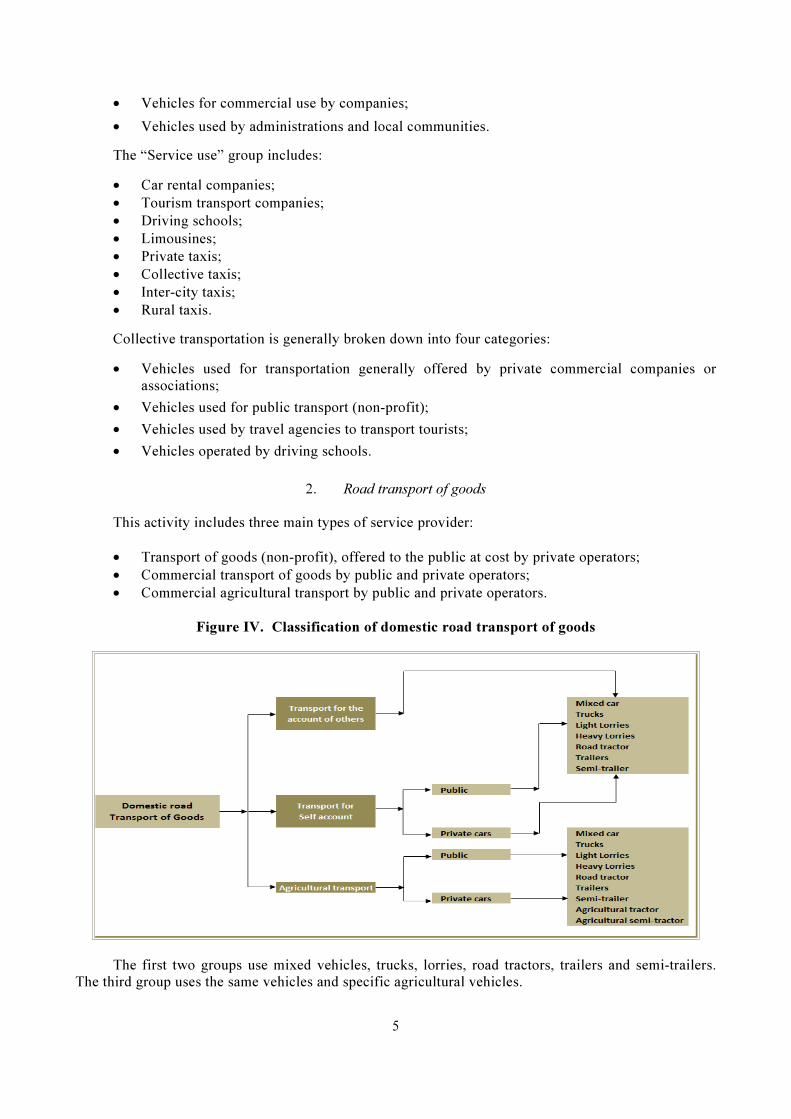
2. Road transport of goods
This activity includes three main types of service provider:
• Transport of goods (non-profit), offered to the public at cost by private operators;
• Commercial transport of goods by public and private operators;
• Commercial agricultural transport by public and private operators.
Figure IV. Classification of domestic road transport of goods
The first two groups use mixed vehicles, trucks, lorries, road tractors, trailers and semi-trailers.
The third group uses the same vehicles and specific agricultural vehicles.

6
E. TRANSPORT SECTOR STAKEHOLDERS
The many stakeholders across the transport sector at times have conflicting objectives, which
creates obstacles to achieving more efficient use of energy. Planning considerations include not only
transport policy itself, but also infrastructure (roads), urban planning and territorial development. Major
stakeholders in the transport sector include the ministry for transport (and its attendant departments for
ground transport, shipping, civil aviation, technical inspection and car registration); other ministries
(such as for the environment, territorial planning, development and energy); local communities; public
and private transport operators; and oil product distribution companies. Difficulties in collecting data
have led some countries to establish special agencies to coordinate data collection and energy sector
initiatives. Such structures include energy control agencies (such as ANME in Tunisia or the National
Agency for the Development of Renewable Energy and Energy Efficiency (ADEREE) in Morocco),
transport observatories in charge of collating and managing transport sector data, and transport
authorities at the city and regional levels, which work to coordinate public transport and implement
development policies.
7
II. DATA COLLECTION METHODOLOGIES FOR THE TRANSPORT SECTOR
A. BACKGROUND
Successful implementation of a development strategy to ensure energy efficiency depends on the
availability of pertinent data in a range of categories, including:
(a) Macroeconomic statistics covering several years on the demographic, economic and social
context in which transport policy is to be implemented;
(b) Capacity of the transport system to meet the needs of the various economic sectors;
(c) Quantitative data on transport needs, used to assess the efficiency and progress of activities and to
monitor transport policies and energy efficiency;
(d) Energy and environment indicators, which can trigger modifications in energy efficiency policy
with regard to transport.
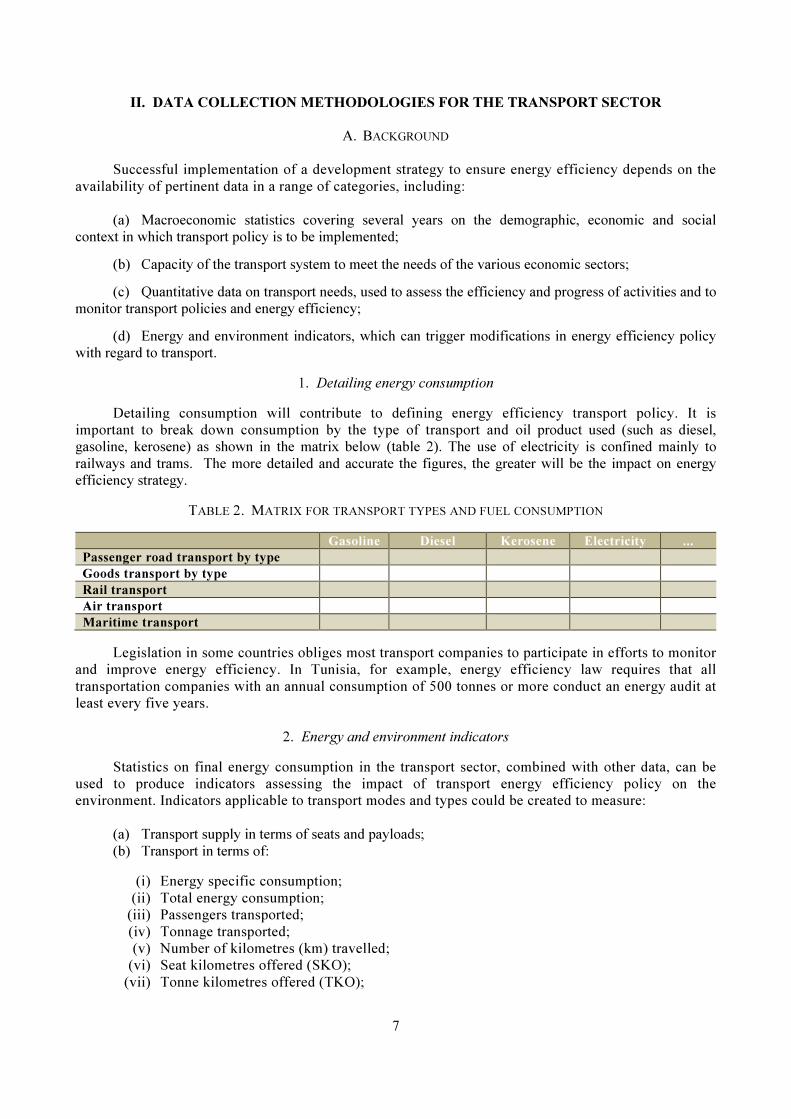
1. Detailing energy consumption Detailing consumption will contribute to defining energy efficiency transport policy. It is
important to break down consumption by the type of transport and oil product used (such as diesel,
gasoline, kerosene) as shown in the matrix below (table 2). The use of electricity is confined mainly to
railways and trams. The more detailed and accurate the figures, the greater will be the impact on energy
efficiency strategy.
TABLE 2. MATRIX FOR TRANSPORT TYPES AND FUEL CONSUMPTION Gasoline Diesel Kerosene Electricity ...
Passenger road transport by type
Goods transport by type
Rail transport
Air transport
Maritime transport Legislation in some countries obliges most transport companies to participate in efforts to monitor
and improve energy efficiency. In Tunisia, for example, energy efficiency law requires that all
transportation companies with an annual consumption of 500 tonnes or more conduct an energy audit at
least every five years.
2. Energy and environment indicators Statistics on final energy consumption in the transport sector, combined with other data, can be
used to produce indicators assessing the impact of transport energy efficiency policy on the
environment. Indicators applicable to transport modes and types could be created to measure:
(a) Transport supply in terms of seats and payloads;
(b) Transport in terms of: (i) Energy specific consumption;
(ii) Total energy consumption;
(iii) Passengers transported;
(iv) Tonnage transported;
(v) Number of kilometres (km) travelled;
(vi) Seat kilometres offered (SKO);
(vii) Tonne kilometres offered (TKO);
8
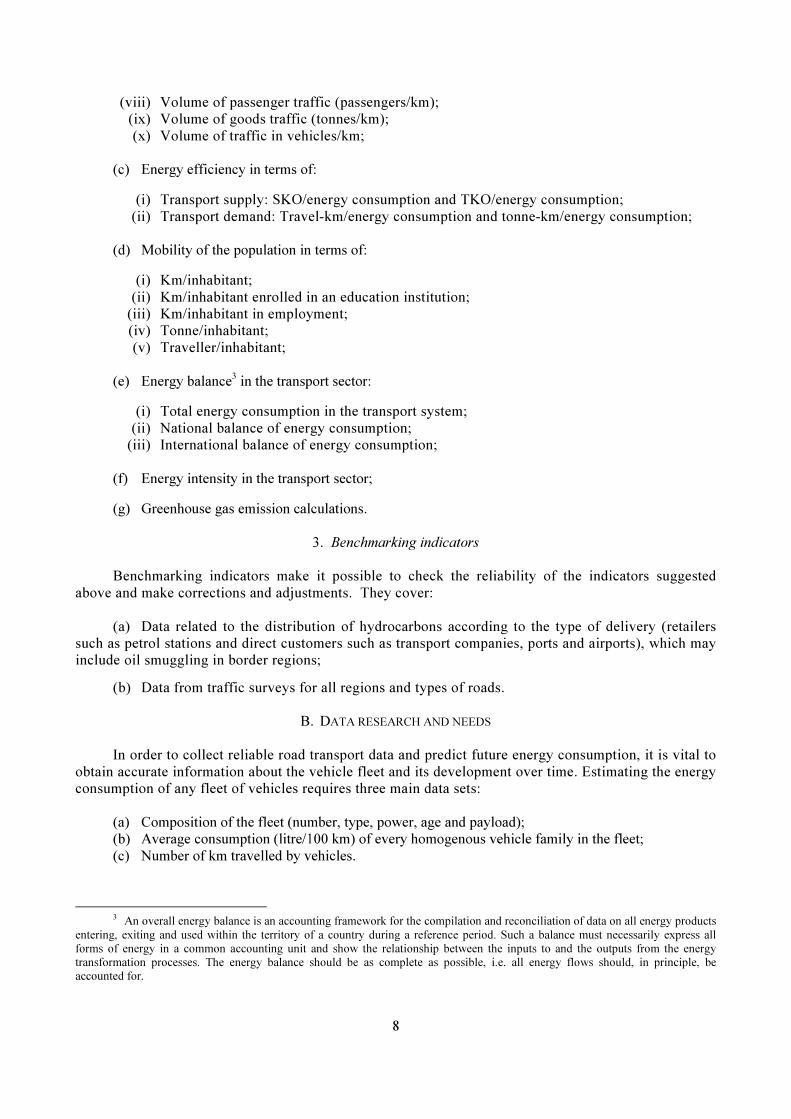
(viii) Volume of passenger traffic (passengers/km);
(ix) Volume of goods traffic (tonnes/km);
(x) Volume of traffic in vehicles/km;
(c) Energy efficiency in terms of: (i) Transport supply: SKO/energy consumption and TKO/energy consumption;
(ii) Transport demand: Travel-km/energy consumption and tonne-km/energy consumption;
(d) Mobility of the population in terms of: (i) Km/inhabitant;
(ii) Km/inhabitant enrolled in an education institution;
(iii) Km/inhabitant in employment;
(iv) Tonne/inhabitant;
(v) Traveller/inhabitant;
(e) Energy balance3 in the transport sector:
(i) Total energy consumption in the transport system;
(ii) National balance of energy consumption;
(iii) International balance of energy consumption;
(f) Energy intensity in the transport sector; (g) Greenhouse gas emission calculations.
3. Benchmarking indicators
Benchmarking indicators make it possible to check the reliability of the indicators suggested
above and make corrections and adjustments. They cover:
(a) Data related to the distribution of hydrocarbons according to the type of delivery (retailers
such as petrol stations and direct customers such as transport companies, ports and airports), which may
include oil smuggling in border regions;
(b) Data from traffic surveys for all regions and types of roads.
B. DATA RESEARCH AND NEEDS
In order to collect reliable road transport data and predict future energy consumption, it is vital to
obtain accurate information about the vehicle fleet and its development over time. Estimating the energy
consumption of any fleet of vehicles requires three main data sets:
(a) Composition of the fleet (number, type, power, age and payload);
(b) Average consumption (litre/100 km) of every homogenous vehicle family in the fleet;
(c) Number of km travelled by vehicles.
3 An overall energy balance is an accounting framework for the compilation and reconciliation of data on all energy products
entering, exiting and used within the territory of a country during a reference period. Such a balance must necessarily express all
forms of energy in a common accounting unit and show the relationship between the inputs to and the outputs from the energy
transformation processes. The energy balance should be as complete as possible, i.e. all energy flows should, in principle, be
accounted for.

9
Collecting such data is made difficult by the multiplicity of consumers and the variety of fleet
structures. Three key elements should be borne in mind when assessing consumption:
(a) Cars, trucks and lorries should be assessed separately;
(b) Changes in fleet composition should take account of the type of fuel, the fiscal power category or
payload (capacity);
(c) The number of vehicles retired from circulation or wrecked should be taken into account. This
type of data is usually not well known by the authorities and may skew the assessment of energy
consumption.
Some countries have set up simple information systems to monitor the development of fleets over
time and their energy performance. Such systems represent a reliable source of information from
recognized institutions. A final energy consumption survey of the transport sector would then highlight
missing and unreliable data.
C. COLLECTION OF ENERGY USE DATA
Some data on transport energy consumption may be gleaned from administrative records, such as
those held by ministries of transport and energy, energy observatories and statistics institutes, transport
company registers and specific surveys. Since such information is often inadequate, field surveys are
required to set the baseline and validate data, and thereby to develop local indicators and design
appropriate energy efficiency plans. However, surveys are usually expensive and data must be handled
according to established methods in order to produce realistic statistics.
1. Official sources of information: Administrative records and business registers
Official data may be obtained from the following sources:
(a) Insurance companies and federations holding data on insured vehicles;
(b) Transport operators;
(c) Ministry of energy statistics on the sale of hydrocarbons;
(d) Hydrocarbons distribution companies;
(e) Ministries (such as for housing, urban planning or territorial development) holding data on road
infrastructure and traffic;
(f) National statistical offices;
(g) Studies and surveys containing updated data validated by public institutions;
(h) Specific surveys.
2. Specific surveys
Several types of survey may be conducted:
(a) Field work
Collecting data in the field (such as at highway toll booths, technical inspection centres, petrol
stations, lobbies in specific buildings) is the preferred method for collating data on traffic
(origins/destinations and density), the characteristics of vehicles and goods, and other related
information.

10
(b) Postal survey
This method is generally preferred when the sample is large and data sought are mainly
quantitative. Posted questionnaires should be straightforward in order to achieve acceptable response
rates.
(c) Phone surveys
This method is used for mixed questionnaires (quantitative and qualitative). A good deal of
information can be obtained at low cost this way, but it requires the availability of respondents.
(d) Face-to-face
This method enables the collection of qualitative data mainly related to practices. It cannot be
exhaustive as it is highly time-consuming.
(e) Internet-based surveys
This method remains difficult due to problems with access to respondents’ email addresses.
11
III. SURVEY DESIGNS
A. BACKGROUND
According to the International Recommendations for Energy Statistics (IRES), it is necessary to sketch
the production, supply, transformation and consumption flows for each type of fuel, in order to clarify the
processes and agents involved. Potential data sources for each stage of the flow should be identified in order
to determine what data can be obtained from industries and organizations producing energy, administrative
sources and regular enterprise/establishment surveys, and to plan accordingly.
The importance of using an international standard to obtain reliable statistics is clear from the
observations of regional and international organisations. For instance, the MEDSTAT regional programme
helped develop a comprehensive approach to energy statistics in Mediterranean partner countries, in
particular for the development of energy balances. The harmonization of statistics is crucial for their use at
the national and regional levels and to ensure consistency with other data.
The calculation of indicators for energy efficiency and greenhouse gas (GHG) emissions is essentially
based on energy balances, thereby providing a common basis for comparison between different countries.
The work of the International Energy Agency (IEA) on indicators for energy efficiency and CO2 emissions,
and that of the Intergovernmental Panel on Climate Change (IPCC) on GHG emissions, stems from national
energy balances.
1. What are the main issues? The unreliability of available data, lack of metadata and data gaps in the areas of renewable energy and
final energy consumption impede the compilation of energy balance figures. Data are mostly obtained from
the supply side. Road transport statistics available in some Arab countries mainly concern gas/diesel oil and
are not disaggregated by usage (residential, industrial, agriculture or others). The air transport sector reports
only the total amount of fuel consumed, without providing separate figures for consumption in domestic and
international flights. The same applies for shipping (domestic and international) and the fishing sector (which
comes under the category of agriculture). Information is also generally lacking on the amount of fuel and
electricity used in compressors, pumping stations and oil and gas pipelines. It is possible to estimate consumption by type of use only through surveys of consumers or fuel
suppliers (such as petrol stations) and by classifying shipments by economic activity or end consumer. Such
surveys are, however, not always carried out. The gaps in data collection also reflect a lack of technical
expertise, human resources and funds.
2. What can be done?
A two-stage plan could be implemented to tackle the issue. Technical missions could help to establish
harmonized energy balances, which in turn would contribute to the production of energy tables and assist
with the analysis of problems, in particular those related to the estimation of final energy consumption.
Surveys could be designed to produce harmonized, reliable and timely data.
B. BENEFITS OF HARMONIZING WORK ON TRANSPORT ENERGY CONSUMPTION SURVEYS
Harmonizing work on transport energy consumption surveys will lend scientific credibility to energy
statistics:
(a) By applying a harmonized method for the collection of data based on international standards;
(b) By allowing comparison with extant sales statistics and business structure surveys based on the
International Standard Industrial Classification of All Economic Activities (ISIC);

12
(c) By developing long-term coefficients for estimating fuel consumption based on the structure of
the transport sector;
(d) By improving the quality of national energy balances (replacing estimates with survey results);
(e) By strengthening the comparability of data and energy indicators.
The results of such surveys will enable national statistical institutes and their partners:
(a) To improve the business structure survey by integrating new variables and improving the
response rate;
(b) To justify the periodic renewal of the survey (every five years, for example) under the supervision
of the national statistical office or equivalent;
(c) To mobilize technical and financial resources and raise awareness of the importance of
energy statistics.
1. Scope of the survey
An energy consumption survey on the transport sector should look at all types of consumption and
transport regardless of the economic activity (including residential, industrial, commercial and agricultural
activities). The main energy products covered should include gasoline, gas/diesel oil, jet fuel, LPG (liquefied
petroleum gas), LNG (liquefied natural gas) and electricity.
2. Objectives
The main objectives of the survey are the following:
(a) Determine the final consumption of energy in the transport sector for all stakeholders;
(b) Calculate the energy efficiency indicators for the transport sector;
(c) Assist in estimating GHG emissions from the transport sector;
(d) Develop forecasts based on energy demand in the transport sector;
(e) Provide stakeholders with reliable statistics on energy consumption in the transport sector;
(f) Provide energy balance data on the transport sector;
(g) Develop better energy policies.
C. SURVEY STAGES The survey could be divided into the following five phases:
Phase 1. Status and diagnostic
A set of activities should be undertaken at the first phase of the survey, including:
• Defining the scope and format of the survey;
• Ensuring that the survey will include sufficient data to meet its objectives;
• Assessing existing data;
• Studying the needs of the national office responsible for energy statistics and its partners.
Phase 2. Preparation of the survey A detailed methodology should be prepared for the survey, including:
• The organizational setting and the scope of each type of transport activity;
• An instruction manual for interviewers and supervisors;

13
• Classifications and other supporting documents and reports;
• For each type of activity and transport, the following should be considered:
o Planning operations;
o Target population and size of sample by stratum structure and margin of error for each
stratum;
o Procedures for determining the sample frames and sampling method;
o Design of the questionnaire;
o Statistics options (such as variables, extrapolations and framing);
o Recovery methods.
Phase 3. Fieldwork
Before starting the survey, a pilot survey should be performed and its results assessed in coordination
with the body in charge of the work, in order to make the necessary adjustments so that the survey runs
smoothly. A detailed report of the pilot survey should be submitted to the body concerned.
Interviews for the survey itself are then conducted and/or questionnaires are sent to respondents. The
completeness of the sample should also be verified. An outcome report of the fieldwork stage should address
the degree of implementation of the survey, difficulties encountered and possible solutions, and proposals for
statistical analysis.
Phase 4. Statistical analysis Various steps are followed during the fourth phase:
• Vetting of questionnaires (encoding validation, consistency, etc.);
• Data entry;
• File clearance (removal of inconsistencies) and data cleaning;
• Treatment of non-response;
• Extrapolation of results and possible recovery;
• Outline of metadata: information about the method used;
• Analysis of statistical tables obtained;
• Assembly of result tables, preliminary interpretation and dissemination of results. Phase 5. Final report and evaluation
The final phase involves presenting a final report of findings and recommendations.
D. SIGNIFICANT VARIABLES
1. Transport as an economic activity
As recommended by ISIC, military vehicles and equipment shall not be included in the survey. In
order to meet the objectives of this survey, the following breakdown will be required:
(a) Land transport
Land transport includes rail (with a distinction between passenger and freight trains) and road
transport. In the latter case, distinctions should be made for passenger transport (private and public) and the
transport of goods. Further distinctions should be made according to vehicle type. These distinctions affect
the stratification and the content of questionnaires.

14
(i) Passenger transport
a. Public transport: This mainly refers to public passenger transport in urban areas. A
distinction should be made between publicly and privately owned companies;
b. Professionals: This refers to small and large taxis with a license issued by the relevant
administrative body for city or intercity transport;
c. Transport companies: Represented by all actors engaged in structured intercity public
transport.
(ii) Transport of goods
These are businesses and carriers engaged in the carriage of goods for third parties.
(b) Air transport
A distinction should be made between domestic and international aviation and defined according to
the location of departure and arrival points, not by the nationality of the airline.
(c) Maritime transport
The survey should distinguish between inland and international shipping, which will be determined by
port of departure and port of arrival, and not by the flag or nationality of the ship. Fuel consumed by fishing
vessels is covered under agricultural energy consumption.
2. Residential sector
The residential sector refers to vehicles owned by households. This transport category will be studied
by survey petrol station customers. The choice of petrol stations will take into account their location (for
instance, city, highway or tollway). The seasonal nature of this activity (holidays) should also be taken into
account. Data collected will be disaggregated by vehicle type and age and the type of fuel used.
3. Other sectors
A sample of firms should be surveyed for each of the following economic sectors. Only energy
consumed for the transport activity in these units will be considered.
(a) Energy sector: The survey will detail energy consumed in the distribution of energy products;
(b) Industrial sector: The survey will be conducted according to a stratified sampling based on the
segmentation of the company's activity branch (business register);
(c) Services sector: In addition to stratification by size, it is important to distinguish between
activities such as administration, hotels, hospitals, education, retail, tourism and car rental outlets.
Companies distributing petroleum products are included in this section;
(d) Agriculture: The size of each operation and main crops will be noted.
E. SAMPLE DESIGN
Final energy consumption surveys are conducted by means of sampling. A small and representative
collection of statistical units are selected from a global population and used to determine the consumption of
that population. This approach saves resources (human, financial and time) and produces results with known
accuracy that can be calculated mathematically.

15
It is essential to follow several steps in the selection of the sample:
(a) Define the target population;
(b) Specify a sampling frame (criteria and parameters need to be defined);
(c) Specify a method for selecting items or events from the frame;
(d) Determine the sample size;
(e) Implement the sampling plan;
(f) Select the type of sampling;
(g) Run a pilot survey to test and amend the sampling plan;
(h) Sampling;
(i) Data collecting.
1. Definition of target population At the preliminary stage, it is important to define the target population clearly. Efficient data collection
requires a sound knowledge of the main groups of data reporters. In this case, at least three groups should
be identified: energy industries, other energy producers and energy consumers. The target population for
a survey on final transport energy consumption includes all energy users for transportation purposes.
(a) Energy and other industries All businesses engaged in economic activity and which belong to the following branches or groups of
branches described in detail in ISIC. Countries should identify, as far as feasible, groups of energy
consumers as set out in the following tables in accordance with ISIC Rev.4, which in turn facilitates linkage
with national nomenclature, data collection and integration of the basic data with other statistics.
(i) Energy industries
TABLE 3. CORRELATION BETWEEN THE ENERGY SECTOR AND ISIC REV.4 Energy industry groups Correlation to ISIC Rev. 4
Electricity and heat plants Division 35 -Electricity, gas, steam and air conditioning supply
Pumped storage plants
Coal mines Division 05 - Mining of coal and lignite
Coke ovens Group 191 - Manufacture of coke oven products
Coal liquefaction plants Class 1920 - Manufacture of refined petroleum products
Patent fuel plants Class 1920 - Manufacture of refined petroleum products
Brown coal briquette plants Class 1920 - Manufacture of refined petroleum products
Gas works (and other conversion to gases) Class 3520 - Manufacture of gas: distribution of gaseous fuels through mains
Gas separation plants Division 06 – Extraction of crude petroleum and natural gas
Gas to liquid (GTL) plants Class 1920 – Manufacture of refined petroleum products
LNG plants/regasification plants Class 0910 - Support activities for petroleum and natural gas extraction Class 5221 - Service activities incidental to land transportation
Blast furnaces Class 2410 - Manufacture of basic iron and steel
Oil and gas extraction Division 06 - Extraction of crude petroleum and natural gas Class 0910 – Support activities for petroleum and natural gas extraction
Oil refineries Division 19 - Manufacture of coke and refined petroleum products
Charcoal plants Class 2011 - Manufacture of basic chemicals
Biogas production plants Class 3520 - Manufacture of gas; distribution of gaseous fuels through mains
Nuclear fuel extraction and fuel processing Class 0721 - Mining of uranium and thorium ores Class 2011 - Manufacture of basic chemicals
Other energy industry not elsewhere specified Class 0892 – Extraction of peat
16
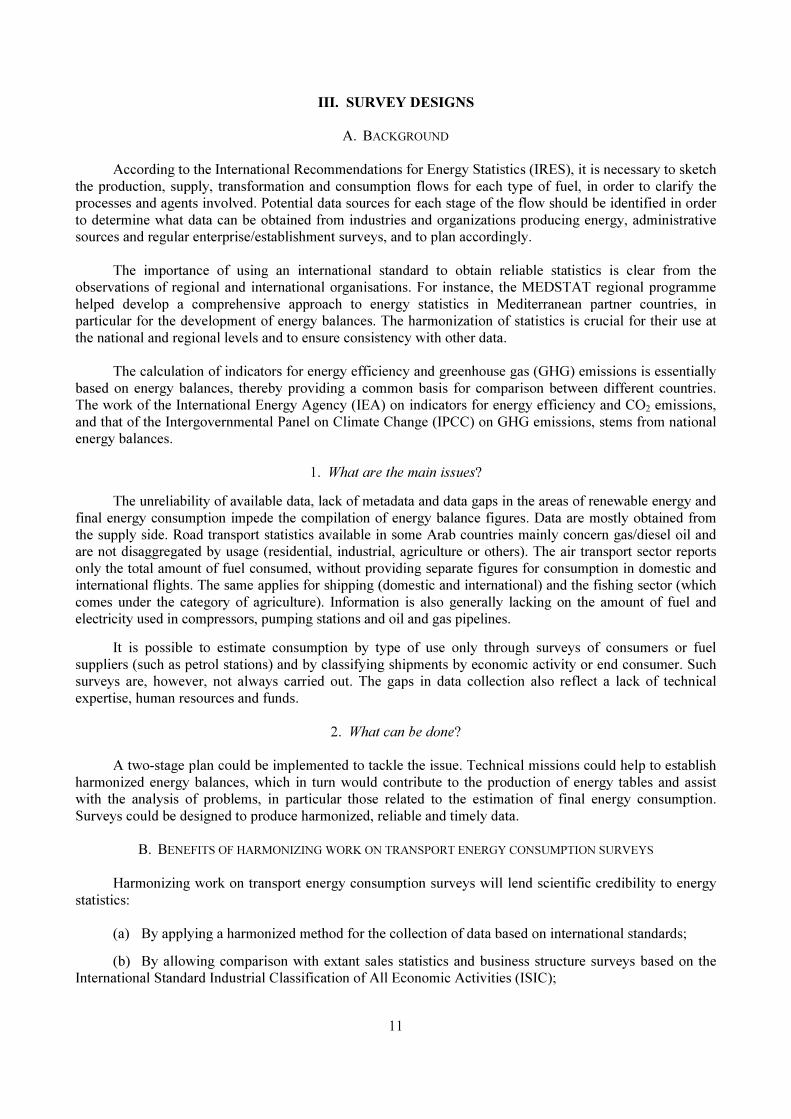
(ii) Other industries
TABLE 4. CORRELATION BETWEEN INDUSTRY AND ISIC REV.4
Industry Correlation to ISIC Rev. 4
Iron and steel Group 241 and Class 2431 - Consumption in coke ovens and blast furnaces are defined as part of Transformation Processes and Energy Industry Own Use
Chemical and petrochemical
Divisions 20 and 21 - Consumption by plants manufacturing charcoal or enriching/producing nuclear fuels (found in ISIC 2011) is excluded, as these plants are considered part of the energy industries
Non-ferrous metals Group 242 and Class 2432
Non-metallic minerals Division 23 - Glass, ceramic, cement and other building materials industries
Transport equipment Divisions 29 and 30.
Machinery Divisions: 25, 26, 27 and 28 - Fabricated metal products, machinery and equipment other than transport equipment
Mining and quarrying Divisions 07 and 08 and Group 099 - Excludes the mining of uranium and thorium ores (Class 0721) and the extraction of peat (Class 0892)
Food and tobacco Divisions 10, 11 and 12
Paper, pulp and print Divisions 17 and 18 - Includes production of recorded media
Wood and wood products (Other than pulp and paper) Division 16
Textile and leather Divisions 13, 14 and 15
Construction Divisions 41, 42 and 43
Industries not elsewhere specified Divisions 22, 31, 32 and any manufacturing industry not listed above
(b) Transport sector
(i) Domestic aviation;
(ii) Road transport;
(iii) Railways;
(iv) Domestic navigation;
(v) Pipeline transport;
(vi) Transport not elsewhere specified.
(c) Public administration and service sectors
(d) Agricultural, forestry and fishing sectors
(e) Household sector
TABLE 5. CORRELATION BETWEEN OTHER SECTORS AND ISIC REV.4
Other sectors Correlation to ISIC Rev. 4
Household Divisions 97 and 98
Commerce and public services Divisions 33, 36-39, 45-47, 49-51, 52-53, 55-56, 58-66, 68-75, 77-82, 84-88, 90-96 and 99
Agriculture, forestry Divisions 01 and 02.
Fishing Division 03
Not specified elsewhere Class 8422
Note: According to IRES, transport fuels used in fishing, farming and defence (including for military transport vehicles) are
not counted as part of transport in the energy balance, because the main purpose of the fuel use in these activities is not transport, but
rather agriculture and defence. Energy used in lift trucks and construction machinery on work sites is considered stationary
consumption, not transport.
17
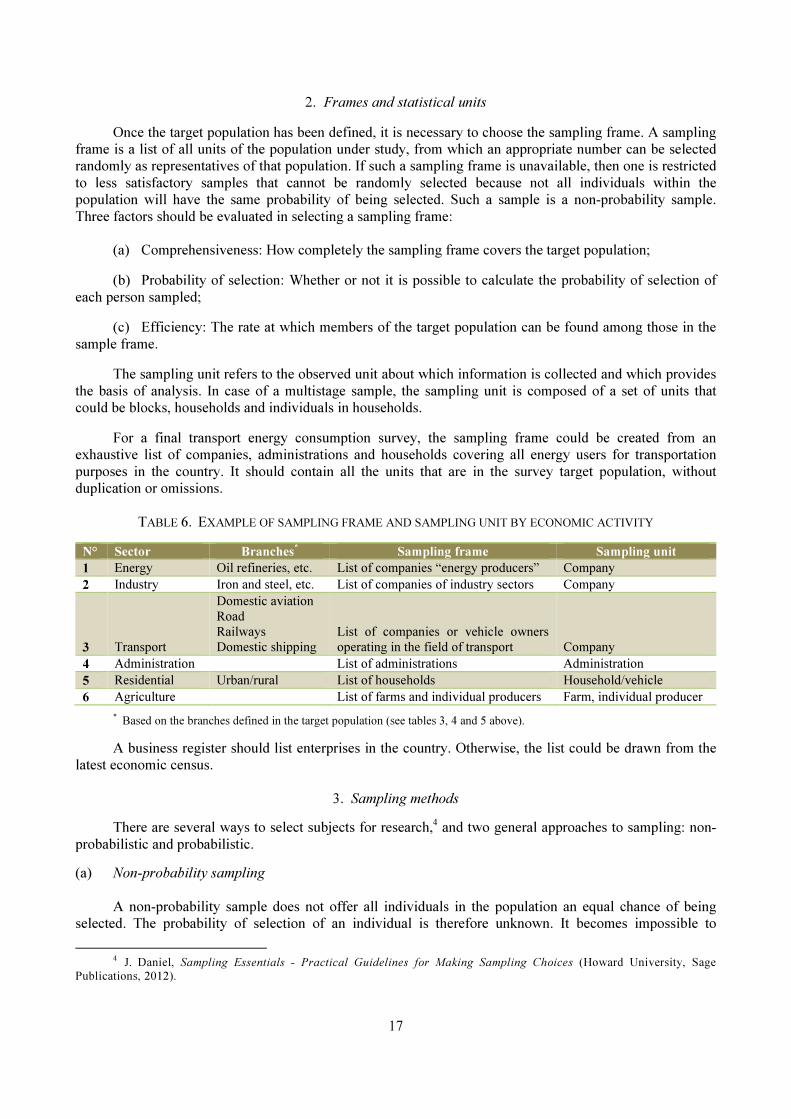
2. Frames and statistical units Once the target population has been defined, it is necessary to choose the sampling frame. A sampling
frame is a list of all units of the population under study, from which an appropriate number can be selected
randomly as representatives of that population. If such a sampling frame is unavailable, then one is restricted
to less satisfactory samples that cannot be randomly selected because not all individuals within the
population will have the same probability of being selected. Such a sample is a non-probability sample.
Three factors should be evaluated in selecting a sampling frame:
(a) Comprehensiveness: How completely the sampling frame covers the target population; (b) Probability of selection: Whether or not it is possible to calculate the probability of selection of
each person sampled; (c) Efficiency: The rate at which members of the target population can be found among those in the
sample frame. The sampling unit refers to the observed unit about which information is collected and which provides
the basis of analysis. In case of a multistage sample, the sampling unit is composed of a set of units that
could be blocks, households and individuals in households. For a final transport energy consumption survey, the sampling frame could be created from an
exhaustive list of companies, administrations and households covering all energy users for transportation
purposes in the country. It should contain all the units that are in the survey target population, without
duplication or omissions.
TABLE 6. EXAMPLE OF SAMPLING FRAME AND SAMPLING UNIT BY ECONOMIC ACTIVITY N° Sector Branches
* Sampling frame Sampling unit
1 Energy Oil refineries, etc. List of companies “energy producers” Company
2 Industry Iron and steel, etc. List of companies of industry sectors Company
3 Transport
Domestic aviation Road Railways Domestic shipping
List of companies or vehicle owners operating in the field of transport Company
4 Administration List of administrations Administration
5 Residential Urban/rural List of households Household/vehicle
6 Agriculture List of farms and individual producers Farm, individual producer
* Based on the branches defined in the target population (see tables 3, 4 and 5 above). A business register should list enterprises in the country. Otherwise, the list could be drawn from the
latest economic census.
3. Sampling methods There are several ways to select subjects for research,
4 and two general approaches to sampling: non-
probabilistic and probabilistic. (a) Non-probability sampling
A non-probability sample does not offer all individuals in the population an equal chance of being
selected. The probability of selection of an individual is therefore unknown. It becomes impossible to
4 J. Daniel, Sampling Essentials - Practical Guidelines for Making Sampling Choices (Howard University, Sage
Publications, 2012).

18
calculate the precision of the results or use them to extrapolate on the entire population. It is possible that
respondents may not be representative and survey results will be biased.
(b) Probability sampling
When the probability of being selected is equal for all individuals of the population, it is possible to
calculate the accuracy of survey results. There are several methods of probability sampling. Four major types
will be examined here.
(i) Simple random sampling
The simple random sampling method consists of selecting respondents randomly from a population.
Each member of the population has an equal chance of being selected. The sample is selected through a table
of random numbers. Once a sampling frame is available, each subject unit in the population is assigned a
number. This method is recommended when the variable of greatest interest is randomly distributed within a
small population, with little geographical dispersion and when the mode of distribution of the variable of
interest is not known.
(ii) Stratified random sampling
Stratified random sampling involves dividing the population into different subgroups that share certain
characteristics. A sample is then selected from each subgroup or stratum. The aim of stratified sampling is to
improve the representativeness of the selected sample. Stratified sampling can be proportionate (whereby the
size of the strata sample is made proportional to the size of the strata population) or disproportionate (for
which a varying sampling is used). Stratified sampling is generally recommended for large populations
where it is supposed or known that distribution of the major variables differs between the different subsets or
strata. (iii) Systematic sampling Systematic sampling gives each subject in the population an equal chance of being selected. It
involves the selection of every subject for inclusion in the sample. Under this method, the sampling interval
is the standard distance between elements selected in the sample and the sampling rate is the proportion of
elements selected in the population. Systematic sampling is generally used when it is impossible to identify
every sampling unit within the sample frame or when access to sampling units in the field is difficult.
(iv) Cluster sampling Cluster sampling is a probability sampling procedure in which elements of the population are selected
randomly in naturally occurring groupings (clusters). It is used when the target population is very large and
widely dispersed geographically and/or when the design of a sampling frame of the population is impossible
or impractical. Thus, a random selection is made by geographical location or other means and then the
sample is selected randomly.
4. Sampling errors and imputations
(a) Sampling errors Sampling error represents the portion of the difference between the value of a statistic derived from
observations and the value that is supposed to be estimated. This is attributed to the fact that samples
represent only a portion of the population. It is possible to use several samples from the same population and
each sample may give a different result. However, the differences between the samples vary only within a
range, whereby the percentage is determined by the size of the sample. If many samples are drawn from the
same sampling frame, they could potentially generate different results.

19
Sampling errors can be reduced by increasing the size of the sample and/or by stratification.
Generally, a 5 per cent sampling error is selected, meaning that 95 times out of 100 the sample is
representative of the larger population. The following table gives an insight into the calculation of the
sampling error according to the size of population.
TABLE 7. CALCULATION OF THE SAMPLING ERROR ACCORDING TO THE SIZE OF POPULATION
Population size
Sampling error
± 3%
Sampling error
± 5%
Sampling error
± 10%
100 92 80 49
250 203 152 70
500 341 217 81
750 441 254 85
1,000 516 278 88
2,500 748 333 93
5,000 880 357 94
10,000 964 370 95
25,000 1,023 378 96
50,000 1,045 381 96
100,000 1,056 383 96
1,000,000 1,066 384 96
100,000,000 1,067 384 96
(b) Imputations Many respondents to a survey may answer certain questions only partially. Imputation is a method
of filling in missing data with plausible values to produce a complete data set. A distinction may be
made between:
• Deductive imputation: A missing response is deduced from auxiliary information;
• Mean imputation overall: The overall respondent mean is assigned to all missing responses
(determinist method);
• Random imputation overall: Each non-respondent is assigned the value of the respondent sample
(stochastic method);
• Mean imputation within classes: This method divides the total sample into imputation classes
according to values on the auxiliary variables;
• Random imputation within classes: Application of the random overall method within imputation
classes. Each non-respondent is assigned the value of a respondent randomly selected from the
same imputation class;
• Hot-deck method: The missing data are replaced by a randomly chosen sample from respondents
with similar characteristics.
5. Sample questionnaires The questionnaire design process starts with the formulation of survey objectives and information
requirements and continues with the following steps:
• Consultation with data users and respondents;
• Review of previous questionnaires;
• Drafting the questionnaire;
• Review and editing of the questionnaire;

20
• Testing and editing of the questionnaire;
• Finalizing the questionnaire. The questions must be couched in terms that allow respondents to understand them easily and answer
them accurately. The questionnaire should be tested before implementation (cognitive tests, focus groups,
informal tests). Open questions allow respondents to answer in their own words, while closed questions
allow them to choose from a set of answers. Each have pros and cons (table 8).
TABLE 8. THE PROS AND CONS OF OPEN AND CLOSED QUESTIONS
Pros Cons
Open
questions • Allow respondents to answer in their own words; • Answers are not guided (predetermined); • Answers are richer and more diverse, which helps to identify options for further quantitative research and explore potentially new aspects.
• Answers are harder to interpret, compare and codify;
• More time is needed for analysis; • Complex questions require more time to answer and may not be answered.
Closed
questions • Answers are easy to codify and allow for statistical summaries of many cases;
• Well formulated questions enable the establishment of clear-cut categories to measure knowledge, skill, attitude or behaviour;
• Reporting results may be more straightforward.
• Limited choices raise the risk of influence on answers;
• Responses may also be influenced by the order of the questions; Some response options may be lacking;
• The response option "other" is not always useful.
Source: Evaluation toolbox. Available from http://evaluationtoolbox.net.au/index.php?option=com_content&view=
article&id=58&Itemid=154.
Because most people do not wish to spend much time on answering surveys, the shorter the
questionnaire the better. A long questionnaire can adversely affect the level of response. Where it is deemed
necessary to use a long questionnaire, thought should be given to possible incentives aimed at encouraging
respondents to complete it.

21
IV. MODELS
A. INTRODUCTION
Various models are used to estimate energy consumption and activity data for final sectors. They often
serve as a framework for consolidating other data sources. In general, they reflect complex systems in an
understandable form, help to organize large amounts of data and provide a consistent framework for testing
hypotheses.
The World Bank has conducted a comparative study of models in order to help developing countries to
choose the right model for their circumstances. The study presents the economic foundations of energy
demand (household, industrial, commercial and transport energy demand), energy demand forecasting
techniques, and the structure of aggregated and sectoral energy demand forecasting models.
Two general methods, the top-down and bottom-up evaluation methods, are used to compute
transport energy consumption.
1. Top-down method
This method is based on calculating fuel deliveries to petrol stations and fuel consumed for
transport activities by industry and the services sector (direct deliveries to companies), then deducting
fuel purchased in petrol stations for other purposes (public works, agriculture, fishing, etc.). The balance
represents energy used in the field of transport (figure VI). This method is the simplest. It starts with
total final consumption of energy then uses distribution keys by type of energy for different sectors.
Distribution is based on surveys and often also on estimates. For example, diesel consumption in
Tunisia breaks down as follows.
Figure V. Diesel consumption in Tunisia in 2010
2. Bottom-up method
Using the bottom-up method, the consumption of energy in the transport sector is based on the
analysis of vehicles in operation. Vehicles are surveyed based on average kilometres travelled per year,

22
with estimates of unitary consumption by type of vehicle. This approach requires a large amount of data
and hypotheses to compute final consumption.
Figure VI. Models used to estimate energy consumption in Tunisia
Source: ANME and ALCOR.
B. CATEGORY OF MODELS
Four main types of model are used.
1. Optimization models
These bottom-up models are used for choosing the least-cost configurations of energy systems based
on various constraints, such as CO2 emissions targets. They include the MARKAL (MARKet ALlocation),
TIMES (The Integrated MARKAL-EFOM System), EFOM (Energy Flow Optimization Model) and WASP
(Wien Automatic System Planning) models.
(a) Principal characteristics of the MARKAL model
(i) Definition of the model and type
MARKAL was developed by the IEA Energy Technology Systems Analysis Programme
(IEA/ETSAP) in a multinational project over two decades. It is applied by around 80 institutions in 37
countries, and uses dynamic linear programming to generate energy, economic, engineering and
environmental equilibrium models. It describes an entire reference energy system, from resource extraction,
through energy transformation and end-use devices, to the demand for useful energy services. The
MARKAL family of models is unique and includes: Standard MARKAL, MARKAL-MACRO (Standard
MARKAL linked to a macroeconomic growth model), MARKAL Elastic Demand (price responsive
demand), and TIMES, which is expected to replace MARKAL and MARKAL-MACRO.
(ii) Structure and functions of the model
The main function of this demand-driven model is to optimize a linear objective function under a set
of linear constraints. The problem is to determine the optimum activity levels of processes satisfying the
constraints at minimum cost. As with most energy system models, energy carriers in MARKAL interconnect
Car fleet U. ConsumptionAnnual kmx x
National consumption
for transport
Top-down approach -
Based on statistics on fuel deliveries
Bottom-up approach
Estimation of the fleet, annual km and unitary consumption

23
the conversion and consumption of energy. This user-defined network includes all energy carriers involved
in primary supplies (such as mining and petroleum extraction), conversion and processing (power plants,
refineries and so on) and end use. The demand for energy services may be disaggregated by sector
(residential, manufacturing, transportation and commercial) and by specific functions within a sector
(residential air conditioning, cooling, lighting, hot water and so on).
The optimization routine used in the model’s solution selects from each of the sources, energy carriers
and transformation technologies to produce the least-cost solution subject to a variety of constraints.
The user defines technology costs, technical characteristics (e.g. conversion efficiencies) and energy
service demands. As a result of this integrated approach, supply-side technologies are matched to energy
service demands.
(iii) Purposes of the model
MARKAL represents the energy system from the supply and demand sides and provides extensive
details on energy producing and consuming technologies. The model makes it possible to:
• Identify least-cost energy systems;
• Identify cost-effective responses to restrictions on emissions;
• Perform prospective analysis of long-term energy balances under different scenarios;
• Evaluate new technologies and priorities for research and development;
• Evaluate the impact of regulations, taxes and subsidies;
• Project inventories of greenhouse gas emissions;
• Estimate the value of regional cooperation.
MARKAL uses a set of matrix forms, parameters and tables to work on data. These components are
supplied by users to represent an energy system from the primary sources of energy to the final energy
demand sectors, describing the technologies that enable resource exchanges with external energy sources
(imports and exports) or the supply of energy carriers (mines, biomass and so on); the processes that ensure
the transformation of one energy carrier to another; the conversion of electricity or heat production process;
and the technology application that consumes an energy carrier to satisfy final demand.
The model creates optimized solutions by reducing the costs of the total energy system during the
planning period, taking into account all types of constraints (availability of primary energy resources,
technologies, upper limits on pollution emissions, etc.). It can be used with a macroeconomic model to allow
interplay between the energy system and the economy, or with a partial equilibrium model, whereby demand
levels are endogenously determined.
(iv) Limitations of the model
MARKAL is data intensive. It picks the solution that provides the lowest costs, excluding other results
with only slightly greater costs. The use of multiple-year planning periods for the calculation of energy
balances creates difficulties for the modelling of renewable energy, for which technology infrastructure can
be built in very short periods.
(v) Case study – United States of America The United States Environmental Protection Agency has developed a MARKAL model of the United
States of America to explore future scenarios of energy system development and associated emissions.
Researchers used the MARKAL model to estimate future technological advances and calculate related GHG
emissions through to 2050. Five economic sectors were concerned: transformation (electricity production);
industry; transport; residential; and commercial. Nine regions were covered, with each region representing a
census division.
24
The energy system structure depicts primary energy (fossil fuels, biomass, uranium and renewable
modules) for processing and conversion (gasification, refining and processing, combustion based on
electricity generation, nuclear power, direct electricity generation [solar, hydro-electric and wind], hydrogen
generation and carbon sequestration). The MARKAL database and model have provided federal and regional decision-makers with
a valuable tool to explore future energy scenarios, taking into account regional variations in resource
availability, transport costs and end-use demands. The following subjects have been examined using
this model: a. How might a federal renewable portfolio standard be met across regions?
b. Will the development of a hydrogen economy decrease or increase air pollution and greenhouse
gas emissions? How might hydrogen affect the price of other commodities?
c. What might be the role of biofuels and biopower in the transport, power, and industrial sectors?
d. How might different sectors compete for limited biomass resources?
e. How do regions differ in their capacity to produce, transport and use biomass feedstock?
f. What energy technologies could be deployed over the next half-century to meet a low carbon
trajectory?
g. What are the potential emission consequences of technologies that may be deployed over the next
half-century?
2. Simulation models These econometric-type energy models simulate the behaviour of consumers and producers under
variables such as prices, incomes and policies. Energy prices and quantities are adjusted endogenously using
iterative calculations to seek supply-demand equilibrium prices. Such models include: ENPEP (Energy and
Power Evaluation Programme)-Balance, POLES (Prospective Outlook on Long-term Energy Systems),
MIDAS (Multinational Integrated Demand and Supply) and Energy 20/20. (a) Principal characteristics of the ENPEP-Balance model (i) Definition of the model and type ENPEP is a set of ten integrated energy, environmental and economic analysis tools, of which one is
the Balance module. This tool was developed at Argonne National Laboratory Centre for Energy,
Environmental and Economic Systems Analysis (CEEESA). It is sponsored by the International Atomic
Energy Agency (IAEA), the World Bank and a range of other institutions. It is a nonlinear equilibrium model
that matches the demand for energy with available resources and technologies. It is based on a market
simulation approach that allows it to determine the response of different segments of the energy system to
variations in energy prices and demand levels, and permits users to evaluate the entire energy system (supply
and demand sides) and the environmental implications of different energy strategies. The ENPEP-Balance
model can be run in combination with other ENPEP tools, such as MAED (Model for Analysis of Energy
Demand) and WASP. (ii) Structure and functions of the model As a demand-driven model, ENPEP-Balance is based on a decentralized decision-making process in
the energy sector. It can be adjusted according to the preferences of energy users and suppliers. The input
parameters include: a. All information about the energy system structure;
b. Base year energy statistics, including production and consumption levels and prices;
c. Projected energy demand growth;
d. Technical and policy constraints.

25
The energy networks are designated graphically to trace the energy flow from the primary energy
resources (supply side) to the end-use sectors (demand side). These networks use nodes and links through the
interface of the ENPEP-Balance module, by doing the following:
a. Each node type corresponds to a different submodel: energy demands; conversion processes;
resources processes; and economic processes;
b. The links permit connection between the nodes and the transfer of information between them
(specific equations).
The ENPEP-Balance solution is based on simulating the behaviour of energy consumers and
producers through a market-sharing algorithm. The equilibrium model represented by the designed energy
network is solved by finding a set of prices and quantities that satisfy all relevant equations and inequalities
(intersection of supply and demand curves).
(iii) Purposes of the model
The model can project future energy market penetration through different scenarios. The configuration
includes different primary energy resources (supply side) such as coal, crude oil, gas, nuclear and
renewables, the transformation and distribution sectors (electricity and petroleum products) and final energy
consumption (industry, transport, households, etc.).
The model is configured to evaluate various power system expansion options through different
technologies. The simulation algorithm uses a nested approach: For instance, the model allocates market
share between two fuels, then it decides, within each of those two categories, the share each separate
technology will attain. The model forecasts technology shares based on underlying assumptions on
performance, capital cost, operation and maintenance cost, process efficiencies, interest rates, risk premium
and projected fuel prices.
The model projects the balance of energy supply and demand for the entire energy system, up to a
period of 75 years. The results are a set of prices and quantities for all of the links in the network for every
year of the analysis period. The data generated from ENPEP-Balance can be used by other ENPEP modules
to transform data and prepare input data on electricity generation requirements, calculate an electrical
generating system expansion plan that meets demand at the minimum cost (subject to system requirements)
and calculate environmental impacts from the energy supply system.
(iv) Limitations of the model
ENPEP-Balance is data-intensive, complicated and not user-friendly. Extensive training and
experience are required in order to work successfully with the model. Calculations are on a year-by-year
basis, so it does not make current energy-use decisions in conjunction with a projection of what will happen
in the future.
(v) Case study - Romania CEEESA assisted the Government of Romania in developing a long-term energy policy under the
supervision of the World Bank. CEEESA developed an integrated modelling framework to analyse
Romania’s energy sector. It included five main modules:
• Macroeconomic module (output: sectoral gross domestic product (GDP), population income);
• ENPEP MAED module (output: energy demand and annual hourly electricity demand);
• ENPEP ELECTRIC module (output: hydro capacity and building schedule);
• ENPEP-Balance module (output: energy flow and fuel cost);
• ENPEP IMPACTS module.

26
The modelling framework took into account all national economic alternative and energy strategies in
order to achieve the country’s overall goals, while satisfying pollution control requirements. Long-term
energy supply options and energy balances were set up until 2020. Different scenarios were analysed
according to the various assumptions regarding development of the energy sector and economy of Romania. The Government adopted the study as a long-term energy strategy that has resulted in many
recommendations: liberalizing the energy market; improving efficiency and implementing advanced energy
technologies; increasing the use of renewable energy; implementing strict pollution measures; improving
energy management; diversifying energy supply sources; establishing adequate domestic fuel stocks; and
increasing research and development.
3. Accounting frameworks The account for energy flows is a system based on simple engineering relationships (such as energy
conservation). The model asks users to specify outcomes simulating decisions of energy consumers
and producers. The evaluation and comparison of policies are largely performed externally by analysts.
The main function of the model framework is to manage data and results and it is considered to be
transparent, intuitive and easy to parameterize. MAED and LEAP (Long-range Energy Alternatives
Planning) are two such models. (a) Principal characteristics of the LEAP model
(i) Definition of the model and type
LEAP was developed at the Tellus Institute by the Stockholm Environment Institute with support from
the United Nations Environment Programme. It allows for energy forecasting as part of an integrated model
for considering demand and supply side technologies and accounts for total system impacts. It is a widely
used software tool for energy policy analysis and climate-change mitigation assessment, with flexible
application at different geographical levels (city, state, country, region or global).
(ii) Structure and functions of the model
As a demand driven model, LEAP is structured as a series of integrated programmes that can be used
to develop energy balances in order to project supply and demand trends, and to calculate consequences,
such as environmental emissions. It is composed of the following programmes:
a. Energy scenario programme with demand, transformation, biomass, environment and evaluation
subprogrammes;
b. Aggregation programme to display multi-area analysis results at different geographical levels;
c. Environmental database to calculate automatically GHG emissions and environmental impacts
according to different scenarios;
d. Fuel chains programme, used to compare the total energy and environmental impacts of fuel and
technology choices.
The main data that can be used in LEAP are divided into four categories. Macroeconomic variables
Sectoral driving variables GDP/value added, population, household size
More detailed driving variables • Production of energy intensive materials (tonnes or US$ steel); • Transport needs (pass-km, tonne-km); income distribution, etc.
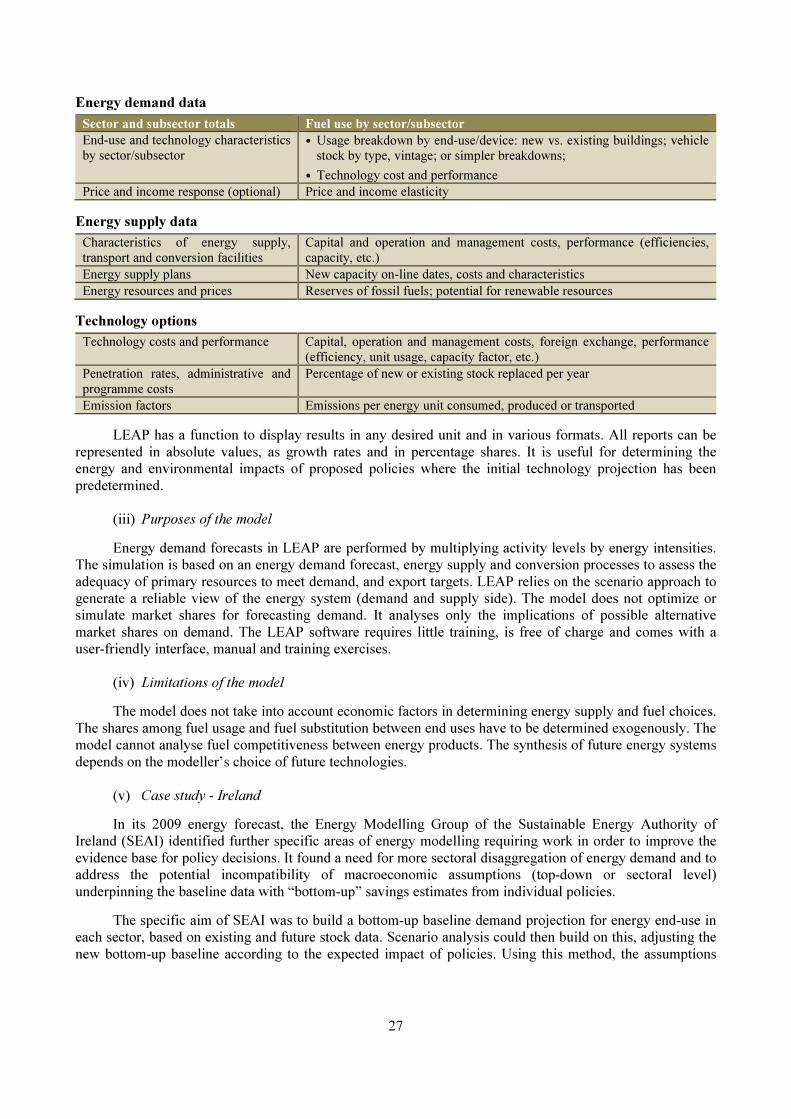
27
Energy demand data
Sector and subsector totals Fuel use by sector/subsector
End-use and technology characteristics by sector/subsector
• Usage breakdown by end-use/device: new vs. existing buildings; vehicle stock by type, vintage; or simpler breakdowns;
• Technology cost and performance
Price and income response (optional) Price and income elasticity Energy supply data
Characteristics of energy supply, transport and conversion facilities
Capital and operation and management costs, performance (efficiencies, capacity, etc.)
Energy supply plans New capacity on-line dates, costs and characteristics
Energy resources and prices Reserves of fossil fuels; potential for renewable resources Technology options
Technology costs and performance Capital, operation and management costs, foreign exchange, performance (efficiency, unit usage, capacity factor, etc.)
Penetration rates, administrative and programme costs
Percentage of new or existing stock replaced per year
Emission factors Emissions per energy unit consumed, produced or transported LEAP has a function to display results in any desired unit and in various formats. All reports can be
represented in absolute values, as growth rates and in percentage shares. It is useful for determining the
energy and environmental impacts of proposed policies where the initial technology projection has been
predetermined.
(iii) Purposes of the model Energy demand forecasts in LEAP are performed by multiplying activity levels by energy intensities.
The simulation is based on an energy demand forecast, energy supply and conversion processes to assess the
adequacy of primary resources to meet demand, and export targets. LEAP relies on the scenario approach to
generate a reliable view of the energy system (demand and supply side). The model does not optimize or
simulate market shares for forecasting demand. It analyses only the implications of possible alternative
market shares on demand. The LEAP software requires little training, is free of charge and comes with a
user-friendly interface, manual and training exercises.
(iv) Limitations of the model The model does not take into account economic factors in determining energy supply and fuel choices.
The shares among fuel usage and fuel substitution between end uses have to be determined exogenously. The
model cannot analyse fuel competitiveness between energy products. The synthesis of future energy systems
depends on the modeller’s choice of future technologies.
(v) Case study - Ireland In its 2009 energy forecast, the Energy Modelling Group of the Sustainable Energy Authority of
Ireland (SEAI) identified further specific areas of energy modelling requiring work in order to improve the
evidence base for policy decisions. It found a need for more sectoral disaggregation of energy demand and to
address the potential incompatibility of macroeconomic assumptions (top-down or sectoral level)
underpinning the baseline data with “bottom-up” savings estimates from individual policies. The specific aim of SEAI was to build a bottom-up baseline demand projection for energy end-use in
each sector, based on existing and future stock data. Scenario analysis could then build on this, adjusting the
new bottom-up baseline according to the expected impact of policies. Using this method, the assumptions
28
underpinning the bottom-up baseline projection and those underpinning scenario analysis would be aligned
automatically. The tool identified for this task was LEAP. The existing LEAP-Ireland model includes energy use in private-car transport, the residential sector
and industry. It is being extended to include freight. The short-term goal is to extend the model to the entire
economy, including energy use in the services sector and aviation. The long-term vision is to use LEAP-
Ireland as a planning tool for assessing the future impact of possible energy efficiency policies and measures.
LEAP helps to inform decision-making on technology choices. For the transport sector, a private car stock
demographic model has been developed, where:
a. The stock, distance travelled and on-road efficiency are calculated for vehicles, disaggregated by
technology (fuel type and engine cylinder capacity) and vintage;
b. Stock demographics are calculated from vehicle retirement rates derived from historical stock
analysis;
c. Future car sales (assuming continued sales growth from 2010) and imports are estimated;
d. The 2009 new-car technology profile is carried forward to 2020.
The distances travelled for different types of petrol and diesel cars were derived from National Car
Test odometer readings from 2000 to 2008, along with specific fuel consumption data for each type of new
car. Fuel consumption is converted to energy demand and aged by 0.3 per cent for each vintage year, and an
on-road factor5 of 1.06 for petrol and 1.12 for diesel cars is applied to account for the difference between
official test and on-road fuel consumption.
Energy demand each year is then calculated in LEAP as the product of stock, distance travelled and
specific energy consumption in each technology and age category. Scenario “levers” in the model enable the
analysis of efficiency improvements, overall travel reduction and car-sharing, modal shift and efficient
driving. The baseline scenario for private cars comprises a forecast of energy demand where growth in car
sales is tied to an assumed recovery of the economy, and the technology profile of new cars remains as it was
in previous years.
4. Hybrid model This type of model is a mixture of different approaches, combining engineering-orientation with
economic market-driven representations. The model examines the impact of the energy system on the wider
economy, how changes in the system can effect macroeconomic growth and structure, and how production
functions allow for substitution among capital, labour and different forms of energy. MARKAL MACRO
and the European Union PRIMES energy system model are examples.
(a) Principal characteristics of the PRIMES model
(i) Definition of the model and type The PRIMES energy system model simulates a market equilibrium solution for energy supply and
demand. The model determines equilibrium by finding prices of each energy form in a way that matches the
quantities producers wish to supply to the amounts consumers wish to use. The equilibrium is static (within
each time period) but repeated in a time-forward path, under dynamic relationships. The model was
developed by the National Technical University of Athens as part of a series of research programmes of the
European Commission on the European energy system and related energy efficiency and environmental
policies. The model is updated and extended regularly.
5 On-road factor = fuel consumption on-road/official test of vehicle’s fuel consumption.

29
(ii) Structure and functions of the model
The model is organised in subsectors representing the energy products flows: supply, transformation
and final energy use. Its modular design makes it possible to represent each sector accurately and highlight
key issues therein. The module can be run independently for stand-alone analysis.
The energy production subsystems include:
• Supply sectors (supply side): coal, oil products, natural gas, electricity and heat production, biomass
supply, and others;
• End-use sectors (demand side): industrial, transport, residential and commercial sectors.
Some consumers, such as industrial co-generators of electricity and steam, may also be suppliers. The
model distinguishes several end uses and processes:
a. Eleven industrial sectors, subdivided into 26 subsectors using energy in 12 generic processes
(such as air compression and furnaces);
b. Five services sectors, using energy in six processes (e.g. air-con and office equipment);
c. Four dwelling types using energy in 5 processes and 12 types of electrical durable goods (such as
refrigerators, washing machines and television sets);
d. Four transport modes, 10 means of transport and 10 vehicle technologies, 14 fossil fuel types, 4
new fuel carriers (such as hydrogen, methanol and biofuels) and 10 renewable energy types;
e. Supply subsystems such as power and steam generation, refineries, gas, biomass, hydrogen and
primary energy. The power generation submodel represents 150 power and steam technologies,
an electricity grid with import and export links in the internal energy market of the European
Union and details of load curves (typical days and hours) for electricity and steam;
f. Seven types of pollutants emitted from energy processes and a series of associated policy
instruments, including emission trading schemes.
The model simulates the European energy system and markets on a country level basis and provides
detailed results on energy balances, CO2 emissions, investment, energy technology penetration, prices and
costs in five-year intervals between 2000 and 2030. Variables that can be used in PRIMES are divided into
five groups:
a. Economy system
i. GDP, demographics, exchange and interest rates;
ii. Activity by sector (18 sectors), household income;
b. Energy demand system
i. Consumption habits, durable goods and comfort;
ii. Manufacturing technology, kind of industry and energy needs;
iii. Transportation modes/means and technologies as drivers of energy needs;
c. Energy supply system
i. Primary energy supply;
ii. Secondary energy supply (such as power generation and refineries);
iii. Energy system balances;

30
d. Energy markets
i. Competition, price formation and regulation;
ii. Import/export;
e. Environment impacts
i. Energy-related emissions;
ii. Environmental impacts and pressures, damages;
iii. Preventive and corrective measures.
(iii) Purposes of the model
PRIMES is a general-purpose model, conceived for energy outlooks, scenario construction and impact
assessment of policies. It covers a medium to long-term horizon and allows for unified or partial use of
modules. The following fields can be supported in policy analysis:
• Standard energy policy issues, including supply security, strategy and costs;
• Environmental issues, including climate change mitigation;
• Pricing policy, taxation and technology standards;
• New technologies and renewable energy sources;
• Energy efficiency on the demand side;
• Alternative fuels;
• Conversion decentralisation and electricity market liberalisation;
• Policy issues regarding electricity generation, gas distribution and new energy forms.
(iv) Limitations of the model
According to some users, there are data access issues. As a result, energy chains have not been
specified in published scenarios based on the PRIMES model because data are often aggregated (for
example, in the case of scenarios for the development of bioenergy, it is not clear which sector will be used).
In addition, only the main assumptions underlying the scenarios are available, making it impossible to
identify energy products by origin (production or importation). This constitutes a serious obstacle to the life-
cycle analysis of any energy product.
(v) Case study – the European Union
The PRIMES model6 was used to prepare the Energy and Emissions Outlook for the Shared Analysis
project of the European Commission, DG XVII and European Energy and Transport - Trends to 2030, put
out by the Directorate-General for Energy. The model has been extensively used by the Directorate-General
for the Environment and Directorate-General for Research and Innovation of the European Union, as well as
at the level of the European Economic Area and by European Union Governments.
6 PRIMES model E3Mlab of ICCS/NTUA, used for the 2010 scenarios for the European Commission, including new
submodels.
31
V. EXAMPLES OF ENERGY SURVEYS IN THE TRANSPORT SECTOR
This chapter presents case studies to illustrate the above-mentioned methodologies. Four cases
will be reviewed: Canada as a developed country and three Arab countries (Morocco, Palestine and
Tunisia).
In Canada, the main objective of the fuel consumption survey (FCS) carried out by Statistics
Canada was to measure road use by motor vehicles, their fuel consumption and their impact on the
environment.
The Moroccan survey is the most complete and recent. It was conducted under an energy sector
support programme run by the Directorate of Observation and Planning of the Ministry of Energy,
Mines, Water and the Environment and funded by the European Commission. The main purpose was to
collect comprehensive data on transport energy consumption (as defined by energy balance using
international standards), disaggregated by type of vehicle and mode of energy. The survey covered the
transport, residential, industry, energy, agriculture and services sectors.
The transport survey carried out in Palestine covered only the activities of the outside
establishment sector according to (ISIC Rev. 3) for passengers and freight transport by road. The
objective was to provide data about the number of vehicles and employees by activity, value of output
and intermediate consumption, value added components, fixed assets and other selected variables. It was
planned and conducted by a technical team from the Palestinian Central Bureau of Statistics (PCBS)
with joint funding by the Palestinian National Authority and the Core Funding Group, represented by
the Representative Office of Norway to the Authority and the Swiss Development and Cooperation
Agency.
In Tunisia, ANME ran surveys covering the major transport companies and consumers at petrol
stations level with a view to improving the information system and laying the foundations of a proper
database on transport and energy.
A. CANADA
Many final energy consumption surveys have been conducted in Canada, including the following:
• Annual Industrial Consumption of Energy Survey;
• Households and the Environment Survey;
• Commercial and Institutional Consumption of Energy Survey;
• Canadian Vehicle Survey & Fuel Consumption Survey.
FCS is a fully redesigned version of the former Canadian Vehicle Survey, which was launched by
Statistics Canada in 1999 and terminated in 2009. The purpose of FCS is to measure road use by light
motor vehicles, and their fuel consumption and impact on the environment. It is conducted by Statistics
Canada on behalf of Transport Canada and Natural Resources Canada.
1. General description
This voluntary survey is considered a unique source of information on road use by light motor
vehicles, their fuel consumption and their impact on the environment. It is conducted quarterly and allows
for calculation of annual estimates based on the data collected during the four quarters. Its conception is
based on the former Canadian Vehicle Survey (CVS). CVS started in 1999 and was implemented until 2009.
The difference between the two surveys resides in the mode of data collection: the engine data logger
for FCS replaces the trip logs used for CVS, thereby reducing respondent burden and improving overall
data quality.
32
2. Survey design
(a) Target population
The target population of FCS is based on the list of all light motor vehicles registered in Canada
during the survey reference period. The following vehicles are excluded from the registration lists used in the
sample (out-of-scope):
(i) Vehicles based on weight criteria: ambulances and fire trucks, motorcycles, buses, tractors, off-
road vehicles (such as snowmobiles, dune buggies and amphibious vehicles) and special
equipment (such as cranes, street cleaners, snow-ploughs and backhoes);
(ii) Scrapped or salvaged vehicles.
(b) Instrument design
The survey uses an engine data logger in addition to a short paper questionnaire (see annex, part I).
The engine data logger is a small electronic device that plugs into the on-board diagnostic port of vehicle. It
stores readings from the vehicle parameters in real time (every second). The main measured parameters are:
(i) Vehicle speed;
(ii) Engine speed;
(iii) Intake manifold pressure;
(iv) Air flow rate;
(v) Intake air temperature.
(c) Sampling
The frame is derived from administrative vehicle registration lists from 13 jurisdictions (10 provinces
and 3 territories). The lists are then shortened by removing out-of-scope vehicles (such as buses, trailers,
etc.), vehicles with expired registrations, duplicate Vehicle Identification Numbers (VIN) and records with
irregular data.
The sampling unit is based on VIN, which identifies each vehicle and is produced by the
manufacturer and registered in 1 of 13 jurisdictions. The Sample Universe File (SUF) is the combination of
the registration files from the provincial and territorial Governments. SUF is updated every quarter. Based
on it, vehicles are stratified into 94 strata at two levels:
(i) Census metropolitan area (34 groups, plus 13 other groups - one in each province or territory);
(ii) Vehicle type (passenger car or other).
The General Sampling System of Statistics Canada is used to select the sample. The system is
especially useful for managing sample selection and rotation for periodic surveys.
3. Data collection
The two key variables, fuel consumption and distance travelled, can be collected either through the
engine data logger or by means of the questionnaire. Trip-level information, such as start time and date, end
time and date, duration, and time spent idling, are collected by the data logger. The registered owners of the
sampled vehicles are contacted for a computer-assisted telephone interview.

33
4. Data edit and imputation Data are subjected to computerized and manual verifications to ensure that the records are consistent
and that there are no errors as a result of data capture. Data are then examined for completeness. The outliers
are processed manually and the missing values and erroneous data imputed using software developed by
Statistics Canada.
B. MOROCCO In 2011, a survey
7 on consolidation of final energy consumption in the transport sector was launched
in Morocco in the framework of multi-annual surveys by the Directorate of Observation and Planning of
the Ministry of Energy, Mines, Water and the Environment. Support for the survey was provided by the
European Commission, the Moroccan Department of Statistics and the Ministry of Equipment and Transport.
The goals of the Directorate’s surveys are to improve knowledge about energy consumption by sector; steer
demand towards least-cost energy sources and thereby reduce electricity and oil use; look at tax incentives
for emission reduction devices; and address building and equipment maintenance. The survey under
consideration was undertaken to produce data disaggregated by vehicle type and power covering the
residential, industrial, energy, commercial and agriculture sectors, as well as the transport sector (land, sea
and air transport). The main products covered by the survey are electricity, coal, natural gas, biomass and
petroleum products.
Figure VII. Economic branches covered by the survey
The main objectives of the survey were to produce reliable data, align Moroccan energy statistics with
international standards (IEA, Eurostat, United Nations), facilitate the work of the energy authorities and
achieve the goals set forth by the Ministry of Energy in its national energy strategy: (a) Determine the final transport energy consumption for various stakeholders;
7 Morocco, Ministry of Energy, Enquête sur la consommation énergétique dans le secteur des transports: Aspects
méthodologiques et résultats (Energy consumption survey in the transport sector: Methodological issues and results, 2013).

34
(b) Calculate transport energy efficiency indicators;
(c) Assist in assessing GHG emissions from the transport sector;
(d) Forecast transport energy demand.
1. Implementation process For implementation phases, see chapter III. The following table presents the target population for each
transport subsector based on the business registers of companies, the survey methodologies (census,
stratified, quotas, etc.) employed and the administrative mode (fax, face to face, etc.). For the first three
categories, data on energy consumption are confined to a limited number of stakeholders, such ONCF
(Office national des chemins de fer) for rail, ONDA (Office national des aéroports) for domestic and
international air transportation, and the National Ports Agency and MARSA MOROCCO for shipping. Those
strata are thus surveyed exhaustively. The recommended sampling approaches for the other strata are
included in the table.
TABLE 9. SAMPLING APPROACH
Sector (transport)
Sector of
activity Target population
Point of
reference
Survey
method Administration mode
Air transport Air transport ONDA Full survey Fax/direct contact
Sea transport Sea transport Central
committee of
Moroccan ship-
owners (Comité
Central des
Armateurs
Marocains -
CCAM)
Full survey Fax/direct contact
Rail transport Rail transport ONCF Full survey Fax/direct contact
Road transport Industry
construction
energy mines
Companies in
the sector
concerned
The HCP (Haut
Commissariat
au Plan)
companies
register
Stratified
survey
Face to face
Residential Household
vehicles
Quotas Face to face
Agriculture Farms Quotas Face to face
Taxis mixed
transport
Vehicles Quotas Face to face
transport Catalogue of
transport
companies
available from
HCP
Stratified
survey
Face to face
Services Companies in
the sector
concerned
The HCP
companies
register
Stratified
survey
Face to face
State vehicle
population
SNTL (Société
Nationale des
Transports et de
Logistique)
Full survey Fax/direct contact
2. Questionnaires
Several detailed questionnaires were developed to meet the objectives of the survey, taking into
account the specificities of the target populations in the various sectors covered. The development of
questionnaires was based on the below factors.

35
• Identification of stratum appearance of the observation unit;
• Geographical location of the respondent;
• Description of economic unit target (such as business, farm or household);
• Information on energy consumption by fuel type and unit of measure (tonne for diesel, gasoline
and fuel, GWh for electricity);
• Fuel consumption (amount, value), age and type of vehicle;
• Design data;
• Additional control information;
• General comments. Almost all questions were closed or semi-closed, which facilitated the collection of relevant qualitative
data. The list of questionnaires is presented below.
• Rail freight and passenger transport questionnaire;
• Air transport questionnaire;
• Sea transport questionnaire;
• Road freight transport questionnaire;
• Urban public transport questionnaire;
• Certified professionals questionnaire;
• Intercity public transport questionnaire;
• Mixed transport questionnaire;
• Tourist transport questionnaire;
• Auxiliary transport questionnaire;
• Staff transport for third parties questionnaire;
• Construction sector questionnaire;
• Industry sector questionnaire;
• Residential sector questionnaire;
• Mines sector questionnaire;
• Energy sector questionnaire;
• Services sector questionnaire;
• Agricultural sector questionnaire. See the residential questionnaire in the annex (part II) by way of example.
3. Sampling plan Probabilistic and quota methods were used. (a) Probabilistic selection For sectors subject to probabilistic sampling by the High Commission for Planning (HCP - Haut
Commissariat au Plan), a stratified survey by profession and activity was adopted. Areas of study comprising
one or several branches were organised into two strata categories: (i) Stratum to be fully investigated: Containing all structured companies with a certain minimum of
employees. The threshold is determined individually for each area;
(ii) Stratum subject to selection: Samples are taken based on companies’ activities and employees. For transport in industry, the sampling plan was based on the following principles: (i) Use of the register of industrial companies available from HCP as a basis for selecting the sample.
The register is updated regularly and is exhaustive. In addition to the company's activity, the
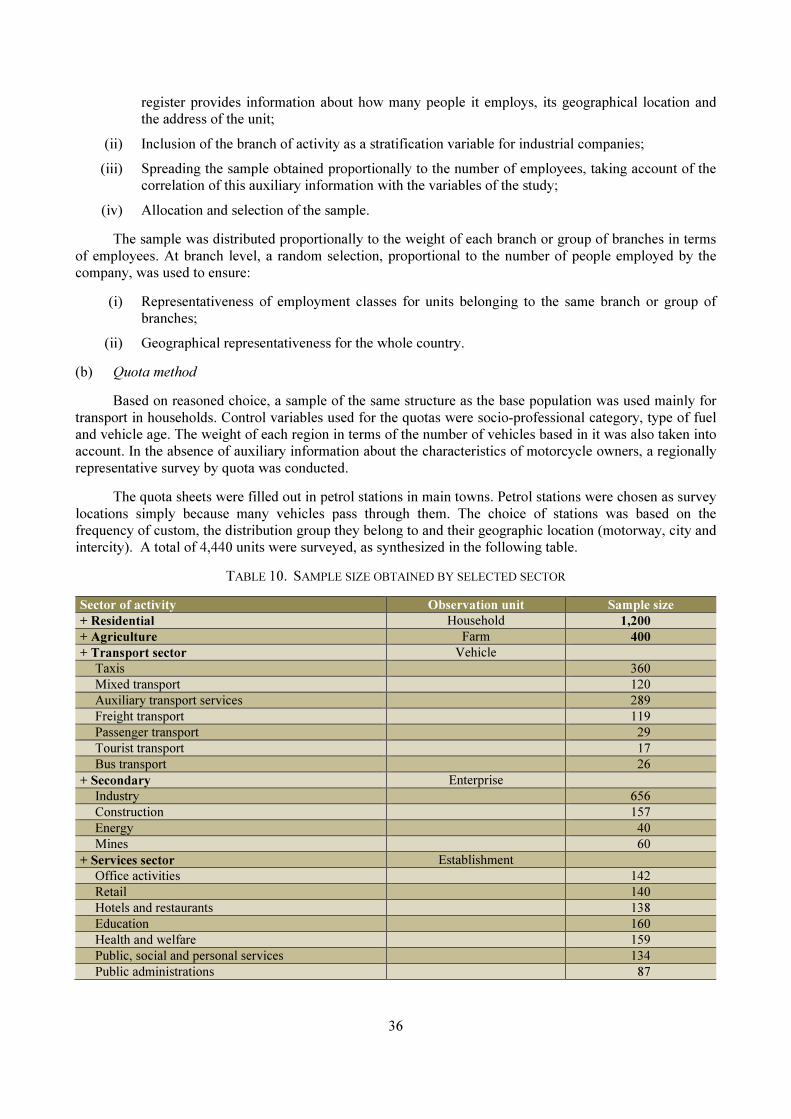
36
register provides information about how many people it employs, its geographical location and
the address of the unit;
(ii) Inclusion of the branch of activity as a stratification variable for industrial companies;
(iii) Spreading the sample obtained proportionally to the number of employees, taking account of the
correlation of this auxiliary information with the variables of the study;
(iv) Allocation and selection of the sample. The sample was distributed proportionally to the weight of each branch or group of branches in terms
of employees. At branch level, a random selection, proportional to the number of people employed by the
company, was used to ensure: (i) Representativeness of employment classes for units belonging to the same branch or group of
branches;
(ii) Geographical representativeness for the whole country. (b) Quota method Based on reasoned choice, a sample of the same structure as the base population was used mainly for
transport in households. Control variables used for the quotas were socio-professional category, type of fuel
and vehicle age. The weight of each region in terms of the number of vehicles based in it was also taken into
account. In the absence of auxiliary information about the characteristics of motorcycle owners, a regionally
representative survey by quota was conducted. The quota sheets were filled out in petrol stations in main towns. Petrol stations were chosen as survey
locations simply because many vehicles pass through them. The choice of stations was based on the
frequency of custom, the distribution group they belong to and their geographic location (motorway, city and
intercity). A total of 4,440 units were surveyed, as synthesized in the following table.
TABLE 10. SAMPLE SIZE OBTAINED BY SELECTED SECTOR Sector of activity Observation unit Sample size
+ Residential Household 1,200
+ Agriculture Farm 400
+ Transport sector Vehicle
Taxis 360
Mixed transport 120
Auxiliary transport services 289
Freight transport 119
Passenger transport 29
Tourist transport 17
Bus transport 26
+ Secondary Enterprise
Industry 656
Construction 157
Energy 40
Mines 60
+ Services sector Establishment
Office activities 142
Retail 140
Hotels and restaurants 138
Education 160
Health and welfare 159
Public, social and personal services 134
Public administrations 87
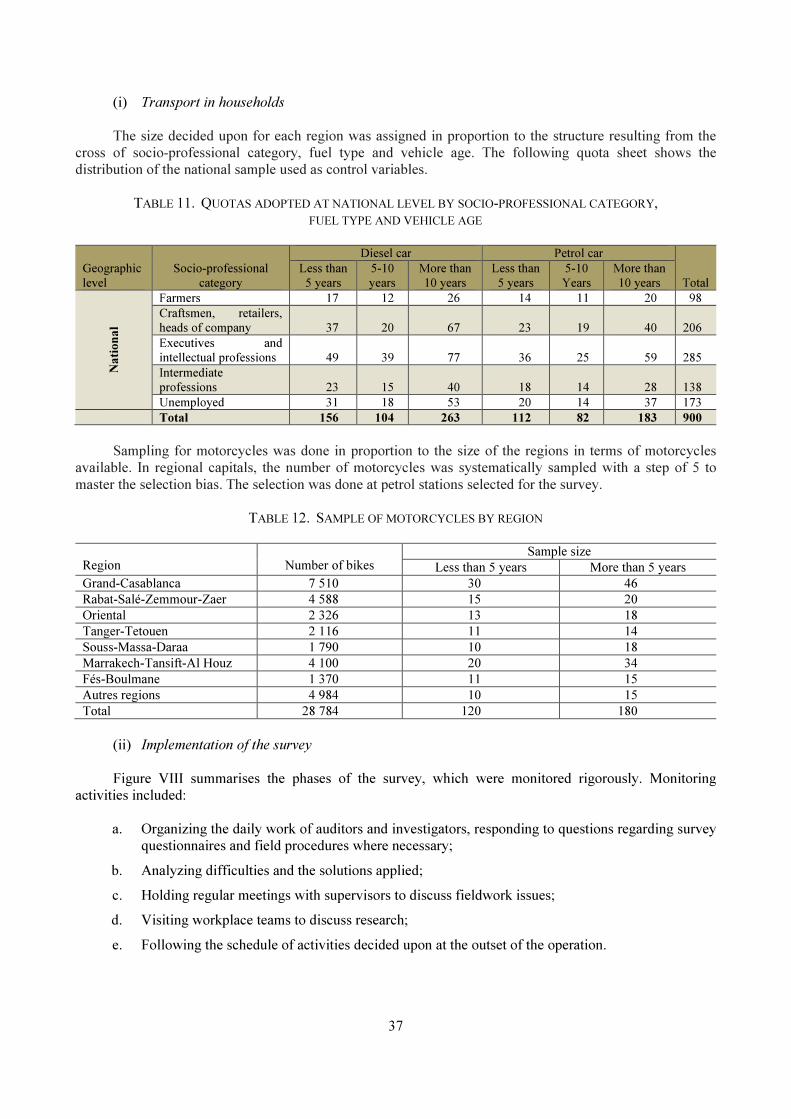
37
(i) Transport in households
The size decided upon for each region was assigned in proportion to the structure resulting from the
cross of socio-professional category, fuel type and vehicle age. The following quota sheet shows the
distribution of the national sample used as control variables.
TABLE 11. QUOTAS ADOPTED AT NATIONAL LEVEL BY SOCIO-PROFESSIONAL CATEGORY,
FUEL TYPE AND VEHICLE AGE
Geographic
level
Socio-professional
category
Diesel car Petrol car
Total
Less than
5 years
5-10
years
More than
10 years
Less than
5 years
5-10
Years
More than
10 years
Nati
on
al
Farmers 17 12 26 14 11 20 98
Craftsmen, retailers,
heads of company 37 20 67 23 19 40 206
Executives and
intellectual professions 49 39 77 36 25 59 285
Intermediate
professions 23 15 40 18 14 28 138
Unemployed 31 18 53 20 14 37 173
Total 156 104 263 112 82 183 900
Sampling for motorcycles was done in proportion to the size of the regions in terms of motorcycles
available. In regional capitals, the number of motorcycles was systematically sampled with a step of 5 to
master the selection bias. The selection was done at petrol stations selected for the survey.
TABLE 12. SAMPLE OF MOTORCYCLES BY REGION
Region Number of bikes Sample size
Less than 5 years More than 5 years
Grand-Casablanca 7 510 30 46
Rabat-Salé-Zemmour-Zaer 4 588 15 20
Oriental 2 326 13 18
Tanger-Tetouen 2 116 11 14
Souss-Massa-Daraa 1 790 10 18
Marrakech-Tansift-Al Houz 4 100 20 34
Fés-Boulmane 1 370 11 15
Autres regions 4 984 10 15
Total 28 784 120 180
(ii) Implementation of the survey
Figure VIII summarises the phases of the survey, which were monitored rigorously. Monitoring
activities included:
a. Organizing the daily work of auditors and investigators, responding to questions regarding survey
questionnaires and field procedures where necessary;
b. Analyzing difficulties and the solutions applied;
c. Holding regular meetings with supervisors to discuss fieldwork issues;
d. Visiting workplace teams to discuss research;
e. Following the schedule of activities decided upon at the outset of the operation.

38
Figure VIII. Survey implementation process
Organization of work
Unit Task
Investigators Administration of questionnaires
Questionnaire reception unit Conformity check of questionnaires Coding of questionnaires Sector classification
Questionnaire control unit Complementary checking
Data entry unit Data entry monitored by data input supervisor
Treatment unit Initial use of sectoral results to ensure good performance of process control and input. If error is detected, return to cell 3
4. Difficulties and solutions
The most common problems with the collection of data by questionnaire are lateness in replying, or
the failure or refusal of respondents to cooperate. Often companies must be contacted repeatedly before the
appropriate person (usually the head of the company) completes the questionnaire. A degree of gentle
persistence is thus frequently required. It can be helpful to emphasize the national importance of collecting
such data. Similarly, it is frequently found that people at petrol stations do not wish to be interviewed. One
option is to approach customers who may have more time, such as those having their vehicles washed. For

39
mixed transport, surveyors should head to rural areas. It was found that much company information provided
by HCP for this survey was obsolete and required time-consuming research to bring up to date.
5. Extrapolation methods
The extrapolation methods used for all surveyed sectors were as follows:
(a) Households
Global energy consumption = Residential vehicles * Annual average consumption/vehicle.
With:
Residential vehicles = b * V * P2011*S.
• b: Proportion of households (urban, rural) with a vehicle. Source: 2007 HCP standard of
living survey.
• V: Average number of vehicles per household (ECET data estimate).
• P2011: Urban and rural population in 2001 (HCP estimate).
• S: Structure of residential vehicles (ECET data estimate).
Annual average consumption/vehicle: ECET estimate of coefficient by diesel and gasoline products
for passenger vehicles, vans and motorcycles.
(b) Industry, construction, energy and mines
The estimate of final transport energy consumption in the industry, construction, energy and mines
sectors was based on:
(i) Technical coefficients of annual energy consumption by type of vehicle and fuel. This
information was estimated directly using the survey results;
(ii) The number of vehicles available per company by type of vehicle and fuel, and the size of the
company in terms of turnover and number of employees. The estimate of the number of cars in
these sectors was based on knowledge of the number of companies operating in each sector and
available aggregated information about them.
(c) Transport
The estimate of final energy consumption by vehicles in the transport sector itself took into
consideration the specific features of each type of transport.
(i) Estimates regarding taxis were based on technical coefficients for annual energy consumption by
type of vehicle and fuel. The information was estimated directly using survey results and the
number of taxis per category available from the Ministry of Transport. The same method was
applied to mixed transport, bus, freight, passenger transport and tourism;
(ii) For auxiliary transport, calculations took into account the number of companies operating in the
sector and the average number of vehicles per company.

40
(d) Agriculture
The estimate of final transport energy consumption in agriculture was based on:
(i) Technical coefficients for annual energy consumption by type of vehicle and fuel. The
information was estimated directly using survey results;
(ii) Data on the surface area of farmland;
(iii) Data from the 2007 standard of living survey related to the availability of cars in rural
households.
(e) Services sector
The estimate of final transport energy consumption in the services sector took into consideration the
specific features of each branch making up the sector. For retail, it was based on: (i) Technical coefficients of annual energy consumption by type of vehicle and fuel. The information
was estimated directly using survey results;
(ii) The number of vehicles available per company by type of vehicle and fuel and the number of
employees;
(iii) The number of employees in the structured retail sector. The main results obtained were: (i) Energy consumption data for households, passenger and utility vehicles, motorcycles, rail
passenger and freight transport, air transport, maritime transport, the tourism sector, mixed
transport, urban transport by bus and taxi, staff transport and the State motor vehicle fleet;
(ii) Technical characteristics of energy consumption linked to transport by economic sector according
to type of vehicle and fuel, age of vehicle, tonnage and seasonal impact on energy consumption.
C. PALESTINE In 2010, the Palestinian Central Bureau of Statistic (PCBS) conducted a survey on the transport
activities of industrial and service companies. The first such survey took place in 1996. The objective
was to provide the following data:
• Number of vehicles used in the transport sector by area;
• Number of employees in the sector and their classification;
• Value of production;
• Intermediary consumption including energy;
• Value added of the activity.
1. Methodology Target activities PCBS used ISIC Rev.3 for its survey, which for transport covered enterprises mostly involved in: (a) Passenger transport with unspecified schedules;
(b) Road transport of goods.

41
2. Target population
The target population included the following vehicles:
(a) Ministry of Public Transport passenger vehicles (8,319 vehicles);
(b) Private vehicles engaged in public passenger transport (2,178 vehicles);
(c) Goods vehicles: Trucks of all kinds and sizes used in the public transport of goods with
payment (448 vehicles).
3. Sampling
A stratified random sample was used in the survey and the sample selection mechanism was
as follows:
(a) Sample included all stations identified in the framework;
(b) Comprehensive inventory of vehicles in small stations (stations in which the number of vehicles
is less than or equal to five vehicles);
(c) Other stations with layers of 36 vehicles or fewer, two vehicles were selected from the class;
(d) In other layers containing 37 vehicles and more, the sample size was commensurate with the size
of the class. The sample included 1,731 vehicles out of a total of 10,945. The distribution of the selected
vehicles was based on their age and weight.
4. Data collection The survey data were collected based on personal interviews with owners or drivers of vehicles by
trained surveyors.
5. Example of results The following table presents the main results of the survey.
TABLE 13. NUMBER OF VEHICLES, EMPLOYED PERSONS AND MAIN ECONOMIC INDICATORS Value in Million United States dollars
2010 2009 2008 2007 2006 2005 2004 2003
Number of vehicles 10 945 10 791 10 189 10 087 11 337 11 327 11 144 10 434
Number of employees 11 535 11 656 10 846 10 919 11 837 12 072 11 866 11 424
Salaries 17.0 16.9 9.3 11.3 7.4 5.9 5.6 3.9
Production 241.5 226.2 177.5 170.8 168.3 162.6 129.6 132.3
Intermediary consumption 129.5 120.9 97.7 93.5 86.7 84.5 63.0 60.1
Added value 112.0 105.3 79.8 77.3 81.6 78.1 66.6 72.3
D. TUNISIA
1. Introduction Tunisia was a pioneer in implementing an appropriate institutional framework to support energy
efficiency programmes. Today, ANME aims to be at the heart of State energy policy, taking the lead in
the design and implementation of strategies, especially in transport.8
8 Information in this section is largely based on a survey of energy consumption by private cars conducted by ANME and
Alcor in 2008, and the Ministry of Transport’s low carbon transport development strategy of 2010.

42
Efficient use of energy in transport is the direct responsibility of the Ministry of Transport, but the
policies of other ministries and municipalities frequently stand in contradiction to energy efficiency
objectives. ANME attempts to work with transport stakeholders in order to implement the State’s energy
objectives. The complexity of the transport sector means that considerable efforts should be made to
achieve those ends.
One of the aims of the Greater Tunis Urban Agency (AUGT - Agence d’urbanisme du Grand
Tunis) was to promote discussion of issues, including transport, affecting the largest urban area in
Tunisia. In 1995, however, the Agency was placed under the authority of the Ministry of Equipment and
lost executive power, mainly with regard to local communities in charge of urban mobility. Regional
transport authorities were instituted by law but never created. The following table summarizes barriers
hampering the efficient use of energy in transport.
TABLE 14. BARRIERS HAMPERING THE EFFICIENT USE OF ENERGY IN TRANSPORT
Responsibility for
organization of
transport activities
• The Ministry of Transport, a key player in the area of transport energy efficiency, does not systematically enforce its role;
• Relations between ministries are difficult in terms of design and development of infrastructure, especially for public transport;
• Municipalities, the bodies most involved in public transport and best placed to understand local needs, do not have the necessary institutional capacity;
• ANME has been unable to become an effective and influential leader in the implementation of energy policy.
Responsibility for
infrastructure and
road networks
• The Ministry of Equipment is not required to comply with the wishes of the Ministry of Transport and has full authority over transport master plans;
• Municipalities are responsible for secondary road networks, but do not have adequate funding to maintain or modify them;
• Consultations on infrastructure projects involving several municipalities are complicated by the absence of a centralized structure to facilitate decision-making;
• Public transport development plans are decided by the Ministry of Transport but municipalities are not always able to provide the required land.
Actions requiring
horizontality
• ANME requires appropriate human resources to accomplish its mission and as long as AUGT reports to the Ministry of Equipment it will not have sufficient authority to facilitate decision-making involving several municipalities.
The Ministry of Transport is the first stop for information on transport, with databases on car
registration, technical vehicle inspections, and vehicle usage. The Ministry of Finance also provides input
with information on vehicles (type, power, fiscal power category, payload, and so forth) obtained through
road taxes, and other taxes on heavy oil engines, LPG vehicles and road transport. The main
variables/indicators used for the transport of passengers were as follows:
• Real consumption of public transport companies broken down by area (urban and inter-
urban);
• Operation data of companies in terms of the number of passengers transported and average
distances travelled;
• The number of individual passenger transport vehicles (private vehicles, taxis, inter-city taxis
and so on), calculated on the basis of the car registration database corrected by the real
number of private cars in operation;
• Estimate of the unitary consumption of individual passenger transport vehicles;
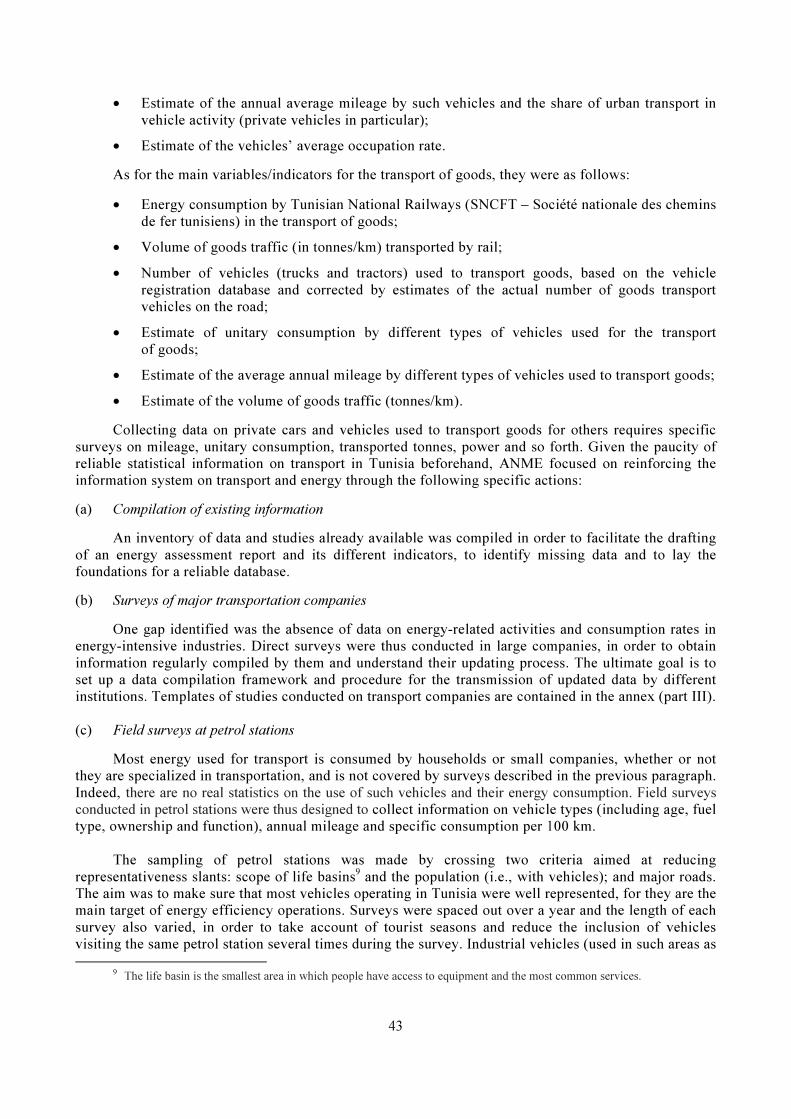
43
• Estimate of the annual average mileage by such vehicles and the share of urban transport in
vehicle activity (private vehicles in particular);
• Estimate of the vehicles’ average occupation rate. As for the main variables/indicators for the transport of goods, they were as follows:
• Energy consumption by Tunisian National Railways (SNCFT – Société nationale des chemins
de fer tunisiens) in the transport of goods;
• Volume of goods traffic (in tonnes/km) transported by rail;
• Number of vehicles (trucks and tractors) used to transport goods, based on the vehicle
registration database and corrected by estimates of the actual number of goods transport
vehicles on the road;
• Estimate of unitary consumption by different types of vehicles used for the transport
of goods;
• Estimate of the average annual mileage by different types of vehicles used to transport goods;
• Estimate of the volume of goods traffic (tonnes/km). Collecting data on private cars and vehicles used to transport goods for others requires specific
surveys on mileage, unitary consumption, transported tonnes, power and so forth. Given the paucity of
reliable statistical information on transport in Tunisia beforehand, ANME focused on reinforcing the
information system on transport and energy through the following specific actions: (a) Compilation of existing information An inventory of data and studies already available was compiled in order to facilitate the drafting
of an energy assessment report and its different indicators, to identify missing data and to lay the
foundations for a reliable database. (b) Surveys of major transportation companies One gap identified was the absence of data on energy-related activities and consumption rates in
energy-intensive industries. Direct surveys were thus conducted in large companies, in order to obtain
information regularly compiled by them and understand their updating process. The ultimate goal is to
set up a data compilation framework and procedure for the transmission of updated data by different
institutions. Templates of studies conducted on transport companies are contained in the annex (part III).
(c) Field surveys at petrol stations Most energy used for transport is consumed by households or small companies, whether or not
they are specialized in transportation, and is not covered by surveys described in the previous paragraph.
Indeed, there are no real statistics on the use of such vehicles and their energy consumption. Field surveys
conducted in petrol stations were thus designed to collect information on vehicle types (including age, fuel
type, ownership and function), annual mileage and specific consumption per 100 km.
The sampling of petrol stations was made by crossing two criteria aimed at reducing
representativeness slants: scope of life basins9 and the population (i.e., with vehicles); and major roads.
The aim was to make sure that most vehicles operating in Tunisia were well represented, for they are the
main target of energy efficiency operations. Surveys were spaced out over a year and the length of each
survey also varied, in order to take account of tourist seasons and reduce the inclusion of vehicles
visiting the same petrol station several times during the survey. Industrial vehicles (used in such areas as
9 The life basin is the smallest area in which people have access to equipment and the most common services.
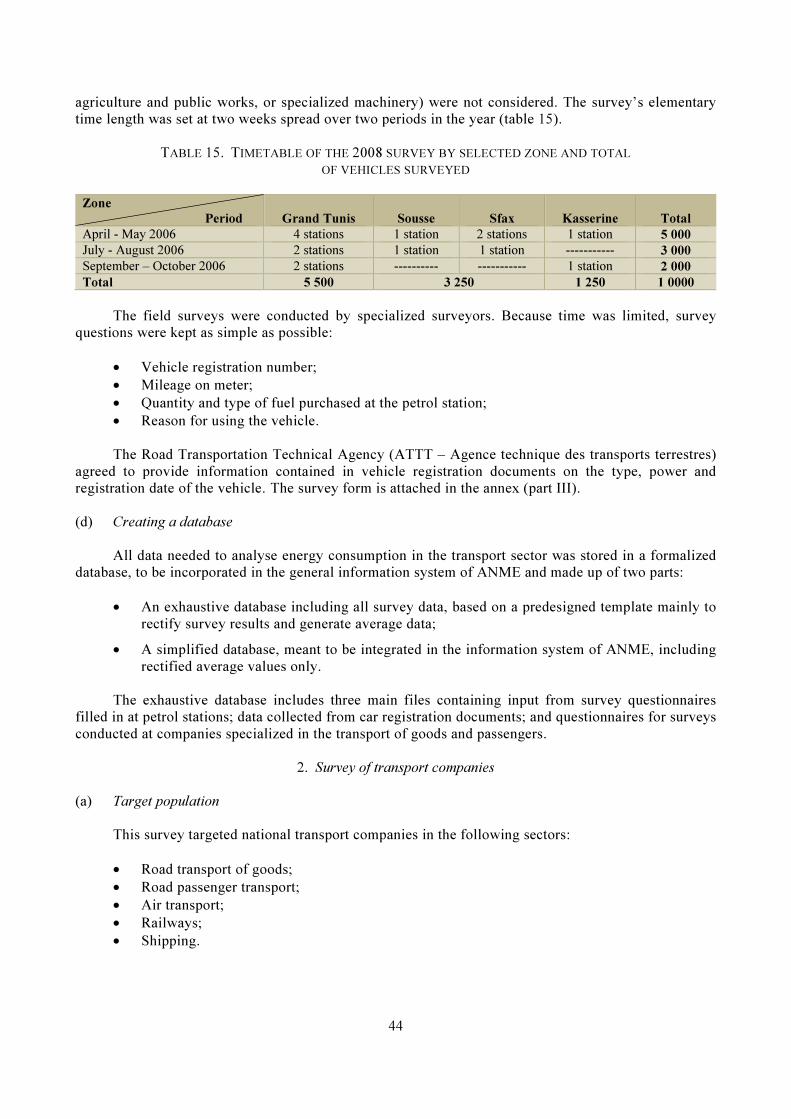
44
agriculture and public works, or specialized machinery) were not considered. The survey’s elementary
time length was set at two weeks spread over two periods in the year (table 15).
TABLE 15. TIMETABLE OF THE 2008 SURVEY BY SELECTED ZONE AND TOTAL
OF VEHICLES SURVEYED
Zone
Period Grand Tunis Sousse Sfax Kasserine Total
April - May 2006 4 stations 1 station 2 stations 1 station 5 000
July - August 2006 2 stations 1 station 1 station ----------- 3 000
September – October 2006 2 stations ---------- ----------- 1 station 2 000
Total 5 500 3 250 1 250 1 0000
The field surveys were conducted by specialized surveyors. Because time was limited, survey
questions were kept as simple as possible:
• Vehicle registration number;
• Mileage on meter;
• Quantity and type of fuel purchased at the petrol station;
• Reason for using the vehicle.
The Road Transportation Technical Agency (ATTT – Agence technique des transports terrestres)
agreed to provide information contained in vehicle registration documents on the type, power and
registration date of the vehicle. The survey form is attached in the annex (part III).
(d) Creating a database
All data needed to analyse energy consumption in the transport sector was stored in a formalized
database, to be incorporated in the general information system of ANME and made up of two parts:
• An exhaustive database including all survey data, based on a predesigned template mainly to
rectify survey results and generate average data;
• A simplified database, meant to be integrated in the information system of ANME, including
rectified average values only.
The exhaustive database includes three main files containing input from survey questionnaires
filled in at petrol stations; data collected from car registration documents; and questionnaires for surveys
conducted at companies specialized in the transport of goods and passengers.
2. Survey of transport companies
(a) Target population
This survey targeted national transport companies in the following sectors:
• Road transport of goods;
• Road passenger transport;
• Air transport;
• Railways;
• Shipping.
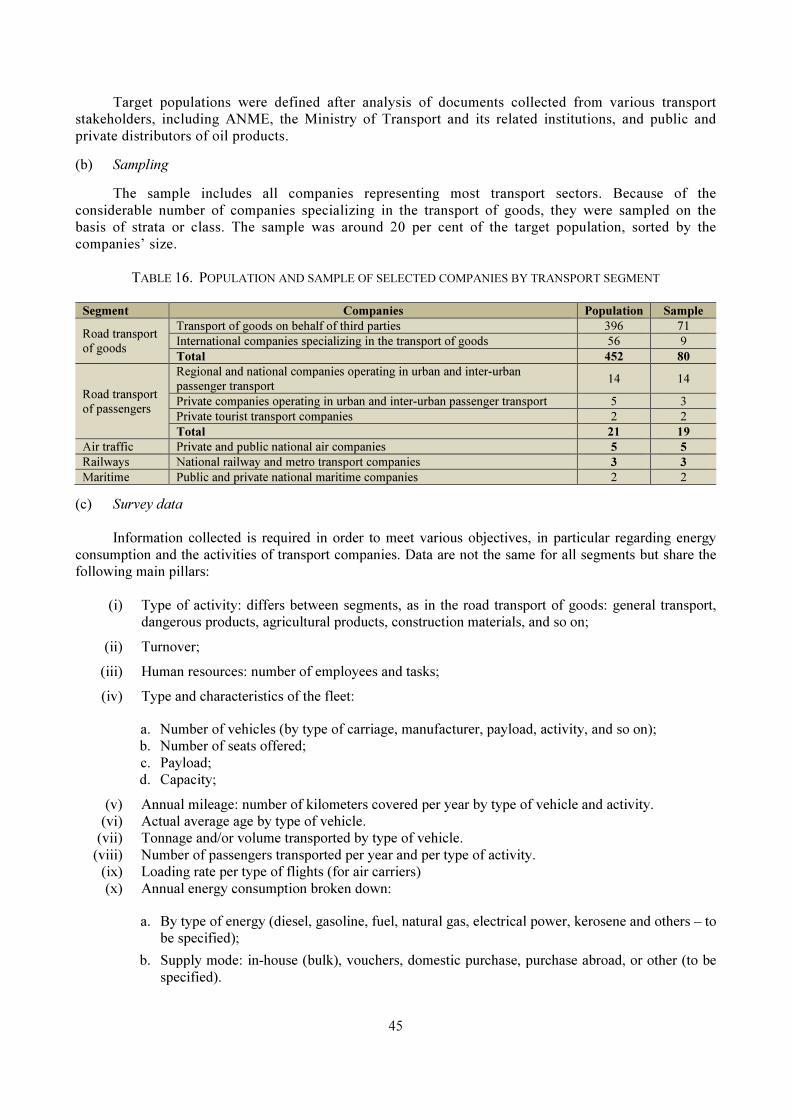
45
Target populations were defined after analysis of documents collected from various transport
stakeholders, including ANME, the Ministry of Transport and its related institutions, and public and
private distributors of oil products. (b) Sampling The sample includes all companies representing most transport sectors. Because of the
considerable number of companies specializing in the transport of goods, they were sampled on the
basis of strata or class. The sample was around 20 per cent of the target population, sorted by the
companies’ size.
TABLE 16. POPULATION AND SAMPLE OF SELECTED COMPANIES BY TRANSPORT SEGMENT
Segment Companies Population Sample
Road transport
of goods
Transport of goods on behalf of third parties 396 71
International companies specializing in the transport of goods 56 9
Total 452 80
Road transport
of passengers
Regional and national companies operating in urban and inter-urban
passenger transport 14 14
Private companies operating in urban and inter-urban passenger transport 5 3
Private tourist transport companies 2 2
Total 21 19
Air traffic Private and public national air companies 5 5
Railways National railway and metro transport companies 3 3
Maritime Public and private national maritime companies 2 2
(c) Survey data
Information collected is required in order to meet various objectives, in particular regarding energy
consumption and the activities of transport companies. Data are not the same for all segments but share the
following main pillars:
(i) Type of activity: differs between segments, as in the road transport of goods: general transport,
dangerous products, agricultural products, construction materials, and so on;
(ii) Turnover;
(iii) Human resources: number of employees and tasks;
(iv) Type and characteristics of the fleet:
a. Number of vehicles (by type of carriage, manufacturer, payload, activity, and so on);
b. Number of seats offered;
c. Payload;
d. Capacity;
(v) Annual mileage: number of kilometers covered per year by type of vehicle and activity.
(vi) Actual average age by type of vehicle.
(vii) Tonnage and/or volume transported by type of vehicle.
(viii) Number of passengers transported per year and per type of activity.
(ix) Loading rate per type of flights (for air carriers)
(x) Annual energy consumption broken down:
a. By type of energy (diesel, gasoline, fuel, natural gas, electrical power, kerosene and others – to
be specified);
b. Supply mode: in-house (bulk), vouchers, domestic purchase, purchase abroad, or other (to be
specified).
46
Data are annual and requested for the five previous years. Complementary data are also requested in
order to shed light on the company’s energy strategy. Questions include:
• Is the company subject to a mandatory periodical audit and to what extent does it fulfil energy
audits and programme contracts?
• What kind of staff (qualifications) and technical resources are allocated to follow-up on the
company’s energy performance?
• What are the company’s prospects and plans in terms of expansion and restructuring?
(d) Conducting the survey
The survey was conducted by means of field research and postal interviews. The first phase involved
reaching out to companies to identify counterparts and explain the survey’s objectives. Later, a letter of
introduction from ANME and a copy of the questionnaire were sent by post, fax and/or email and
counterparts requested to fill in the latter.
Regular reminders were sent to make sure that questionnaires had been received and to assess the level
of the questionnaire’s difficulty for respondents. Clarifications were provided where necessary. Where
questionnaires were not returned, surveyors visited companies to conduct interviews, settle difficulties and
encourage counterparts to fill in and return the questionnaires.
(e) Data processing
Data processing refers to the calculation of average and percentage rates for each type of information
by class of vehicle. Results were sought in the following areas:
(i) Energy unitary consumptions
a. C/100 km per vehicle category and mode of use;
b. Specific consumption per service unit according to the vehicle category and the type of use:
traveller, passengers/km, tonne, tonne/km;
(ii) Usage conditions of road vehicles
a. Km/year by vehicle category and mode of use;
b. Average annual load rate: passengers-year/vehicle; pass-km/vehicle-km; pass-km/seats-km,
tonnes-year/vehicle, tonnes-km/vehicle-km, tonnes-km/(CU * km/year), % km-an empty
load;
c. Average age per vehicle category and mode of use;
(iii) Fleets
a. Vehicle fleets according to categories and modes of use;
b. Vehicles-km per vehicle category and mode of use;
c. Annual services according to the vehicle category and mode of use: passengers transported
per year, passengers-km, tonnes transported per year; tonnes-km.

47
3. Petrol station survey
(a) Target population
The petrol station survey is designed for users of various means of transport, collective and private,
not included in the first survey category (private individuals, small companies, public administration, taxis,
and so on) as they represent by far the largest energy consumers in the transport sector. The target population
is made up of consumers using petrol stations run by various distributors of oil products around the country.
(b) Sampling petrol stations
Petrol station samples were made by crossing several criteria in order to reduce representativeness
slants of the fleet of vehicles:
(i) Volume and structure of fuel products in petrol stations;
(ii) Geography;
(iii) Main roads;
(iv) Scope of life basins and of the population (mainly those with vehicles);
(v) Volume and structure of the vehicle fleet operated by petrol station customers.
Crossing criteria aims at ensuring appropriate representativeness of vehicles operated.
(c) Survey periods
Survey periods were decided upon by crossing two criteria, the length of the each survey and their
spacing out over a year, in order to limit overrepresentation slants of frequent travellers and of particular
seasons, with a view to reducing the inclusion of vehicles visiting a given petrol station several times during
the survey and also taking account of seasonal effects (such as tourism and the school year). The surveys’
basic time length was set at one month and three periods were selected, each in a different season. The total
number of surveyed vehicles was 10,000.
(d) Survey data
As vehicles’ passage times in petrol stations are very short, it was agreed with ATTT to limit data
collection there to information not available in vehicle registration documents. Other data were obtained
from the vehicle registration files of ATTT based on car plate numbers recorded by surveyors. The survey
form thus included only the following data:
• Car plate number; • Mileage on the meter; • Quantity and type of fuel purchased at the petrol station; • Vehicle use.
Information in car registration documents and accessible with the vehicle number plate included:
• Type of vehicle; • Fiscal power category; • First operation date; • First time registered in Tunisia.

48
Figure IX. Geographical and time distribution of the sample used in the survey
(e) Collection and compilation of metadata
In this phase, a metadata base is designed by compiling information from each survey, and providing a
space for the classification and storage of data generated by them.
Metadata are extracted and collected from the surveys’ key documents, such as: questionnaires, forms
and tender documents. In surveys, metadata constitute structured information sets used to describe given
concepts. For example, metadata describing the concept “vehicle” are given in figure X. The list of defined
metadata hence constitutes the data dictionary.
Figure X. Metadata describing the concept “vehicle”
Tunis
Station Period
Mohammed V April - May 2006 X
Sokra July-Agust 2006 X
Ennasr September-October 2006 X
Charguia Total number of surveyed vehicles 5500
Sousse-Sfax
Station Period
Oued El Khroub (Sousse) April - May 2006 X
Oued El Khroub (Sousse) July-Agust 2006 X
Teniour (Sfax) September-October 2006
Sagaz (Sfax) Total number of surveyed vehicles 3250
Kasserine
Station Period
April - May 2006
July-Agust 2006
September-October 2006 X
Total number of surveyed vehicles 1250
(In discussion with the
company)
Vehicle Station
Registration number Number
Genre Governorate
Date of first registration location
Company Passage
Date/time
Mileage
Fuel
Amount
Sousse
Kasserine
Tunis
Sfax

49
Metadata are compiled and then classified in a flow chart made up of several independent but
interrelated entities. Every entity represents a well defined type of information. The flow chart is the basic
document used to build and prepare the storage space for survey data. Survey data are then classified and
stored in individual Excel folders. This type of storage is used to structure, centralize and share information
in well defined tables that can be handled easily and which offer the flexibility to duplicate data and perform
complicated analysis without the need to edit basic data. (f) Data input and preparation After preparing the space for data classification and storage, agents in charge of the survey performed
the following operations: (i) Collection of all data files: returned questionnaires, ATTT files (Excel), energy conversion tables,
and so forth;
(ii) Input of primary data from survey questionnaires into classification files;
(iii) Preparation of aggregates, tabs and other secondary or analytical data taken from other sources
or studies;
(iv) Drafting of all scripts/programmes used to produce or transform data files, for the input of data,
correction and imputation, conversion, aggregation, tabulation and analysis. (g) Data processing Data processing refers to the calculation of average and percentage rates for each type of information
by class of vehicle. Processing groups are as follows: (i) Distribution and sale of fuel products in petrol stations per car category and type of use: a. Gasoline (normal and super), lead-free, diesel and LPG;
b. Private cars (including private versus professional; <= 4 HP, 5-7 HP, > 7 HP), taxis, inter-
city taxis, light commercial vehicles, trucks, road tractors, public transport buses. (ii) Annual mileage by type of road vehicle: a. Gasoline (normal and super), lead-free, diesel and LPG;
b. Private cars (including private versus professional; <= 4 HP, 5-7 HP, > 7 HP), taxis, inter-
city taxis, light commercial vehicles, trucks, road tractors, public transport buses;
c. Age: < 1 year, 1-2 years, 2-3 years, 3-5 years, 5-7 years, 7-10 years, 10-15 years, 15-20
years, > 20 years. (iii) Structure of vehicle fleets: Gasoline (normal and super), lead-free, diesel and LPG for each vehicle category: Private cars
(including private versus professional; <= 4 HP, 5-7 HP, > 7 HP), taxis, inter-city taxis, light commercial
vehicles, trucks, road tractors, public transport buses. (h) Rectifying data/results Rectifications aim to improve the quality of data and reliability of analyses. The following slant
sources were applied to this survey: (i) Obvious input errors and distortions;
(ii) Multiple passages;
(iii) Seasonal aspect;
(iv) Overrepresentation of frequent travellers.

Rectifying input errors involves
detect aberrations by comparing data of every series to averages or to reference thresholds/levels, and hence
eliminating extreme series or those
with mileage of below 3,000 km/year and aged more than one year
Multiple passages imply an overrepresentation of some individuals, which may distort the sample’s
value. They were identified by recurrence of the s
The seasonal use of some vehicles (
survey not covering the entire year.
in the sale of fuel at petrol stations. Data
time periods.
The overrepresentation of frequent
surveying a given vehicle (time spent
lead to inflated estimates of average annual mileage of the
of coefficients that was applied to fleets, defined according to km/year/vehicle reports depending on their
age class.
(i) Example of results
The survey in petrol stations
according to the type and age of the
Figure XI. Average annual distance travelled by private cars by fuel type and age
50
involves installing automatic filters or reading through data series in order to
detect aberrations by comparing data of every series to averages or to reference thresholds/levels, and hence
those not respecting selected references. For example,
000 km/year and aged more than one year were eliminated.
Multiple passages imply an overrepresentation of some individuals, which may distort the sample’s
identified by recurrence of the same number plate and eliminated.
The seasonal use of some vehicles (for instance for holidays, agriculture or
survey not covering the entire year. Such distortions were noted through the considerable seasonal variations
stations. Data were rectified by conducting several surveys s
The overrepresentation of frequent travellers was explained by the fact that t
time spent at the petrol pump) was higher than the annual mileage
average annual mileage of the vehicle fleet. This was rectified by setting up a set
applied to fleets, defined according to km/year/vehicle reports depending on their
stations made it possible to determine the average annual
according to the type and age of the vehicle. Figure XI presents some typical results:
Average annual distance travelled by private cars by fuel type and age
automatic filters or reading through data series in order to
detect aberrations by comparing data of every series to averages or to reference thresholds/levels, and hence
. For example, the passage of vehicles
Multiple passages imply an overrepresentation of some individuals, which may distort the sample’s
or tourism) can distort a
noted through the considerable seasonal variations
rectified by conducting several surveys spread over various
explained by the fact that the probability of
higher than the annual mileage, which could
rectified by setting up a set
applied to fleets, defined according to km/year/vehicle reports depending on their
the average annual distance travelled
typical results:
Average annual distance travelled by private cars by fuel type and age

51
VI. RECOMMENDATION FOR SURVEY PLAN
A national energy information system (EIS) should be developed (or improved). It should be based on
the “distributed model”, in which compatible information and data management systems are hosted by
institutions with statutory mandates for the respective datasets. The sharing of common data infrastructure
will guarantee harmonization of the different sets of data required for national energy statistics planning. It
is vital that data be harmonized using international standards. Institutions already developing information
systems or databases should form the nucleus of the EIS community. Building consensus is critical for
improving access to quality energy data. With a view to putting in place a national work plan, the following
initiatives are recommended.
A. SHORT TERM
1. Set up thematic energy use statistics according to the structure flow of energy balances (international
standard) on industrial, transport, public administration, services, residential, agricultural and other
economics sectors.
2. Select transport as a pilot project in order to build teamwork and experience among staff.
3. Establish a framework for managing energy statistics, including:
(a) Creation of an EIS steering committee;
(b) Establishment of an EIS technical committee;
(c) Initiatives to develop, improve and formalize a national network of EIS institutions (data centres);
(d) Nomination of a lead agency, preferably a joint body comprising the national statistics office and
Ministry of Energy or equivalent;
4. Conduct an inventory of existing and new transport energy use data and related metadata.
5. Use the national register or census to prepare a list frame: enterprises, households, vehicles, and so on.
6. Verify the state of available statistics on energy consumption and GHG emissions.
7. Analyse the methodologies used in technical vehicle inspections.
8. Research the availability of funds for conducting a transport survey.
B. MEDIUM AND LONG TERM
Implementation of the transport energy use survey will include the following activities:
1. Formulation of sampling design.
2. Questionnaire preparation (pre-test, revision, printing and manuals).
3. Field work and data processing.
4. Release of survey results and report.
5. Aggregation of data according to ISIC/NACE Integration of data in EB (international standard).
6. Calculation of GHG emissions and related energy efficiency indicators.
7. Training on LEAP model.

52
8. Creation of an energy and transport forecasting and planning team.
9. Production of sectoral publications.
At the same time, parallel projects could be launched to cover other sectors.
C. CHALLENGES
Lack of funding can compromise a survey of this type. Other problems can be associated with human
resources:
1. Lack of qualifications and experience among staff.
2. Inadequate profile of participants in training and workshops with non-transmission of documents,
training materials, knowledge and expertise.
3. Lack of autonomy and initiative.
4. Staff turnover.
5. Failure to respect administrative hierarchy and colleagues.
The work programme can suffer from:
1. Failure to maintain confidentiality or share information and data where appropriate.
2. Inadequate evaluation.
3. Lack of commitment from the institutions involved.
4. Absence of a strategic view of the importance of final energy consumption surveys.
5. Lack of clear roles and lines of complementarity for the institutions involved.
A quality control system should be developed to monitor each step of the EIS implementation process
and address such issues as:
1. Definition, understanding and acceptance of the role of “data custodian”.
2. Development and adoption of a common database architecture.
3. Harmonization of classification and coding systems.
4. Adoption of standard data cataloguing procedures.
5. Adoption of common data quality and metadata standards.
6. Privacy, confidentiality and freedom of information.
7. Conditions of access to data.
8. Priorities for investments to build and maintain the data infrastructure.
9. Cost-recovery mechanisms and private sector involvement.
10. Priorities for personnel development, including training.

53
Annex
I. CANADA: QUALITY ASSURANCE FRAMEWORK, PRACTICAL
CHECKLIST AND QUESTIONNAIRE
A. QUALITY CONTROL Canada’s central statistical agency was created under the Statistics Act and is authorized to collect and
publish statistical information. Ultimately accountable to Parliament, it has developed corporate
accountability policies, standards and guidelines, consolidated in its policy manual under five themes:
External relations, content of products, dissemination, confidentiality and internal management. Statistics
Canada’s quality assurance framework is a set of management, operating and consultative practices,
procedures and mechanisms used to manage the quality of its information products. In applying the principles of Statistics Canada’s Quality Assurance Framework, its Manufacturing,
Construction and Energy Division strives to meet six key criteria of “quality” or "fitness for use": the
relevance, accuracy, timeliness, accessibility, interpretability and coherence of data in the Division’s surveys
of energy production, trade and consumption and related publications. The first three of those criteria are the
direct concern of survey managers.
1. Relevance This criterion addresses user needs in relation to budgetary possibilities. User needs are identified
through bilateral and multilateral liaison with major users, through information and advice provided by
statistical organizations and consultative groups and through user feedback on existing products and services.
All programmes are regularly reviewed and budgetary possibilities are balanced against user needs. Those
processes determine which programmes will be carried out, their broad objectives and the resources available
for them.
2. Accuracy Management of accuracy requires particular attention during the design, implementation and
assessment phases of a statistical activity, each one built on the others. Statistics Canada’s Policy on
Informing Users of Data Quality and Methodology requires that at least the following four primary areas of
accuracy assessment be considered in all programmes: assessment of the coverage of the survey; assessment
of sampling error where sampling was used (standard errors, or coefficients of variation, should be provided
for key estimates); non-response rates and estimates of the impact of imputation; and descriptions or
measures of other serious accuracy or consistency problems with the survey results. Measures of accuracy
are also an important input for programme review for assessing whether user requirements are being met,
and for allowing appropriate analytic use of the data.
3. Timeliness Information made available well within the period during which it remains useful for its main
purposes is considered to be timely. Timeliness should be monitored in order to warn of programme
deterioration, recognize extremes of tardiness and identify good practices. However, timeliness can often be
improved only with trade-offs between accuracy and cost.
In response to some quality control incidents in data releases, Statistics Canada’s Policy Committee
set up a taskforce to review quality assurance practices of nine key statistical programmes. The conclusions
and recommendations of the taskforce were released in the “Daily Quality Assurance Review - Summary
Report”. The Policy Committee’s Record of Decision with respect to the report is available to the public. The
following checklist is used by Statistics Canada in various stages of a survey to help employees to meet
quality objectives.
54
B. PRACTICAL CHECKLIST OF QUALITY CONTROL AND ASSURANCE ACTIVITIES
OF AN EXISTING SURVEY
1. Front end of the survey
Even before survey questionnaires are mailed, key activities must be conducted:
(a) Sample verification
• Universe and sample counts of entities are verified on industry, geography and stratum levels; • Research into births and deaths of reporting entities are well examined and confirmed; • Some surveyed entities may report on a consolidated basis; confirm what is included or excluded; • Changes to the industrial and/or geographical classification of the sample are verified; • The existing sample is reviewed for name changes.
(b) Data collection
• Training: Interviewers and data capture operators are critical to the success of most data collection and capture operations. Statistics Canada ensures that they have appropriate training and tools.
Training should be more than a onetime training session and should include continuous, “live”
monitoring of skills;
• Contacting NEW respondents before a survey is conducted is beneficial in several ways:
o Opportunities to identify changes in mailing address or telephone numbers;
o Opportunities to identify the proper contact person in an organization and to establish a rapport with that person;
• Ongoing verification of coverage and activity: For a survey collected on a monthly basis, it is important to verify your existing sample in terms of its coverage and activities on a regular basis;
• Historical and consistency editing of units: Having a collection processing system that has built-in historical and consistency edits of the responding units is a key factor;
• Capture relevant respondent comments: What are companies or respondents telling you in the “Comments Area”? In several surveys, these comments have been used to analyse the data and help
write the analytical text;
• Feedback mechanisms: If the data collection is conducted by another part of your organization or region, a feedback mechanism between the two parts of the organization helps to clarify data and
coverage issues. Video conferencing can be used to bridge the communication gap between the
collection staff and analysts.
2. Back end of the survey
The respondents are asked to complete the questionnaire and certify the information contained in their
responses to be “complete and correct”. The next steps are the editing, imputation and estimation activities of
quality control and assurance.
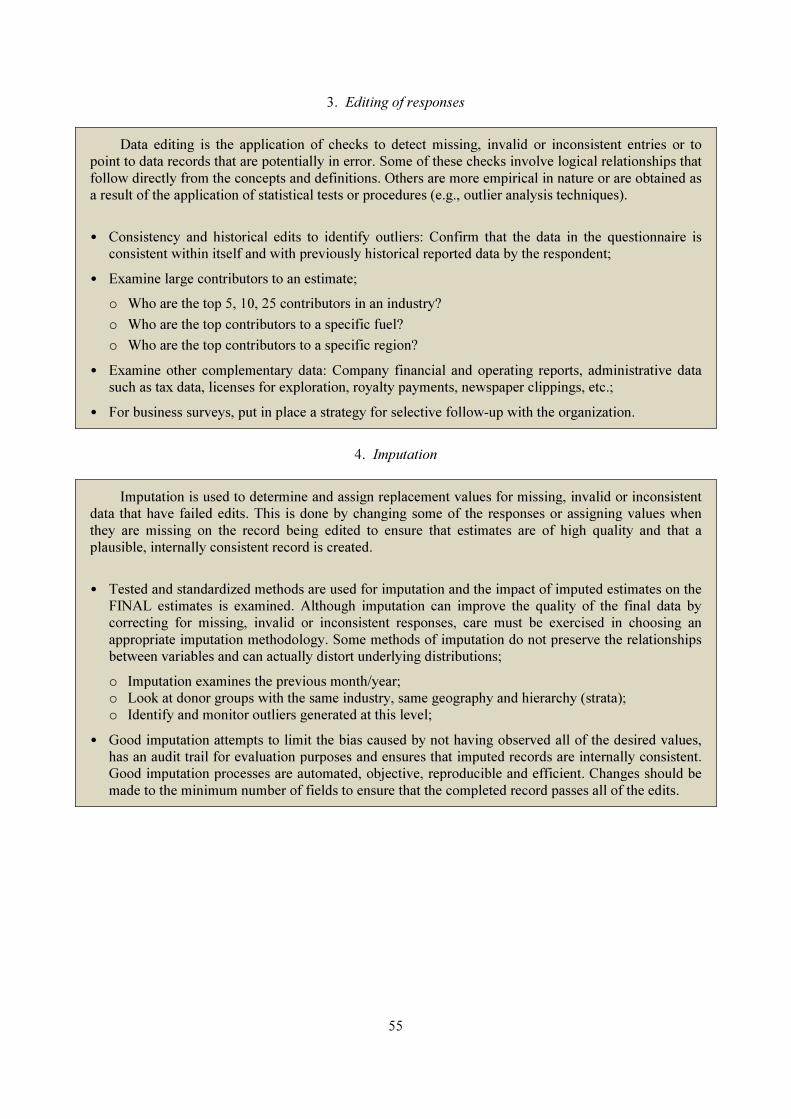
55
3. Editing of responses
Data editing is the application of checks to detect missing, invalid or inconsistent entries or to
point to data records that are potentially in error. Some of these checks involve logical relationships that
follow directly from the concepts and definitions. Others are more empirical in nature or are obtained as
a result of the application of statistical tests or procedures (e.g., outlier analysis techniques).
• Consistency and historical edits to identify outliers: Confirm that the data in the questionnaire is consistent within itself and with previously historical reported data by the respondent;
• Examine large contributors to an estimate;
o Who are the top 5, 10, 25 contributors in an industry?
o Who are the top contributors to a specific fuel?
o Who are the top contributors to a specific region?
• Examine other complementary data: Company financial and operating reports, administrative data such as tax data, licenses for exploration, royalty payments, newspaper clippings, etc.;
• For business surveys, put in place a strategy for selective follow-up with the organization.
4. Imputation
Imputation is used to determine and assign replacement values for missing, invalid or inconsistent
data that have failed edits. This is done by changing some of the responses or assigning values when
they are missing on the record being edited to ensure that estimates are of high quality and that a
plausible, internally consistent record is created.
• Tested and standardized methods are used for imputation and the impact of imputed estimates on the FINAL estimates is examined. Although imputation can improve the quality of the final data by
correcting for missing, invalid or inconsistent responses, care must be exercised in choosing an
appropriate imputation methodology. Some methods of imputation do not preserve the relationships
between variables and can actually distort underlying distributions;
o Imputation examines the previous month/year; o Look at donor groups with the same industry, same geography and hierarchy (strata); o Identify and monitor outliers generated at this level;
• Good imputation attempts to limit the bias caused by not having observed all of the desired values, has an audit trail for evaluation purposes and ensures that imputed records are internally consistent.
Good imputation processes are automated, objective, reproducible and efficient. Changes should be
made to the minimum number of fields to ensure that the completed record passes all of the edits.

56
5. Estimation
Estimation is a process that approximates unknown population parameters using only that part of
the population that is included in a sample. Inferences about these unknown parameters are then made,
using the sampled data and associated design.
• Total survey error in the estimate is the amount by which the estimate differs from the true value of the quantity for the survey population and equals the sum of the sampling error and non-sampling
error;
• The sampling error represents the error associated with estimating a parameter of interest using data from only a sample;
• Non-sampling errors reflect other reasons for having an imperfect estimator. These include coverage errors (imperfect survey frame), measurement errors and non-response errors;
• The estimation method and the sampling design determine the properties of the sampling error. Criteria to evaluate the magnitude of the sampling error include the sampling bias and sampling
variance. Estimation methods that result in both the smallest bias and the smallest sampling variance
should be chosen;
• Proper estimation conforms to the sampling design. To that end, incorporate sampling weights in the estimation process. This implies that aspects of the sampling design such as stratification, clustering,
and multiphase or multistage information are reflected in the estimation of parameters and their
associated variance estimators;
• Use auxiliary data whenever possible to improve the reliability of the estimates.
6. Quality control and assurance analysis at macro level one
Steps 1 to 5 of this checklist relate to editing, imputation and estimation as applied to individual
survey responses. When these steps are completed, analysis for quality control moves to the level of
aggregates produced from survey returns.
• Compare data to that of previous periods;
• Confront your data with data from other surveys: Production of an energy commodity has increased; What do the surveys of exports and imports of that commodity tell you? Are changes in retail sales
consistent with increased commodity production?
• If you use data from another source, make certain these estimates are final;
• Examine your quality measures: What are the results of the coefficients of variation; what is the response rate, by size, by geography?
• If the survey includes seasonal adjustments, are there unusual events or numbers of reporting days?

57
7. Quality control and assurance analysis at macro level two
The energy model is just one component within the larger framework of Statistics Canada’s
System of National Accounts (SNA); energy must be coherent with the other parts of SNA.
The Energy Statistics Programme in Canada has instituted a process called “Work-in-Progress”,
which allows the subject matter people to obtain expert knowledge from engineers and industry officers
in other federal policy departments prior to the official release of data. These experts help to validate the
aggregate data and ensure it is accurate.
• Canada’s central statistical agency has the power under the Statistics Act to enter into “data sharing agreements” with other federal departments and regional Governments. Those agreements have been
most useful in identifying and improving data accuracy;
• Outside peer review: For some surveys, it could be useful to meet industry representatives to confront or validate our final findings. A data package with the industry’s fuel consumption, trends
and key energy indicators could be prepared to ask industry representatives to help validate the
estimates by examining industry trends and specific industry intelligence.
8. Quality control and assurance analysis at the product dissemination phase
In the last phase of data dissemination, whether as part of a news release, a publication
or a public database, an error can be critical. Many more eyes are analysing the data: students,
university professors, consultants, industry associations, other government departments and
international agencies such as the United Nations and International Energy Agency. Three main steps
need attention in this phase:
• Have your subject matter experts present the day before and after the release for any questions;
• Make sure all your text, tables etc. are proofread; check the percentage changes and your units of measurement, scales, etc. If your release is in more than one language, check consistency between
the two languages;
• Ensure that you and your staff are trained to deal with the media; prepare answers to questions you are likely to be asked; monitor what is printed in the press and respond to mistakes or erroneous
statements and misinterpretation of data.
Statistics Canada undertakes extensive communication with key users in order to establish
partnerships. This ensures awareness of their needs and the issues for which they may need data now or
in the future. Key users are familiarized with the surveys and processes so that they understand the data
and are able to respond to media questions by commenting on data’s meaning and integrity.
A major challenge for statisticians is time. If you have less time, you are simply number crunching,
producing tables, reacting and recording what has happened rather than creating added value. If you
have more time, you are trying to get a more accurate measure, estimating additional data points and
producing more useful graphic indicators. A reasonable compromise on timeliness can allow the
production of more relevant, accurate and interpretable data.

58
C. FUEL CONSUMPTION SURVEY QUESTIONNAIRE
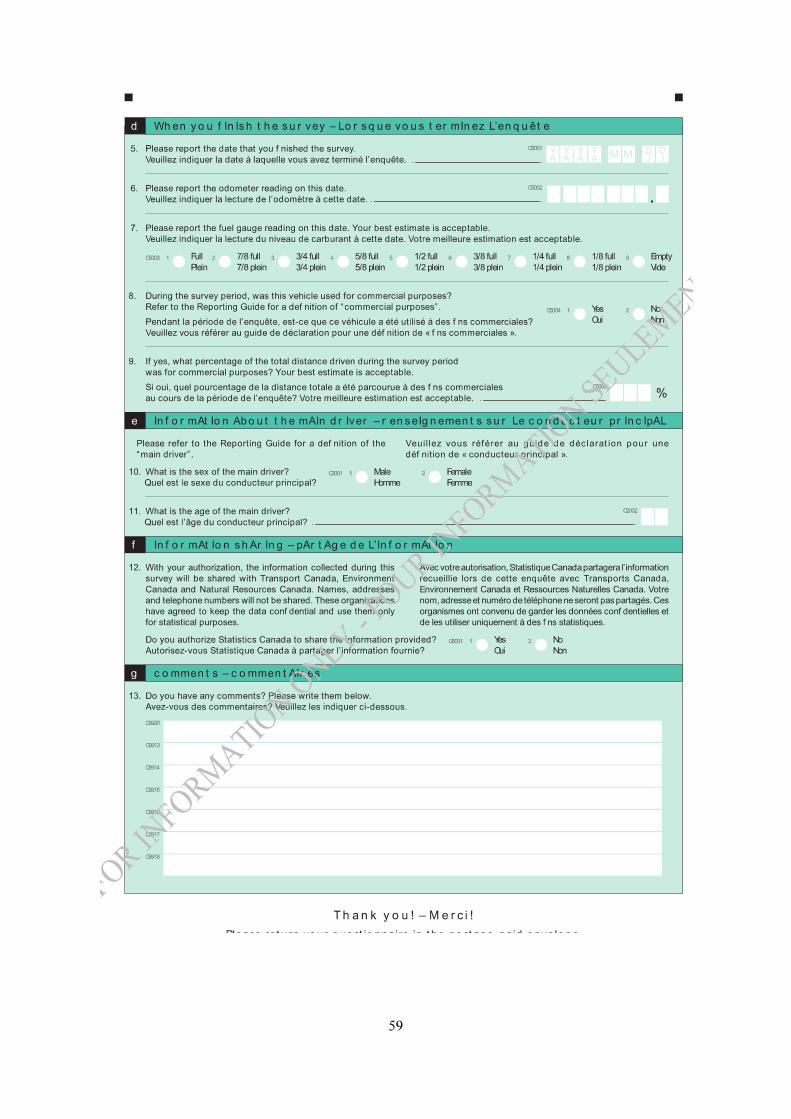
59
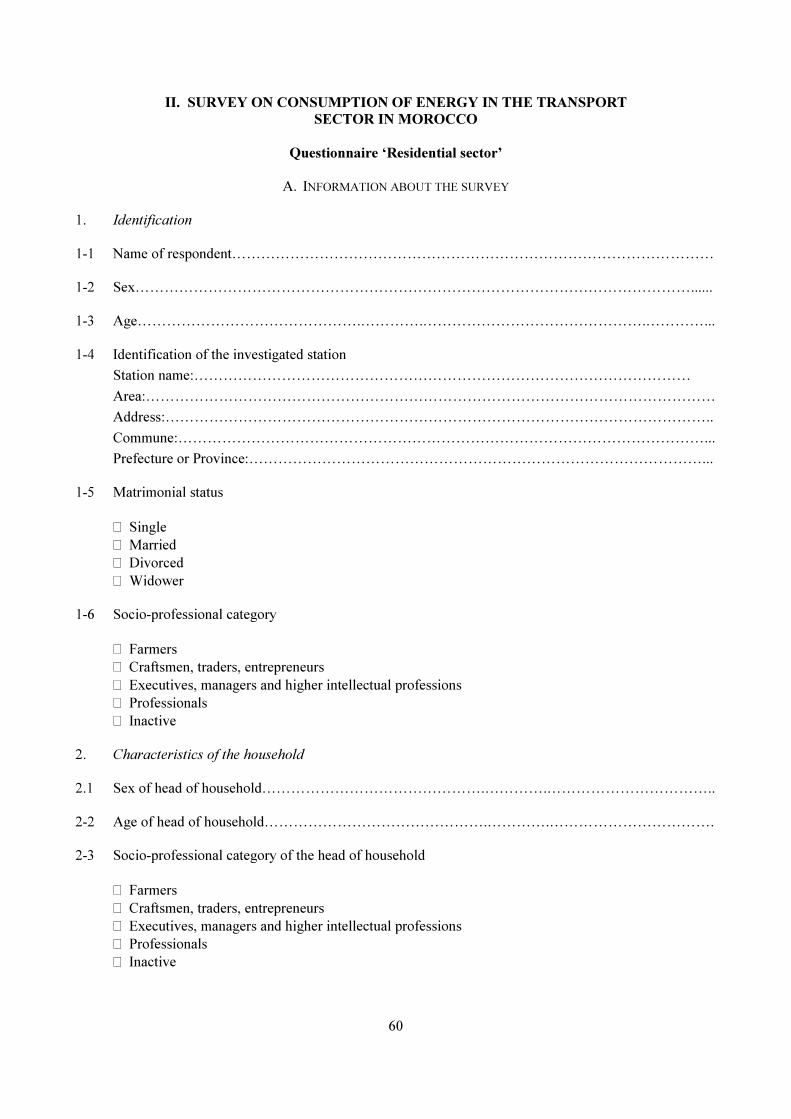
60
II. SURVEY ON CONSUMPTION OF ENERGY IN THE TRANSPORT
SECTOR IN MOROCCO
Questionnaire ‘Residential sector’
A. INFORMATION ABOUT THE SURVEY
1. Identification
1-1 Name of respondent………………………………………………………………………………………
1-2 Sex……………………………………………………………………………………………………......
1-3 Age……………………………………….………….……………………………………….…………...
1-4 Identification of the investigated station
Station name:…………………………………………………………………………………………
Area:………………………………………………………………………………………………………
Address:…………………………………………………………………………………………………..
Commune:………………………………………………………………………………………………...
Prefecture or Province:…………………………………………………………………………………...
1-5 Matrimonial status
� Single
� Married
� Divorced
� Widower
1-6 Socio-professional category
� Farmers
� Craftsmen, traders, entrepreneurs
� Executives, managers and higher intellectual professions
� Professionals
� Inactive
2. Characteristics of the household
2.1 Sex of head of household……………………………………….………….……………………………..
2-2 Age of head of household……………………………………….………….…………………………….
2-3 Socio-professional category of the head of household
� Farmers
� Craftsmen, traders, entrepreneurs
� Executives, managers and higher intellectual professions
� Professionals
� Inactive

61
2-4 Educational attainment of household head
� Without schooling
� Quranic school
� Primary
� Secondary
� Higher education 2-5 Household size……………………………………….………….……………………………………….. 2-6 Type of housing……………………………………….………….………………………………………
� Villa
� Apartment
� Modern Moroccan House
� Traditional Moroccan House
� Summary location
2-7 Number of vehicles owned by the household:
2.7.1 Private……….…………………………………………………………………………………..
2.7.2 Utility……….……………………………………………………………………………………
2.7.3 Motorcycle……….………………………………………………………………………………
B. TRANSPORT
Please respond to questions relating to the consumption of energy for transport within your household. 1. Characteristic of vehicles 1-1 Please indicate the energy consumption by passenger vehicle available to your household
The
passenger
vehicle
Brand
Year of entry
into service
Fiscal power
category
Fuel type
Consumption
l/100 km
Average km
per month
Quantity
consumed per
month in
litres
Intake
in 2010 in
litres
Value of Dhs
consumption
in 2010
…………..
…………..
…………..
…………..
1-2 Please indicate the energy consumption by utility vehicle available to your household
Vehicle
registration
Brand
Year of entry
into service
Tonnage
category
Fiscal power
category
Fuel type
Consumption
l/100 km
Average km
per month
Quantity
consumed
per month in
litres
Intake in
litres in 2010
Value of Dhs
consumption
in 2010
………..
………..
………..
………..
Total
Tonnage category: 1 - PTC ≤ 8 t, 2 - 8 t < PTC ≤ 14 t, 3-14 t < PTC ≤ 19 t, 4-19 t < PTC ≤ 26 t, 5 - 19 t < PTC ≤ 26 t, 6 - PTC > 26 t.
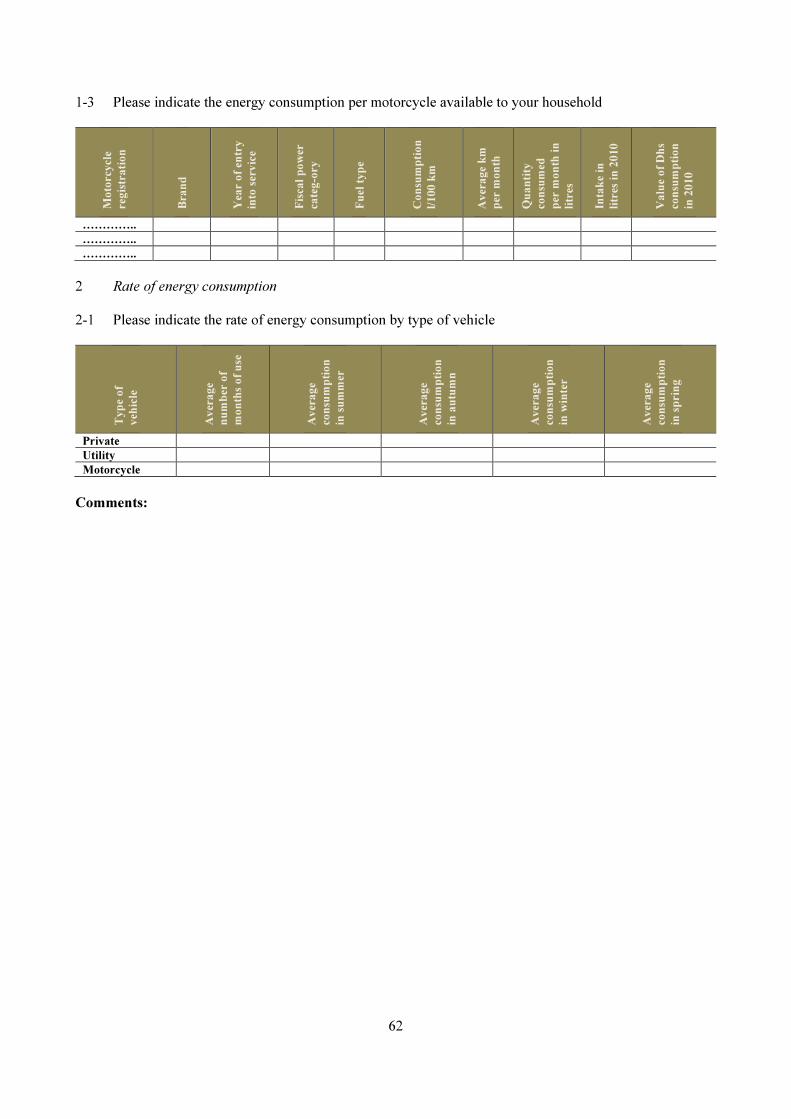
62
1-3 Please indicate the energy consumption per motorcycle available to your household
Motorcycle
registration
Brand
Year of entry
into service
Fiscal power
categ-ory
Fuel type
Consumption
l/100 km
Average km
per month
Quantity
consumed
per month in
litres
Intake in
litres in 2010
Value of Dhs
consumption
in 2010
…………..
…………..
…………..
2 Rate of energy consumption
2-1 Please indicate the rate of energy consumption by type of vehicle
Type of
vehicle
Average
number of
months of use
Average
consumption
in summer
Average
consumption
in autumn
Average
consumption
in winter
Average
consumption
in spring
Private
Utility
Motorcycle
Comments:

63
III. TUNISIAN SURVEY ON ROAD TRANSPORT OF GOODS:
QUESTIONNAIRE
Institution/transporter
General data
Name of the institution/transporter Corporate status
……….……………………………………………………………………………………
……….……………………………………………………………………………………
Manager’s full name……….………………………………………………………………………………………….
Position……….…………………………………………………………………………………………………………..
Full name of focal point for additional information Function
……….………………………………………………………..
……….………………………………………………………..
Established…………………………………. Legal status: Limited liability company Public limited company
Other
Capital…………………………………………(in millions of Tunisian dinars)………………………………………..
Address………………………………….………………………………….………………………………….……………
Phone…………………………………. Fax…………………………………. E-mail…………………………………
Type of transport activity
General transport Dangerous products Others……………………
Agricultural products Construction materials
Activity data
Number of vehicles per type
Vehicle Year 1 Year 2 Year 3 Year 5 Average age(*)
Light trucks (PL< 10T) ....................... ....................... ....................... ....................... .......................
Bearing truck (10 <PL< 19 T) ....................... ....................... ....................... ....................... .......................
Road tractor ....................... ....................... ....................... ....................... .......................
Trailer ....................... ....................... ....................... ....................... .......................
Semi-trailer
Platform ....................... ....................... ....................... ....................... .......................
Tank ....................... ....................... ....................... ....................... .......................
Dumpster ....................... ....................... ....................... ....................... .......................
Total ....................... ....................... ....................... ....................... .......................
General total ....................... ....................... ....................... ....................... .......................
* Average age = Sum of the age of vehicles of the same category/number of vehicles of subject category.
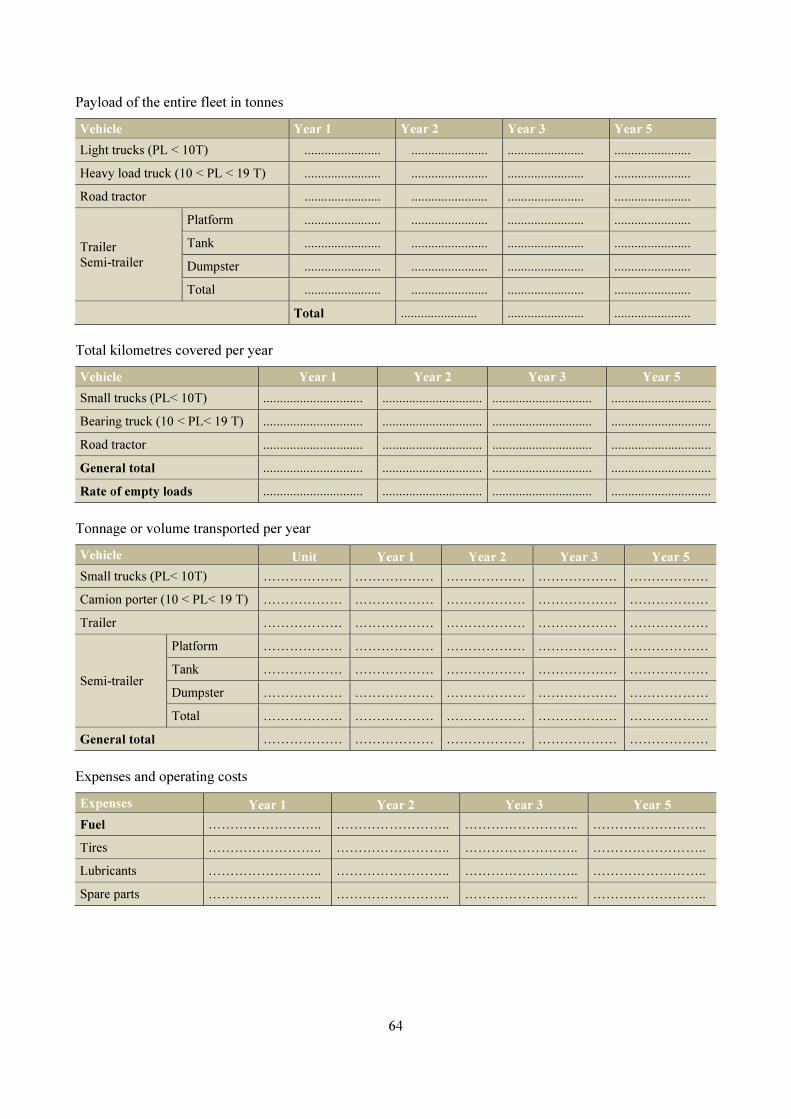
64
Payload of the entire fleet in tonnes
Vehicle Year 1 Year 2 Year 3 Year 5
Light trucks (PL < 10T) ....................... ....................... ....................... .......................
Heavy load truck (10 < PL < 19 T) ....................... ....................... ....................... .......................
Road tractor ....................... ....................... ....................... .......................
Trailer Semi-trailer
Platform ....................... ....................... ....................... .......................
Tank ....................... ....................... ....................... .......................
Dumpster ....................... ....................... ....................... .......................
Total ....................... ....................... ....................... .......................
Total ....................... ....................... .......................
Total kilometres covered per year
Vehicle Year 1 Year 2 Year 3 Year 5
Small trucks (PL< 10T) .............................. .............................. .............................. ..............................
Bearing truck (10 < PL< 19 T) .............................. .............................. .............................. ..............................
Road tractor .............................. .............................. .............................. ..............................
General total .............................. .............................. .............................. ..............................
Rate of empty loads .............................. .............................. .............................. ..............................
Tonnage or volume transported per year
Vehicle Unit Year 1 Year 2 Year 3 Year 5
Small trucks (PL< 10T) ……………… ……………… ……………… ……………… ………………
Camion porter (10 < PL< 19 T) ……………… ……………… ……………… ……………… ………………
Trailer ……………… ……………… ……………… ……………… ………………
Semi-trailer
Platform ……………… ……………… ……………… ……………… ………………
Tank ……………… ……………… ……………… ……………… ………………
Dumpster ……………… ……………… ……………… ……………… ………………
Total ……………… ……………… ……………… ……………… ………………
General total ……………… ……………… ……………… ……………… ………………
Expenses and operating costs
Expenses Year 1 Year 2 Year 3 Year 5
Fuel …………………….. …………………….. …………………….. ……………………..
Tires …………………….. …………………….. …………………….. ……………………..
Lubricants …………………….. …………………….. …………………….. ……………………..
Spare parts …………………….. …………………….. …………………….. ……………………..
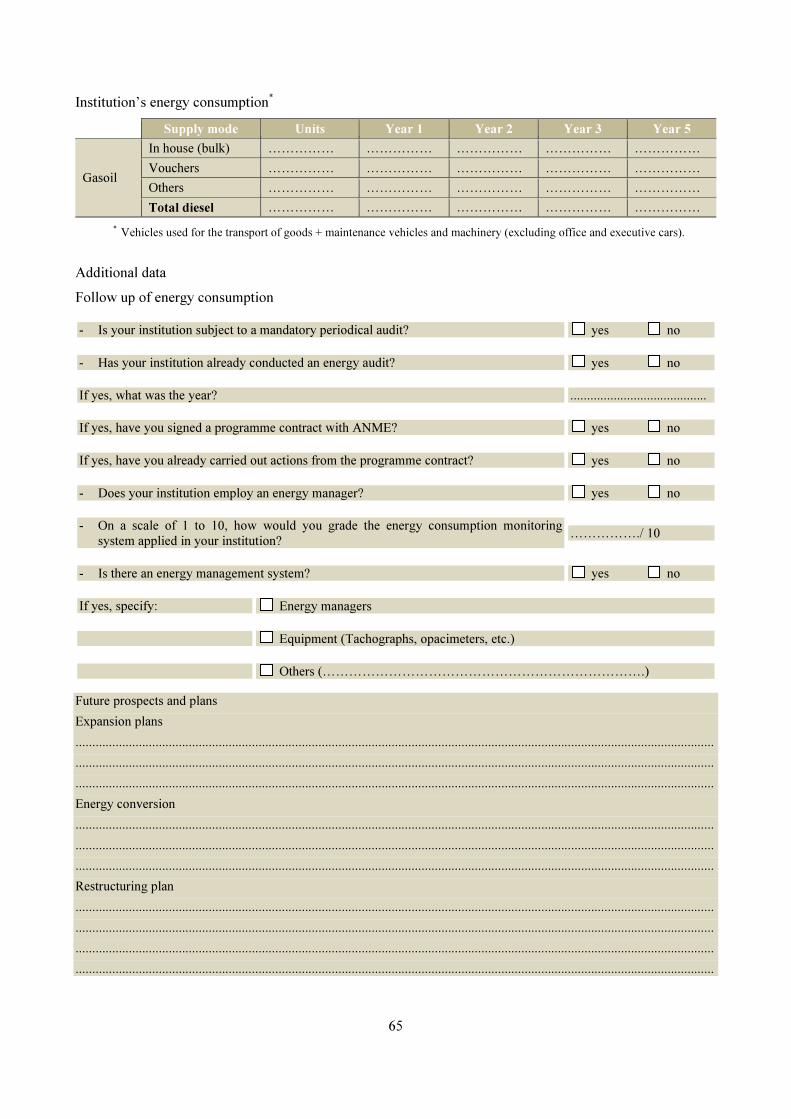
65
Institution’s energy consumption*
Supply mode Units Year 1 Year 2 Year 3 Year 5
Gasoil
In house (bulk) …………… …………… …………… …………… ……………
Vouchers …………… …………… …………… …………… ……………
Others …………… …………… …………… …………… ……………
Total diesel …………… …………… …………… …………… ……………
* Vehicles used for the transport of goods + maintenance vehicles and machinery (excluding office and executive cars).
Additional data
Follow up of energy consumption
- Is your institution subject to a mandatory periodical audit? yes no
- Has your institution already conducted an energy audit? yes no
If yes, what was the year? .........................................
If yes, have you signed a programme contract with ANME? yes no
If yes, have you already carried out actions from the programme contract? yes no
- Does your institution employ an energy manager? yes no
- On a scale of 1 to 10, how would you grade the energy consumption monitoring system applied in your institution?
……………./ 10
- Is there an energy management system? yes no
If yes, specify: Energy managers
Equipment (Tachographs, opacimeters, etc.)
Others (……………………………………………………………….)
Future prospects and plans
Expansion plans
................................................................................................................................................................................................
................................................................................................................................................................................................
................................................................................................................................................................................................
Energy conversion
................................................................................................................................................................................................
................................................................................................................................................................................................
................................................................................................................................................................................................
Restructuring plan
................................................................................................................................................................................................
................................................................................................................................................................................................
................................................................................................................................................................................................
................................................................................................................................................................................................
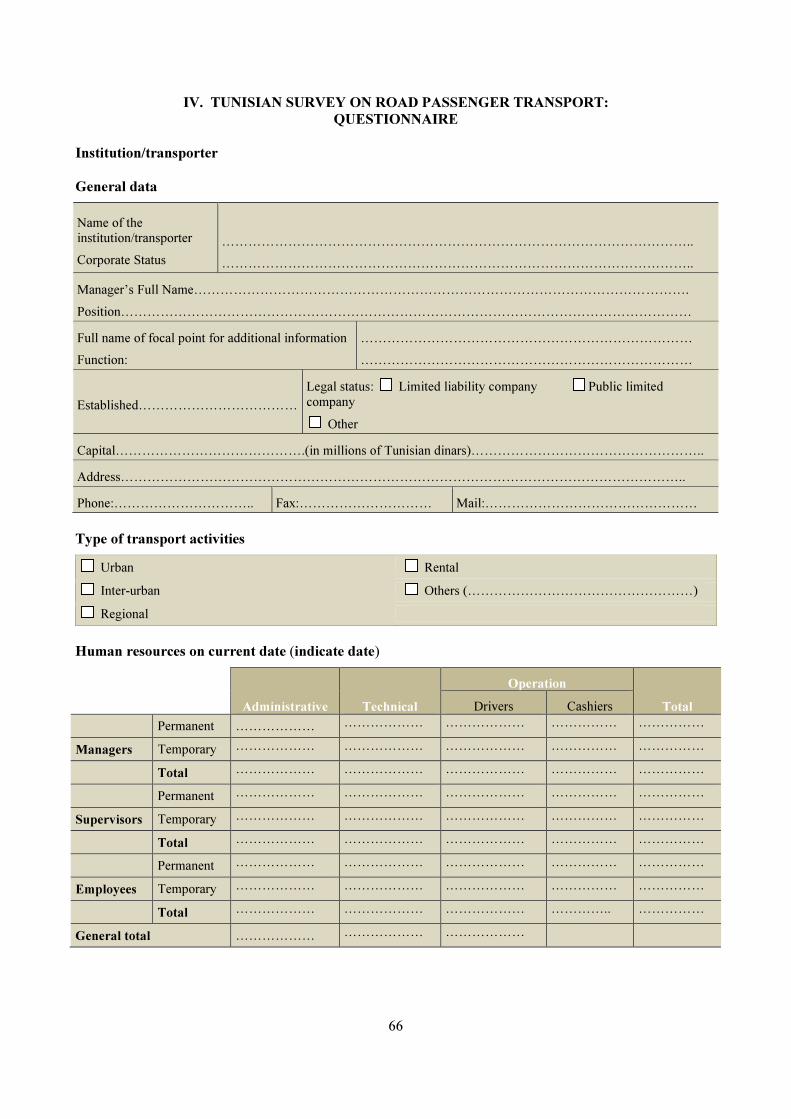
66
IV. TUNISIAN SURVEY ON ROAD PASSENGER TRANSPORT:
QUESTIONNAIRE
Institution/transporter
General data
Name of the institution/transporter
Corporate Status
……………………………………………………………………………………………..
……………………………………………………………………………………………..
Manager’s Full Name………………………………………………………………………………………………….
Position…………………………………………………………………………………………………………………
Full name of focal point for additional information
Function:
…………………………………………………………………
…………………………………………………………………
Established………………………………
Legal status: Limited liability company Public limited company
Other
Capital…………………………………….(in millions of Tunisian dinars)……………………………………………..
Address………………………………………………………………………………………………………………..
Phone:………………………….. Fax:………………………… Mail:…………………………………………
Type of transport activities
Urban Rental
Inter-urban Others (……………………………………………)
Regional
Human resources on current date (indicate date)
Administrative Technical
Operation
Total Drivers Cashiers
Permanent ……………… ……………… ……………… …………… ……………
Managers Temporary ……………… ……………… ……………… …………… ……………
Total ……………… ……………… ……………… …………… ……………
Permanent ……………… ……………… ……………… …………… ……………
Supervisors Temporary ……………… ……………… ……………… …………… ……………
Total ……………… ……………… ……………… …………… ……………
Permanent ……………… ……………… ……………… …………… ……………
Employees Temporary ……………… ……………… ……………… …………… ……………
Total ……………… ……………… ……………… ………….. ……………
General total ……………… ……………… ………………

67
Activity data
Number of vehicles by type
Vehicle type Year 1 Year 2 Year 3 Year 5
Office duty vehicle ………………. ………………. ………………. ……………….
Minibus ………………. ………………. ………………. ……………….
Standard bus ………………. ………………. ………………. ……………….
Articulated bus ………………. ………………. ………………. ……………….
Standard bus ………………. ………………. ………………. ……………….
Articulated bus ………………. ………………. ………………. ……………….
Number of total km covered per year and by vehicle type
Vehicle type Year 1 Year 2 Year 3 Year 5
Office duty car ………………. ………………. ………………. ……………….
Minibus ………………. ………………. ………………. ……………….
Standard bus ………………. ………………. ………………. ……………….
Articulated bus ………………. ………………. ………………. ……………….
Standard coach ………………. ………………. ………………. ……………….
Articulated coach ………………. ………………. ………………. ……………….
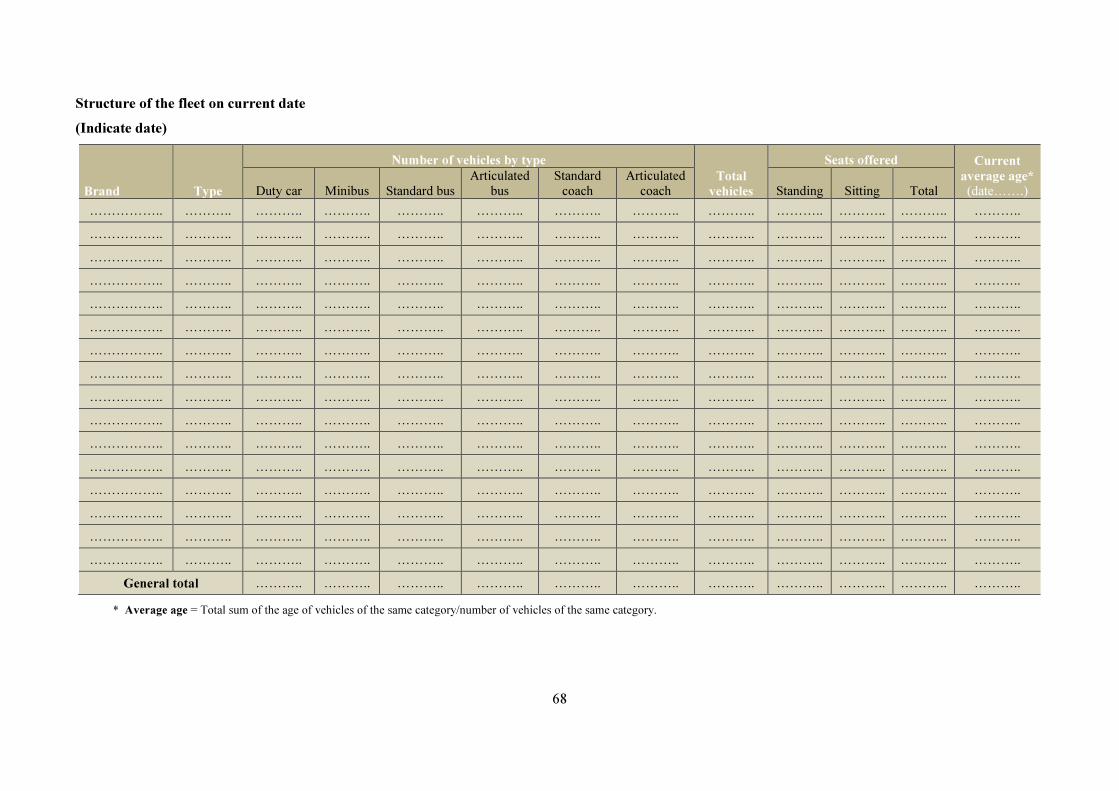
68
Structure of the fleet on current date
(Indicate date)
Brand Type
Number of vehicles by type
Total
vehicles
Seats offered Current
average age* (date…….) Duty car Minibus Standard bus
Articulated
bus
Standard
coach
Articulated
coach Standing Sitting Total
…………….. ……….. ……….. ……….. ……….. ……….. ……….. ……….. ……….. ……….. ……….. ……….. ………..
…………….. ……….. ……….. ……….. ……….. ……….. ……….. ……….. ……….. ……….. ……….. ……….. ………..
…………….. ……….. ……….. ……….. ……….. ……….. ……….. ……….. ……….. ……….. ……….. ……….. ………..
…………….. ……….. ……….. ……….. ……….. ……….. ……….. ……….. ……….. ……….. ……….. ……….. ………..
…………….. ……….. ……….. ……….. ……….. ……….. ……….. ……….. ……….. ……….. ……….. ……….. ………..
…………….. ……….. ……….. ……….. ……….. ……….. ……….. ……….. ……….. ……….. ……….. ……….. ………..
…………….. ……….. ……….. ……….. ……….. ……….. ……….. ……….. ……….. ……….. ……….. ……….. ………..
…………….. ……….. ……….. ……….. ……….. ……….. ……….. ……….. ……….. ……….. ……….. ……….. ………..
…………….. ……….. ……….. ……….. ……….. ……….. ……….. ……….. ……….. ……….. ……….. ……….. ………..
…………….. ……….. ……….. ……….. ……….. ……….. ……….. ……….. ……….. ……….. ……….. ……….. ………..
…………….. ……….. ……….. ……….. ……….. ……….. ……….. ……….. ……….. ……….. ……….. ……….. ………..
…………….. ……….. ……….. ……….. ……….. ……….. ……….. ……….. ……….. ……….. ……….. ……….. ………..
…………….. ……….. ……….. ……….. ……….. ……….. ……….. ……….. ……….. ……….. ……….. ……….. ………..
…………….. ……….. ……….. ……….. ……….. ……….. ……….. ……….. ……….. ……….. ……….. ……….. ………..
…………….. ……….. ……….. ……….. ……….. ……….. ……….. ……….. ……….. ……….. ……….. ……….. ………..
…………….. ……….. ……….. ……….. ……….. ……….. ……….. ……….. ……….. ……….. ……….. ……….. ………..
General total ……….. ……….. ……….. ……….. ……….. ……….. ……….. ……….. ……….. ……….. ………..
* Average age = Total sum of the age of vehicles of the same category/number of vehicles of the same category.
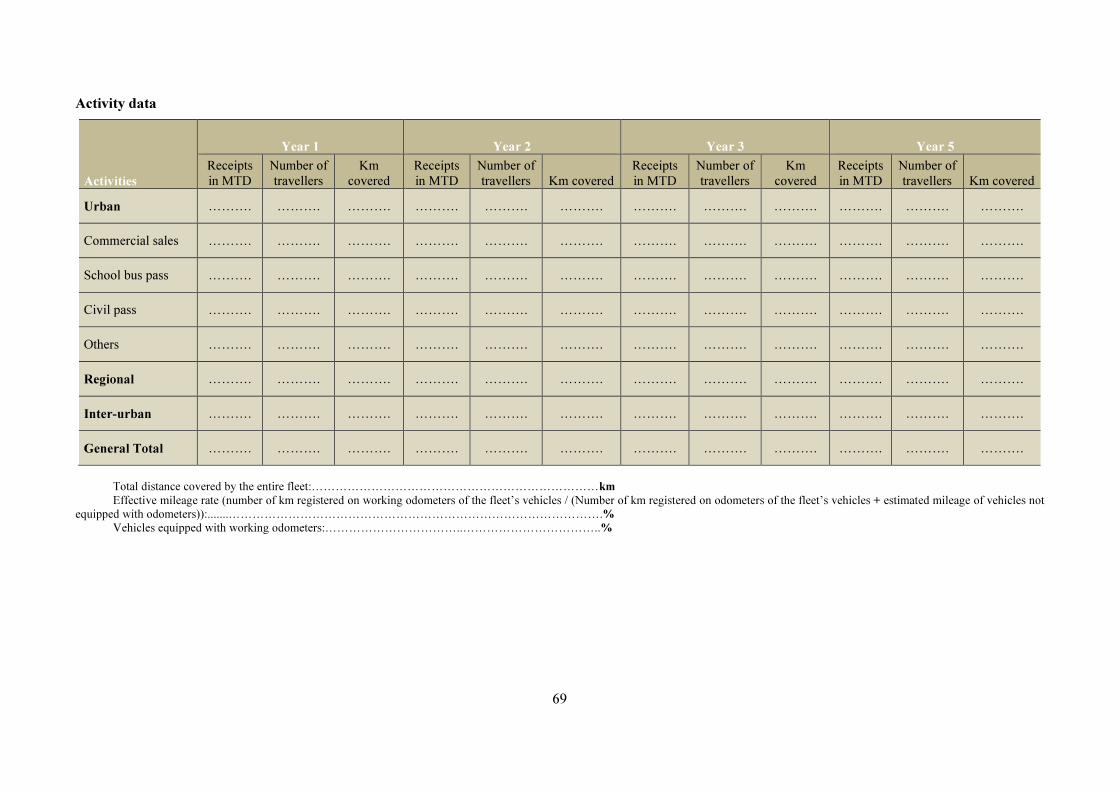
69
Activity data
Activities
Year 1 Year 2 Year 3 Year 5
Receipts
in MTD
Number of
travellers
Km
covered
Receipts
in MTD
Number of
travellers Km covered
Receipts
in MTD
Number of
travellers
Km
covered
Receipts
in MTD
Number of
travellers Km covered
Urban ………. ………. ………. ………. ………. ………. ………. ………. ………. ………. ………. ……….
Commercial sales ………. ………. ………. ………. ………. ………. ………. ………. ………. ………. ………. ……….
School bus pass ………. ………. ………. ………. ………. ………. ………. ………. ………. ………. ………. ……….
Civil pass ………. ………. ………. ………. ………. ………. ………. ………. ………. ………. ………. ……….
Others ………. ………. ………. ………. ………. ………. ………. ………. ………. ………. ………. ……….
Regional ………. ………. ………. ………. ………. ………. ………. ………. ………. ………. ………. ……….
Inter-urban ………. ………. ………. ………. ………. ………. ………. ………. ………. ………. ………. ……….
General Total ………. ………. ………. ………. ………. ………. ………. ………. ………. ………. ………. ……….
Total distance covered by the entire fleet:………………………………………………………………km
Effective mileage rate (number of km registered on working odometers of the fleet’s vehicles / (Number of km registered on odometers of the fleet’s vehicles + estimated mileage of vehicles not
equipped with odometers)):.......………………………………………………………………………………….%
Vehicles equipped with working odometers:……………………………..……………………………..%

70
Energy consumption of the institution/transporter
Units Year 1 Year 2 Year 3 Year 5
Diesel* ……………. ……………. ……………. ……………. …………….
Total gasoline* ……………. ……………. ……………. ……………. …………….
Including lead-free gasoline ……………. ……………. ……………. ……………. …………….
Fuel-oil* ……………. ……………. ……………. ……………. …………….
Electrical power ……………. ……………. ……………. ……………. …………….
Natural gas ……………. ……………. ……………. ……………. …………….
Other ……………. ……………. ……………. ……………. …………….
* Real consumption taking into consideration annual purchases and stock variation.
Detailed consumption for operational vehicles*
Supply mode Unit Year 1 Year 2 Year 3 Year 5
Diesel
In house (bulk) ……………. ……………. ……………. ……………. …………….
Vouchers ……………. ……………. ……………. ……………. …………….
Others ……………. ……………. ……………. ……………. …………….
Total diesel ……………. ……………. ……………. ……………. …………….
Gasoline
In house (bulk) ……………. ……………. ……………. ……………. …………….
Vouchers ……………. ……………. ……………. ……………. …………….
Others ……………. ……………. ……………. ……………. …………….
Total gasoline ……………. ……………. ……………. ……………. …………….
* Vehicles used for the transportation of passengers + maintenance vehicles and machinery (excluding office and executive
vehicles).

71
V. TUNISIAN SURVEY OF PETROL STATION CUSTOMERS: QUESTIONNAIRE
File n°……….. 1. Car number plate Number
……………………
TU………………………………………………
Others…………………………………………………..
2. Fuel Amount
………..,D…………….
Type:
- Normal gasoline
- Super gasoline
- Lead-free gasoline
- Diesel
- LPG
3. Passage Date ……………. Time…………………..…………….
4. Vehicle Mileage on the odometer
……..………………….
Do you use this vehicle for:
- Private use
- Professional use
In case of professional use: please specify
-------------------------------------------------------------------------
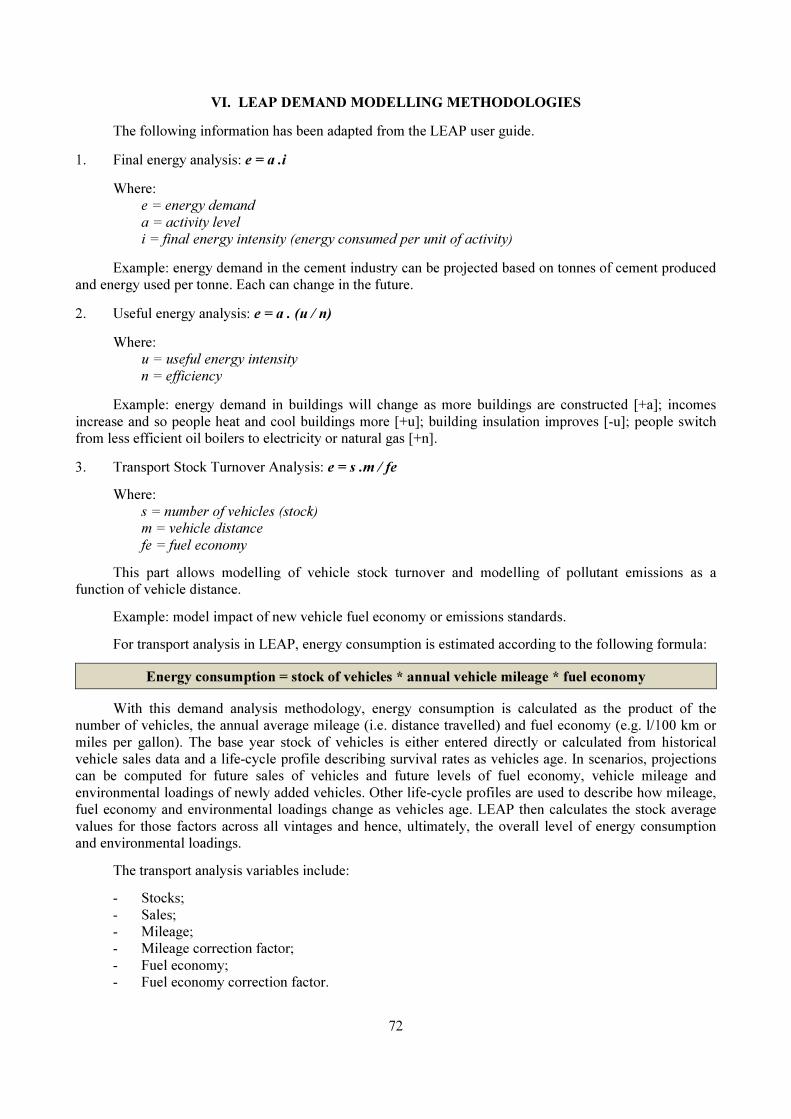
72
VI. LEAP DEMAND MODELLING METHODOLOGIES The following information has been adapted from the LEAP user guide. 1. Final energy analysis: e = a .i Where:
e = energy demand
a = activity level
i = final energy intensity (energy consumed per unit of activity) Example: energy demand in the cement industry can be projected based on tonnes of cement produced
and energy used per tonne. Each can change in the future. 2. Useful energy analysis: e = a . (u / n) Where:
u = useful energy intensity
n = efficiency Example: energy demand in buildings will change as more buildings are constructed [+a]; incomes
increase and so people heat and cool buildings more [+u]; building insulation improves [-u]; people switch
from less efficient oil boilers to electricity or natural gas [+n]. 3. Transport Stock Turnover Analysis: e = s .m / fe Where:
s = number of vehicles (stock)
m = vehicle distance
fe = fuel economy This part allows modelling of vehicle stock turnover and modelling of pollutant emissions as a
function of vehicle distance. Example: model impact of new vehicle fuel economy or emissions standards. For transport analysis in LEAP, energy consumption is estimated according to the following formula:
Energy consumption = stock of vehicles * annual vehicle mileage * fuel economy With this demand analysis methodology, energy consumption is calculated as the product of the
number of vehicles, the annual average mileage (i.e. distance travelled) and fuel economy (e.g. l/100 km or
miles per gallon). The base year stock of vehicles is either entered directly or calculated from historical
vehicle sales data and a life-cycle profile describing survival rates as vehicles age. In scenarios, projections
can be computed for future sales of vehicles and future levels of fuel economy, vehicle mileage and
environmental loadings of newly added vehicles. Other life-cycle profiles are used to describe how mileage,
fuel economy and environmental loadings change as vehicles age. LEAP then calculates the stock average
values for those factors across all vintages and hence, ultimately, the overall level of energy consumption
and environmental loadings. The transport analysis variables include:
- Stocks;
- Sales;
- Mileage;
- Mileage correction factor;
- Fuel economy;
- Fuel economy correction factor.

73
For a given branch and as an example, the following equations describe transport calculations to
estimate energy consumption:
Step 1: Stock Turnover and Stock Rollover Stockt,y,v = (Salest,v*Survivalt,y-v) - RollOvert,y + ∑ f=1..TRollOverf,y
RollOvert,y= Salest,v*Survivalt,y-v*(1-RollSurvivalt,y-v)
Stockt,y = ∑ v=0..VStocky,v Where:
t is the type of vehicle (i.e. the technology branch)
v is the vintage (i.e. the model year)
y is the calendar year
t is the number of types of vehicles
Sales is the number of vehicles added in a particular year: Entered as an expression.
Stock is the number of vehicles existing in a particular year: Either entered as an expression for
Current Accounts or calculated internally based on historical sales.
Survival is the fraction of vehicles surviving after a number of years: Entered as a life-cycle profile.
v is the maximum number of vintage years: Determined automatically from the survival life-cycle
profile, with a maximum of 30 years.
Rollover is the number of vehicles that get "rolled over" (i.e. sold) from government or business fleets
into the private vehicle stock.
Step 2: Fuel Economy Fuel Economyt,y,v = Fuel Economyt,y* FeDegradationt,y-v Where:
Fuel Economy is fuel use per unit of vehicle distance travelled: Entered as an expression.
FeDegradation is a factor representing the decline in fuel economy as a vehicle ages. It equals 1 when
y = v: Entered as a life-cycle profile.
Step 3: Mileage Mileaget,y,v = Mileaget,y* MlDegradationt,y-v
Where:
Mileage is annual distance travelled per vehicle: Entered as an expression. MlDegradation is a factor representing the change in mileage as a vehicle ages. It equals 1 when y =
v: Entered as a life-cycle profile.
Energy Consumption Energy Consumptiont,y,v = Stockt,y,v * Mileage t,y,v* FuelEconomyt,y,v The LEAP software has several functions to estimate GHG emissions and make forecasting
calculations for different scenarios (see the Ireland case study above).