Training data reduction to speed u p SVM training
17
See discussions, stats, and author profiles for this publication at: https://www.researchgate.net/publication/272030750 Training data reduction to speed up SVM training Article in Applied Intelligence · September 2014 DOI: 10.1007/s10489-014-0524-2 CITATIONS 12 READS 777 5 authors, including: Some of the authors of this publication are also working on these related projects: Improving stock market prediction with broad learning View project spatiotemporal data mining View project Senzhang Wang Nanjing University of Aeronautics & Astronautics 107 PUBLICATIONS 773 CITATIONS SEE PROFILE Xiaoming Zhang Beihang University (BUAA) 63 PUBLICATIONS 479 CITATIONS SEE PROFILE All content following this page was uploaded by Senzhang Wang on 17 January 2017. The user has requested enhancement of the downloaded file.
Transcript of Training data reduction to speed u p SVM training

See discussions, stats, and author profiles for this publication at: https://www.researchgate.net/publication/272030750
Training data reduction to speed up SVM training
Article in Applied Intelligence · September 2014
DOI: 10.1007/s10489-014-0524-2
CITATIONS
12READS
777
5 authors, including:
Some of the authors of this publication are also working on these related projects:
Improving stock market prediction with broad learning View project
spatiotemporal data mining View project
Senzhang Wang
Nanjing University of Aeronautics & Astronautics
107 PUBLICATIONS 773 CITATIONS
SEE PROFILE
Xiaoming Zhang
Beihang University (BUAA)
63 PUBLICATIONS 479 CITATIONS
SEE PROFILE
All content following this page was uploaded by Senzhang Wang on 17 January 2017.
The user has requested enhancement of the downloaded file.

Appl Intell (2014) 41:405–420DOI 10.1007/s10489-014-0524-2
Training data reduction to speed up SVM training
Senzhang Wang · Zhoujun Li · Chunyang Liu ·Xiaoming Zhang · Haijun Zhang
Published online: 15 March 2014© Springer Science+Business Media New York 2014
Abstract Traditional Support Vector Machine (SVM) so-lution suffers from O(n2) time complexity, which makes itimpractical to very large datasets. To reduce its high com-putational complexity, several data reduction methods areproposed in previous studies. However, such methods arenot effective to extract informative patterns. In this paper,a two-stage informative pattern extraction approach is pro-posed. The first stage of our approach is data cleaning basedon bootstrap sampling. A bundle of weak SVM classifiersare constructed on the sampled datasets. Training data cor-rectly classified by all the weak classifiers are cleaned dueto lacking useful information for training. To further ex-tract more informative training data, two informative patternextraction algorithms are proposed in the second stage. Asmost training data are eliminated and only the more informa-tive samples remain, the final SVM training time is reducedsignificantly. Contributions of this paper are three-fold. (1)First, a parallelized bootstrap sampling based method is pro-posed to clean the initial training data. By doing that, a large
S. Wang · Z. Li (B) · X. Zhang · H. ZhangState Key Laboratory of Software Development Environment,Beihang University, Beijing 100191, P.R. Chinae-mail: [email protected]
S. Wange-mail: [email protected]
X. Zhange-mail: [email protected]
H. Zhange-mail: [email protected]
C. Liu (B)National Computer Network Emergency Response TechnicalTeam, Coordination Center of China, Beijing 100029, P.R. Chinae-mail: [email protected]
number of training data with little information are elimi-nated. (2) Then, we present two algorithms to effectivelyextract more informative training data. Both algorithms arebased on maximum information entropy according to theempirical misclassification probability of each sample esti-mated in the first stage. Therefore, training time can be fur-ther reduced for training data further reduction. (3) Finally,empirical studies on four large datasets show the effective-ness of our approach in reducing the training data size andthe computational cost, compared with the state-of-the-artalgorithms, including PEGASOS, LIBLINEAR SVM andRSVM. Meanwhile, the generalization performance of ourapproach is comparable with baseline methods.
Keywords Data cleaning · Pattern extraction · Bootstrap ·Entropy maximization
1 Introduction
As an effective machine learning algorithm based on Sta-tistical Learning Theory (SLT), Support Vector Machine(SVM) has become increasingly popular recently. It iswidely used in many fields, such as data mining [1], in-formation retrieval [2], social network [3], and diseaserecognition [28]. However, traditional SVM solution needsO(n2) time complexity, which makes it impractical to largedatasets. Though many effective solutions are proposed,SVM suffers a lot from its high time complexity when deal-ing with millions of training data.
An important research direction to speed up SVM train-ing is training data reduction. Based on it, several effectivesolutions have been proposed. For example, Burges reportedthat the final SVM classifier only depended on a few sampleswhich are called support vectors, and removing non-support

406 S. Wang et al.
vectors would not significantly affect the performance ofclassifier [4]. Panda et al. only selected the instances closeto the boundary between classes, and the instances likely tobe non-support vectors were eliminated [5]. Motivated byprevious studies, this paper aims to address such an interest-ing and challenging problem: Can we find a minimal sub-set of the initial training dataset on which the SVM trainedcan achieve desirable generalization performance? If sucha subset is found, the training time can be significantly re-duced due to the elimination of a large number of trainingdata with little information for training. To address this chal-lenge, a novel data cleaning and informative pattern extrac-tion approach is proposed. This approach consists of twostages: data cleaning based on bootstrap sampling and in-formative pattern extraction based on maximum informationentropy.
In the first stage, a bulk of small subsets of the initialtraining dataset are randomly sampled with the bootstrapsampling method. Then with each sampled small dataset, wetrain a weak SVM classifier and utilized it to pre-classifythe whole training dataset. Data correctly classified by allthe weak classifiers are eliminated, and only those misclas-sified by at least one weak classifier are retained to the sec-ond stage. To further extract the most controversial data,two informative pattern extraction algorithms based on in-formation entropy maximization are provided in the secondstage. The information entropy of each data is measured byits empirical misclassification probability estimated in thefirst stage.
Contributions of this paper are summarized as follows:
– A bootstrap sampling based data cleaning method is pro-posed. Compared with existing data-processing methods,such as concept boundary detection [5] and Cascade SVM[6], our approach is more effective because it can be ex-ecuted in parallel. A bundle of independent weak SVMclassifiers are constructed and run simultaneously, whichgreatly reduce the time of data cleaning.
– To further discover more useful training data and elim-inate outliers, two informative pattern extraction algo-rithms are presented. Information entropy of each sam-ple is approximately measured based on its empiricalmisclassification probability estimated in the first stage.Advantages of the proposed approaches are as follows.First, misclassified training data from the first stage areweighted based on their information entropy. Second, out-liers with little information entropy are eliminated. More-over, training time is further reduced for training data fur-ther reduction.
– We evaluate our approach on four large real datasets. Theempirical experiments show that our approach can sig-nificantly reduce the size of training data and dramat-ically speed up the SVM training. Comparable experi-ments against three state-of-the-art SVM algorithms also
demonstrate that the generalization performance of ourapproach outperforms all the three methods with similartraining time.
The rest of the paper is organized as follows: Sect. 2 re-views related work. Section 3 describes the bootstrap sam-pling based data cleaning. A heuristic method to determinethe sampling proportion is presented in this section. Sec-tion 4 details the informative pattern extraction process.Two informative data extraction algorithms based on infor-mation entropy maximization are proposed. Experiment andevaluation are given in Sect. 5. Finally, we conclude this pa-per in Sect. 6.
2 Related work
Previous works related to speed up SVM training can be cat-egorized into data-reduction level and quadratic program-ming (QP) algorithm level. The data-reduction level ap-proaches mainly focus on how to reduce the training dataquantity without losing much useful information. The QP-algorithms focus on how to make the QP solver faster[9–13]. As our approach falls in the data-reduction levelmethods, here we mainly discuss related work in this level.
To reduce the training dataset size, one straightforwardidea is randomly down-sampling the training dataset. Leeand Mangasarian proposed to randomly select a subset n
of the entire dataset n to be training dataset [14]. Experi-ments show that the reduced SVM (RSVM) they proposedis much faster while its performance is close to SVM. Com-pared to random down-sampling method, more informedsampling methods are proposed. For example, Garf et al.proposed a novel SVM algorithm which can be executedin parallel: Cascade SVM [6]. In this method, the datasetis split into several disjoined subsets and optimized sep-arately with multiple SVMs. The partial results are com-bined and filtered again in a “Cascade SVMs”, until theglobal optimum is reached. Panda et al. proposed a con-cept boundary detection method to speed up SVM [5]. Inthis paper, training data which are likely to be non-supportvectors are eliminated in the concept-independence prepro-cessing stage. In the concept-specific sampling stage, theyeffectively select useful training data for each target con-cept. Yu et al. used a hierarchical micro-clustering techniqueto capture the training data that were close to the decisionboundary [8]. Lawrence et al. proposed an Information Vec-tor Machines (IVMs) [7]. A framework for sparse Gaussianprocess methods which used forward selection with criteriabased on information theoretic principles was proposed inthis paper.
Recently, with the growing importance of handling verylarge datasets, some optimization methods with a more mod-erate scaling on the dataset size are presented. SVM-Perf
Training data reduction to speed up SVM training 407
is an optimization method which uses a cutting plane ap-proach for training linear SVM [17]. Smola et al. reportedthat SVM-Perf can find a solution with accuracy ε in timeO(nd/(λε))1 [18]. Shai et al. proposed PEGASOS, a simpleand effective iterative algorithm for solving the optimizationproblem cast of SVM [20]. PEGASOS alternates betweenstochastic gradient descent steps and projection steps. Thenumber of iterations required to obtain a solution of accu-racy ε is O(1/ε), compared with other methods which re-quires O(1/ε2). For a linear kernel, PEGASOS is guaran-teed to find, with high probability, an ε-accurate solutionin time ˜O(d/(λε)).2 LIBLINEAR is a novel SVM algo-rithm proposed to process large-scale sparse data [19]. Thismethod is especially effective for text classification. Fan etal. reported that LIBLINEAR can reach an ε-accurate solu-tion in O(log(1/ε)) iterations [19]. The run time of PEGA-SOS and LIBLINEAR do not increase with the sample size,so the training process runs much faster than tradition meth-ods. The flip side is that the two methods have much worsedependence on the optimization accuracy.
3 Bootstrap sampling based data cleaning
In this section, we first give a brief introduction to SVM.Then we describe the framework of data cleaning based onbootstrap sampling. In addition, to effectively determine theappropriate sampling percentage, a heuristic method is pro-posed.
3.1 SVM introduction
Given the training dataset X = {(x1, y1) . . . (xn, yn)} inspace X ⊆ Rd , where xi ⊆ Rd represents the d-dimensionalpattern and yi = ±1 represents the class labels, the goal ofSVM training is to find a linear predictor g(x) = wT x + w0
with a small empirical loss relative to a large classification“margin”. With this predictor, the testing samples are sepa-rated according to the inequalities:
yi ={
1 if (wT · xi + w0) ≥ 1;−1 if (wT · xi + w0) ≤ −1
(1)
when X is linearly separable, a unique hyperplane maxi-mizing the margin between the projections of the trainingdata of two classes can be found. If the training data X isnot linearly separable, (1) must be modified for allowing theclassification violations in the SVM formulation. In the case
1d is a bound on the number of non-zero features for dataset and λ isthe regularization parameter of SVM.2The ˜O(·) notation hides logarithmic factors.
of linear inseparable, the SVM can be generalized by intro-ducing a non negative variables ξi ≥ 0 such that (1) can bemodified to
yi(w · xi + b) ≥ 1 − ξi, i = 1, . . . , n (2)
when training data xi can not be linearly separated, its cor-responding ξi is nonzero. Thus the term
∑ni=1 ξi can be
thought of a measure of the amount of misclassification.The optimal hyperplane problem is then regarded as the
solution to the problem
Minimize1
2w · w + C
n∑
i=1
ξi
Subject to yi(w · xi + b) ≥ 1 − ξi, i = 1, . . . , n
ξi ≥ 0, i = 1, . . . , n
(3)
Equation (3) is a quadratic programming problem, and itsdual formulation can be rewritten as follows:
Maximize W(α) = −1
2×
n∑
i
n∑
j
αiαj yiyjK(xi, xj )
+n
∑
i
αi
Subject ton
∑
i
yiαi = 0, 0 ≤ αi ≤ C, i = 1, . . . , n
(4)
where α = (α1, . . . , αn) are nonnegative Lagrange multipli-ers associated with the constrain (1), and K is the kernelmatrix.
If such a optimal hyperplane is found, we can use a em-pirical loss function to measure how different the predictionoutput yi of the classifier from the true label yi . The empir-ical loss function can be formally defined as
f (W ;X) = 1
n
∑
i
max{
0,1 − yi〈w,xi〉} + λ
2‖w‖2
3.2 Bootstrap sampling based data cleaning with weakSVMs
Many previous works have focused on using sampling meth-ods [7, 8, 12, 15] or ensemble methods [31, 32] to speedup SVM training and improve the classification perfor-mance. However, instead of training data cleaning, these ap-proaches mainly focused on how to train an approximateSVM classier. Though some works tried to apply boostingmethod to speed up SVM training, they mainly focused onreducing the training data dimensions [30]. Different fromprevious works, we propose to apply the bootstrap sampling

408 S. Wang et al.
Fig. 1 Framework of bootstrapsampling based data cleaningwith weak SVMs
method to clean useless training data. Meanwhile, our em-pirical results show that, in many cases, the performance ofthe weak SVMs trained on the sampled small subset can befairly good. Therefore, we first sample some small datasetsby the bootstrap sampling method. Then a bundle of weakSVMs are trained on the sampled datasets. Next, the weakSVMs are used to pre-classify the whole training data. If thedata is correctly classified or misclassified by all the weakSVMs, we consider that it has little information for the train-ing process, and hence we simply clean it. The remainingdata are sent to the next stage, and their misclassificationtimes are recorded. Moreover, as these weak SVMs are con-structed independently, they can be executed in parallel. Theframework of our method is shown in Fig. 1. Before describ-ing our method in detail, we first give a definition as follow.
Definition 1 ε-Gross-granularity weak SVM: Assume X ={x1, . . . , xn} is the training dataset, ˜X is a subset of X andthe cardinality of ˜X is much smaller than X. That is ˜X ⊂ X,and Card(˜X) Card(X). Assume g(x) = wT · x + w0 = 0is the SVM predictor of ˜X and g(x) = wT · x + w0 is theSVM predictor of X. f (W ;X)is the empirical loss functionof g(x). The SVM of ˜X is called ε-Gross-granularity weakSVM of X if the empirical loss function meet the followingequation:
f ( ˜W ; ˜X) ≤ f (W ;X) + ε (5)
where ε is a predefined constant.
According to Definition 1, if we have a bundle of ε-Gross-granularity weak SVMs with a proper ε, we can pre-classify the training dataset X with them and eliminate theuseless training data. However, a difficult, yet importantproblem is how to find the proper ε-Gross-granularity weakSVMs. Prior study has shown that the empirical error ofSVM is directly bounded above with the size of trainingdataset [21]. Peter et al. proved that the maximum discrep-ancy Gn of kernel classifications between hypothesis F andreal probability distribution on training dataset X meets thefollowing conditions [21].
Gn(F) ≤ 2B
n
√
√
√
√
n∑
i=1
K(xi, xj ) = 2B
√
E(K(X,X))
n(6)
Here B is a nonnegative constant and K(X,X) is the kernelmatrix. Formula (6) shows that the performance of hypothe-sis predictor depends on the size of the training dataset, butthey do not have a linear correlation. Shai and Srebro provedthat in low-norm and linear condition, to get a desired gen-
eralization error of f (W ;X) + ε, at least m = O(‖w‖2
ε2 ) =O(
E(K(X,X))
ε2 ) samples are needed [16]. Though the rela-tionship between the size of training dataset and the errorbound is clear, how weak the classifiers should be (the valueof ε), as well as how many training data are needed, is still anopen problem. To address this problem, a heuristic methodis proposed. Before describing our approach, we first givethe following definition.

Training data reduction to speed up SVM training 409
Fig. 2 Examples of samplingGelling Point phenomenon. Theupper two figures showexperimental results of IJCNN1and USPS datasets. GellingPoint of the two datasets are 2 %and 8 % respectively. The lowerfigure shows the experimentalresults of 11 toy datasets fromUCI repository. For thesedatasets, two thirds randomlyselected data are used astraining data and the rest areused as testing data.Experimental results show thatfor most of the toy datasets, theproportion at the Gelling Pointis less than 5 %
Definition 2 Sampling Gelling Point: Assuming X ={x1, . . . , xn} is a training dataset. Pi and Pi+1 (Pi < Pi+1)
are two successive sampling proportions. Pi is defined asthe Sampling Gelling Point of the SVM classifier f (W ;X)
if the classification accuracy of f (W ;X) does not increaseremarkably with the increasing of the sampling proportion�P (�P = Pi+1 − Pi ). Specifically, given (Pi,Pi+1) andthe corresponding classification accuracies (APi
,APi+1), Pi
is the Sampling Gelling Point if the following inequality is
satisfied:APi+1−APi
Pi+1−Pi< α, where α is a const predefined.
To illustrate the Sampling Gelling Point, two largedatasets, IJCNN1 and USPS, and eleven toy UCI datasetsare used in our experiment. Figure 2 shows the Gelling Pointphenomenon over these datasets. Figure 2 demonstrates thatall the datasets used in our experiment have the GellingPoint phenomenon. Based on above observation, it is pos-sible to train an approximate SVM classifier with a smallsubset of the initial training dataset.
Due to the following advantages, we propose to sam-ple the training data at the Sampling Gelling Point. First,generalization performance of a weak SVM at the samplingGelling Point is close to that of the regular SVM. Second, ifthe sampling percentage is too high, most data are correctlyclassified and cleaned, which may leads to useful informa-tion loss. Contrarily, a lower sampling percentage may leadto inadequately data cleaning and some useless data remain.Sampling Gelling Point is a tradeoff between sampling sizeand useful information.
However, it is an nontrivial task to exactly find the Sam-pling Gelling Point, because the Sampling Gelling Point de-pends largely on the specific dataset and the predefined pa-rameter α. Here we propose a heuristic method to approxi-mately find the Sampling Gelling Point. At each step of ourmethod, we sample the training data at a sampling propor-tion Pi+1 and use the sampled data to train a weak classi-fier. If the ratio between the classification accuracy incre-ment APi+1 − APi
of two successive weak SVMs and thecorresponding sampling proportion increment Pi+1 − Pi isless than a predefined threshold α, stop and Pi is consideredas the approximate Sampling Gelling Point. Otherwise, in-crease the sampling proportion to Pi+2 = Pi+1 + β (β is apredefined step length) in the next step. Meanwhile, we setthe maximum sampling proportion at 10 % no matter theSampling Gelling Point is found or not. Figure 3 illustratesthe key idea of our method.
4 Informative pattern extraction based on maximuminformation entropy
Learning theory defines informative patterns as: given amodel trained on a sequence of patterns, a new pattern isinformative if it is difficult to predict by a model trained onpreviously seen data [22]. Guyon et al. and MacKay haveproposed that informative pattern can be indicated by thelevel of surprise, and the level of surprise varies in the oppo-site direction as the probability of guessing the correct label

410 S. Wang et al.
Fig. 3 A illustration showing how to approximately find the SamplingGelling Point
[22, 23]. In this paper, we define the informative pattern as:a pattern is informative if it is difficult to be predicted byall the ε-Gross-granularity weak SVMs. In other words, ifthe number of ε-Gross-granularity weak SVMs predictinga pattern label as −1 is close to that predicting its label as1, we believe that this pattern is informative. On the con-trary, a pattern is considered to be not informative if its labelis predicted as −1 or 1 by all the ε-Gross-granularity weakSVMs.
To extract more informative patterns, we propose twomaximum information entropy algorithms in this section.Before introducing the two algorithms, we first give somedefinitions.
Assume there are n training samples X = {x1, . . . , xn}which can be categorized into m classes C = {c1, . . . , cm}.We consider the probability of the sample xi being classi-fied to class cj by the ε-Gross-granularity weak SVMs as arandom variable. Then the information entropy of sample xi
can be defined as
H(xi) = E(
I (xi))
= −m
∑
j=1
p(cxi= cj ) · log2 p(cxi
= cj ) (7)
I (xi) is the amount of information of xi , and p(·) is theprobability mass function. Assume there are N ε-Gross-granularity weak SVMs predicting each training data. Afterprediction, we use ki (i = 1, . . . , n) to denote the number ofpredictors which misclassify the training sample xi . ki canbe formally defined as
ki =N
∑
t=1
yti
⊕
Labeli (8)
where yti is the class label of xi predicted by the tth ε-Gross-
granularity weak SVM, and Labeli is xi ’s true class label.Then the number of weak SVMs correctly predicting samplexi ’s label is N − ki , i = 1, . . . , n. Therefore, the empirical
probabilities of correctly and incorrectly predicting the labelof sample xi can be represented as
p(xi_correct) ≈ p(yi = Labeli ) = N − ki
N
p(xi_wrong) ≈ p(yi �= Labeli ) = ki
N
(9)
Similarly, the amount of information of sample xi can beapproximately represented as
I (xi_correct) ≈ − log2(yi = Labeli )
= − log2
(
N − ki
N
)
I (xi_wrong) ≈ − log2(yi �= Labeli )
= − log2
(
ki
N
)
(10)
Finally, the information entropy of sample xi can be repre-sented by Eq. (11) according to Eqs. (9) and (10).
H(xi) =∑
p(xi) · I (xi)
= −∑
p(xi) · log2 p(xi)
≈ −((
N − ki
N
)
· log2
(
N − ki
N
)
+(
ki
N
)
· log2
(
ki
N
))
(11)
Now we obtain the information entropy of each sample, thenthe information entropy of the whole dataset can be obtainedby adding up the information entropy of all the data.
H(X) =n
∑
i=1
H(xi) (12)
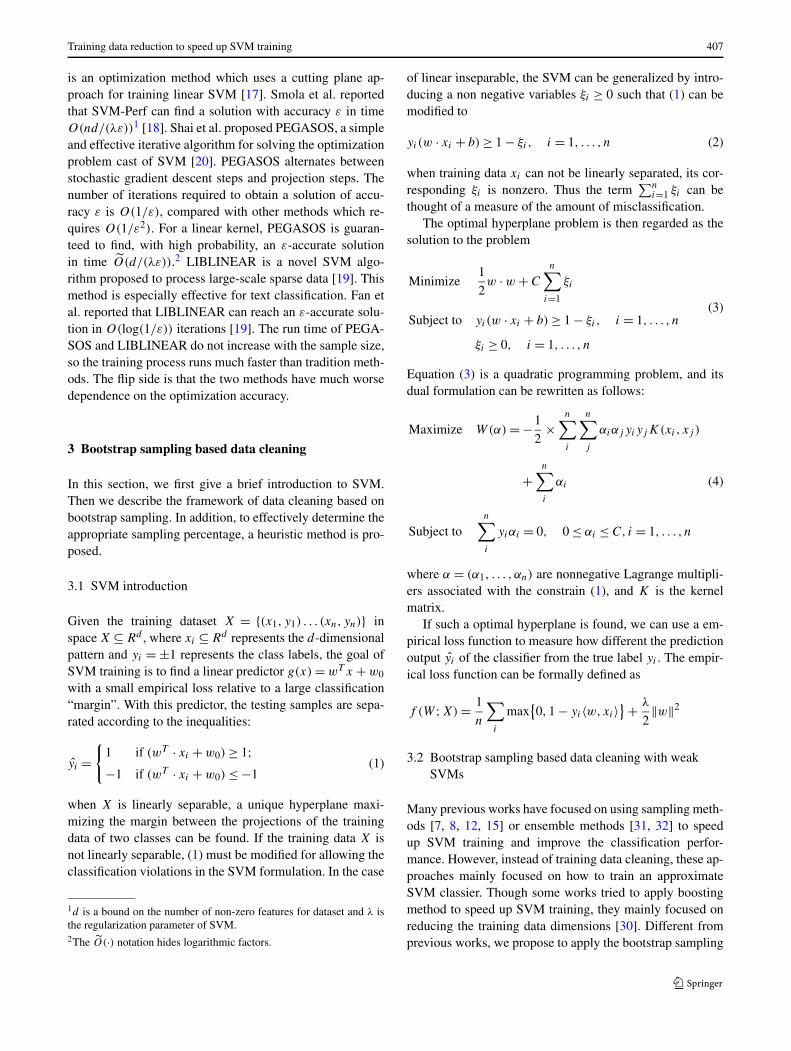
4.1 Informative pattern extraction algorithm MEFS
The intuitive idea of informative pattern extraction algo-rithm MEFS (Maximize the Entropy by Fixing the dataSize) is to select a subset ˜X with a fixed size from the ini-tial dataset X′, and the information entropy of ˜X is max-imum. More specifically, given the training dataset X′ ={x1, . . . , xn′ } and the sampling proportion q %, the problemis to find the subset ˜X (|˜X| = n′ · q %) with the maximuminformation entropy. We formally define the problem as fol-lows:
˜X = {xt1, . . . , xtn} = arg max(
H(˜X))
Subject to: n′ · q % ≤ n (13)
Training data reduction to speed up SVM training 411
According to above deductions, this optimization problemcan be further represented as
˜X ≈ arg max
(
n∑
i=1
[
−(
N − kxti
N
)
· log2
(
N − kxti
N
)
+ kxti
N· log2
(
kxti
N
)]
)
Subject to: n′ · q % ≤ n
(14)
Pseudo code of algorithm MEFS is as follows:
Procedure Informative_Pattern_MEFS(X′,q %,˜X,N ,K)
Input: the dataset from the first stage X′, sampling per-centage q %, number of ε-Gross-granularity weak SVMsN (Here we set N = 10), misclassification times K (vector)of training data X′.Output: subset ˜X of X′ (|˜X| = |X′| · q %) with the maxi-mum information entropy
1. Calculate the information entropy of each training data.
H(xi) ≈ −((
N − ki
N
)
· log2
(
N − ki
N
)
+(
ki
N
)
· log2
(
ki
N
))
2. Sort the training data in descending order in terms of theirinformation entropy.
DesSort(
X′) = {xs1, xs2, xs3, . . . , xsn}3. Calculate the information entropy of the whole dataset.
H(
X′) =n
∑
i=1
H(xi)
4. Select the subset ˜X from DesSort(X′) with the maximuminformation entropy.
˜X = {xs1, . . . , xsn} = arg max(
H(˜X))
Subject to: n′ · q % ≤ n
return ˜X
end Procedure
4.2 Informative pattern extraction algorithm MSFE
The basic idea of algorithm MSFE (Minimize data Size byFixing the Entropy) is quite similar to algorithm MEFS.MSFE aims to maximize the information entropy underthe condition of fixing the size of extracted samples, whileMSFE tries to select a minimal subset of the given sam-
ples under the condition of fixing the information en-tropy.
The intuitive idea of algorithm MSFE is to minimize thesize of extracted samples by fixing the information entropy.For example, how many samples do we need at least to ob-tain 95 % information entropy of all the training samples?
More specifically, given the training dataset X′ and theinformation entropy percentage m %, the task is to find theminimal subset ˜X whose information entropy is no less thanm % ×H(X′). This problem can be formally represented asfollows:
˜X = {xt1, . . . , xtm} = arg min(
Card(˜X))
Subject to: H(˜X) ≥ m % · H (
X′) (15)
Card(˜X) is the cardinality of subset ˜X.Pseudo code of algorithm MSFE is as follows:
Procedure Informative_pattern_MSFE(X′, m %, ˜X, N , K)
Input: the dataset X′ from the first stage, entropy percent-age m %, number of ε-Gross-granularity weak SVMs N,misclassification times K of each training data.Output: the minimal subset ˜X of X′ whose information en-tropy is no less than m % of the total entropy
1. Calculate the information entropy of each training data.
H(xi) ≈ −((
N − ki
N
)
· log2
(
N − ki
N
)
+(
ki
N
)
· log2
(
ki
N
))
2. Sort training data in descending order in terms of theirinformation entropy.
DesSort(
X′) = {xs1, xs2, xs3, . . . , xsn}3. Calculate the information entropy of the whole dataset.
H(
X′) =n
∑
i=1
H(xi)
4. Select the minimum subset ˜X from DesSort(X′) with theentropy no less than m % · H(X′).
˜X = {xs1, . . . , xsm} = arg min(
Card(˜X))
Subject to: H(˜X) ≥ m % · H (
X′)
return ˜X
end Procedure
5 Experiment and evaluation
In this section, we empirically evaluate our approaches byconducting extensive experiments on four large datasets.

412 S. Wang et al.
Fig. 4 Testing accuracy with different # of weak SVMs
The objectives of these experiments are three-fold. (1) Toevaluate the generalization performance of our approaches.Two metrics are used here: accuracy value and AUC (areaunder curve) value. (2) To evaluate the speedup obtainedby our approaches. (3) To compare our approaches withstate-of-the-art fast SVM algorithms, including PEGASOS,RSVM and LIBLINEAR.
LIBSVM is used to train weak classifiers and the finalclassifier in all our experiments for its perfect generalizationperformance [24]. We report the average result on 10 runs.The experiments are executed in parallel on 5 WindowsXPmachines with four 2.2 GHz processor and 4 GB DRAM.
5.1 Datasets
Four large datasets are used in our experiment, and webriefly describe them as follows.
KDD99 The KDDCUP-99 intrusion detection dataset hasbeen used for the Third International Knowledge Discov-ery and Data Mining Tools Competition. The training setcontains 4,898,431 connection records, which are processedfrom seven weeks of binary TCP dump data of network traf-fic. The test set contains 311,029 patterns which are fromanother two weeks of network connection.
Extended USPS USPS dataset is the US Postal Servicehandwritten digits recognition corpus. It contains the nor-malized gray scale images of size 16 × 16, divided into atraining set of 7291 images and a test set of 2007 images. Inthis experiment, we use the extended version of the USPSdataset. The extended dataset has a total of 266,079 patternswhile the extended test set has 753,83 patterns.
IJCNN1 The IJCNN (task 1) dataset is from the IJCNN2001 challenge [25]. It contains 49,990 training patterns and91,701 testing patterns. Each pattern has 22 features.
Web Web page dataset consists of 49,749 web pages astraining dataset and 14,951 web pages as testing dataset,with 300 sparse binary keyword attributes extracted fromeach web page.
Table 1 Experiment datasets
Dataset KDD99 USPS IJCNN1 Web
Attribute 127 676 22 300
Training Data 4,898,431 266,079 49,990 49,749
Testing Data 311,029 75,383 91,701 14,951
Gelling Point 1 % 2 % 8 % 1 %
Table 1 shows some key information of the four datasets.Currently, our approach is only applied to the binary classifi-cation problem. For the KDD99 intrusion detection dataset,the normal connections are considered as the positive sam-ples and all the abnormal connections are considered to bethe negative samples.
5.2 Preliminary Experiment 1: effect of the size of weakSVMs
To apply the proposed approach, firstly we need to deter-mine how many weak SVMs should be used in the datacleaning stage. Theoretically, more weak SVMs can leadto a more precise estimation of the misclassification prob-ability distribution of the training data. As a result, the per-formance of final SVM classifier can be better. However,more weak SVMs need more training time and computingresources. Therefore, tradeoff between the computing re-sources and the generalization performance should be care-fully considered. To study the effect of the number of weakSVMs to the testing accuracy, we conduct a preliminaryexperiment. In the experiment, we use 5, 10 and 15 weakSVMs on the four datasets, respectively. For each dataset,we record the average testing accuracy with a different num-ber of weak SVMs and different information entropy.
Figure 4 shows the experiment result. (For the conve-nience of visualization, only the result of algorithm MEFSis presented. The result of MSFE is very similar to the resultof MEFS.) The result demonstrates that the testing accuracyof the final classifiers with 10 and 15 weak SVMs is obvi-ously superior to that only with 5 weak SVMs. Nevertheless,the results of using 10 and 15 weak SVMs are very similar,which implies the performance of final classifier keeps sta-ble when the number of weak SVMs is large enough. Based

Training data reduction to speed up SVM training 413
Fig. 5 SVs distribution
on above observation, to save computational resources, weonly use 10 weak SVMs in the following experiments.
5.3 Preliminary Experiment 2: whether, and how manysupport vectors are also cleaned?
The SVM classifier only depends on a few samples calledsupport vectors (SVs). Therefore, the SVs and their cor-responding coefficients largely determine the classificationperformance. As most of the training samples are simply re-moved in the data cleaning stage, an interesting problem is:are there any SVs that are also cleaned? To investigate therelationship between the cleaned data and SVs, we conductanother preliminary experiment in this subsection.
The entire dataset is divided into three parts after the firststage of our approach: the samples that are correctly clas-sified by all the weak SVMs, the samples that are misclas-sified by all the weak SVMs, and the others. In Fig. 5, weshow the distribution of misclassification times of SVs overthe four datasets. Some interesting conclusions can be drawnfrom Fig. 5. First, only a small proportion (around 5 %) ofSVs are cleaned in the first stage, because only the sam-ples which are misclassified or correctly classified by all theweak SVMs are removed. Samples misclassified by all theweak SVMs are mostly SVs. This is mainly because sam-ples which are misclassified by all the weak SVMs are veryunlikely to be correctly classified by a regular SVM. Inter-estingly, the subsequent experiment will show that simplyremoving these data will not significantly affect the classifi-cation performance, since some outliers are also cleaned andthe classifier boundary becomes more smooth. Second, fewSVs are correctly classified by all the weak SVMs. There-fore, only a small proportion (2–3 %) of SVs are in the sam-ples which are correctly classified by all the weak SVMs.Quite naturally, if a sample is correctly classified by a weakSVM, it is not a tough task for a regular SVM to classifyit correctly. As only a small proportion of SVs are cleaned,most SVs remained to the second stage as the training data.
5.4 Preliminary Experiment 3: effect of mixing kernels
In this subsection, we conduct an experiment to study theeffect of mixing kernels to the classification performance.SVM is a typical kernel method which maps the trainingdata (nonlinearly) into a higher dimensional feature space(kernel space) when the original space is linear insepara-ble. For mapping the original space to a higher dimen-sional space, many kernel functions are constructed. Gen-erally speaking, the kernel functions used in SVM can bemainly divided into two categories: local kernels and globalkernels [26].
Local kernels Only the training data that are close or inthe proximity of each other have an influence on the kernelvalues. Examples of local kernels include Gaussian kernel,Radial Basis Function kernel (RBF) and KMOD kernel.
• Gaussian kernel:
K(x,xi) = exp
(
−1
2(x − xi)A
−1(x − xi)T
)
(16)
where A have three following norms:A = I Euclidean NormA = D−1
j Diagonal Norm
A = C−1j Mahalonobis Norm
• Radial Basis Function Kernel (RBF):
K(x,xi) = exp−‖x − xi‖2
2σ 2(17)
where σ is the kernel parameter.• KMOD kernel:
K(x,xi) = exp
(
1
1 + ‖x − xi‖2
)−1
(18)
Global kernels Data that are far away from each other stillhave an influence on the kernel values. Typical global ker-nels include Linear kernel, Polynomial kernel and Sigmoidkernel.
• Linear kernel:
K(x,xi) = x · xi (19)
• Polynomial kernel:
K(x · xi + 1)p (20)
where the kernel parameter p is the degree of polynomial tobe used.
• Sigmoid kernel:
K(x,xi) = tanh(x · xi + 1) (21)

414 S. Wang et al.
Table 2 Classification accuracy while using different mixture kernels
# of weak SVMs Kernel KDD99 USPS IJCNN1 Web
10 Gaussian 0.934 ± 0.003 0.982 ± 0.004 0.954 ± 0.002 0.956 ± 0.005
10 RBF 0.942 ± 0.004 0.985 ± 0.003 0.967 ± 0.003 0.960 ± 0.005
10 Linear 0.937 ± 0.003 0.975 ± 0.004 0.967 ± 0.003 0.960 ± 0.005
10 Polynomial 0.947 ± 0.004 0.988 ± 0.005 0.965 ± 0.004 0.96 ± 0.004
10 Sigmoid 0.945±0.003 0.99±0.004 0.97±0.003 0.974 ± 0.004
10 Gaussian (5) + RBF (5) 0.957 ± 0.002 0.996 ± 0.003 0.978 ± 0.003 0.978 ± 0.004
10 Gaussian (5) + Linear (5) 0.954 ± 0.003 0.99 ± 0.003 0.98 ± 0.005 0.98 ± 0.003
10 Gaussian (5) + Polynomial (5) 0.948 ± 0.004 0.992 ± 0.004 0.983 ± 0.005 0.984 ± 0.004
10 Gaussian (5) + Sigmoid (5) 0.955 ± 0.005 0.994 ± 0.004 0.976 ± 0.002 0.979 ± 0.003
10 RBF (5) + Linear (5) 0.948 ± 0.003 0.989 ± 0.002 0.982 ± 0.003 0.98 ± 0.003
10 RBF (5) + Polynomial (5) 0.954 ± 0.004 0.995 ± 0.003 0.98 ±0.003 0.983 ± 0.004
10 RBF (5) + Sigmoid (5) 0.952 ± 0.003 0.993 ± 0.004 0.978 ±0.003 0.983 ± 0.003
10 Linear (5) + Polynomial (5) 0.95 ± 0.002 0.995 ± 0.004 0.983 ± 0.003 0.98 ± 0.004
10 Linear (5) + Sigmoid (5) 0.945 ± 0.003 0.985 ± 0.003 0.982 ± 0.003 0.978 ± 0.005
10 Polynomial (5) + Sigmoid (5) 0.952 ± 0.004 0.99 ± 0.003 0.982 ± 0.004 0.982 ± 0.003
Average of single kernel 0.941 ± 0.003 0.984 ± 0.004 0.967 ± 0.003 0.962 ± 0.004
Average of mixture kernels 0.952 ± 0.003 0.992 ± 0.003 0.980 ± 0.003 0.981 ± 0.003
Depending on particular applications and specific datasets,the performance of SVM classifiers trained with differentkernels may differ significantly. A desirable characteristicfor learning may not be a desirable characteristic for gen-eralization. Smits and Jordan have reported that using mix-tures of kernels can result in having both good interpolationand extrapolation abilities [26]. The regression performancecan be improved by combing two or more kernels. Similarly,Kumar et al. have studied the effect of different mixed ker-nels on overall sub-pixel classification accuracy of remotesensing data using Fuzzy Error Matrix (FERM) [27]. Theirexperimental results showed that overall sub-pixel classifi-cation accuracy of multi-spectral remote sassing data variedwhile using a different mixture of kernel functions in SVM.In addition, Collobert et al. presented a new mixture of SVMkernels that can be easily implemented in parallel, and eachSVM is trained on a small subset of the whole dataset [29].
There are several methods of mixing kernels, of whichlinear mixture is the most common form. It can be definedas follows:
K(x,xi) = θKa(x, xi) + (1 − θ)Kb(x, xi) (22)
A bulk of weak SVMs are used in the first stage of our ap-proach. Therefore, we propose to use different kernels fordifferent weak SVMs. In our method, a single weak SVMcorresponds to a single kernel and different weak SVMs cor-respond to different kernels. The mixture of kernels here is
defined as follows:
K(x,xi) =N
∑
t=1
αt · Kj(x, xi)
Subject to: αt = 0 when j �= t
αt = 1 when j = t
(23)
The final mixing kernels classifier can be defined accordingto the kernels used in weak SVMs as follows:
K(x,xi) =J
∑
j=1
N∑
t=1
(αt/N) · Kj(x, xi) (24)
where j denotes the j th weak classifier.To test whether mixing kernels will affect the classifi-
cation performance, some preliminary experiments are per-formed. For simplicity, only 2 different kernels are mixed inour experiment. We then record the classification accuracyby various single kernels and mixed kernels. The experi-mental results are shown in Table 2. Table 2 demonstratesthat mixing kernels sightly improves the classification per-formance compared with single kernels on the four datasets.Almost all the mixing kernels methods outperform singlekernel methods regardless of what kernels we use. The lasttwo lines of the table show the average results of the twomethods. It also shows that the average result obtained byusing mixing kernels is better than that obtained by only us-ing single kernels. Therefore, in the following experiments,we use mixing kernels, and for simplicity, only two kernelsare mixed.

Training data reduction to speed up SVM training 415
5.5 Preliminary Experiment 4: effect of samplingproportion P
As another important parameter, the sampling proportionP is also needed to be pre-determined. Therefore, in thissubsection, we conduct an experiment to study the effectof sampling proportion P to the classification performanceand training time. In Sect. 3.2, we propose to sample thetraining dataset at Sampling Gelling Point. Here we empir-ically show that Sampling Gelling Point is a rather reason-able sampling point due to its desirable classification perfor-mance and remarkable reduction of training time complex-ity.
Table 3 shows our experimental results on the fourdatasets. For each dataset, we sample training data at sev-eral different sampling points around the Sampling GellingPoint. Then for each sampling point, we utilize the bootstrapsampling based approach to clean useless data and extractinformative data on various entropy proportions. Finally, wereport the number of misclassified data Nmis , the number ofextracted informative data n on each entropy proportion, thetraining time t (in seconds) and the testing accuracy (acc)for each experiment. Here, the training time t is based onthe entire process, including the bootstrap sampling and datacleaning process in the first stage and the informative patternextraction and final classifier training process in the secondstage. But the entire process is based on all the parame-ters being confirmed, such as sampling percentage P andnumber of weak SVMs N in the first stage and informationpercentage m % in the second stage. Therefore, the time oftuning parameters is excluded from t . Additionally, as thefirst stage is processed in parallel on several computers, weonly consider the time consumed on one computer.
Table 3 shows that the number of misclassified data Nmis
drops with the rising of sampling proportion P . It meansmore training data are cleaned and less training time isneeded for a large P . However, if the sampling proportionis too large, some informative data may also be cleaned dueto overfitting, and testing accuracy will be decrease conse-quently. Take IJCNN1 dataset for example, the testing accu-racy at sampling proportion 1 %, 5 % and 8 % are similarand stable, all between 0.97 and 0.98. When we sample thedata at the proportion of 10 %, the testing accuracy drops re-markably to around 0.95. What’s worse, the testing accuracybecomes more and more unstable with the increasing of P .
The table data with black body represent the results atSampling Gelling Point. It also demonstrates that SamplingGelling Point is a reasonable sampling point. This is becausetesting accuracy at Sampling Gelling Point is comparable tothat at smaller sampling points, and most useless trainingdata are cleaned.
Fig. 6 Entropy distribution
Fig. 7 Variation of training data reduction under various entropy pro-portions
5.6 Speedup and generalization performance experiments
To evaluate the speedup of the training process and gener-alization performance of our algorithms, we compare themwith regular LIBSVM. Similar to Sect. 5.5, the training timeof our approaches also consists of two parts, the time con-sumed on data cleaning stage and the time consumed onthe informative patterns extraction stage. The two parts areadded up as the whole training time in this experiment andthe subsequent experiment in Sect. 5.7. Before comparison,we first investigate the entropy distribution of training dataon the four datasets. Figure 6 demonstrates the entropy pro-portions under different misclassification probabilities overthe four datasets. From Fig. 6 we can see that the entropyproportion decreases with the increasing of misclassifica-tion probability. It means that most data can be classifiedcorrectly and only a small part of the data are likely to bemisclassified. This result is also consistent with the Gaussiandistribution hypothesis of training datasets. Figure 7 showsthe variation of training data reduction under various en-tropy proportions. For the convenience of the demonstration,we utilize the logarithmic form. The x axis is log(X/X′),

416 S. Wang et al.
Table 3 Experiment on four datasets with different sampling proportion P . Nmis denotes the number of misclassified training data. Three metricsare reported, the number of extracted informative data n, training time t (s) and testing accuracy acc
Datasets P Nmis Metrics Entropy proportion
10 % 20 % 30 % 40 % 50 % 60 %
USPS 0.5 % 4780 ± 245 n 325 ± 24 895 ± 45 1453 ± 57 2400 ± 112 3025 ± 178 3542 ± 210
t (s) 3.8 ± 1.0 8.5 ± 1.2 12.5 ± 1.8 16.8 ± 2.4 25.4 ± 2.7 30.5 ± 3.4
acc .974 ± .003 .978 ± .002 .983 ± .003 .988 ± .003 .992 ± .004 .994 ± .002
1 % 3895 ± 224 n 286 ± 14 625 ± 20 986 ± 24 1562 ± 45 2045 ± 54 2564 ± 78
t (s) 3.2 ± 0.4 6.8 ± 0.8 10.5 ± 1.6 14.5 ± 2.1 22.3 ± 2.6 25.4 ± 3.4
acc .965 ± .004 .972 ± .003 0.978 ± .003 .982 ± .004 .990 ± .002 .992 ± .001
2 % 2675 ± 165 n 187 ± 14 402 ± 22 687 ± 35 1254 ± 65 1686 ± 87 2052 ± 104t (s) 2.8 ± 0.5 6.2 ± 1.1 9.5 ± 1.7 12.7 ± 2.2 15.6 ± 2.4 21.8 ± 3.1acc .960 ± .010 .975 ± .006 .978 ± .004 .980 ± .003 .985 ± .004 .992 ± .001
5 % 1020 ± 91 n 87 ± 12 165 ± 25 257 ± 45 356 ± 46 456 ± 54 754 ± 68
t (s) 1.5 ± 0.3 2.7 ± 0.7 3.1 ± 0.6 4.2 ± 1.0 6.7 ± 0.8 10.3 ± 1.1
acc .915 ± .012 .945 ± .010 .956 ± .008 .965 ± .007 .972 ± .004 .975 ± .003
IJCNN1 1 % 2121 ± 178 n 187 ± 14 368 ± 21 586 ± 43 754 ± 59 1042 ± 101 1245 ± 114
t (s) 4.2 ± 0.6 12.5 ± 1.1 18.7 ± 1.3 23.4 ± 2.1 32.4 ± 2.6 43.8 ± 3.2
acc .940 ± .008 .946 ± .006 .949 ± .002 .965 ± .003 .978 ± .002 .981 ± .002
5 % 1745 ± 102 n 164 ± 22 315 ± 34 502 ± 54 654 ± 56 875 ± 68 1025 ± 97
t (s) 3.7 ± 0.4 10.5 ± 1.1 17.4 ± 1.4 22.4 ± 3.2 27.3 ± 2.2 35.6 ± 2.4
acc .926 ± .006 .946 ± .004 .948 ± .002 .958 ± .003 .972 ± .002 .976 ± .002
8 % 1324 ± 112 n 97 ± 12 203 ± 21 354 ± 28 453 ± 34 587 ± 48 685 ± 68t (s) 2.8 ± 0.6 4.6 ± 0.8 12.3 ± 1.4 16.5 ± 1.5 20.8 ± 2.0 24.8 ± 2.3acc .920 ± .015 .934 ± .010 .945 ± .006 .957 ± .008 .968 ± .004 .972 ± .002
10 % 1256 ± 103 n 78 ± 8 168 ± 12 245 ± 22 385 ± 28 454 ± 32 585 ± 48
t (s) 2.5 ± 0.4 3.8 ± 1.0 8.6 ± 1.3 12.6 ± 2.1 16.7 ± 2.3 21.2 ± 3.5
acc .897 ± .021 .916 ± .020 .927 ± .012 .935 ± .010 .947 ± .010 .948 ± .008
Web 0.5 % 2875 ± 212 n 189 ± 12 356 ± 23 568 ± 35 758 ± 57 1542 ± 87 1865 ± 112
t (s) 2.8 ± 0.8 14.2 ± 1.4 30.5 ± 2.5 44.7 ± 3.7 64.2 ± 4.6 87.5 ± 7.2
acc .878 ± .043 .923 ± .014 .954 ± .012 .970 ± .008 .975 ± .005 .980 ± .003
1 % 2056 ± 165 n 154 ± 14 302 ± 23 424 ± 34 561 ± 45 785 ± 65 1243 ± 103t (s) 2.4 ± 0.4 6.7 ± 0.8 18.4 ± 1.4 28.6 ± 2.7 46.8 ± 5.7 55.6 ± 8.6acc .856 ± .025 .918 ± .015 .932 ± .008 .957 ± .006 .972 ± .006 .975 ± .004
2 % 1856 ± 154 n 132 ± 11 254 ± 18 387 ± 24 542 ± 38 658 ± 45 876 ± 83
t (s) 2.2 ± 0.4 4.8 ± 0.8 15.3 ± 1.4 24.6 ± 3.5 36.7 ± 4.2 50.4 ± 4.6
acc .823 ± 0.024 .854 ± .021 .902 ± .014 .945 ± .011 .956 ± .008 .965 ± .004
5 % 1500 ± 112 n 112 ± 11 245 ± 18 354 ± 22 523 ± 35 587 ± 56 724 ± 68
t (s) 2.1 ± 0.4 4.6 ± 0.8 13.7 ± 1.6 20.6 ± 2.7 28.8 ± 3.8 40.5 ± 4.3
acc .810 ± .023 .845 ± .020 .878 ± .017 .910 ± .008 .926 ± .006 .945 ± .003
KDD99 0.5 % 4678 ± 324 n 324 ± 26 627 ± 45 1067 ± 87 1534 ± 103 1786 ± 142 2345 ± 234
t (s) 20.1 ± 1.8 43.2 ± 4.5 75.5 ± 8.6 104.7 ± 10.5 164.2 ± 12.7 202.4 ± 20.4
acc .930 ± .008 .934 ± .006 .938 ± .004 .942 ± .003 .945 ± .003 .946 ± .002
1 % 3876 ± 245 n 289 ± 24 568 ± 48 878 ± 67 1257 ± 114 1658 ± 124 1743 ± 153t (s) 18.7 ± 1.6 34.7 ± 3.5 65.4 ± 4.6 91.6 ± 8.4 112.8 ± 11.3 168.6 ± 13.4acc .924 ± .006 .927 ± .005 .934 ± .004 .936 ± .005 .940 ± .002 .942 ± .003
2 % 1856 ± 126 n 156 ± 12 284 ± 22 357 ± 32 582 ± 45 758 ± 65 1122 ± 120
t (s) 12.3 ± 1.1 18.8 ± 1.6 25.3 ± 2.3 40.6 ± 3.6 54.7 ± 5.4 87.4 ± 7.7
acc .845 ± .021 .865 ± .017 .889 ± .012 .924 ± .008 .932 ± .006 .935 ± .004
5 % 1045 ± 97 n 87 ± 10 156 ± 12 224 ± 21 315 ± 31 458 ± 43 546 ± 47
t (s) 8.6 ± 1.1 12.6 ± 2.1 15.7 ± 2.2 24.6 ± 3.2 28.7 ± 3.4 38.5 ± 4.2
acc .820 ± .023 .835 ± .021 .870 ± .018 .875 ± .013 .889 ± .012 .915 ± .010

Training data reduction to speed up SVM training 417
Fig. 8 Speedup, test accuracy & AUC under various entropy proportions
where X is the size of the initial dataset and X′ representsthe size of the reduced dataset. We then evaluate the speedupof training time, test accuracy and AUC of our approachesunder various entropy proportions. As a comparison, the testaccuracy and AUC of regular LIBSVM are used as the base-line. Figure 8 shows the experimental results. The upper fig-ures show the speedup and the lower figures show the accu-racy and AUC under different entropy proportions. (For theconvenience of the comparison, we also calculate the en-tropy proportion according to the misclassified samples se-lected by algorithm MEFS.) Baseline-1 and baseline-2 rep-resent the test accuracy and AUC of regular LIBSVM, re-spectively.
As shown in Fig. 8, the improvement on speedup of train-ing time is significant on all four datasets. For the datasetsKDD99, web and USPS, the speedup achieved by our ap-proach can be up to 100–200, while the testing accuracyand AUC are very close to that obtained by the regular LIB-SVM. Although for the IJCNN1 dataset, the speedup is notthat significant, both algorithms are nearly 20 times fasterthan regular LIBSVM. Experimental results on IJCNN1 andweb datasets also demonstrate that our methods may per-form better than regular LIBSVM when the entropy propor-tion is high enough.
It is also shown that the performance of SVM trainedon the data with only about 50–60 % information entropyis comparable to that trained on the whole dataset. This isprobably because in many cases only a small quantity ofdominant training data determine the performance of theSVM classifier to a great extent. As our methods effectivelyextract these informative patterns, the training time is signif-icantly reduced with little performance loss.
5.7 Comparative experiments with the state-of-the-artmethods
To further compare our approaches with existing fast SVMtraining methods, we conduct the comparative experiment
against three state-of-the-art algorithms, PEGASOS, RSVMand LIBLINEAR SVM.
PEGASOS and LIBLINEAR are two effective SVMspeedup algorithms. Both algorithms have shown excellentperformance on very large datasets, especially datasets withvery sparse, linear kernels. RSVM aims to generate a non-linear kernel-based separating surface that requires a subsetof a large dataset for its explicit evaluation. The basic idea ofRSVM is using only a small random sample of training dataas a representative sample with respect to the entire dataset,which is very similar to our method. Besides the three meth-ods, LIBSVM with random sampling is also used as a base-line to show the effectiveness of our sampling method. Fig-ure 9 shows the experimental results. The following conclu-sions can be drawn from the results. First, from the train-ing time perspective, there is no significant difference be-tween our approaches and the three state-of-the-art meth-ods. For web and USPS datasets, our approaches need lesstime to converge than PEGASOS and LIBLINEAR. Second,the testing accuracy of our approaches outperform other al-gorithms. For web, IJCNN1 and USPS datasets, PEGASOSand LIBLINEAR are even inferior to LIBSVM with randomsampling. It was reported that both PEGASOS and LIBLIN-EAR are linear SVM [15, 16]. Therefore, the two algorithmsare effective for large, sparse datasets like text classificationwith linear kernels. However, our experiment indicates thatPEGASOS and LIBLINEAR might not be so effective forlarge yet not sparse datasets. Comparison between our ap-proaches and RSVM demonstrates that our methods outper-form RSVM in test accuracy. Meanwhile, our methods needless training time. This shows that our approaches are moreeffective to extract informative samples than RSVM.
6 Conclusion
To make SVM practical to large datasets, an algorithm toclean useless training data and extract informative patterns

418 S. Wang et al.
Fig. 9 Testing accuracy versus training time
for the SVM classifier is proposed. It includes two stages,useless data cleaning and informative patterns extraction.A bootstrap sampling based data cleaning method is pro-posed in the first stage, and two maximum entropy based in-formative patterns extraction methods are presented in thesecond stage. In most cases, the training data size is re-duced significantly after the two stages. Therefore, trainingtime complexity will be remarkably decreased. Empirical re-sults on four large datasets show that the training processof our approach can be up to 200 times faster than regularSVM while with little performance loss. Meanwhile, com-parisons between our approach against three state-of-the-artalgorithms demonstrate that our approach is more efficientfor large but not sparse datasets.
Although the proposed approach is effective, there aresome problems that need to be solved in future work. First,in the data cleaning stage, the sampling percentage selec-tion is empirical. The Gelling Point phenomenon may notbe prominent for all the datasets. In such cases, to find anappropriate sampling percentage might largely depend onthe specific classification task and prior knowledge. Second,how many weak classifiers are needed? Theoretically, the
more the better. In our experiments, only 10 weak SVMsclassifiers are used. However, more weak classifiers needmore training time and more parallel computers. Tradeoffbetween computing resource and testing accuracy should becarefully considered.
Acknowledgements This work was supported by the National Nat-ural Science Foundation of China (Grant Nos. 61170189, 61370126,61202239), the Research Fund for the Doctoral Program of HigherEducation (Grant No. 20111102130003), and the Fund of the StateKey Laboratory of Software Development Environment (Grant No.SKLSDE-2013ZX-19).
References
1. Wang SZ, Li ZJ, Chao WH, Cao QH (2012) Applying adaptiveover-sampling technique based on data density and cost-sensitiveSVM to imbalanced learning. In: Proceedings of IJCNN
2. Cao YB, Xu J, Liu TY, Li H, Huang YL, Hon HW (2006) Adapt-ing ranking SVM to document retrieval. In: Proceedings of SIGIR,pp 186–193
3. Hasan MA, Chaoji V, Salem S, Zaki M (2006) Link predictionusing supervised learning. In: SIAM workshop on link analysis,counter-terrorism and security
Training data reduction to speed up SVM training 419
4. Burges C (1999) Geometry and invariance in kernel based meth-ods. In: Advances in kernel methods: support vector learning. MITPress, Cambridge
5. Panda N, Edward YC, Wu G (2006) Concept boundary detectionfor speeding up SVMs. In: Proceedings of ICML, pp 681–688
6. Graf HP, Cosatto E, Bottou L, Durdanovic I, Vapnik V (2006) Par-allel support vector machines: the cascade SVM. In: Advances inneural information processing system, vol 17. MIT Press, Cam-bridge, pp 521–528
7. Lawrence ND, Seeger M, Herbrich R (2003) Fast sparse Gaussianprocess methods: the informative vector machine. In: Advances inneural information processing systems. MIT Press, Cambridge
8. Yu H, Yang J, Han J (2003) Classifying large datasets using SVMwith hierarchical clusters. In: Proceedings of KDD
9. Vapnik V (1998) Statistical learning theory. Wiley, New York10. Platt JC (1999) Fast training of support vector machines using se-
quential minimal optimization. In: Advances in kernel methods—support vector learning. MIT Press, Cambridge, pp 185–208
11. Joachims T (1999) Making large-scale support vector machinelearning practical. In: Advances in kernel methods—support vec-tor learning. MIT Press, Cambridge, pp 169–184
12. Kao WC, Chung KM, Sun CL, Lin CJ (2004) Decompositionmethods for linear support vector machines. Neural Comput.16(8):1689–1704
13. Tsang IW, James TK, Cheung PM (2005) Core vector machines:fast SVM training on very large data sets. J Mach Learn Res6:363–392
14. Lee YJ, Mangasarian OL (2001) RSVM: reduced support vectormachines. In: Proceedings of SDM
15. Fine S, Scheinberg K (2001) Efficient SVM training using low-rank kernel representations. J Mach Learn Res 2:243–264
16. Shai SS, Srebro N (2008) SVM optimization: inverse dependenceon training set size. In: Proceedings of ICML
17. Joachims T (2006) Training linear SVMs in linear time. In: Pro-ceedings of KDD
18. Smola A, Vishwanathan S, Le Q (2008) Bundle methods for ma-chine learning. In: Advances in neural information processing sys-tems
19. Fan RE, Chang KW, Hsieh CJ, Wang XR, Lin CJ (2008) LIBLIN-EAR: a library for large linear classification. J Mach Learn Res9:1871–1874
20. Shai SS, Singer Y, Srebro N (2007) Pegasos: primal estimated sub-GrAdient solver for SVM. In: Proceedings of ICML
21. Peter LB, Mendelson S (2002) Rademacher and Gaussian com-plexities: risk bounds and structural results. J Mach Learn Res3:463–482
22. Guyon I, Matic N, Vapnik V (1994) Discovering informative pat-terns and data cleaning. In: Proceedings of AAAI workshop onknowledge discovery in databases
23. MacKay D (1992) Information-based objective functions for ac-tive data selection. Neural Comput 4(4):590–604
24. Chang CC, Lin CJ (2011) LIBSVM: a library for support vectormachines. ACM Trans Intell Syst Technol 2(3):27
25. Chang CC, Lin CJ (2001) IJCNN 2001 challenge: generalizationability and text decoding. In: Proceedings of IJCNN
26. Smits GF, Jordan EM (2002) Improved SVM regression usingmixtures of kernels. In: Proceedings of IJCNN
27. Kumar A, Ghosh SK, Dadhwal VK (2006) Study of mixed kerneleffect on classification accuracy using density estimation. In: Mid-term ISPRS symposium, ITC
28. Shi YH, Gao Y, Wang RL, Zhang Y, Wang D (2013) Transduc-tive cost-sensitive lung cancer image classification. Appl Intell38(1):16–28
29. Collobert R, Bengio S, Bengio Y (2002) A parallel mixtures ofSVMs for very large scale problems. Neural Comput 14:1105–1114
30. Wang CW, You WH (2013) Boosting-SVM: effective learningwith reduced data dimension. Appl Intell 39(3):465–474
31. Idris A, Khan A, Lee YS (2013) Intelligent churn prediction inTelecom: employing mRMR feature selection and RotBoost basedensemble classification. Appl Intell 39(3):659–672
32. Maudes J, Diez JJR, Osorio CG, Pardo C (2011) Random projec-tions for linear SVM ensembles. Appl Intell 34(3):347–359
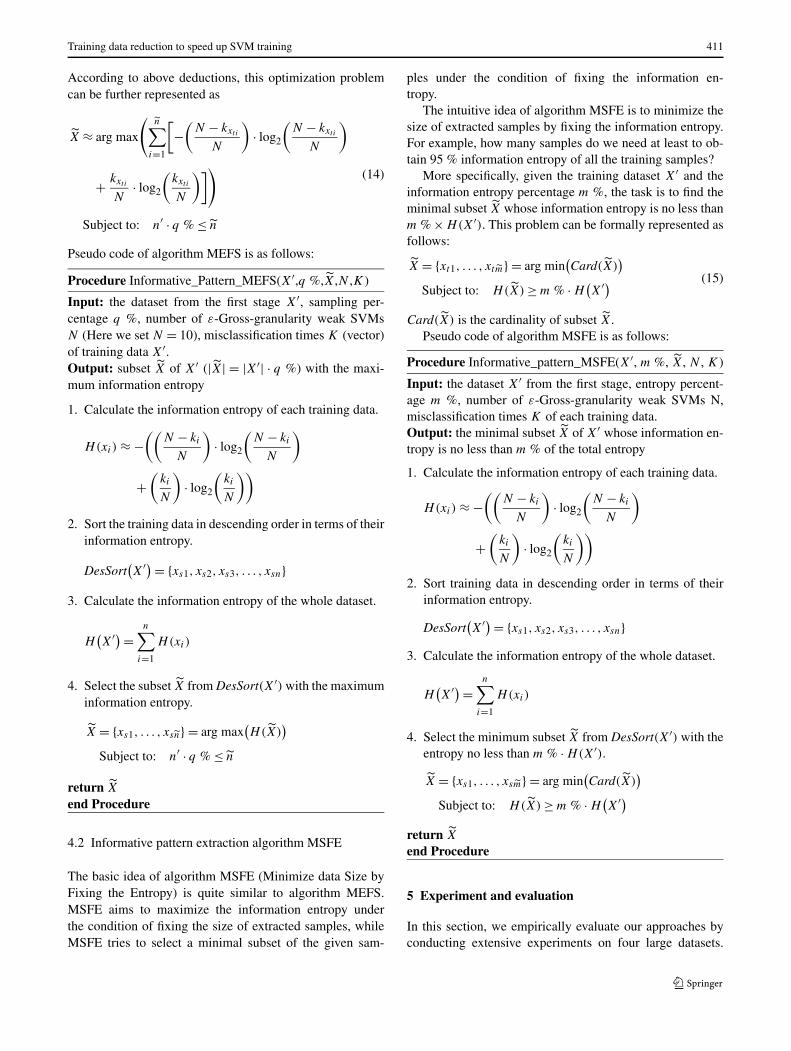
Senzhang Wang was born in Yan-tai, China. He received the M.Sc.degree in Southeast University, Nan-jing, China in 2009. He currentlyis a third-year Ph.D. student in theSchool of Computer Science andEngineering at Beihang University,Beijing, China. His main researchfocus is on data mining and socialnetwork analysis.
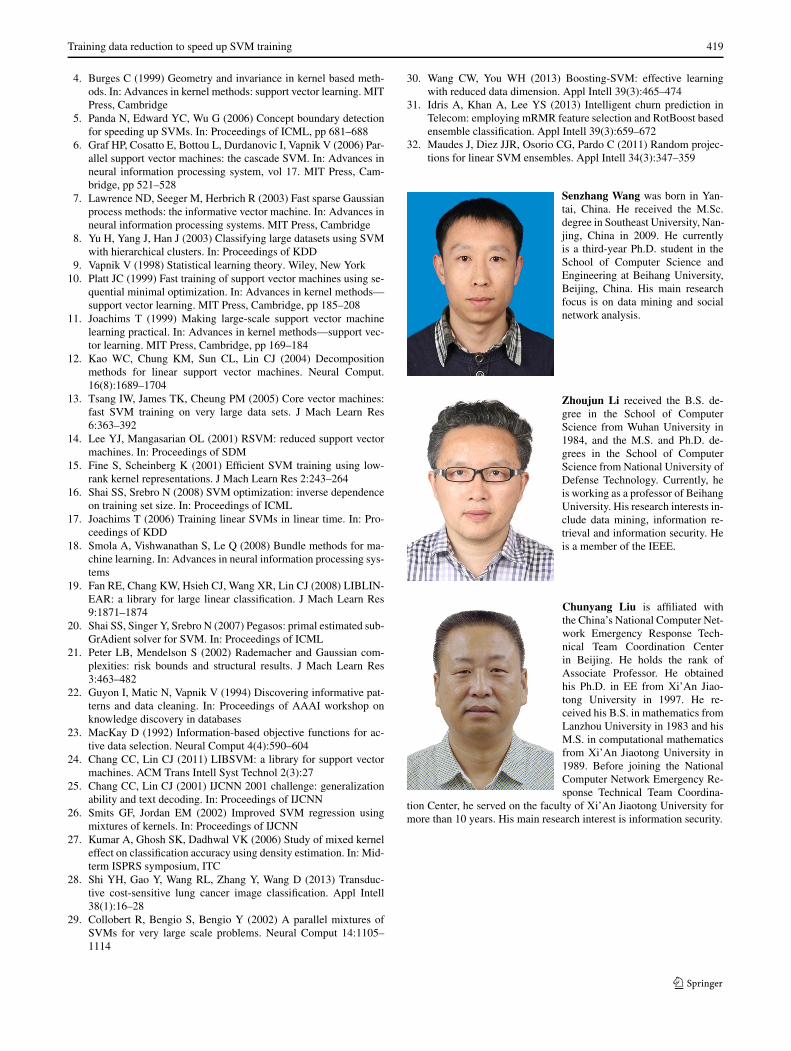
Zhoujun Li received the B.S. de-gree in the School of ComputerScience from Wuhan University in1984, and the M.S. and Ph.D. de-grees in the School of ComputerScience from National University ofDefense Technology. Currently, heis working as a professor of BeihangUniversity. His research interests in-clude data mining, information re-trieval and information security. Heis a member of the IEEE.
Chunyang Liu is affiliated withthe China’s National Computer Net-work Emergency Response Tech-nical Team Coordination Centerin Beijing. He holds the rank ofAssociate Professor. He obtainedhis Ph.D. in EE from Xi’An Jiao-tong University in 1997. He re-ceived his B.S. in mathematics fromLanzhou University in 1983 and hisM.S. in computational mathematicsfrom Xi’An Jiaotong University in1989. Before joining the NationalComputer Network Emergency Re-sponse Technical Team Coordina-
tion Center, he served on the faculty of Xi’An Jiaotong University formore than 10 years. His main research interest is information security.

420 S. Wang et al.
Xiaoming Zhang was born in Hu-nan, China, on December 7, 1980.He received the B.Sc. degree, andthe M.Sc. degrees in computer sci-ence and technology from the Na-tional University of Defence Tech-nology, China, in 2003, 2007 re-spectively. He received his Ph.D.degrees in computer science fromBeihang University, in 2012. He iscurrently working at the school ofcomputer, Beihang University, andhe has been the lecturer since 2012.His major interests are text mining,image tagging, and TDT.
Haijun Zhang was born in Henan,China, on December 10, 1975. Hereceived the B.Sc. degree, and theM.Sc. degree in management sci-ence from the China University ofMining and Technology, in 1997,2004 respectively. He worked atChina Petroleum First ConstructionCorporation from 1997 to 2001. Heis working at school of information,Beijing Wuzi University since 2001.He is currently the Ph.D. candidateof the school of computer, BeihangUniversity. His major interests aredata mining and recommendationsystem.
View publication statsView publication stats