TRAIN MAINTENANCE - Columbia
19
TRAIN MAINTENANCE JEREMY LIM & HAO MAO IEOR E4405 Production Scheduling, Spring 2017
Transcript of TRAIN MAINTENANCE - Columbia
TRAINMAINTENANCE
JEREMY LIM & HAO MAO
IEOR E4405 Production Scheduling, Spring 2017

OVERVIEW.
We are investigating the scheduling of periodic, planned maintenance works on operating subway trains, using a real-world business scenario faced by an operator of the Singapore Mass Rapid Transit (MRT) commuter rail system.
Introduction1
Research Questions2
Problem Setup3
Methodology4
Findings5
Future Work6
INTRODUCTION.
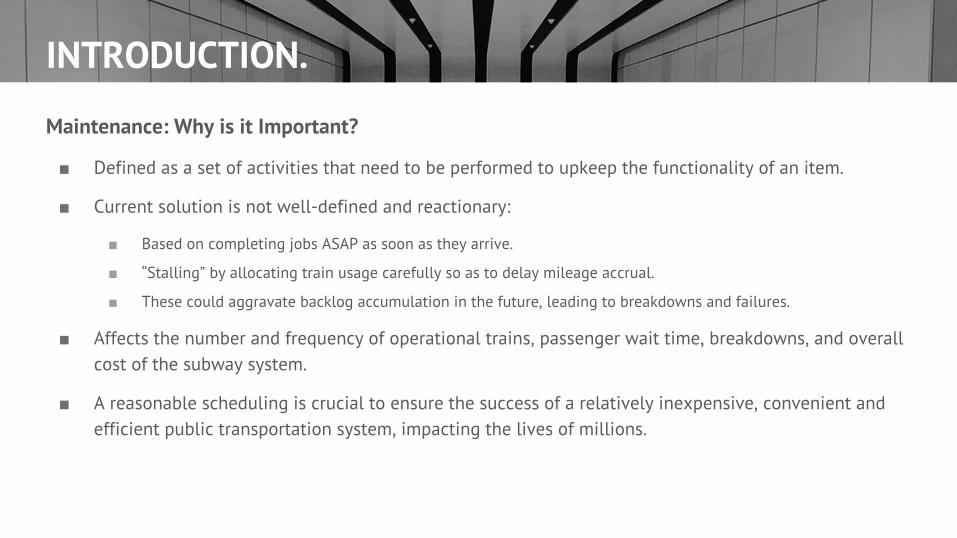
Maintenance: Why is it Important?
■ Defined as a set of activities that need to be performed to upkeep the functionality of an item.
■ Current solution is not well-defined and reactionary:
■ Based on completing jobs ASAP as soon as they arrive.
■ “Stalling” by allocating train usage carefully so as to delay mileage accrual.
■ These could aggravate backlog accumulation in the future, leading to breakdowns and failures.
■ Affects the number and frequency of operational trains, passenger wait time, breakdowns, and overall cost of the subway system.
■ A reasonable scheduling is crucial to ensure the success of a relatively inexpensive, convenient and efficient public transportation system, impacting the lives of millions.

INTRODUCTION.
Information Supplied
■ There are 25 old trains and 17 new trains. Of these, 33 trains run daily to meet operational needs. Trains accrue mileage at 10,000 km/month.
■ Trains undergo periodic maintenance “modules” that recur:
■ Old trains: every 300, 360, 480, 600, 720, 800, 900, 960, 1200, 1400 (‘000 km)
■ New trains: every 360, 480, 500, 600, 720, 800, 840, 960, 1000, 1200 (‘000 km)
■ Each module takes around 15 days. Multiple modules performed in the same session will increase the processing time slightly.
■ As a guide, trains may be sent in for servicing up to 20% earlier than the milestone.
■ Trains continue to run even if they miss a maintenance milestone.
■ Currently, the company has one maintenance platform & crew, but is planning to set up a second.

INTRODUCTION.
Mission
■ The company is facing problems with accumulating backlog: the current 1 crew is insufficient to cope with a growing number of servicing events. Is there a better schedule that allows more jobs to be completed on time?
■
■
■
■ The company is in the process of setting up a second maintenance platform, and hiring a second crew. How much does this improve performance? Is it sufficient to cope?
■ We devise an approach to transform a periodic calendar of “maintenance modules” into a list of jobs with release dates, due dates, and processing times.

INTRODUCTION.
Research Questions
■ What objective function(s) is/are appropriate? Company objectives:
■ Reduce the number of late jobs
■ At the same time, late jobs should be done “ASAP”
■ Also, jobs should not start too early
■ How does the objective of minimising lateness improve as the 20% allowance is relaxed? What is the distribution of the start times of jobs (as a percentage of the actual milestone)?
■ How much better is a 2-crew setup? Does a 2-crew system clear the backlog at a sustainable rate?
PROBLEM SETUP.
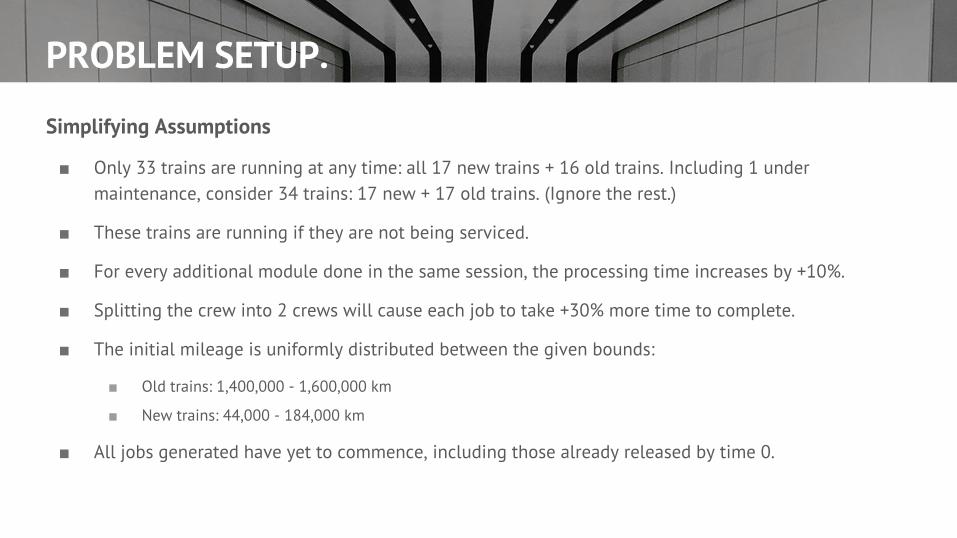
Simplifying Assumptions
■ Only 33 trains are running at any time: all 17 new trains + 16 old trains. Including 1 under maintenance, consider 34 trains: 17 new + 17 old trains. (Ignore the rest.)
■ These trains are running if they are not being serviced.
■ For every additional module done in the same session, the processing time increases by +10%.
■ Splitting the crew into 2 crews will cause each job to take +30% more time to complete.
■ The initial mileage is uniformly distributed between the given bounds:
■ Old trains: 1,400,000 - 1,600,000 km
■ New trains: 44,000 - 184,000 km
■ All jobs generated have yet to commence, including those already released by time 0.

PROBLEM SETUP.MODULE CALENDAR SERVICE EVENTS TRAIN FORECASTS JOB LIST
Module Days 300 320 340 360 380 400 420 440 460 480 500 520 540 560 580 600 620 640 660 680 700 720 740 760 780 800 820 840 860
300 15 1 1
360 15 1 1
480 15 1
600 15 1
720 15 1
800 15 1
900 15
960 15
1200 15
1440 15
No. of Modules 1 0 0 1 0 0 0 0 0 1 0 0 0 0 0 2 0 0 0 0 0 2 0 0 0 1 0 0 0
Processing Time 15 0 0 15 0 0 0 0 0 15 0 0 0 0 0 17 0 0 0 0 0 17 0 0 0 15 0 0 0
360 15 1 1
480 15 1
500 15 1
600 15 1
720 15 1
800 15 1
840 15 1
960 15
1000 15
1200 15
1800 15
No. of Modules 0 0 0 1 0 0 0 0 0 1 1 0 0 0 0 1 0 0 0 0 0 2 0 0 0 1 0 1 0
Processing Time 0 0 0 15 0 0 0 0 0 15 15 0 0 0 0 15 0 0 0 0 0 17 0 0 0 15 0 15 0
OLD
FLE
ETN
EW F
LEET

PROBLEM SETUP.MODULE CALENDAR SERVICE EVENTS TRAIN FORECASTS JOB LIST
Module Days 3040 3060 3080 3100 3120 3140 3160 3180 3200 3220 3240 3260 3280 3300 3320 3340 3360 3380 3400 3420 3440 3460 3480 3500 3520 3540 3560 3580 3600
300 15 1 1
360 15 1 1
480 15 1
600 15 1
720 15 1
800 15 1
900 15 1
960 15 1
1200 15
1440 15
No. of Modules 0 0 0 0 0 0 0 0 1 0 1 0 0 1 0 0 1 0 0 0 0 0 0 0 0 0 0 0 6
Processing Time 0 0 0 0 0 0 0 0 15 0 15 0 0 15 0 0 15 0 0 0 0 0 0 0 0 0 0 0 23
360 15 1 1
480 15 1
500 15 1
600 15 1
720 15 1
800 15 1
840 15 1
960 15
1000 15
1200 15 1
1800 15 1
No. of Modules 0 0 0 0 0 0 0 0 1 0 1 0 0 0 0 0 2 0 0 0 0 0 0 1 0 0 0 0 5
Processing Time 0 0 0 0 0 0 0 0 15 0 15 0 0 0 0 0 17 0 0 0 0 0 0 15 0 0 0 0 21
OLD
FLE
ETN
EW F
LEET

PROBLEM SETUP.MODULE CALENDAR SERVICE EVENTS TRAIN FORECASTS JOB LIST
At Mileage 360 480 500 600 720 800 840 960 1000 1080 1200 1440 1500 1600 1680 1800 1920 2000 2160 2400 2500 2520 2880 3000 3200 3240 3360 3500 3600
No. of Modules 1 1 1 1 2 1 1 2 2 1 2 3 1 1 1 3 2 2 2 4 1 2 4 3 1 1 2 1 5
Processing Time 15 15 15 15 17 15 15 17 17 15 17 18 15 15 15 18 17 17 17 20 15 17 20 18 15 15 17 15 21
At Mileage 300 360 480 600 720 800 900 960 1080 1200 1440 1500 1600 1800 1920 2100 2160 2400 2520 2700 2880 3000 3200 3240 3300 3360 3600
No. of Modules 1 1 1 2 2 1 2 2 1 3 4 1 1 4 2 1 2 5 1 2 5 2 1 1 1 1 6
Processing Time 15 15 15 17 17 15 17 17 15 18 20 15 15 20 17 15 17 21 15 17 21 17 15 15 15 15 23
OLD FLEET
NEW FLEET
PROBLEM SETUP.MODULE CALENDAR SERVICE EVENTS TRAIN FORECASTS JOB LIST
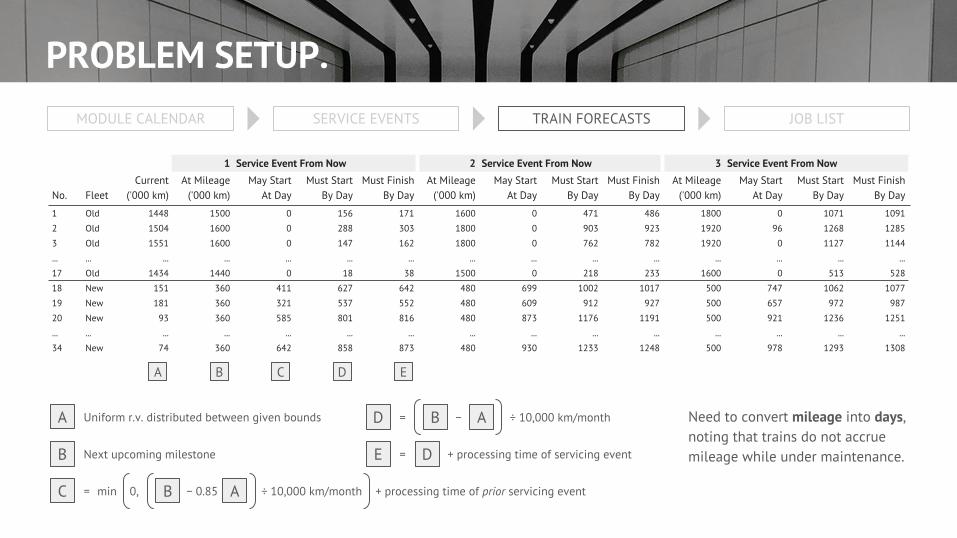
1 Service Event From Now 2 Service Event From Now 3 Service Event From Now
No. FleetCurrent
('000 km)At Mileage
('000 km)May Start
At DayMust Start
By DayMust Finish
By DayAt Mileage
('000 km)May Start
At DayMust Start
By DayMust Finish
By DayAt Mileage
('000 km)May Start
At DayMust Start
By DayMust Finish
By Day
1 Old 1448 1500 0 156 171 1600 0 471 486 1800 0 1071 1091
2 Old 1504 1600 0 288 303 1800 0 903 923 1920 96 1268 1285
3 Old 1551 1600 0 147 162 1800 0 762 782 1920 0 1127 1144
... ... ... ... ... ... ... ... ... ... ... ... ... ... ...
17 Old 1434 1440 0 18 38 1500 0 218 233 1600 0 513 528
18 New 151 360 411 627 642 480 699 1002 1017 500 747 1062 1077
19 New 181 360 321 537 552 480 609 912 927 500 657 972 987
20 New 93 360 585 801 816 480 873 1176 1191 500 921 1236 1251
... ... ... ... ... ... ... ... ... ... ... ... ... ... ...
34 New 74 360 642 858 873 480 930 1233 1248 500 978 1293 1308
A Uniform r.v. distributed between given bounds
B Next upcoming milestone
D = B A− ÷ 10,000 km/month
E = D + processing time of servicing event
C = B A− 0.850,min ÷ 10,000 km/month + processing time of prior servicing event
A B C D E
Need to convert mileage into days, noting that trains do not accrue mileage while under maintenance.

PROBLEM SETUP.MODULE CALENDAR SERVICE EVENTS TRAIN FORECASTS JOB LIST
1 Service Event 2 Service Event 10 Service EventFleet Current Job rj pj dj Job rj pj dj Job rj pj dj
O1 Old 1448 O1-1 0 15 171 O1-2 0 15 486 ... O1-10 2568 21 4334
O2 Old 1504 O2-1 0 15 303 O2-2 0 20 923 ... O2-10 2688 17 4526
O3 Old 1551 O3-1 0 15 162 O3-2 0 20 782 ... O3-10 2547 17 4385
O4 Old 1434 O4-1 0 20 38 O4-2 0 15 233 ... O4-10 2178 17 3830
O5 Old 1487 O5-1 0 15 54 O5-2 0 15 369 ... O5-10 2451 21 4217
O6 Old 1434 O6-1 0 20 38 O6-2 0 15 233 ... O6-10 2178 17 3830
O7 Old 1439 O7-1 0 20 23 O7-2 0 15 218 ... O7-10 2163 17 3815
O8 Old 1421 O8-1 0 20 77 O8-2 0 15 272 ... O8-10 2217 17 3869
O9 Old 1465 O9-1 0 15 120 O9-2 0 15 435 ... O9-10 2517 21 4283
O10 Old 1576 O10-1 0 15 87 O10-2 0 20 707 ... O10-10 2472 17 4310
... ... ... ... ... ... ... ... ... ... ... ... ... ... ... ...
N17 New 74 N17-1 642 15 873 N17-2 930 15 1248 ... N17-10 2370 15 3050
10 events× 34 trains
= 340 jobs
Forecasting 10 service events into the future, we have...

Objective Functions
■ Number of tardy jobs
■ Sum of tardiness
■ Maximum lateness
However, these problems are generally NP-hard, but some heuristics exist:
■ : Hochbaum & Shamir (1990)
■ : Bansal et. al. (2007)
■ : Branch-and-bound
METHODOLOGY.

Might there be an easier way?
■ ERD/EDD could work: we have a “special” profile of jobs.
■ Release and due dates are closely correlated since they are functionally dependent.
■ Processing times are roughly the same.
■ Intuition:
■ Each servicing event must inevitably be performed (no job can be skipped).
■ But even if they are performed late, they cannot be too late.
METHODOLOGY.
Old Trains New Trains

Choosing between ERD and EDD
■ However, ERD ≠ EDD in our case.
■ Function of due dates over release dates is not strictly nondecreasing.
■ Thus ordering by (ERD, EDD) is not identical to ordering by (EDD, ERD).
■ Both are intuitively reasonable and computationally quick.
■ Performance depends on metric of interest.
■ We tested both empirically.
METHODOLOGY.
ERD = EDD
JOBS
TIME
rj dj
JOBS
TIME
ERD ≠ EDDrj dj
ERD, EDD: (1, 2, 3, 4)
ERD: (2, 1, 3, 4)EDD: (1, 3, 2, 4)
FINDINGS.
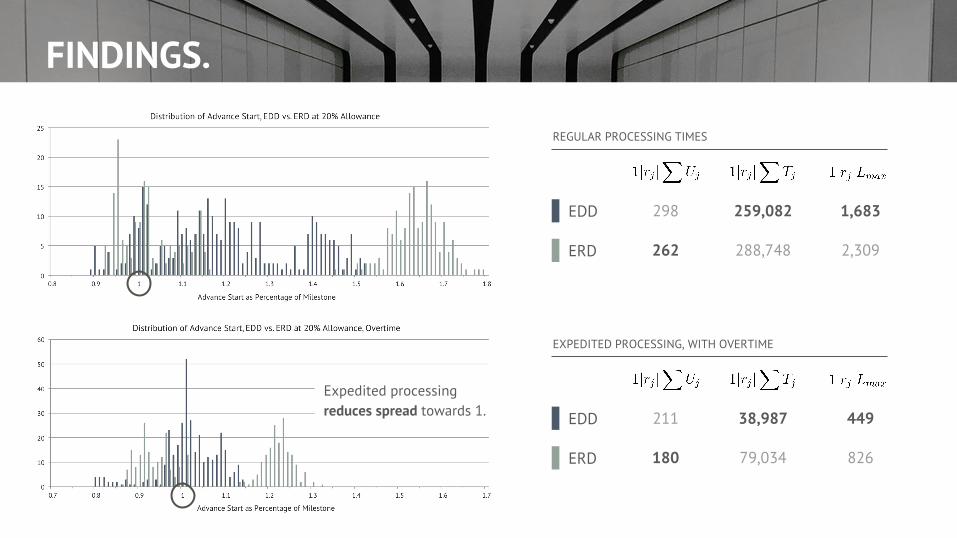
298 259,082 1,683
262 288,748 2,309ERD
EDD
REGULAR PROCESSING TIMES
211 38,987 449
180 79,034 826ERD
EDD
EXPEDITED PROCESSING, WITH OVERTIME
Expedited processing reduces spread towards 1.
FINDINGS.
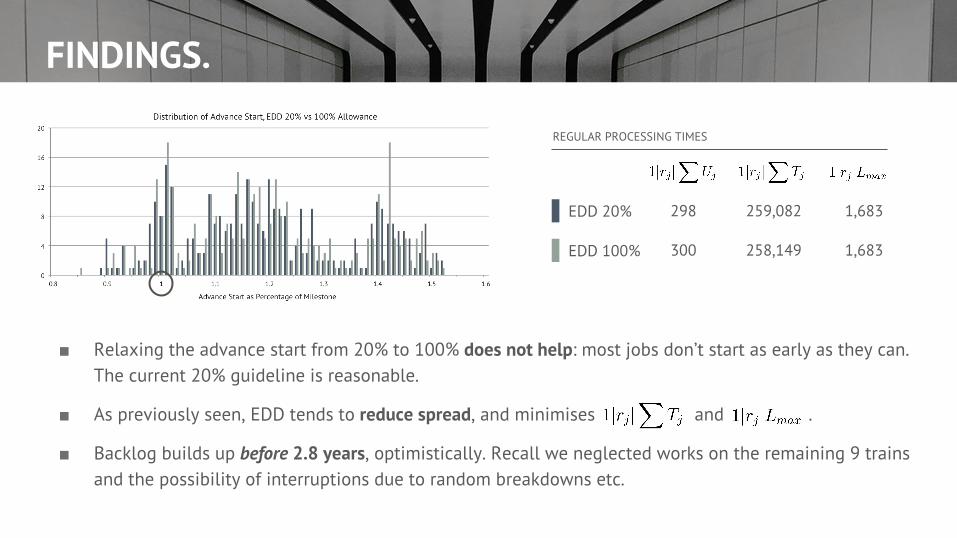
298 259,082 1,683
300 258,149 1,683EDD 100%
EDD 20%
REGULAR PROCESSING TIMES
■ Relaxing the advance start from 20% to 100% does not help: most jobs don’t start as early as they can. The current 20% guideline is reasonable.
■ As previously seen, EDD tends to reduce spread, and minimises and .
■ Backlog builds up before 2.8 years, optimistically. Recall we neglected works on the remaining 9 trains and the possibility of interruptions due to random breakdowns etc.

FINDINGS.
298 259,082 1,683
262 288,748 2,309ERD
EDD
1-CREW, REGULAR PROCESSING
133 10,859 212
177 43,780 498ERD
EDD
2-CREW, REGULAR PROCESSING2-crew setup greatly reduces spread towards 1. Yet no job commences before 80% of its milestone.
EDD outperformed across all 3 metrics.

Cost analysis
■ To minimise cost (within our objective of meeting deadlines), it makes sense to select only some to expedite (through paying a higher overtime rate for technicians).
■ Also consider the most cost-effective date to establish the second crew to relieve overtime of first crew.
Explore other approaches: time-based decomposition techniques
■ This involves:
1. Partitioning the problem into subproblems based on its underlying categories of patterns (e.g. similar processing time and release date).
2. Solving each subproblem individually.3. Performing a post-processing procedure, where the last couple of jobs of one job set are combined with the first
couple of jobs of the next job set. This new set of jobs is then re-optimized.
FUTURE WORK.