Traffic - Virginia Department of Transportation · Traffic Traffic Engineering Division ......
118
Analysis Traffic Traffic Engineering Division August 2013 Traffic Operations Analysis Tool Guidebook Version 1.1
Transcript of Traffic - Virginia Department of Transportation · Traffic Traffic Engineering Division ......
Analysis
Traffic
Traffic Engineering Division
August 2013
Traffic Operations Analysis Tool GuidebookVersion 1.1


Traffic Operations Analysis Tool Guidebook
Version 1.1
Copyright 2013 by the Virginia Department of Transportation
All rights reserved
VDOT Traffic Engineering Division
August 2013

Notice and Disclaimer
This document is disseminated by the Virginia Department of Transportation (VDOT) for
informational purposes only. No changes or revisions may be made to the information presented in
this document without the express consent of VDOT.
The recommendations in this guidebook are based on VDOT’s experiences, best practices and
engineering preferences. VDOT assumes no liability for the use of the information contained in this
document nor endorses any products or manufacturers referenced in this document. Trademarks or
manufacturers’ names are used solely for reference purposes.
Copyright
The contents of all material available in this guidebook and its online version are copyrighted by
VDOT unless otherwise indicated. Copyright is not claimed as to any part of an original work prepared
by a US or state government officer or employee as part of that person's official duties or any
information extracted from materials disseminated by a private manufacturer. All rights are reserved
by VDOT, and content may not be reproduced, downloaded, disseminated, published, or transferred
in any form or by any means, except with the prior written permission of VDOT, or as indicated
below. Copies for personal or academic use may be downloaded or printed, consistent with the
mission and purpose of VDOT (as codified in its governing documents). However, no part of such
content may be otherwise or subsequently reproduced, downloaded, disseminated, published, or
transferred, in any form or by any means, except with the prior written permission of and with
express attribution to VDOT. Copyright infringement is a violation of federal law subject to criminal
and civil penalties.

Table of Contents
Traffic Operations Analysis Tool Guidebook Version 1.1
Page | i
Table of Contents
1 INTRODUCTION ...............................................................................................................1
1.1 BACKGROUND ......................................................................................................................... 1
1.2 PURPOSE OF THIS GUIDEBOOK .................................................................................................... 1
1.3 STAKEHOLDER INVOLVEMENT ..................................................................................................... 4 5
1.4 APPLICATIONS OF THE GUIDEBOOK.............................................................................................. 5
2 COMMON ANALYTICAL SCENARIOS ..................................................................................7
2.1 INTERSECTION ANALYSES ........................................................................................................... 7
2.2 HIGHWAY/FREEWAY/INTERCHANGE ANALYSES ............................................................................. 8
2.3 MULTIMODAL AND MISCELLANEOUS ANALYSES ............................................................................ 9 10
2.4 STUDY AREA CLASSIFICATIONS .................................................................................................... 9
2.5 UNDERSATURATED AND OVERSATURATED CONDITIONS ................................................................ 11
3 COMMON ANALYTICAL TOOLS ....................................................................................... 13
3.1 QUICKZONE ........................................................................................................................... 13
3.2 HIGHWAY CAPACITY SOFTWARE (HCS) ...................................................................................... 13 15
3.3 SYNCHRO .............................................................................................................................. 13
3.4 SIMTRAFFIC .......................................................................................................................... 14
3.5 SIDRA INTERSECTION ............................................................................................................. 14
3.6 CORSIM .............................................................................................................................. 15
3.7 VISSIM ................................................................................................................................ 15 20
4 COMMON ANALYTICAL MEASURES OF EFFECTIVENESS (MOES) ....................................... 17
4.1 COMMON MEASURES OF EFFECTIVENESS (MOES) ...................................................................... 17
5 MICROSIMULATION ....................................................................................................... 21
5.1 MICROSIMULATION APPLICABILITY AND CALIBRATION .................................................................. 21
5.2 SIMULATION SAMPLE SIZE ....................................................................................................... 22 25
6 STANDARD REQUIREMENTS FOR ANALYSES .................................................................... 25
6.1 GEOMETRIC DATA .................................................................................................................. 25
6.2 TRAFFIC COUNT DATA ............................................................................................................. 26
6.3 SIGNAL OPERATIONS DATA ...................................................................................................... 33
6.4 CALIBRATION DATA ................................................................................................................ 33 30
6.5 ROADWAY DESIGN IMPACTS .................................................................................................... 35

Table of Contents
Traffic Operations Analysis Tool Guidebook Version 1.1
Page | ii
Table of Contents (cont.)
7 STANDARD ASSUMPTIONS FOR TOOLS ........................................................................... 38
7.1 HCS 2010 ............................................................................................................................ 38 35
7.2 SYNCHRO .............................................................................................................................. 44
7.3 SIDRA INTERSECTION ............................................................................................................. 48
7.4 CORSIM .............................................................................................................................. 51
7.5 VISSIM ................................................................................................................................ 55
7.6 SIMTRAFFIC .......................................................................................................................... 59 40
8 TRAFFIC OPERATIONS ANALYSIS TOOL SELECTION .......................................................... 62
8.1 SOFTWARE SELECTION TOOL .................................................................................................... 62
8.2 SOFTWARE SELECTION TOOL INPUT FORM MACRO ...................................................................... 62
8.3 TOOL DETERMINATION MACRO, SET PRINT AREA, AND CLEAR TABLE MACROS ................................ 63
8.4 SOFTWARE SELECTION TOOL MAINTENANCE .............................................................................. 68 45
8.5 ROUNDABOUT ANALYSIS METHODOLOGY .................................................................................. 68
9 OUTPUT ......................................................................................................................... 70
9.1 OUTPUT FORMATS ................................................................................................................. 70
9.2 HCS OUTPUT FORMATS .......................................................................................................... 71
9.3 SYNCHRO/SIMTRAFFIC OUTPUT FORMATS ................................................................................. 73 50
9.4 SIDRA INTERSECTION OUTPUT FORMATS .................................................................................. 76
9.5 CORSIM AND VISSIM OUTPUT FORMATS ................................................................................ 76
Technical Appendix
A. Additional Resources Reviewed
B. Tool Selection Matrix 55
C. Traffic Simulation Calibration Factors
D. Traffic Simulation Output Level of Service Conversion
Table of Contents
Traffic Operations Analysis Tool Guidebook Version 1.1
Page | iii
Table of Figures
Figure 1 – Example of Peak Hour Spreading .................................................................................. 12 60
Figure 2 – Time/Cost Comparison for Deterministic and Microsimulation Tools ......................... 21
Figure 3 – Screen Shot of Failing Sample Size Determination Tool ............................................... 24
Figure 4 – Screen Shot of Passing Sample Size Determination Tool ............................................. 24
Figure 5 – FHWA Vehicle Classification .......................................................................................... 31
Figure 6 – Effects of an Unbalanced Network on Microsimulation ............................................... 32 65
Figure 7 – Bus Blockages to Include in Analysis ............................................................................. 48
Figure 8 – SST Input Form .............................................................................................................. 64
Figure 9 – SST Selection Validation Check ..................................................................................... 65
Figure 10 – SST Location Type Validation Check ............................................................................ 66
Figure 11 – SST Spreadsheet After Exporting Scenarios ................................................................ 67 70
Figure 12 – Output from Executing the Tool Determination Macro ............................................. 68
Figure 13 – HCS Depictive Figure - Freeways ................................................................................. 72
Figure 14 – Synchro/SimTraffic/CORSIM/VISSIM LOS Depictive Figure - Intersections ................ 74
Figure 15 – Synchro/SimTraffic/CORSIM/VISSIM Queue Depictive Figure - Intersections ........... 75
Figure 16 – SIDRA Intersection Depictive Output Figure ............................................................... 78 75
Figure 17 – SIDRA Intersection LOS Depictive Summary Figure .................................................... 79
Figure 18 – CORSIM Lane Schematic Figure .................................................................................. 82
Figure 19 – VISSIM Lane Schematic Figure .................................................................................... 83
Table of Tables
Table 1 – Freeway Facility Level of Service in Terms of Density .................................................... 18 80
Table 2a – Standard Geometric Parameters .................................................................................. 27
Table 2b – Standard Geometric Parameters ................................................................................. 28
Table 3 – Standard Traffic Data Collection Parameters ................................................................. 29
Table 4 – Standard Calibration Data Parameters .......................................................................... 34
Table 5a – HCS 2010 Standard Parameters ................................................................................... 39 85
Table 5b – HCS 2010 Standard Parameters ................................................................................... 40
Table 6 – Synchro Standard Parameters ........................................................................................ 45
Table 7 – SIDRA Intersection Standard Parameters....................................................................... 49
Table 8 – CORSIM Standard Parameters........................................................................................ 52
Table 9 – VISSIM Standard Parameters ......................................................................................... 56 90
Table 10 – SimTraffic Standard Assumptions ................................................................................ 60
Table 11 – HCS Tabular Output Format ......................................................................................... 73
Table 12 – Level of Service Table for Synchro/SimTraffic Output ................................................. 77
Table 13 – Queue Table for Synchro/SimTraffic Output ............................................................... 77
Table 14 – SIDRA Intersection Movement Summary Table ........................................................... 80 95
Table 15 – CORSIM/VISSIM Output Results Table ......................................................................... 81

Table of Contents
Traffic Operations Analysis Tool Guidebook Version 1.1
Page | iv
This page is intentionally left blank.

Glossary of Terms
Traffic Operations Analysis Tool Guidebook Version 1.1
Page | v
Glossary of Terms
Access management: The systematic control of the location, spacing, design, and operation of 100
entrances, median openings/crossovers, traffic signals, and interchanges for the purpose of providing vehicular access to land development in a manner that preserves the safety and efficiency of the transportation system.
Area: An interconnected set of transportation facilities serving movements within a specified geographic space, as well as movements to and from adjoining areas. 105
Average travel speed: The length of highway segment divided by the average travel time of all vehicles traversing this segment, including all stopped delay times (expressed in mph). This speed is equivalent to space mean speed.
Back of queue: The maximum backward extent of queued vehicles during a typical cycle measured from the stop bar to the last queued vehicle (expressed in feet). 110
Calibration: Process where the modeler modifies the parameters that cause the model to best reproduce field-measured and observed local traffic conditions.
Control delay: Delay associated with vehicles slowing in advance of an intersection, the time spent on an intersection approach, the time spent as vehicles advance in a queue, and the time needed for vehicles to accelerate to their desired speed (expressed in seconds per vehicle). 115
Corridor: A set of parallel transportation facilities, such as a freeway and an arterial street.
Cycle: A complete sequence of signal indications.
Cycle length: The time required for one complete sequence of signal phases such that all of the movements at the intersection have been served at least once (expressed in seconds).
Delay: Additional travel time experienced by a driver, passenger, bicyclist, or pedestrian beyond that 120
required to travel at the desired speed (expressed in seconds).
Density: The number of vehicles occupying a given length of lane at a particular instant (expressed in passenger cars or vehicles per mile per lane).
Deterministic traffic tools: Traffic analysis tools that assumes that there is no variability in the driver-vehicle characteristics (e.g., HCS 2010). 125
Facility: A length of roadway, bike path, or pedestrian walkway composed of a connected series of points and segments.
Flow rate: The equivalent hourly rate at which vehicles or other roadway users pass over a given point or section of a lane or roadway during a given time interval of less than one hour, usually 15 minutes. 130
Free-flow speed: The prevailing speed on highways at flow rates between 0 and 1,000 passenger cars per hour per lane (expressed in mph).
LOS: Level of service. Stratification of a performance measure(s) that represent quality of service, measured in an A-F scale with LOS A representing the best.
135
Glossary of Terms
Traffic Operations Analysis Tool Guidebook Version 1.1
Page | vi
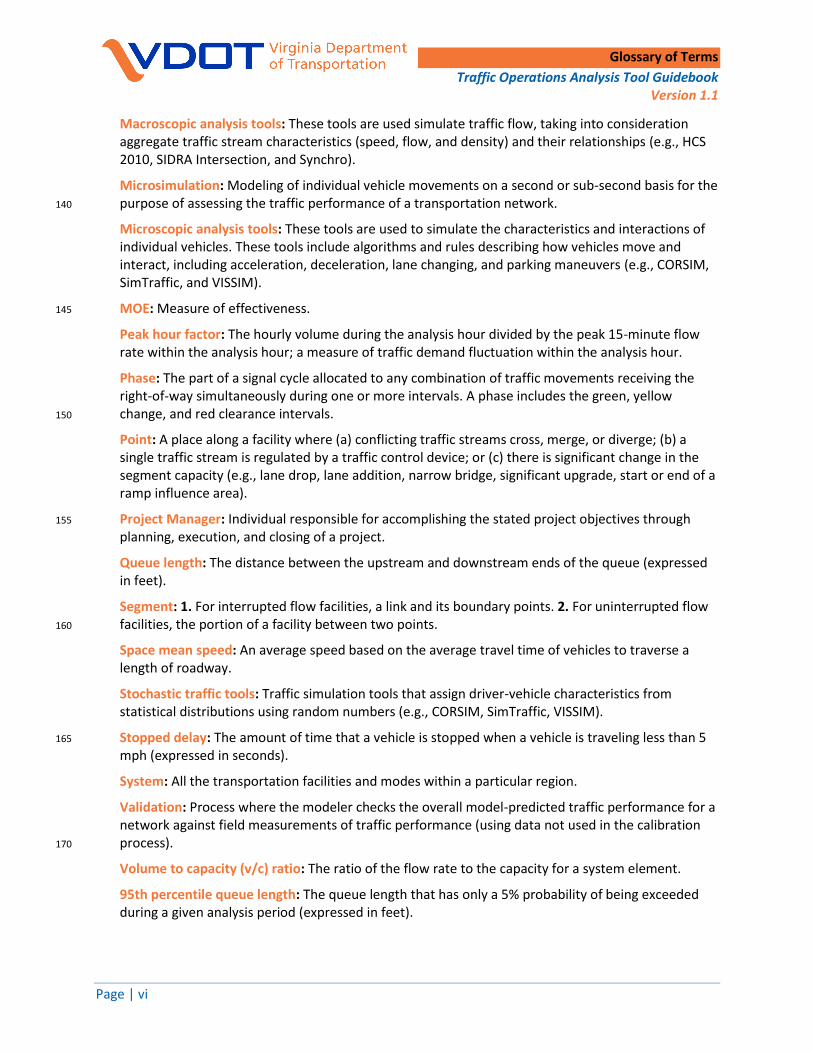
Macroscopic analysis tools: These tools are used simulate traffic flow, taking into consideration aggregate traffic stream characteristics (speed, flow, and density) and their relationships (e.g., HCS 2010, SIDRA Intersection, and Synchro).
Microsimulation: Modeling of individual vehicle movements on a second or sub-second basis for the purpose of assessing the traffic performance of a transportation network. 140
Microscopic analysis tools: These tools are used to simulate the characteristics and interactions of individual vehicles. These tools include algorithms and rules describing how vehicles move and interact, including acceleration, deceleration, lane changing, and parking maneuvers (e.g., CORSIM, SimTraffic, and VISSIM).
MOE: Measure of effectiveness. 145
Peak hour factor: The hourly volume during the analysis hour divided by the peak 15-minute flow rate within the analysis hour; a measure of traffic demand fluctuation within the analysis hour.
Phase: The part of a signal cycle allocated to any combination of traffic movements receiving the right-of-way simultaneously during one or more intervals. A phase includes the green, yellow change, and red clearance intervals. 150
Point: A place along a facility where (a) conflicting traffic streams cross, merge, or diverge; (b) a single traffic stream is regulated by a traffic control device; or (c) there is significant change in the segment capacity (e.g., lane drop, lane addition, narrow bridge, significant upgrade, start or end of a ramp influence area).
Project Manager: Individual responsible for accomplishing the stated project objectives through 155
planning, execution, and closing of a project.
Queue length: The distance between the upstream and downstream ends of the queue (expressed in feet).
Segment: 1. For interrupted flow facilities, a link and its boundary points. 2. For uninterrupted flow facilities, the portion of a facility between two points. 160
Space mean speed: An average speed based on the average travel time of vehicles to traverse a length of roadway.
Stochastic traffic tools: Traffic simulation tools that assign driver-vehicle characteristics from statistical distributions using random numbers (e.g., CORSIM, SimTraffic, VISSIM).
Stopped delay: The amount of time that a vehicle is stopped when a vehicle is traveling less than 5 165
mph (expressed in seconds).
System: All the transportation facilities and modes within a particular region.
Validation: Process where the modeler checks the overall model-predicted traffic performance for a network against field measurements of traffic performance (using data not used in the calibration process). 170
Volume to capacity (v/c) ratio: The ratio of the flow rate to the capacity for a system element.
95th percentile queue length: The queue length that has only a 5% probability of being exceeded during a given analysis period (expressed in feet).
Chapter 1 – Introduction
Traffic Operations Analysis Tool Guidebook Version 1.1
Page | 1
1 Introduction 175
1.1 Background
Traffic analysis tools help traffic engineers and transportation planners to analyze the
transportation network for both existing conditions and future conditions. As they are tools,
they are part of the decision making process that leads to transportation solutions. Traffic
analysis tools alone are not the sole 180
components in the decision making
process, but they play an integral role in
helping to understand and evaluate
alternatives. As the complexity of
potential improvement concepts 185
increase, it is important for traffic
engineers and transportation planners to
choose the most appropriate traffic
analysis tool for each condition.
VDOT has been using computer-based traffic analysis tools for over 30 years. These traffic 190
analysis tools have become progressively more complex and diverse to more accurately
document the impact of traffic on the transportation network. Over the past 15 years,
microscopic analysis tools such as CORSIM, VISSIM, and SimTraffic have increasingly been used
to analyze, simulate, and visualize existing and future transportation operations within complex
networks. Additionally, macroscopic analysis tools such as Highway Capacity Software (HCS), 195
Synchro, and SIDRA Intersection continue to be upgraded and are used to analyze a wide variety
of transportation projects.
1.2 Purpose of this Guidebook
There are several types of traffic analysis tools designed to fit projects of different sizes, scopes,
and objectives. Depending on the project type, there may be more than one suitable traffic 200
analysis tool, or the project may require more than
one traffic analysis tool to be used simultaneously.
Based on these reasons, VDOT identified the need to
develop this guidance document to help project
managers select the most appropriate traffic analysis 205
tool(s) during the project scoping phase, understand
the standard assumptions related to each traffic
analysis tool, and produce consistent output from
these traffic analysis tools for transportation
analyses. 210
As the complexity of potential
improvement concepts continue to
increase, it is important for traffic
engineers and transportation
planners to choose the most
appropriate traffic analysis tool(s).
This guidebook is
intended to supplement
more general information
provided at the federal
level regarding the
selection of traffic
analysis tools.

Chapter 1 – Introduction
Traffic Operations Analysis Tool Guidebook Version 1.1
Page | 2
The need for this guidebook was based on the premise that project managers will benefit from
consistent guidance for scoping projects and reviewing results. This document is intended to
supplement more general information provided at the federal level regarding the selection of
traffic analysis tools.
This document is intended to be used by VDOT and consultant project managers on a wide 215
variety of traffic analysis projects, and is intended to guide project managers on how best to
evaluate various design, traffic operations, and planning analyses. Some of these traffic analysis
projects may be part of the Scoping Phase of the VDOT Project Development Process and others
will not. To most effectively use this guidebook, project managers should consult with technical
specialists (traffic engineers, transportation planners, and/or traffic simulation modelers) as 220
needed to assist them with the selection of the most appropriate traffic analysis tool(s).
Primary reasons for developing this guidebook:
1. To identify the acceptable range of conditions under which traffic analysis tool(s) should
be used for typical traffic, geometric, and operational conditions to all VDOT divisions
conducting analyses, and their consultants; 225
2. To provide a standard set of assumptions to be used for each traffic analysis tool; and
3. To provide standard output summary templates and requirements.
There is an unlimited array of traffic and geometric conditions that could be addressed in this
guidebook. As it is impractical to include all possible combinations of traffic and geometric
conditions, this guidebook will describe the selection of traffic analysis tools for common 230
transportation analysis scenarios to help project managers select the most appropriate traffic
analysis tool, whether it is a deterministic tool such as the Highway Capacity Software or a traffic
simulation tool such as VISSIM or CORSIM. As conditions are encountered that vary from these
common scenarios, revised supplemental guidelines may be developed on a case-by-case basis
as the guidebook evolves over the next several years. 235
This guidebook provides guidance primarily for
operational analyses for studies that focus on both
short-term and long-term conditions. If the purpose of
the study is to identify key design elements based on
operations, then the study is an operational analysis. 240
The following characteristics summarize study types
that are covered in this guidebook:
Study Types Traffic Operations Analyses
Traffic signal timing 245
Freeway weaving and ramp analyses Congestion mitigation studies
Access Management Studies Traffic Impact Analysis (TIA) Studies
This guidebook provides
guidance primarily for
operational analyses for
studies that focus on both
short-term and long-term
conditions.

Chapter 1 – Introduction
Traffic Operations Analysis Tool Guidebook Version 1.1
Page | 3
Design-Related Analyses 250
Interchange justification/modification studies Roadway design analyses (turn-bay length, number of lanes, etc.) Maintenance of traffic analyses (work zone analysis)
Measures of Effectiveness (MOE), Outputs, and Results Operations/design levels of service 255
Detailed queuing results Control delay Travel time Density Travel speed 260
Number of stops
The following characteristics summarize study types that are not covered in the guidebook:
Study Types Long-Range Planning Studies
First- and second-tier NEPA studies 265
Studies requiring the use of long-range planning models to determine general traffic volume based improvements (e.g., “2,000 vehicles per hour (vph) requires 2 travel lanes”)
Measures of Effectiveness (MOE), Outputs, and Results General recommendations based solely on volumes 270
Recommendations without definitive dimensions or those not supported by formal operational/queuing analyses
Sketch planning
The Project Manager has the authority to review
the recommendations in this guidebook and make 275
the determination if any deviations are required,
except as outlined in VDOT policy. If the project
manager decides to use an alternate traffic
analysis tool, then technical documentation
justifying this decision must be included in the 280
project file. Factors such as the required MOE(s);
functionality of the traffic analysis tools; and
available budget, schedule, and resources must be
weighed to determine the most appropriate traffic
analysis tool to use. 285
It is important that appropriate study documentation be submitted with the report to support the traffic analyses. The traffic analysis results shall be submitted in electronic format, so that the project manager, and/or their designee, can review the results with the appropriate traffic analysis tool. This documentation should include a summary of the following information:
290
The Project Manager has the
authority to review the
recommendations in this
guidebook and make the
determination if any
deviations are required,
except as outlined in VDOT
policy.

Chapter 1 – Introduction
Traffic Operations Analysis Tool Guidebook Version 1.1
Page | 4
Description of the study area
Data collection results – traffic counts, origin-destination information as appropriate, etc.
Simulation model documentation – link-node diagram, lane schematic diagram, etc. (if applicable) 295
Summary of field observations and geometric inventory
Measurement of back of queue to be used for estimating traffic demand
Description of methodology for model calibration (if applicable)
Model calibration results – travel time runs, volume throughput, etc. (if applicable)
Deviation from traffic analysis guidelines presented herein (if applicable) 300
MOE results (using templates provided in this guidebook)
Sensitivity testing results (if applicable)
Thorough summary of assumptions used in the analysis – how peak hour was determined, how traffic growth rate was determined, method used to balance peak hour traffic volumes, etc. 305
Quality control results
A more detailed description of the documentation requirements will be identified in a later chapter of this guidebook.
1.3 Stakeholder Involvement
A technical advisory committee (TAC) was created to provide guidance to the consultant team 310
throughout the development of this manual. The TAC consisted of a variety of traffic engineers,
transportation planners and researchers from VDOT and FHWA. This committee was responsible
for discussing and vetting key issues throughout the process of developing this guidebook. These
members included:
1.3.1 Public Sector 315
Mena Lockwood – Central Office Traffic Engineering Division (VDOT Project Manager)
Sanhita Lahiri – Central Office Traffic Engineering Division
Mark Richards – Central Office Traffic Engineering Division
Ritchie Robbins – Central Office Traffic Engineering Division 320
Bill Guiher – Central Office Transportation and Mobility Planning Division
Terry Short, Jr. – Staunton District Transportation Planning
Mike McPherson – Southwest Region Operations
Cheryl Reints – Eastern Region Operations
Jung-Taek Lee – Northern Region Operations 325
Noah Goodall – Virginia Center for Transportation Innovation and Research
John Mazur – Federal Highway Administration – Virginia Division

Chapter 1 – Introduction
Traffic Operations Analysis Tool Guidebook Version 1.1
Page | 5
1.3.2 Consultant Team
Timothy White – Kimley-Horn and Associates (Consultant Project Manager)
Ben Reim – Kimley-Horn and Associates 330
Michael Wobken – Kimley-Horn and Associates
Support from throughout Kimley-Horn and Associates for traffic analysis templates
1.4 Applications of the Guidebook
These guidelines establish consistency and uniformity of traffic analysis for VDOT. Not only will
the process of traffic analysis tool selection be more consistent, but the summary of the output 335
will also be much more consistent through the use of output templates provided.
By using the software selection tool that will accompany this guidebook and templates provided
in this guidebook, project managers will be able to select the most appropriate tool(s) for
analyzing and comparing transportation networks. The tool selection will be based on the goals,
objectives, and location-specific conditions at each study location. In many cases, there may be 340
multiple tools that could be chosen for a similar geometric condition (i.e., SIDRA Intersection or
VISSIM for roundabouts). In addition, there may be multiple tools needed to fully analyze areas
with dissimilar geometric conditions (i.e., using optimized signal timings from Synchro in a
VISSIM model that is used to analyze both arterial and interstate facilities). On the other hand, it
may be obvious that only one tool is needed (i.e., VISSIM for the analysis of transit conditions 345
and/or non-traditional geometry).
There are various reasons for selecting one traffic analysis tool over another aside from the
functionality of the tool. These reasons include the cost of the analysis, time to conduct the
analysis, data requirements, data availability, and training requirements for different tools.
This guidebook, however, does not specifically address other reasons for selecting one traffic 350
analysis tool over another, such as the cost to conduct the analysis, time to conduct the analysis,
and training requirements for different tools, to name a few. Pertaining to these issues, the
project manager must weigh feedback from subject matter experts to make an informed
decision.
As a result of the Traffic Operations Analysis Tool Guidebook, an automated tool in Microsoft 355
Excel was created to guide and assist traffic engineers and transportation planners with the
selection of the most appropriate traffic analysis tool(s). This tool takes into account the
congestion levels, the type of study to be conducted, and the required MOE to narrow down the
selection to the most appropriate tool or combination of tools.
This guidebook consists of the following chapters: 360
Chapter 1 – Introduction This chapter describes the history of the use of traffic analysis tools in Virginia. What is the purpose of this guidebook? How can the guidebook be applied?

Chapter 1 – Introduction
Traffic Operations Analysis Tool Guidebook Version 1.1
Page | 6
Chapter 2 – Common Analytical Scenarios This chapter describes the various types of networks that traffic engineers and 365
transportation planners analyze, including intersections, freeway segments, two-lane highways, and multi-modal facilities to name several.
Chapter 3 – Common Analytical Tools This chapter describes the various traffic analysis tools that are available, such as both macroscopic and microscopic tools. This guidebook focuses on the following 370
macroscopic and microscopic traffic analysis tools:
Quickzone - macroscopic HCS - macroscopic Synchro - macroscopic SIDRA Intersection - macroscopic 375
CORSIM - microscopic VISSIM - microscopic SimTraffic - microscopic
Chapter 4 – Common Analytical Measures of Effectiveness (MOEs) This chapter describes many of the MOEs used to interpret the impacts of traffic on the 380
roadway network. Some of these factors may include speed, delay, travel time, queue length, and throughput.
Chapter 5 – Microsimulation This chapter describes the applicability and calibration for microsimulation analyses. This chapter also addresses the methodology for selecting the appropriate number of 385
traffic simulation runs.
Chapter 6 – Standard Requirements for Analyses This chapter describes the standard requirements for traffic analyses conducted in Virginia. As an example, what is the acceptable age of traffic count data? This chapter also addresses how traffic analysis tools should be used to determine the impact of 390
design features, such as the length of turn lanes.
Chapter 7 – Standard Assumptions for Tools This chapter describes the typical assumptions applicable to various inputs for each traffic analysis tool. These assumptions are described in detail for each of the 6 traffic analysis tools within this chapter, with the exception of Quickzone. Although Quickzone 395
is considered an analysis tool, its application and inputs will not be discussed as part of this guidebook.
Chapter 8 – Traffic Operations Analysis Tool Selection This chapter describes how the traffic analysis tool selection matrix was converted to a software program to make the selection of traffic analysis tools easy for users. This 400
chapter also provides details on specific guidance for using this tool.
Chapter 9 – Output This chapter describes the requirements and templates that were created to provide consistency with the output summary from the various traffic analysis tools.

Chapter 2 – Common Analytical Scenarios
Traffic Operations Analysis Tool Guidebook Version 1.1
Page | 7
2 Common Analytical Scenarios 405
There are many analytical scenarios that may be evaluated on any given project. In many cases,
the use of multiple traffic analysis tools will be required to meet the project requirements. It is
important to understand the differences between the various analytical scenarios, so the
appropriate traffic analysis tool can be selected. The Traffic Operations Analysis Tool Guidebook
considers the following three major types of Analytical Scenarios: 410
1. Intersection Analyses,
2. Highway / Freeway / Interchange Analyses, and
3. Multimodal / Miscellaneous Analyses.
The proceeding sections of this chapter will describe each of these scenarios in more detail. This
chapter will also describe study area characteristics (e.g., points, segments, etc.) and the 415
definition of oversaturated and undersaturated conditions.
2.1 Intersection Analyses
Within the intersection analyses analytical scenario, there are five main intersection types
considered in this guidebook – signalized intersections, signalized intersection preemption
and/or transit priority, unsignalized intersections (All-Way Stop and Two-Way Stop), 420
roundabouts, and non-traditional intersections/interchanges. Descriptions of each category are
described below in more detail:
Signalized Intersection Operations: This type of analysis examines the functionality of an intersection controlled by a traffic signal in terms of specific MOEs, such as delay or queue. 425
Signalized Intersection Preemption and/or Transit Priority: This type of analysis examines the impacts of a preemption or priority event at a signalized intersection, with or without transit operations with specific MOEs such as delay or queue.
Unsignalized Intersection Operations: This type of analysis examines the functionality of an intersection not controlled by a traffic signal in terms of specific 430
MOEs such as delay or queue. An unsignalized intersection may either be all-way stops or two-way stops.
Roundabout Operations: This type of analysis examines the functionality of a roundabout in terms of specific MOEs including speed, delay, or queue.
Non-Traditional Intersection/Interchange Operations: This type of analysis 435
examines the functionality of non-traditional intersections/interchanges in terms of specific MOEs including speed, delay, or queue. Such examples include 5-legged intersections, diverging diamond interchanges (DDI), and Single Point Urban Interchanges (SPUI) to name a few. These analyses pertain to the intersection operations only for interchanges such as DDIs and SPUIs as opposed to the ramp 440
and ramp-freeway junction operations.

Chapter 2 – Common Analytical Scenarios
Traffic Operations Analysis Tool Guidebook Version 1.1
Page | 8
2.2 Highway/Freeway/Interchange Analyses
A highway/freeway/interchange network consists of several elements that can be analyzed.
These network elements are described in more detail below: 445
Freeway Segment Operations: In this type of analysis, freeway segments not influenced by merging, diverging, or weaving maneuvers are analyzed in terms of flow, speed, and density. Lane changing within a basic freeway segment should be attributed to passing operations only.
Merge/Diverge Operations: Merging and diverging freeway segments occur 450
primarily near or at interchanges in the presence of an on- and off-ramp. A merging analysis is considered when two or more streams of traffic combine to form a single stream of traffic, while a diverging analysis is considered when a single stream of traffic divides into two or more streams of traffic. This type of analysis examines the functionality of a merge or diverge area in terms of specific MOEs including speed, 455
flow, or density.
Weaving Segment Operations: Weaving sections are formed when traffic streams traveling in the same direction are forced to change lanes and cross paths over a significant length of freeway. This type of analysis examines the functionality of the weaving segment in terms of specific MOEs including speed, flow, or density. 460
Freeway High-Occupancy Vehicle (HOV), High Occupancy Toll (HOT), or Ramp Metering Operations: Freeway HOV lanes, HOT lanes, and ramp metering manage traffic demand by imposing travel restrictions. A freeway HOV lane is a freeway lane designated for a HOV, which typically is a vehicle with two or more occupants. HOT lanes require single-occupant vehicles to pay a toll that varies based on 465
demand/capacity. The tolls change throughout the day according to real-time traffic conditions, managing the extent of congestion. A ramp metering system restricts access to freeways by regulating traffic entering the network based on operational conditions along the freeway network. This type of analysis examines the functionality of HOV, HOT, or ramp metering in terms of specific MOEs including 470
speed, flow, or density.
Collector-Distributor Facility Operations: A collector-distributor facility (or “C-D Road”) is parallel to a freeway facility, and is intended to “collect” and “distribute” traffic to one or more interchanges, while also removing weaving movements from the mainline freeway. This type of analysis examines the functionality of the C-D 475
road in terms of specific MOEs including speed, flow, or density.
Multi-Lane Highway Operations: This type of analysis examines the functionality of a highway with at least two lanes of traffic in each direction. Unlike a freeway, a multi-lane highway is not a limited access facility, and most typically will have interruptions in flow due to signalized at-grade intersections and/or unsignalized 480
local roadways and site driveways. This type of analysis examines the functionality of the multi-lane highway in terms of specific MOEs including speed, flow, delay, or queue.
Chapter 2 – Common Analytical Scenarios
Traffic Operations Analysis Tool Guidebook Version 1.1
Page | 9
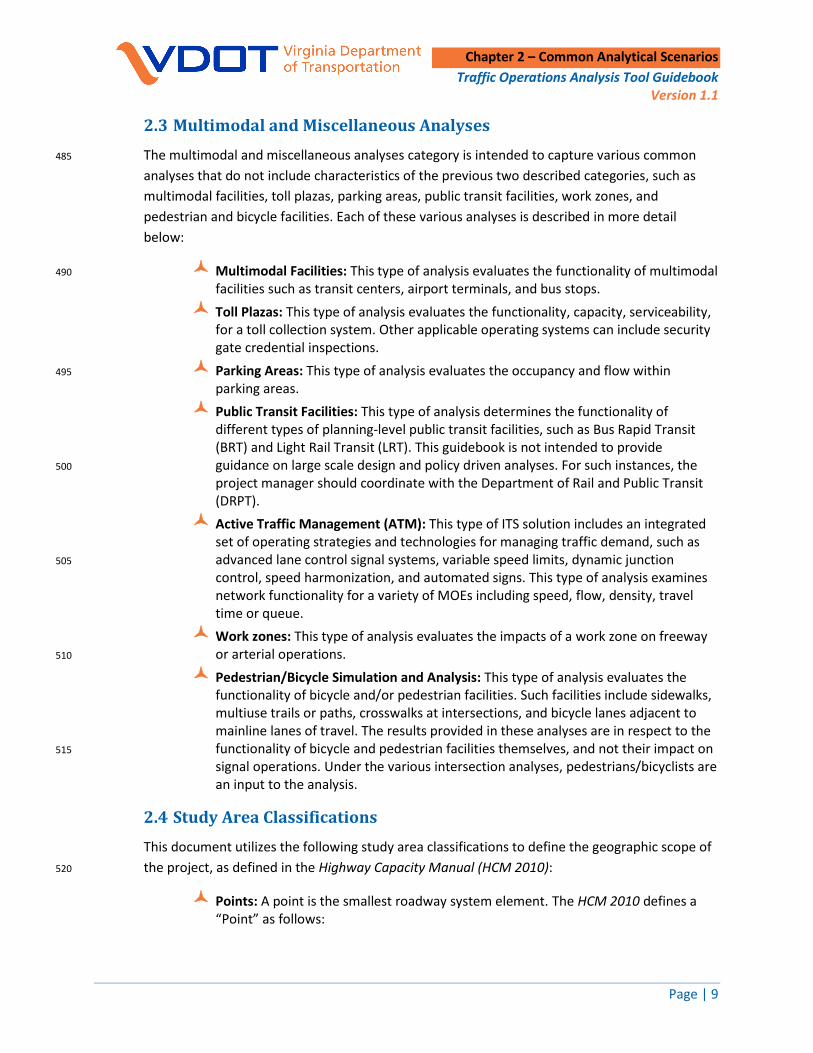
2.3 Multimodal and Miscellaneous Analyses
The multimodal and miscellaneous analyses category is intended to capture various common 485
analyses that do not include characteristics of the previous two described categories, such as
multimodal facilities, toll plazas, parking areas, public transit facilities, work zones, and
pedestrian and bicycle facilities. Each of these various analyses is described in more detail
below:
Multimodal Facilities: This type of analysis evaluates the functionality of multimodal 490
facilities such as transit centers, airport terminals, and bus stops.
Toll Plazas: This type of analysis evaluates the functionality, capacity, serviceability, for a toll collection system. Other applicable operating systems can include security gate credential inspections.
Parking Areas: This type of analysis evaluates the occupancy and flow within 495
parking areas.
Public Transit Facilities: This type of analysis determines the functionality of different types of planning-level public transit facilities, such as Bus Rapid Transit (BRT) and Light Rail Transit (LRT). This guidebook is not intended to provide guidance on large scale design and policy driven analyses. For such instances, the 500
project manager should coordinate with the Department of Rail and Public Transit (DRPT).
Active Traffic Management (ATM): This type of ITS solution includes an integrated set of operating strategies and technologies for managing traffic demand, such as advanced lane control signal systems, variable speed limits, dynamic junction 505
control, speed harmonization, and automated signs. This type of analysis examines network functionality for a variety of MOEs including speed, flow, density, travel time or queue.
Work zones: This type of analysis evaluates the impacts of a work zone on freeway or arterial operations. 510
Pedestrian/Bicycle Simulation and Analysis: This type of analysis evaluates the functionality of bicycle and/or pedestrian facilities. Such facilities include sidewalks, multiuse trails or paths, crosswalks at intersections, and bicycle lanes adjacent to mainline lanes of travel. The results provided in these analyses are in respect to the functionality of bicycle and pedestrian facilities themselves, and not their impact on 515
signal operations. Under the various intersection analyses, pedestrians/bicyclists are an input to the analysis.
2.4 Study Area Classifications
This document utilizes the following study area classifications to define the geographic scope of
the project, as defined in the Highway Capacity Manual (HCM 2010): 520
Points: A point is the smallest roadway system element. The HCM 2010 defines a “Point” as follows:

Chapter 2 – Common Analytical Scenarios
Traffic Operations Analysis Tool Guidebook Version 1.1
Page | 10
“Points are places along a facility where (a) conflicting traffic streams cross, merge, or diverge; (b) a single traffic stream is regulated by a traffic control device; or (c) there is a significant change in the segment capacity (e.g., lane 525
drop, lane addition, narrow bridge, significant upgrade, start or end of a ramp influence area).”
Segments: A segment consists of two points and is defined by the HCM 2010 as follows:
“A segment is the length of roadway between two points. Traffic volumes 530
and physical characteristics generally remain the same over the length of a segment, although small variations may occur (e.g., changes in traffic volumes on a segment resulting from a low-volume driveway). Segments may or may not be directional.”
Facilities: Facilities are made up of multiple points (2+) and segments. A facility is 535
defined by the HCM 2010 as follows: “Facilities are lengths of roadways, bicycle paths, and pedestrian walkways
composed of a connected series of points and segments. Facilities may or may not be directional and are defined by two endpoints.”
Corridors: Corridors are comprised of multiple facilities. The facilities must be 540
parallel and can be an assortment of freeway, urban street, transit, or pedestrian/bicycle facilities. The HCM 2010 defines a corridor as follows:
“Corridors are generally a set of parallel transportation facilities designed to move people between two locations.”
Areas: Areas consist of numerous facilities. Within an area, facilities do not need to 545
be parallel to one another. The HCM 2010 defines areas as follows: “Areas consist of an interconnected set of transportation facilities serving
movements within a specified geographic space, as well as movements to and from adjoining areas. The primary factor distinguishing areas from corridors is that the facilities within an area need not be parallel to each 550
other. Area boundaries can be set by significant transportation facilities, political boundaries, or topographical features such as ridgelines or major bodies of water.”
Systems: A system is a larger version of an area. The HCM 2010 defines a system as follows: 555
“Systems are composed of all the transportation facilities and modes within a particular region. A large metropolitan area typically has multiple corridors passing through it, which divide the system into a number of smaller areas. Each area contains a number of facilities, which, in turn, are composed of a series of points and segments. Systems can also be divided into modal 560
subsystems (e.g., the roadway subsystem, the transit subsystem) as well as subsystems composed of specific roadway elements (e.g., the freeway subsystem, the urban street subsystem).”

Chapter 2 – Common Analytical Scenarios
Traffic Operations Analysis Tool Guidebook Version 1.1
Page | 11
2.5 Undersaturated and Oversaturated Conditions
It is important to recognize the difference between “undersaturated” and “oversaturated” 565
conditions when choosing an analytical tool to use, since different equations and methodologies
may be required depending on the selected tool. The HCM 2010 defines undersaturated flow
and oversaturated flow as follows:
“Traffic flow during the analysis period is specified as ‘undersaturated’ when the
following conditions are satisfied: (a) the arrival flow rate is lower than the 570
capacity of a point or segment, (b) no residual queue remains from a prior
breakdown of the facility, and (c) traffic flow is unaffected by downstream
conditions.”
“Traffic flow during an analysis period is characterized as ‘oversaturated’ when
any of the following conditions is satisfied: (a) the arrival flow rate exceeds the 575
capacity of a point or segment, (b) a queue created from a prior breakdown of a
facility has not yet dissipated, or (c) traffic flow is affected by downstream
conditions.”
Speed is another element that can be used in conjunction with other parameters to determine
whether a facility is undersaturated versus oversaturated, especially on uninterrupted flow 580
facilities such as freeways and multilane highways. In undersaturated conditions, speeds are not
impacted by volume of traffic; therefore, speeds are most influenced by the posted speed limit,
the number of heavy vehicles, and/or the geometry of the roadway. For interrupted flow
facilities, such as signalized intersections, queue lengths are a strong indicator of saturated
traffic conditions. In oversaturated conditions, traffic speeds drop considerably depending on 585
the severity of saturation. Typically, when vehicles travel at low speeds or are stopped
completely, density cannot be calculated. The determination of when a study area is congested
will be based on the following sources of information:
1. Current traffic count data
2. Current traffic analysis results 590
3. Results from previous studies conducted within the study area, within the last 5
years
4. Congestion mapping
One common phenomena resulting from oversaturated conditions is peak hour spreading or
PHS. PHS is most prevalent in urban/suburban transportation networks where the peak hour 595
traffic demand exceeds the available traffic capacity throughout the entire hour. This excess
traffic then “spreads” to either side of the traditional peak hour, which creates a peak period of
two or more hours as opposed to just one hour. Refer to Figure 1 as an illustrative example of
one type of peak hour spreading.
There are various degrees of PHS that can occur depending on the extent of peak hour traffic 600
demand and hourly peak period travel distributions; however, the occurrence of PHS needs to

Chapter 2 – Common Analytical Scenarios
Traffic Operations Analysis Tool Guidebook Version 1.1
Page | 12
be accounted for in operational analyses. This process involves the use of a microsimulation
tool, such as SimTraffic, CORSIM, or VISSIM, and will require data to be entered in 15-minute
intervals until all peak hour traffic demand is successfully spread across the adjacent 15-minute
periods. 605
Figure 1 – Example of Peak Hour Spreading

Chapter 3 – Common Analytical Tools
Traffic Operations Analysis Tool Guidebook Version 1.1
Page | 13
“The ICU has not been designed for
operations and signal timing design.
Delay based methods and simulation
such as the Highway Capacity Manual
(HCM), Synchro, and SimTraffic
should be used for operations and
signal timing design.”
-Trafficware
3 Common Analytical Tools
A number of traffic analysis tools can be used to analyze the analytical scenarios presented in 610
Chapter 2. Based on past experience and current practice in each VDOT district, seven tools
were included for discussion in this guidebook. A brief description of the history and capabilities
for each tool are provided in the following sections of this chapter.
3.1 Quickzone
Quickzone, which is a deterministic tool distributed by McTrans Center at the University of 615
Florida, is used to evaluate the impacts of work zone mitigation strategies and can determine
measures of effectiveness such as cost, delay, and queuing associated with a work zone.
3.2 Highway Capacity Software (HCS)
HCS 2010 is a deterministic tool distributed by McTrans. HCS uses the methodologies outlined in
the HCM 2010. HCS can be used to analyze signalized intersections, unsignalized intersections 620
(two-way and all-way), freeway segments, merging and diverging junctions, weaving segments,
collector-distributor facilities, multilane highways, and two-lane highways.
3.3 Synchro
Synchro is a deterministic tool developed by Trafficware, and is primarily used for modeling
traffic flow, traffic signal progression, and optimization of traffic signal timing. Additionally, 625
Synchro may be used to analyze arterials, signalized intersections, and unsignalized
intersections. Synchro cannot be used to analyze freeways, interchange systems, or ramps, and
should only be used to analyze intersections, arterials, and corridors.
Synchro can utilize two different methodologies for analyzing intersections. The first
methodology, Intersection Capacity Utilization (ICU), measures the capacity of an intersection, 630
and was designed to handle planning level studies, such as traffic impact studies, future
roadway design, and congestion management programs. While ICU does not predict delay, it
can be used to predict how often an intersection could experience congestion. The ICU method
is not an acceptable methodology to be used in Virginia.
The second methodology, HCM, is used 635
to analyze intersection operations
based on total control delay. In
practice, the HCM methodology is the
preferred methodology for all types of
intersection operational analyses. The 640
developer of Synchro, Trafficware,
differentiates between the two
methodologies as follows:

Chapter 3 – Common Analytical Tools
Traffic Operations Analysis Tool Guidebook Version 1.1
Page | 14
Based on the explanation
provided by Trafficware, all
intersection analyses using
Synchro will strictly reflect
the HCM methodology, with
the exception of Synchro
analyses for traffic signal
optimization.
“The ICU has not been designed for operations and signal timing design. Delay
based methods and simulation such as the Highway Capacity Manual (HCM), 645
Synchro, and SimTraffic should be used for operations and signal timing
design.”
The major difference between the two
methodologies is the MOEs used. The ICU
methodology is based on volume-to-capacity (v/c) 650
ratios, while the HCM methodology is based on
control delay. Based on the explanation provided
by Trafficware on the two methodologies, all
intersection analyses using Synchro will strictly
reflect the HCM methodology, with the exception 655
of Synchro analyses for traffic signal optimization.
For these types of analyses, the progression
optimization features in Synchro will be used.
3.4 SimTraffic
SimTraffic, a microsimulation tool, is the traffic analysis package included with Synchro. 660
SimTraffic models any network that can be analyzed using Synchro. Prior to any analysis being
performed in SimTraffic, the network must first be developed, as if a deterministic analysis was
to be performed using Synchro. Once the network is developed, SimTraffic can be initiated
either from within the Synchro interface or independently. Similar to CORSIM and VISSIM,
SimTraffic has the ability to output several measures of effectiveness, which are specified by the 665
user, such as delay per vehicle, total stops, travel distance, queue length, travel time, and
average speed.
One of the strengths of SimTraffic is its functionality to simulate intersections, arterials, and
corridors. Similar to Synchro, SimTraffic does not have the functionality to analyze freeway or
interchange systems, including weaving segments, merge/diverge junctions, HOV lanes, 670
collector-distributor facilities, or other similar facilities.
3.5 SIDRA Intersection
SIDRA Intersection is a deterministic tool developed by an Australian transportation operations
company, Akcelik & Associates Pty Ltd. Although SIDRA Intersection can be used to analyze both
individual signalized and unsignalized intersections, its primary application in the United States 675
has been specifically for roundabout operations.
There are two main roundabout capacity models used in SIDRA Intersection at this time – the
Standard Right-Side SIDRA Intersection model and the HCM 2010 model. Unlike Synchro, both
models can be used in planning and operations level analyses and both use the same MOEs –
delay, speed, and queue. Based on research conducted by the developers of SIDRA Intersection, 680

Chapter 3 – Common Analytical Tools
Traffic Operations Analysis Tool Guidebook Version 1.1
Page | 15
the HCM 2010 methodology does not account for the effects of vehicle arrivals based on
adjacent traffic control devices, whereas the SIDRA Intersection model does, which is why SIDRA
Intersection will be used for roundabout analyses where microsimulation is not warranted.
More detailed differences between the two models are described in more detail in Chapter 7.
3.6 CORSIM 685
CORSIM (CORridor microscopic SIMulation) is a microsimulation and analytical tool that
incorporates both urban traffic and freeway traffic simulation. Unlike HCS, which provides an
analytical macroscopic snapshot, CORSIM uses microsimulation to explore the traffic
operational behavior of various geometric conditions as traffic volumes and speeds fluctuate.
The traffic simulation output includes several MOEs, and can be used to analyze many different 690
traffic conditions and roadway configurations.
Through traffic simulation, CORSIM allows the user to evaluate existing and future traffic
operations to assist in determining the effectiveness of geometric configurations. Additionally,
CORSIM can provide cumulative performance results from several simulation iteration output
files. 695
3.7 VISSIM
VISSIM is a microscopic traffic simulation model developed to analyze the full range of roadway
and public transportation systems. The primary applications for VISSIM are arterial/corridor
studies and freeway operational and planning studies; however, VISSIM can also be used for
evacuation planning, LRT/BRT studies, transit center designs, railroad grade crossing analyses, 700
toll plaza evaluations, and Intelligent Transportation Systems (ITS) assessments.
Similar to CORSIM, VISSIM provides the user with an ability to modify individual driver and
vehicle characteristics, and can output a multitude of MOEs. VISSIM allows the user flexibility to
develop a wide range of roadway networks with respect to vehicle movements and roadway
geometry. 705

Chapter 3 – Common Analytical Tools
Traffic Operations Analysis Tool Guidebook Version 1.1
Page | 16
This page is intentionally left blank.

Chapter 4 – Common Analytical MOEs
Traffic Operations Analysis Tool Guidebook Version 1.1
Page | 17
4 Common Analytical Measures of Effectiveness (MOEs)
When conducting traffic analyses, there are many MOEs that can be used to document results.
For this guidebook, several MOEs were evaluated and ultimately eight were chosen to be 710
included in this guidebook. For consistency and simplicity reasons, all definitions presented in
this chapter are referenced from the HCM 2010 with an understanding that each individual
traffic analysis tool could have their own interpretation of the MOE definitions.
4.1 Common Measures of Effectiveness (MOEs)
The HCM defines a performance measure as a “quantitative or qualitative characterization of 715
some aspect of the service provided to a specific road user group”. This guidebook considers the
following eight performance measures:
Queue Length (measured in feet – ft): The HCM 2010 defines queue length as “how far the traffic backs up as a result of
traffic control or a vehicle stopped in the travel lane while waiting to make a turn”. 720
The determination of queue length is complex and the methodology to compute
this value is described in Section 6.5.2. Queue length is an MOE compatible with
interrupted flow (i.e., arterial networks).
Delay (measured in seconds per vehicle – sec/veh): Delay, as specified in the HCM 2010, is defined as “delay associated with vehicles 725
slowing in advance of an intersection, the time spent stopped on an intersection
approach, the time spent as vehicles move up in the queue, and the time needed for
vehicles to accelerate to their desired speed”. Delay is an MOE compatible with
interrupted flow (i.e., arterial networks).
Volume-to-Capacity (v/c) Ratio: 730
According to the HCM 2010, the v/c ratio is defined as “the ratio of the flow rate to
capacity for a system element.” The HCM 2010 also states that “the volume-to-
capacity (v/c) ratio is a special-case service measure. It cannot be directly measured
in the field, nor is it a measure of traveler perceptions. Until capacity is reached (i.e.,
when flow breaks down on uninterrupted-flow facilities and when queues build on 735
interrupted- or uninterrupted-flow facilities), the v/c ratio is not perceivable by
travelers”. V/C ratio is an MOE compatible with interrupted flow (i.e., arterial
networks), but may also be useful for comparison purposes as a surrogate measure
on uninterrupted flow facilities, such as freeways.
Density (measured in passenger cars per lane per mile – pcplpm): 740
According to the HCM 2010, density is defined as “the number of vehicles occupying
a given length of a lane or roadway at a particular instant”. Density is an MOE
compatible with uninterrupted flow (i.e., freeway networks).
Chapter 4 – Common Analytical MOEs
Traffic Operations Analysis Tool Guidebook Version 1.1
Page | 18
Speed (measured in miles per hour – mph): 745
According to the HCM 2010, “speed reflects how fast motorists can traverse a
roadway section, including the effects of traffic-control devices, delays due to
turning vehicles at intersections and driveways, and traffic demands on the
roadway”. Speed is an MOE compatible with either interrupted (arterial networks)
or uninterrupted (freeway networks) flows. 750
Average Travel Speed or ATS (measured in miles per hour – mph): According to the HCM 2010, “average travel speed is defined as the highway
segment length divided by the average travel time taken by vehicles to traverse it
during a designated time interval.” ATS is an MOE compatible with uninterrupted
(two-lane highways) flows. 755
Percent Time-Spent-Following or PTSF (measured in percentage – %) According to the HCM 2010, percent time-spent-following “is the average
percentage of time that vehicles must travel in platoons behind slower vehicles due
to the inability to pass. Percent time-spent-following also represents the
approximate percentage of vehicles traveling in platoons.” PTSF is an MOE 760
compatible with uninterrupted (two-lane highways) flow. This guidebook
recommends that this MOE only be used for undersaturated conditions.
Percent of Free-Flow Speed or PFFS (measured in percentage – %) According to the HCM 2010, “percent of free-flow speed represents the ability of
vehicles to travel at or near the posted speed limit.” PFFS is an MOE compatible 765
with uninterrupted (two-lane highways) flow. This guidebook recommends that this
MOE only be used for undersaturated conditions.
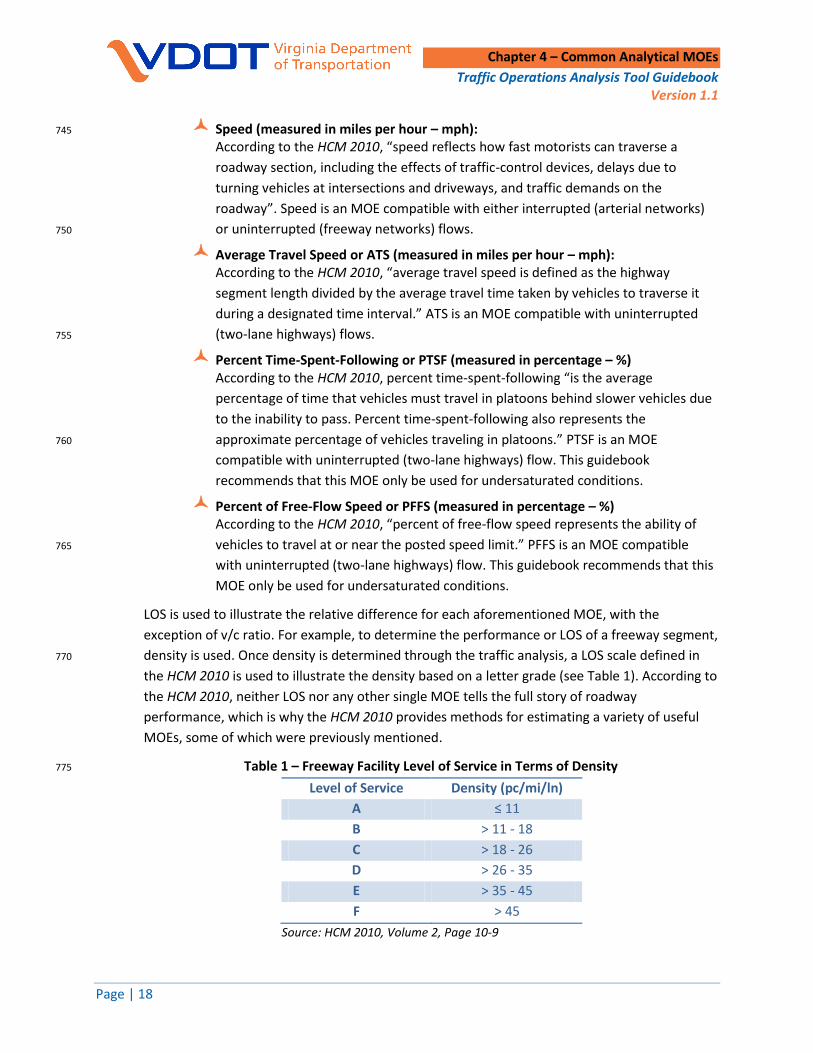
LOS is used to illustrate the relative difference for each aforementioned MOE, with the
exception of v/c ratio. For example, to determine the performance or LOS of a freeway segment,
density is used. Once density is determined through the traffic analysis, a LOS scale defined in 770
the HCM 2010 is used to illustrate the density based on a letter grade (see Table 1). According to
the HCM 2010, neither LOS nor any other single MOE tells the full story of roadway
performance, which is why the HCM 2010 provides methods for estimating a variety of useful
MOEs, some of which were previously mentioned.
Table 1 – Freeway Facility Level of Service in Terms of Density 775
Level of Service Density (pc/mi/ln)
A ≤ 11
B > 11 - 18
C > 18 - 26
D > 26 - 35
E > 35 - 45
F > 45
Source: HCM 2010, Volume 2, Page 10-9

Chapter 4 – Common Analytical MOEs
Traffic Operations Analysis Tool Guidebook Version 1.1
Page | 19
The analysis procedures and resulting MOES (i.e., delay, density, speed, etc.) in the HCM 2010
are based on deterministic models, in the form of equations, which are based on traffic flow
theory. Most of the equations from these models include empirical calibration factors derived
from research. On the other hand, microsimulation is based on the flow of vehicles along a 780
roadway segment in accordance with principles of physics, vehicle attributes, rules of the road,
and driver behavior.
While both types of tools attempt to replicate travel conditions on the roadway, it is often
challenging to find results that are comparable. For example, density reported from the HCM
2010 is expressed in terms of passenger cars per mile, while density reported from 785
microsimulation tools is expressed in terms of actual vehicles per mile. Since different analysis
tools contain different definitions for similarly named MOEs, inaccurate results and conclusions
may be reported if the differences are not properly accounted for.

Chapter 4 – Common Analytical MOEs
Traffic Operations Analysis Tool Guidebook Version 1.1
Page | 20
This page is intentionally left blank.790

Chapter 5 – Microsimulation
Traffic Operations Analysis Tool Guidebook Version 1.1
Page | 21
5 Microsimulation
When saturated conditions are prevalent within a transportation system, deterministic tools
should not be used to analyze traffic operations due to limitations in the fundamental analysis
equations used to develop the tools. Microsimulation tools can be very valuable for
transportation analyses; however, similar to deterministic tools, there are limitations that need 795
to be considered. For example, microsimulation tools are not designed to model two-way left-
turn lanes.
5.1 Microsimulation Applicability and Calibration
With each model used to analyze traffic operations, there are tradeoffs. Deterministic models
are relatively easy to use and are not very time or data intensive. In contrast, traffic simulation-800
based tools require more time and cost to develop a model and appropriately validate and
calibrate. This difference is depicted illustratively in Figure 2.
Figure 2 – Time/Cost Comparison for Deterministic and Microsimulation Tools
The difference in time and cost for these tools is often interrelated and can be accounted for in 805
the following factors: additional data collection requirements (e.g., calibration, origin-
destination, etc.), effort to develop and calibrate the microsimulation model, additional time
required for post-processing output, time to become proficient using the analysis tools, cost to
purchase the analysis tools, to name several.
The capabilities of each tool are where the time and cost investments can be observed. 810
Deterministic models perform “snapshot” analyses, which in most non-congested situations and
traditional geometry is adequate. Microsimulation-based tools allow the user to evaluate both
under- and oversaturated conditions while many different factors are allowed to fluctuate
(speed, driver behavior, etc.) over time. The robustness of these tools can provide the user with

Chapter 5 – Microsimulation
Traffic Operations Analysis Tool Guidebook Version 1.1
Page | 22
much more information than a deterministic model could provide. Additionally, a traffic 815
simulation tool can often provide 2-dimensional or 3-dimensional visualization of the results
allowing the user to visually observe the analytical results – a very powerful benefit to discern
between varying levels of oversaturated conditions.
The guiding principle for either deterministic or simulation models is that the model is only as
accurate as the inputs that are used. This means that accurate and appropriate values for inputs 820
should be used at all times supported by field documentation, when available. Chapter 6
provides guidance on common inputs available in each of the tools (deterministic and
simulation-based) considered in this guidebook.
In addition to the use of accurate inputs, simulation-based models need to be calibrated. The
calibration procedure is the most important component of network development to ensure that 825
the model accurately represents existing and future traffic conditions. Making changes to global
calibration factors such as car following or lane-changing characteristics prior to establishing
that the link level conditions are as accurate as possible, will result in an unrealistic model.
Therefore, more global changes to the model should be made as a last resort. For calibration
purposes, refer to the suggested CORSIM and VISSIM calibration factors provided in Appendix C. 830
Although the calibration process is a critical component of traffic simulation, the intent of this
guidebook is to focus on the selection and use of the most appropriate analytical tool(s) for
various transportation analyses. Therefore, it is recommended that the user of this guidebook
refer to the step-by-step calibration process described in the Traffic Operations Analysis Toolbox
Volume III: Guidelines for Applying Traffic Microsimulation Software (FHWA-HRT-04-040). 835
5.2 Simulation Sample Size
In addition to conducting proper network calibration, determining the appropriate number of
simulation runs is also very important step in developing accurate traffic simulation results. The
number of simulation runs shall be calculated based on the FHWA sample size determination
methodology, as referenced in TE Memorandum XX (to be released). Using too few simulation 840
runs will not fully account for simulation variance, while using too many runs will become overly
time-intensive for analysis purposes. FHWA developed a statistical process to ensure that an
appropriate number of simulation runs are performed at a 95th percentile confidence level. This
methodology for determining the number of simulation runs was adopted in this guidebook.
These computations shall be submitted as supporting documentation with the traffic simulation 845
analysis.
The overall process represents a standard statistical “t-Test”, where the mean and standard
deviation of specific MOEs are evaluated to determine whether they are within an allowable
tolerance at a certain confidence level. FHWA recommends a 95th percentile confidence level
with a 10% tolerance. The process starts by identifying a particular MOE and a location in the 850
network to obtain the chosen MOE. The location should have some variance in results between
the runs based on speed changes, conflicts (weaving segments), and signal control. Once the

Chapter 5 – Microsimulation
Traffic Operations Analysis Tool Guidebook Version 1.1
Page | 23
location and MOEs are chosen, an initial number of 10 runs should be evaluated. From the
results of the 10 runs, the mean and standard deviation should be computed. Once these values
are obtained, Equation 1 should be used to determine the appropriate sample size: 855
In this equation, “N” represents the necessary sample size, “Z” represents the number of
standard deviations away from the mean corresponding to the required confidence level
(assuming a normal distribution and confidence interval of 95th percentile, which corresponds to
a value of 1.96), “S” represents the sample standard deviation, and “E” represents the tolerable 860
error in terms of the sample mean.
As an example of applying this methodology, assume that speed is chosen as the primary MOE
for the project. After 10 initial runs, the sample mean is computed to be 32.5 mph and the
sample standard deviation is 8.5 mph. The default confidence level and tolerance error assumed
by FHWA are 95% and 10%, respectively. To calculate “E” in terms of the sample mean, multiply 865
the mean (32.5 mph) by the tolerance error percent (10%). In this example, “E” would be
3.25 mph. Using Equation 1, the computed sample size is 26.27, or 27 runs. This result means
that the initial 10 runs were not adequate and a new simulation must be performed for a
minimum of 27 runs. The sample size methodology is an iterative process, such that a new
round of calculations will need to be performed on the results of the 27 runs to see if 27 runs 870
are adequate. Understanding that this iterative process could become very time consuming and
costly, a maximum threshold of 30 runs was established.
To assist the users of this guidebook, a Sample Size Determination Tool was developed to
accompany this guidebook. This Excel-based tool requires the user to enter the MOEs from the
initial 10 runs. The 95th percentile confidence interval and 10% tolerance remain default values 875
in the tool and shall not be changed. An example of how the tool is used is shown in Figure 3
and Figure 4. For a more detailed explanation of the sample size determination calculations, see
the Technical Appendix. In this example, values from a hypothetical MOE are reported for 10
runs (see Figure 3). After running the sample size determination methodology, it was
determined that 13 runs do not fall within the 10% tolerance level. Working backwards, the tool 880
estimates that 16 runs should be run and re-tested. After the second iteration with 16 runs, the
MOE values from the 16 runs are determined to be within tolerance thresholds. The tool then
reports that no more runs are required.
N = (Z)2 (SS)2 / (E)2 (1)

Chapter 5 – Microsimulation
Traffic Operations Analysis Tool Guidebook Version 1.1
Page | 24
Figure 3 – Screen Shot of Failing Sample Size Determination Tool 885
User Inputs Sample Size (N) = Number of Model Runs
Constants Sample Mean (Xs) = (1/N) (X1 + X2 + X3 … + XN)
Outputs Sample Standard Deviation (Ss) = √[(Σ(X-Xs)2)/(N-1)]
Sampling Error = Z (Ss/√N)
Confidence Level = Xs ± Z (Ss/√N)
% of Sample Mean (E) = % Tolerance * Xs
Sample Size Needed = [(Z)2 * (Ss)2] / (E)2
Model Iterations Sample Size Outputs
Measure of Effectiveness (MOE): Speed N = 10.0Confidence Interval: 95% Xs = 46.1
Tolerance Error: 10% Ss = 8.1
Number of Model Runs: 10 E = 4.6
Z = 1.96
Run Number Speed
1 57 Sampling Error =
2 48 95% Confidence Interval = 41.1 to 51.1
3 38 Percentage of Mean = Too High
4 45 Sample Size Needed =
5 39
6 41
7 37
8 43
9 59
10 54
5.01
10.9%
12
Z is the number of standard deviations away from the mean
corresponding to the required confidence level in a normal
distribution.
Sample Size Determination Tool
Figure 4 – Screen Shot of Passing Sample Size Determination Tool
User Inputs Sample Size (N) = Number of Model Runs
Constants Sample Mean (Xs) = (1/N) (X1 + X2 + X3 … + XN)
Outputs Sample Standard Deviation (Ss) = √[(Σ(X-Xs)2)/(N-1)]
Sampling Error = Z (Ss/√N)
Confidence Level = Xs ± Z (Ss/√N)
% of Sample Mean (E) = % Tolerance * Xs
Sample Size Needed = [(Z)2 * (Ss)2] / (E)2
Model Iterations Sample Size Outputs
Measure of Effectiveness (MOE): Speed N = 12.0Confidence Interval: 95% Xs = 45.8
Tolerance Error: 10% Ss = 7.4
Number of Model Runs: 12 E = 4.6
Z = 1.96
Run Number Speed
1 57 Sampling Error =
2 48 95% Confidence Interval = 41.7 to 50.0
3 38 Percentage of Mean = Good
4 45 Sample Size Needed =
5 39
6 41
7 37
8 43
9 59
10 54
11 43
12 46
4.16
9.1%
10
Z is the number of standard deviations away from the mean
corresponding to the required confidence level in a normal
distribution.
Sample Size Determination Tool

Chapter 6 – Standard Requirements for Analyses
Traffic Operations Analysis Tool Guidebook Version 1.1
Page | 25
6 Standard Requirements for Analyses
When conducting either traffic or planning analyses, there are two types of assumptions that 890
should be considered. The first group of assumptions pertains to the data and analysis
methodologies required for traffic or planning analyses, which are discussed in Chapter 5, while
the second group focuses on the assumptions for the individual traffic analysis tools, which are
discussed in Chapter 6.
A project scoping meeting should be held prior to the start of the project between the VDOT 895
project manager, other individuals involved in the project review process, and the
transportation engineers and/or planners responsible for conducting the analysis. The agenda of
the meeting should include a discussion of the study area (e.g., intersections and/or
interchanges to be studied), required traffic analysis tools to be used for the network analysis
derived from the traffic software selection tool, major traffic assumptions (e.g., growth rates, 900
seasonal adjustment factors, peak hour factors, etc.), and the proposed study methodology.
The following analysis assumptions will be discussed in detail for each analysis type in this
chapter:
Geometric data
Traffic count data 905
Signal operations data
Calibration data
Roundabout analysis methodology
Design impacts to analysis
A basic intersection analysis typically evaluates intersection operations with a minimum of two 910
measures of effectiveness: delay (measured in seconds per vehicle) and queue length (measured
in feet). Although individual intersection (signalized or unsignalized) analyses can be stand-alone
analyses, arterial analyses consist of multiple intersection analyses combined using signal timing
and progression. Therefore, all data for this category are pertinent to both individual
intersection analyses and arterial analyses. 915
In some instances, multilane highways can be similar to freeway segments where opposing
directions of travel are divided by a median, intersections are spaced greater than 2 miles apart,
and travel speeds of 55 mph or greater are observed. In other instances, multilane highways
operate more as an arterial with two-way-left-turn lanes and speeds of 45 mph or less.
6.1 Geometric Data 920
Geometric data includes any data required to develop the physical extents of a network
including link lengths, travel lane widths, number of lanes, and lane designations. Overall, there
are many different geometric inputs required to develop all of the analytical networks covered

Chapter 6 – Standard Requirements for Analyses
Traffic Operations Analysis Tool Guidebook Version 1.1
Page | 26
in this guidebook; however, not all geometric data are needed for each analysis. Table 2a and
Table 2b indicate which geometric data is required for each analysis type. 925
Current aerial imagery should be used when initially developing all geometric networks; in
addition, in-field verification should also be conducted to validate that the aerial imagery is
accurate. For analytical tools that do not have taper length inputs, an “effective storage” length
should be input into the storage bay length field, which is equal to half the taper length summed
with the storage bay length. 930
6.2 Traffic Count Data
This section focuses on five essential peak hour traffic count data components:
1. Traffic count data requirements
2. Heavy vehicle classification
3. Appropriate age of traffic count data 935
4. Peak hour determination
5. Volume balancing
6.2.1 Traffic Count Data Requirements
Traffic count data includes all vehicular count data (automobiles, bicycles, and pedestrians)
necessary to analyze existing or future condition operations. Other data pertinent to signal 940
timing and calibration (speed and queue data) will be discussed in the following sections of this
chapter. Table 3 indicates which traffic data is required for each type of traffic analysis.
Four consecutive hours of Turning Movement Counts (TMC) are suggested in each peak period,
collected in 15-minute intervals. If peak hour spreading does not exist or the analysis is in a rural
location, then 2 to 3 hours of TMC data could be acceptable. These counts need to include 945
vehicular and heavy vehicle counts by movement, in addition to all pedestrian and bicycle
crossings. In addition to TMC data, all bus blockages and parking maneuvers occurring within
250 feet (in either direction of travel) from the stop bar of an approach should be counted
during the same time period.
For Toll Plaza Analyses, 4 hours of data for each payment choice (and lane) are required. In cases 950
where severe peak hour spreading is occurring, more than four hours of data could be required,
with the exception of Bicycle and Pedestrian Analyses. In all cases, any deviation from the
standard 4 hours of data needs to be documented and agreed to by the project manager. Both
raw and processed traffic count data shall be submitted with the analysis.
For vehicle classification data, 48 consecutive hours of data for each lane should be collected in 955
15-minute intervals. Detailed guidance on vehicle classifications will be provided later in this
section. Although discussed in Section 6.4 of this chapter (Calibration Data), both vehicle
classification and speed data should be counted concurrently with current traffic count
technologies.

Chapter 6 – Standard Requirements for Analyses
Traffic Operations Analysis Tool Guidebook Version 1.1
Page | 27
Table 2a – Standard Geometric Parameters 960
Analysis Categories /
Standard Geometric
Assumptions
Aerial
Imagery
Number
of Lanes
Preemption
Present
Location of
Preemption
Devices
Approach
Grade
Lane
Widths
Storage
Bay
Lengths
Taper
Lengths
Intersection
Approach
Widths
Shoulder
Widths
Lane
Designations
Presence of
Pedestrians
or Bike Lanes
Length of
Passing Lane(s),
if present
Length of
No Passing
Zone(s)
Signalized Intersection, Stop-
Controlled Intersection, and
Arterial Analyses
Roundabout Analyses
Non-Traditional
Intersection/Interchange
Analyses (SPUI, CFI, Displaced
Left-Turn Intersection)
Pedestrian and Bicycle Analyses
(On- and Off-Street)
Freeway/Interchange Analyses
(Merge, Diverge, Weave, and
Collector-Distributor)
Two-Lane Highway Analyses
Multilane Highway Analyses
Workzone Traffic Analyses
(Freeway or Arterial)
Toll Plaza Analyses
Freeway Managed Lanes (incl.
Ramp Metering Analyses)

Chapter 6 – Standard Requirements for Analyses
Traffic Operations Analysis Tool Guidebook Version 1.1
Page | 28
Table 2b – Standard Geometric Parameters (continued)
Analysis Categories / Standard Geometric Assumptions
Roundabout Approach
Widths
Ped/Bike Crossing
Distances
Roadside Shoulder
Slope
Interchange Configuration
Ramp Length
and Radii
Acceleration / Deceleration Lane Lengths
Distances to Adjacent
Interchanges
Distance to Upstream
Warning Signs
Driveway Spacing
Median Type
Distance to Constricting
Infrastructure
Payment Choices
Time of Day
Restrictions
Signalized Intersection, Stop-Controlled Intersection, and Arterial Analyses
Roundabout Analyses
Non-Traditional Intersection/Interchange Analyses (SPUI, CFI, Displaced Left-Turn
Intersection)
Pedestrian and Bicycle Analyses (On- and Off-Street)
Freeway and Interchange Analyses (Merge, Diverge, Weave, and Collector-
Distributor)
Two-Lane Highway Analyses
Multilane Highway Analyses
Workzone Traffic Analyses
(Freeway or Arterial)
Toll Plaza Analyses
Freeway Managed Lanes (incl. Ramp
Metering Analyses)
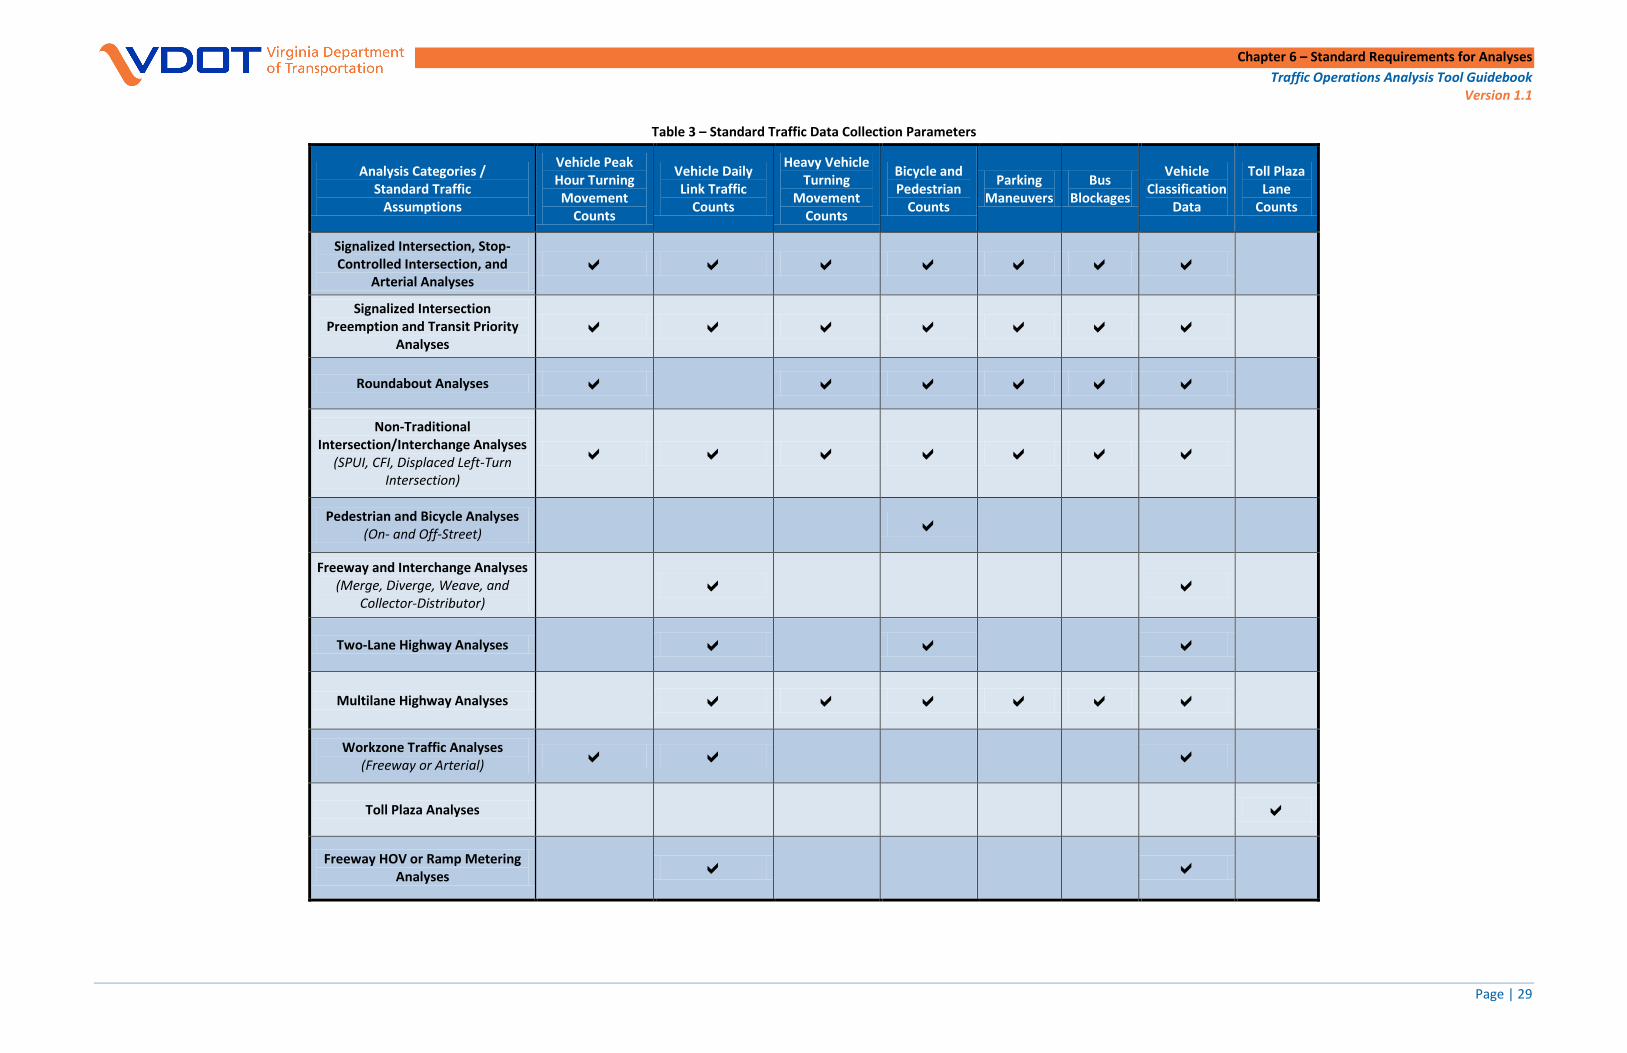
Chapter 6 – Standard Requirements for Analyses
Traffic Operations Analysis Tool Guidebook Version 1.1
Page | 29
Table 3 – Standard Traffic Data Collection Parameters
Analysis Categories / Standard Traffic
Assumptions
Vehicle Peak Hour Turning Movement
Counts
Vehicle Daily Link Traffic
Counts
Heavy Vehicle Turning
Movement Counts
Bicycle and Pedestrian
Counts
Parking Maneuvers
Bus Blockages
Vehicle Classification
Data
Toll Plaza Lane
Counts
Signalized Intersection, Stop-Controlled Intersection, and
Arterial Analyses
Signalized Intersection Preemption and Transit Priority
Analyses
Roundabout Analyses Non-Traditional
Intersection/Interchange Analyses (SPUI, CFI, Displaced Left-Turn
Intersection)
Pedestrian and Bicycle Analyses (On- and Off-Street)
Freeway and Interchange Analyses (Merge, Diverge, Weave, and
Collector-Distributor)
Two-Lane Highway Analyses
Multilane Highway Analyses
Workzone Traffic Analyses (Freeway or Arterial)
Toll Plaza Analyses
Freeway HOV or Ramp Metering Analyses

Chapter 6 – Standard Requirements for Analyses
Traffic Operations Analysis Tool Guidebook Version 1.1
Page | 30
For all traffic count data, average weekday traffic volumes should be collected only on Tuesdays,
Wednesdays, and/or Thursdays, while average weekend traffic volumes should be collected only 965
on Saturdays and Sundays. In cases where there are special events creating isolated peak travel
periods, data should be collected on the same day(s) corresponding to the special event. All data
should be collected concurrently on the same day(s) throughout the entire network to the
extent possible.
For example, one intersection (or ramp) should not be counted in October 2012 and then 970
another intersection (or ramp) counted in March 2013. In the event of any unplanned
circumstances occurring during the data collection process, such as inclement weather or a
vehicle crash, the event should be documented and evaluated by the project manager to
determine if additional counts should be conducted. Any additional counts should be collected
as close to the original count date as possible and during the same time period during the week 975
(weekday or weekend).
In addition to the data identified in Table 3, origin-destination counts may be needed especially
for more complex projects where calibration of a traffic simulation model is required. The scope
and acceptable tolerances of the origin-destination counts should be approved by the project
manager. 980
6.2.2 Appropriate Age of Traffic Count Data
Since traffic count data and aerial imagery are constantly changing, it is important that all
network development and analyses be performed using the most up-to-date information. It is
therefore essential that age limitation guidelines be established for all traffic count data and
aerial imagery, regardless of analysis type. The appropriate age of traffic count data is 2 years 985
from when the initial traffic data was collected or imagery was collected and when the analysis
is being conducted. Furthermore, if travel conditions within the analysis study area have
changed significantly within the aforementioned two-year timeframe, new traffic counts could
be required by the project manager.
The appropriate age of aerial imagery that is used in coordination with traffic analysis is also 2 990
years; however, field validation is required to ensure that the aerial matches current conditions.
The option to use older imagery should be made by the project manager based on validation.
6.2.3 Peak Hour Determination
For isolated, point analyses, the highest four consecutive 15-minute intervals of traffic count
data should be considered the peak hour. For segment, corridor, system, and area analyses, a 995
common uniform peak hour should be computed and applied throughout the entire network
(e.g., each data entry should be from the same hour). For simulation analyses, the modeling
period can be increased beyond one hour to account for this issue. For other types of analyses,
one uniform peak hour should be used.

Chapter 6 – Standard Requirements for Analyses
Traffic Operations Analysis Tool Guidebook Version 1.1
Page | 31
6.2.4 Heavy Vehicle Classification 1000
For all analyses in this guidebook, heavy vehicle classifications should comply with existing
guidelines established by FHWA. These guidelines, presented in Figure 5, contain 13 individual
vehicle classifications. By definition, any vehicle with a classification of 4 or higher should be
considered a “heavy vehicle” when traffic counts are collected.
Figure 5 – FHWA Vehicle Classification 1005
6.2.5 Volume Balancing
When traffic volumes are collected and peak hour traffic volumes are computed, there are
several factors that can cause imbalances in traffic volumes departing one intersection and
arriving at the next. Factors impacting volume balancing can include: 1010
1. The methodology in which peak hour volumes are selected (e.g., selecting peak
hours for each intersection versus using a universal peak hour for all intersections)
2. The impact of private driveways, parking lots, or parking garages along arterials or
multilane highways
3. Variations in traffic volumes between different days of the week, different weeks of 1015
the month, or different months of the year
4. The inherent variation in various traffic count equipment used
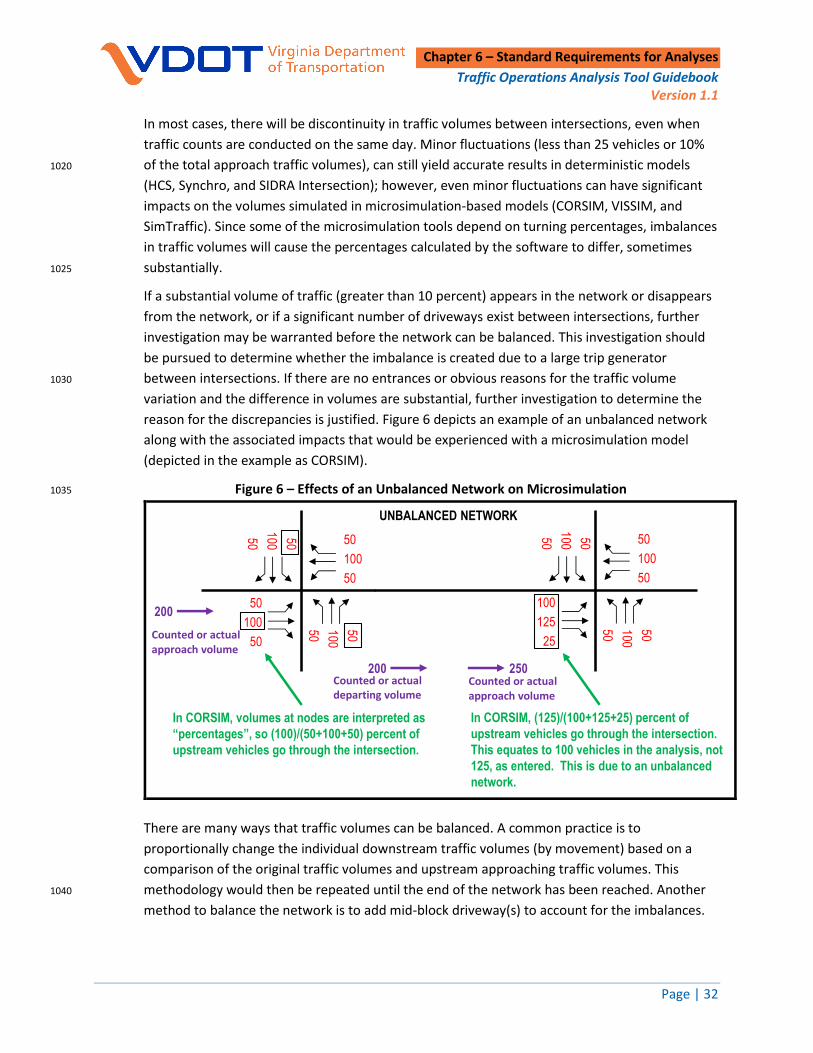
Chapter 6 – Standard Requirements for Analyses
Traffic Operations Analysis Tool Guidebook Version 1.1
Page | 32
In most cases, there will be discontinuity in traffic volumes between intersections, even when
traffic counts are conducted on the same day. Minor fluctuations (less than 25 vehicles or 10%
of the total approach traffic volumes), can still yield accurate results in deterministic models 1020
(HCS, Synchro, and SIDRA Intersection); however, even minor fluctuations can have significant
impacts on the volumes simulated in microsimulation-based models (CORSIM, VISSIM, and
SimTraffic). Since some of the microsimulation tools depend on turning percentages, imbalances
in traffic volumes will cause the percentages calculated by the software to differ, sometimes
substantially. 1025
If a substantial volume of traffic (greater than 10 percent) appears in the network or disappears
from the network, or if a significant number of driveways exist between intersections, further
investigation may be warranted before the network can be balanced. This investigation should
be pursued to determine whether the imbalance is created due to a large trip generator
between intersections. If there are no entrances or obvious reasons for the traffic volume 1030
variation and the difference in volumes are substantial, further investigation to determine the
reason for the discrepancies is justified. Figure 6 depicts an example of an unbalanced network
along with the associated impacts that would be experienced with a microsimulation model
(depicted in the example as CORSIM).
Figure 6 – Effects of an Unbalanced Network on Microsimulation 1035
50
100
50
50
10050
50100
50
50
100
50
100
125
25
50
10050
50100
50
50
100
50
200 250
UNBALANCED NETWORK
In CORSIM, volumes at nodes are interpreted as
“percentages”, so (100)/(50+100+50) percent of
upstream vehicles go through the intersection.
200
In CORSIM, (125)/(100+125+25) percent of
upstream vehicles go through the intersection.
This equates to 100 vehicles in the analysis, not
125, as entered. This is due to an unbalanced
network.
There are many ways that traffic volumes can be balanced. A common practice is to
proportionally change the individual downstream traffic volumes (by movement) based on a
comparison of the original traffic volumes and upstream approaching traffic volumes. This
methodology would then be repeated until the end of the network has been reached. Another 1040
method to balance the network is to add mid-block driveway(s) to account for the imbalances.
Counted or actual approach volume
Counted or actual approach volume
Counted or actual departing volume

Chapter 6 – Standard Requirements for Analyses
Traffic Operations Analysis Tool Guidebook Version 1.1
Page | 33
6.2.6 Other Data Considerations for Work Zones
In addition to the data collection requirements for work zones identified in Table 2a for work
zone analyses, other work zone data should be obtained, such as lane closure information, lane
closure lengths, time of day of closure, intensity of work zone, detour and alternative route 1045
availability, and condition of alternative routes (i.e., whether alternative routes are over or
under capacity).
6.3 Signal Operations Data
For those analyses that involve either traffic signals or pedestrian signals, it is important to
obtain critical signal timing data to accurately analyze existing conditions. All traffic and 1050
pedestrian signal timing data, in addition to being observed in the field, should be obtained from
the appropriate VDOT Regional Traffic Operations office or city/town engineering office, and
should include the following data for all timing plans:
Splits
Clearance intervals 1055
Cycle lengths
Offsets
Type of controller (NEMA, fixed time, etc.)
Sequencing and phasing diagrams
Time of day clocks 1060
Pedestrian crossing times (“WALK” and “DON’T WALK”)
Transit priorities
Preemption timings
Ramp metering data (i.e., processing splits, capacity criteria, etc.)
6.4 Calibration Data 1065
Calibration data is required to develop an analytical network. There are a wide variety of
calibration data available; however, they generally fall into four categories – peak hour traffic
volume, speed, travel time, and/or queuing. Table 4 indicates which calibration data are
required for each analysis; however, the various calibration data requirements may be modified
at the discretion of the project manager. For example, the project manager may identify the 1070
need for a speed-delay run to supplement speed results. Lists of more detailed calibration
factors specifically applicable to CORSIM and VISSIM are provided in Appendix C.
Regardless of whether the desired network is deterministic or stochastic, calibration data is
required. For both types of networks, speed for uninterrupted flow facilities and queue length
for interrupted flow facilities are critical elements that are highly desirable for calibration. 1075
Although roadways and ramps have posted speed limits and associated design speeds, the most

Chapter 6 – Standard Requirements for Analyses
Traffic Operations Analysis Tool Guidebook Version 1.1
Page | 34
Table 4 – Standard Calibration Data Parameters
Analysis Categories / Standard Calibration
Assumptions
Peak Hour Traffic
Volume
Pedestrian and Bicycle
Travel Speeds
Mainline Speed Data
Ramp Speed Data
Toll Lane Processing Time
by Payment Choice
Travel Times
Queuing Data
Signalized Intersection, Stop-Controlled Intersection, and Arterial
Analyses
Signalized Intersection Preemption and Transit Priority Analyses
Roundabout Analyses Non-Traditional
Intersection/Interchange Analyses (SPUI, CFI, Displaced Left-Turn
Intersection)
Pedestrian and Bicycle Analyses (On- and Off-Street)
Freeway and Interchange Analyses (Merge, Diverge, Weave, and Collector-
Distributor)
Two-Lane Highway Analyses Multilane Highway Analyses Workzone Traffic Analyses
(Freeway or Arterial) Toll Plaza Analyses
Freeway HOV or Ramp Metering Analyses

Chapter 6 – Standard Requirements for Analyses
Traffic Operations Analysis Tool Guidebook Version 1.1
Page | 35
reliable data to calibrate freeway operations are speeds. Forty-eight consecutive hours of speed
data for each direction of travel should be collected in 15-minute intervals. The most reliable 1080
data to calibrate arterial operations are delay, travel time, and queues. Travel time and delay
runs should be conducted in the study corridor and queue lengths should be observed and
measured. As previously discussed, this data should be collected at the same time as the vehicle
classification counts.
Similar to the traffic count data, calibration data also has an age limit of 2 years from when the 1085
analysis is conducted. If the analysis is being performed on a future geometric network, then
design speeds should be used in lieu of collected data. For toll plaza analyses, speed data is not
required since travel speeds are dependent on the processing speeds of the individual toll lanes.
At least 4 hours of vehicle processing data for all available payment options should be
performed. 1090
Travel time and queuing data are not required for deterministic networks, but are necessary to
calibrate existing conditions in microsimulation networks. At least 10 travel time runs should be
collected along any predetermined routes during each peak period being analyzed. For example,
if AM and PM peak hour microsimulation analyses are to be performed, then there should be at
least 10 travel time runs performed during the AM peak and at least another 10 travel time runs 1095
performed in the PM peak. If a travel time runs are conducted, then they shall be conducted in
accordance with the procedures identified in the latest edition of the ITE Manual of
Transportation Engineering Studies.
Queuing data includes queue lengths resulting from constricting roadway network elements
such as intersections, lane drops, or construction zones. Queue lengths should be collected once 1100
every 5 minutes over the extent of time that queuing is known to occur.
Origin-destination (O-D) data can be used as another source of calibration data, although it is
not a mandatory data requirement. Based on extensive time impacts and associated costs with
collecting O-D data, it should only be required on a project if existing travel routes and turning
movements will be changed under future conditions. The methodology used for collecting O-D 1105
data should be determined at the discretion of the project manager (e.g., survey, license plate
survey, blue tooth, etc.) based on the budget and schedule constraints of the project. For
fiscally-constrained projects, there are cheaper nontraditional methodologies to collect this
data, such as probe data.
6.5 Roadway Design Impacts 1110
The VDOT Road Design Manual references traffic analysis results for use in determining various
geometric features of the highway. The key areas within the manual that reference the need for
traffic analyses are described in the sections that follow. More specifically, the use of traffic
analysis tools for determining left- and right-turn storage lengths and the use of traffic analysis
tools to quantify the impacts of access management improvements are described in Appendix F 1115
of the VDOT Road Design Manual.

Chapter 6 – Standard Requirements for Analyses
Traffic Operations Analysis Tool Guidebook Version 1.1
Page | 36
6.5.1 Determination of Roadway Design
The VDOT Road Design Manual (Section 2B–3 Determination of Roadway Design) recommends
that the results of a capacity analysis be used to determine the number of through lanes on the
mainline. Roadway capacities for connecting and crossing roadways should also be determined, 1120
taking into consideration plans for future improvements to these facilities.
Where at-grade intersections are proposed, along with other analyses, a capacity analysis
should also be completed to determine whether or not the intersection will operate at a
satisfactory level of service. If the analysis indicates an unsatisfactory service level, mitigating
measures such as an interchange should be considered. When interchanges are proposed, or 1125
are being considered, a capacity analysis should be used to determine the interchange
configuration required. For the roadway to meet future design year level of service
requirements, a full interchange analysis should be performed.
Considering the case when intersecting streets do not materially impact the capacity results,
HCS should be used to determine the number of lanes on the arterial. If the number of 1130
intersecting streets becomes an issue, then Synchro should be used to determine the number of
lanes on the arterial, especially when the roadway is located within an urban environment. If
Synchro is unable to model the roadway configuration, a microsimulation tool should be used
(i.e., CORSIM or VISSIM).
6.5.2 Turn Lanes 1135
According to the VDOT Road Design Manual - Appendix F (Figure 3-1 and Figure 3-4), the
determination of the need for and the dimensions of left- and right-turn lanes should be based
on traffic volumes and a traffic operations analysis. For oversaturated conditions,
microsimulation should be used to determine the queue length (in feet). The results of the
analysis should be summarized in the format(s) described in Chapter 9 or in similar graphical 1140
formats acceptable to the project manager.
To determine the length of queue turn lanes, results should be derived from Synchro, SimTraffic,
CORSIM, and/or VISSIM depending on the complexity of the project and the preference of the
project manager. Due to the complexity of computing queue length, it is preferred, but not
required, that one of the three approved traffic simulation tools be used to estimate the queue 1145
length. The project manager will require that the back of queue (or maximum queue) to be
reported; however, the entire impact of the queue must be determined by determining the
impacts of spillback if it is applicable.
The impacts of queue spillback are accounted for differently in the various traffic simulation
tools. For example, when queue spillback occurs in SimTraffic, vehicles not accounted for in the 1150
95th percentile queue are identified by a queuing penalty. In this case, the additional number of
vehicles identified in the queuing penalty should be multiplied by an average vehicle length of
25 feet. This product should then be added to the back of queue to derive the total estimated
queue length. The overall queue length results from CORSIM and VISSIM should be derived by
adding the maximum queues from the link including the turn lane to the associated queues on 1155

Chapter 6 – Standard Requirements for Analyses
Traffic Operations Analysis Tool Guidebook Version 1.1
Page | 37
upstream links, if applicable. The results of the analysis should be summarized in the format(s)
described in Chapter 9 or in similar graphical format acceptable to the project manager.
According to the VDOT Road Design Manual - Appendix F (Figure 3-1), when dual left-turn lanes
are required, a capacity analysis of the intersection should be performed to determine what
traffic controls are necessary (i.e., signal phasing and timing modifications) for the dual left-turn 1160
lane to function properly. Depending on the traffic conditions at the intersection (assumed to be
a signalized intersection), either Synchro/SimTraffic is the preferred method of analysis. The
same procedure should be followed if dual right-turn lanes are required.
The results of the overall intersection analysis, in terms of delay per vehicle, should be
summarized and compared to the delay thresholds established for that jurisdiction. In addition, 1165
the queue length for the turn lanes should be computed and compared to the proposed length
of the turn lanes to determine if the storage and taper lengths are adequate. The results of the
analysis should be summarized in the format(s) described in Chapter 9 or in similar graphical
formats acceptable to the project manager
6.5.3 Access Management Impacts 1170
In addition, traffic analyses are required to determine the impacts of access management
improvements according to the VDOT Road Design Manual - Appendix F. Pertaining to
intersection analyses with respect to access management, the document states the following:
“A Highway Capacity Manual (HCM) capacity or other appropriate analysis (Synchro/CORSIM)
should be performed for intersection capacity and signalization requirements, and include a 1175
queuing analysis.”
6.5.3.1 Crossover Spacing
According to the VDOT Road Design Manual - Appendix F, new crossovers not meeting current
VDOT crossover spacing standards will only be allowed if approved by the VDOT District Land
Use Engineer. This analysis should be conducted using HCS or Synchro in undersaturated traffic 1180
conditions to determine if the crossover functions from an overall delay standpoint during the
two weekday peak periods. During saturated traffic conditions, either VISSIM or CORSIM can be
used to determine the delay and queuing impacts of the new crossover. The results of the
analysis should be summarized in the format(s) described in Chapter 9 or in similar graphical
formats acceptable to the project manager. 1185
6.5.3.2 Traffic Signal Spacing
According to the VDOT Road Design Manual – Appendix F, efficient traffic progression is
essential on arterials to maximize safety and capacity. To determine if a proposed traffic signal is
negatively impacting traffic progression, a traffic analysis should be conducted using Synchro in
conjunction with SimTraffic, since it has the capability of analyzing an optimized traffic signal 1190
network. Depending on the complexity of the roadway system to be analyzed, the project
manager may require additional traffic signal analysis software to be used. The results of the
analysis should be summarized in the format(s) described in Chapter 9 or in similar graphical
formats acceptable to the project manager.

Chapter 7 – Standard Assumptions for Tools
Traffic Operations Analysis Tool Guidebook Version 1.1
Page | 38
If a particular program input is
not included in the proceeding
chapters, then it was agreed
that the default values should
be maintained in all analyses.
7 Standard Assumptions for Tools 1195
Each traffic analysis tool evaluated in this guidebook has its own set of unique inputs. Although
the inputs have varying levels of impact on the operational results, it is critical that clear
guidance to be established for each input. This guidebook describes the most frequently used
inputs for each analysis tool, regardless of the type of analysis.
The following sections of this chapter will detail 1200
the assumptions behind the inputs used for HCS,
Synchro, SimTraffic, SIDRA Intersection, CORSIM,
and VISSIM. The inputs used for Quickzone
analyses should be agreed upon by the project
manager. If a particular program input is not 1205
discussed in this chapter, then the default values
should be used for all analyses. Any deviation from the following guidelines will require written
documentation and justification prior to being reviewed by the project manager.
7.1 HCS 2010
The HCS 2010 software is comprised of many different modules to evaluate various geometric 1210
configurations. This guidebook covers the following HCS 2010 modules:
1. Freeways
2. Weaving
3. Ramps
4. Facilities 1215
5. Multilane
6. Two-Lane
7. Streets
8. Unsignalized (TWSC and AWSC)
9. Signals 1220
TWSC represents two-way stop-controlled intersections and AWSC represents all-way stop-
controlled intersections.
Similar default values are utilized for the various HCS 2010 uninterrupted flow modules as
shown in Table 5
Table 5a and Table 5b. Parameters such as traffic volume, peak hour factor, and grade are 1225
applicable to multiple modules. The standard HCS parameters for freeways, inclusive of those
mentioned above, are described within the following text and are also shown in Table 5a in
Section 7.1.1. To reduce redundancy for describing these parameters in multiple sections, only
the descriptions of the parameters differing from documentation in Section 7.1.1 are described
in the subsequent sections of Section 7.1. For example, since all default values for weaving 1230

Chapter 7 – Standard Assumptions for Tools
Traffic Operations Analysis Tool Guidebook Version 1.1
Page | 39
sections are the same as freeways except for the mainline free-flow speed, only mainline free-
flow speed for weaving sections is further described in Section 7.1.2.
Table 5a – HCS 2010 Standard Parameters
MODULE HCS
PARAMETER TYPICAL VALUE, ACCEPTABLE RANGES,
and/or SPECIAL NOTES
Merge/Diverge/Weave/Freeway/Facilities/ Multilane/Two-Lane/Signals/Unsignalized
Traffic Volume
Use a 60-minute peak hour traffic volume.
Merge/Diverge/Weave/Freeway/Facilities/ Multilane/Two-Lane/Signals/Unsignalized
Peak Hour Factor
Use existing count data for existing analyses. For future year analyses, the PHF should be
calculated based on future land use. If that is not possible, then use 0.92 or existing
whichever is higher.
Merge/Diverge/Weave/Freeway/ Facilities/Multilane/Two-Lane
Grade Use the existing grade, if available. If it is not available, use 0-2% for level, 2-4% for rolling,
and 4%+ for mountainous.
Merge/Diverge
Mainline Free-Flow
Speed
Use existing data. If it is not available, use posted speed limit + 7 mph.
Analysis will not allow less than 55 mph or greater than 70 mph.
Weave Segment
Use existing data. If it is not available, use posted speed limit + 7 mph.
Analysis will not allow less than 35 mph or greater than 80 mph.
Freeway Segment
Use existing data. If it is not available, use posted speed limit + 7 mph and apply the
necessary adjustments. Analysis will not allow less than 55 mph or greater than 75 mph.
Facilities
Use existing data. If it is not available, use posted speed limit + 7 mph.
Analysis will not allow less than 55 mph or greater than 75 mph.
Multilane/Two-Lane
Use existing data. If it is not available, use posted speed limit + 7 mph and apply the
necessary adjustments. Analysis will not allow less than 45 mph or greater than 60 mph.
Merge/Diverge/Weave/Freeway/ Facilities/Multilane/Two-Lane
Truck, Bus, and RV Equivalent
Factors Should be based on HCM tables.
Merge/Diverge/Weave/Freeway/Facilities Multilane/Unsignalized/Two-Lane
Truck, Bus, and RV Percentages
Use existing count data. For future analyses, use existing values or 2%, whichever is greater.
Merge/Diverge
Number of Lanes
Analysis will not allow less than 2 lanes.
Facilities Analysis will not allow less than
2 lanes or greater than 5 mainline lanes.
Multilane Analysis will not allow less than 2 lanes or
greater than 3 mainline lanes.
Multilane/Two-Lane Lane
Widths Use existing data. Acceptable range is between
10 and 12 feet.

Chapter 7 – Standard Assumptions for Tools
Traffic Operations Analysis Tool Guidebook Version 1.1
Page | 40
Table 5b – HCS 2010 Standard Parameters 1235
MODULE HCS PARAMETER TYPICAL VALUE, ACCEPTABLE RANGES, and/or
SPECIAL NOTES
Two-Lane Shoulder Widths
Use existing data. Shoulder widths greater than 6 feet should be recorded as 6 feet.
Multi-Lane Lateral
Clearance Use existing data. Lateral clearances greater than 6 feet should
be recorded as 6 feet.
Two-Lane Percent
No Passing Zones Use existing data.
Multi-Lane/Two-Lane Access Point
Density
Use existing data recorded in access points per mile in both directions. More than 40 access points per mile should be
recorded as 40 access points per mile.
Signalized Intersection Analysis Type Use single period.
Signalized Intersection Turn-Lane
Storage Length Use effective storage length (storage length + half taper
length).
Signalized Intersection Operating
Parameters Use default values.
Signalized Intersection Traffic Signal
Timing
Use existing data for existing analyses. If it is not available, measure it in field during the peak hour. For future analyses,
use optimized signal timings.
Signalized Intersection Minimum
Green Use existing data for existing analyses. For future analyses,
typically use 5 seconds (based on VDOT preferences).
Signalized Intersection Yellow Use existing data for existing analyses. For future analyses, use
a minimum of 3 seconds (based on VDOT clearance interval standards).
Signalized Intersection All-Red Use existing data for existing analyses. For future analyses, use a minimum of 1 second (based on latest VDOT Yellow Change
Intervals and Red Clearance Intervals Memo).
Signalized Intersection Base Saturation
Flow Rate Use 1,900 passenger cars per hour per lane (pcphpl).
Unsignalized Intersection Critical Gap and Follow-Up Time
Use default values.
Unsignalized Intersection Pedestrian
Walking Speed Use 4.0 feet per second.
Unsignalized Intersection Base Saturation
Flow Rate Use 1,700 vehicles per lane (only valid if upstream signalized
intersection exists).
Merge/Diverge/Facilities Ramp Free-Flow
Speed
Use existing data. If it is not available, use either the design speed or warning speed + 10 mph. Analysis will not allow less
than 10 mph or greater than 70 mph.
Merge/Diverge/Facilities Accel/Decel Lane Length
1,500 feet maximum. If it is longer, then use the maximum value of 1,500 feet.
Merge/Diverge/Weave/ Freeway/Facilities/Multilane
Driver Population Adjustment Factors
Use default (1.00).
Facilities Capacity
Adjustment Factors Use default (1.00).
Facilities O-D Demand
Adjustment Factors Use default (1.00). Only modify default if conducting a
sensitivity analysis at ramps.
Merge/Diverge Capacity Checks If any of the capacity checks are "Yes", then a microsimulation
tool should be used.

Chapter 7 – Standard Assumptions for Tools
Traffic Operations Analysis Tool Guidebook Version 1.1
Page | 41
7.1.1 Freeways
Traffic Volume: Traffic volumes shall be entered as a 60-minute interval.
Peak Hour Factor: PHF should be determined based on existing traffic count data. For existing analyses, PHFs shall be computed from existing count data. For future 1240
year analyses, the PHF should be calculated based on future land use. If that is not possible, then use 0.92 or existing whichever is higher.
Grade: Grades should be based on existing data or existing design plans. If neither of these two sources are available, then the following ranges from the HCM 2010 should be used: 1245
Level Terrain (L): 0-2% Rolling Terrain (R): 2-4% Mountainous Terrain (M): 4-6%
Mainline Free-Flow Speed: Free-flow speed should be based on existing data. If existing data is not available, then a base free-flow speed equal to the posted speed 1250
limit +7 mph should be used, with the necessary HCM speed adjustments then being applied to determine a free-flow speed. HCS 2010 will not allow any measured free-flow speeds less than 55 mph or greater than 75 mph.
Heavy Vehicle Percentages: HVPs should be based on existing count data. For future analyses, existing HVP shall be used, but if that is not available, use a 1255
minimum of 2%. HCS 2010 will not allow a truck percentage greater than 25%.
Heavy Vehicle Equivalent Factors: These factors should be based on what is provided in Chapter 11 of the HCM 2010.
Driver Population Adjustment Factors: HCS 2010 default value of 1.0 should not be modified; however, adjustments ranging between 0.85 and 1.0 can be made as long 1260
as technical justification is provided about why the adjustment is necessary.
7.1.2 Weaving
Mainline Free-Flow Speed: Mainline free-flow speeds less than 35 mph or greater than 80 mph are not allowed in HCS 2010.
7.1.3 Ramps 1265
Number of Lanes: HCS 2010 will not allow less than two mainline lanes.
Mainline Free-Flow Speed: Mainline free-flow speeds less than 55 mph or greater than 70 mph are not allowed in HCS 2010.
Ramp Free-Flow Speed: Free-flow speed should be based on existing data. If existing data is not available, then a free-flow speed equal to the design/warning 1270
speed limit +10 mph should be used. Ramp free-flow speeds less than 10 mph or greater than 70 mph are not allowed in HCS 2010.
Acceleration/Deceleration Lane Lengths: HCS 2010 will not accept any length greater than 1,500 feet. For situations where either an acceleration or deceleration lane is longer than 1,500 feet, then a default value of 1,500 feet should be used. 1275

Chapter 7 – Standard Assumptions for Tools
Traffic Operations Analysis Tool Guidebook Version 1.1
Page | 42
If any capacity checks fail,
then the ramp analysis cannot
be completed for that ramp
junction, since oversaturated
conditions are present.
Therefore, another analysis
tool should be used.
Capacity Checks: HCS 2010 performs various capacity checks for ramp analysis. Prior to reporting any results from the software, each capacity check should be verified to 1280
be satisfactory. If any capacity checks fail, then the ramp analysis cannot be completed for that ramp junction, since oversaturated conditions are present. Therefore, 1285
another analysis tool should be used.
7.1.4 Facilities
Number of Lanes: HCS 2010 will not allow less than two or greater than five mainline lanes.
Traffic Volume: Traffic volumes should be entered in 15-minute intervals. 1290
Ramp Free-Flow Speed: Free-flow speed should be based on existing data. If existing data is not available, then a free-flow speed equal to the design/warning speed limit +10 mph should be used. HCS 2010 will not allow any ramp free-flow speeds less than 10 mph or greater than 70 mph.
Heavy Vehicle Equivalent Factors: These factors should be based on HCM 1295
standards.
Acceleration/Deceleration Lane Lengths: All acceleration and deceleration lanes should be less than 1,500 feet. For situations where either an acceleration or deceleration lane is longer than 1,500 feet, then a value of 1,500 feet should be used. 1300
Capacity Adjustment Factor: HCS 2010 default value of 1.0 should not be modified, unless specific technical justification can be provided as to why standard HCM capacity should be modified.
Origin/Destination Demand Adjustment Factors: HCS 2010 default value of 1.0 should not be modified, and is typically only used for sensitivity analyses at ramps. If 1305
being used for a sensitivity analysis, technical justification should be provided to support any modification.
7.1.5 Multilane
Number of Lanes: HCS 2010 will not allow less than two or greater than three mainline lanes. 1310
Mainline Free-Flow Speed: HCS 2010 will not allow any measured free-flow speeds less than 45 mph or greater than 60 mph.
7.1.6 Two Lane
Classification Type: HCS 2010 requires the selection of one of three classifications, which is based on the function of the roadway. Class I and Class II address rural two-1315
lane highways; whereas, Class III addresses two-lane highways in developed areas.

Chapter 7 – Standard Assumptions for Tools
Traffic Operations Analysis Tool Guidebook Version 1.1
Page | 43
Shoulder Width: HCS 2010 will allow values between 0 to 99.9 feet in primary direction of analysis, but values greater than 6 feet do not reduce capacity.
Lane Width: HCS 2010 will allow values between 9 to 99.9 feet width, but values greater than 12 feet do not reduce capacity. 1320
Access Point Density: HCS 2010 will all values between 0 to 40 access points per mile (total in both directions).
Percent No Passing Zones: HCS 2010 will all values between 0 to 100 percent no passing zones, but values less than 20% will not reduce capacity.
7.1.7 Signals 1325
Analysis Type: HCS 2010 allows two different analyses – “Single Period” or “Multiple Period”. All signalized intersection analyses performed in HCS 2010 should be done in a “Single Period” setting. Technical justification is required for any consideration into multiple periods. Multiple Period analyses changes volumes to vehicles per period versus vehicles per hour and disables the ability to use PHFs. 1330
Traffic Volume: Traffic volumes should be entered as a 60-minute interval.
Turn-Lane Storage Length: As described in Chapter 5, an “effective storage length” should be used in all analyses, which is equal to the storage length plus half of the taper length. Storage lengths can be obtained from either existing field measurements or existing design plans for existing analyses and proposed design 1335
plans for all future analyses.
Operating Parameters: All “Operating Parameters” need to be discussed with the project manager prior to any analysis being performed. Technical justification is required for the modification of any HCS 2010 default parameters.
Traffic Signal Timing: Existing traffic signal timing information should be obtained 1340
from the entity that controls the traffic signal. If no information is available, existing traffic signal timing information should be measured in the field during peak hour operations or at a time agreed upon with the project manager. Existing traffic signal timings should be used for existing analyses and optimized traffic signal timings should be used for future analyses. 1345
Green Time: Use existing data for existing analyses. For future analyses, minimum green time can vary based on VDOT region/district preferences; however, the typical value should be 5 seconds. Any deviation from 5 seconds should be approved by the project manager prior to any analysis being performed. This minimum green time will be modified if a concurrent pedestrian phase exists. 1350
Yellow Time: Use existing data for existing analyses. For future analyses, yellow times should be consistent with current VDOT clearance interval standards identified in TE-306.1 (Traffic Signals – Yellow Change Intervals and Red Clearance Intervals) with a minimum of 3 seconds.
All-Red Time: Use existing data for existing analyses. For future analyses, all-red 1355
times should be consistent with current VDOT clearance interval standards identified in TE-306.1 (Traffic Signals – Yellow Change Intervals and Red Clearance Intervals) with a minimum of 1 second.

Chapter 7 – Standard Assumptions for Tools
Traffic Operations Analysis Tool Guidebook Version 1.1
Page | 44
To perform the arterial
analysis, intersection analysis
inputs are imported and a
separation distance (in miles)
is entered for this module to
analyze the arterial.
Ideal Saturation Flow Rate: The HCM 2010 recommends a default value of 1,900 passenger cars per hour per lane (pcphpl), which is the default value used by HCS 1360
2010. The “Adjusted Saturated Flow Rate” will be determined by adjustment factors, which are based on user input in this module. If a field-measured saturation flow rate is available, then enter that value into the Ideal Saturation Flow Rate field and do not change any default values for the adjustment factors. This approach will maintain the value entered into the Ideal Saturation Flow Rate field as the Adjusted 1365
Saturation Flow Rate.
7.1.8 TWSC and AWSC
Critical Gap and Follow-Up Time Parameters: All “Critical Gap” and “Follow-Up Time Parameters” need to be discussed with the project manager prior to any analysis being performed. Technical justification is required for the modification of 1370
any HCS 2010 default parameters.
Pedestrian Walking Speed: HCS 2010 default value of 4.0 feet per second should not be modified unless technical justification is provided.
Saturation Flow Rate per Lane: This input is only valid if there is an upstream signalized intersection. HCS 2010 default value of 1,700 vehicles per lane should not 1375
be modified unless technical justification is provided as to why the adjustment is necessary.
7.1.9 Streets
Arterial analyses can only be performed once
individual intersection analyses have been 1380
completed. To perform an arterial analysis,
intersection analysis inputs are imported and a
separation distance (in miles) is entered for this
module to analyze the arterial.
7.2 Synchro 1385
There are three different types of inputs detailed below for Synchro:
1. Geometric/Analytical Inputs 2. Signal Timing Inputs 3. Pedestrian, Parking, and Bus Inputs
The inputs considered for each category are described in more detail below and are summarized 1390
in Table 6.

Chapter 7 – Standard Assumptions for Tools
Traffic Operations Analysis Tool Guidebook Version 1.1
Page | 45
Table 6 – Synchro Standard Parameters
SYNCHRO PARAMETER
TYPICAL VALUE, ACCEPTABLE RANGES, and/or SPECIAL NOTES
Model Output Synchro results for signal optimization. HCM methodology results for all other
operational analyses.
Traffic Volume 60-minute interval.
Peak Hour Factors Use existing count data for existing analyses. For future year analyses, the PHF
should be calculated based on future land use. If that is not possible, then use 0.92 or existing whichever is higher.
Heavy Vehicle Percentages
Use existing count data. For future analyses, existing HVP shall be used, but if that is not available, use a minimum of 2%.
Link Speed Use existing data. If it is unavailable, use posted speed limits for existing analyses.
For future analyses, use posted speeds + 7 mph.
Grade Use the existing grade, if available. If it is not available, use 0-2% for level,
2-4% for rolling, and 4%+ for mountainous.
Link Distance Links should be continuous through areas of consistent lane configuration and should be
long enough to incorporate the 95th percentile queue depicted in SimTraffic.
Lane and Median Widths
Should be based on field measurements or design plans.
Storage Length (Turn Lanes)
Use effective storage length (existing storage length plus half taper length).
Right-Turn Lane Channelization
None, Yield, Free, Stop with existing or appropriate curb radii for all choices other than "None".
Signal Timing (Cycle Length)
Use existing data for existing analyses. Typically 60-240 seconds (based on VDOT region/district preferences).
Signal Timing (Minimum Green)
Use existing data for existing analyses. For future analyses, typically use 5 seconds (based VDOT region/district preferences).
Signal Timing (Yellow)
Use existing data for existing analyses. For future analyses, use a minimum of 3 seconds (based on latest VDOT Yellow Change Intervals and Red Clearance Intervals Memo).
Signal Timing (All-Red)
Use existing data for existing analyses. For future analyses, use a minimum of 1 second (based on latest VDOT Yellow Change Intervals and Red Clearance Intervals Memo).
Signal Timing (Walk)
Use existing timings when applicable. For future analyses, calculate new time based on MUTCD requirements.
Signal Timing (Flashing Don’t Walk)
Use existing timings when applicable. For future analyses, calculate new time based on MUTCD requirements.
Signal Timing (Offsets)
Use existing timings when applicable. For future analyses, offsets should be developed from the Synchro time-space diagram.
Left-Turn Phasing All future left-turn phasing alternatives should be discussed with and
approved by the VDOT Project Manager prior to analysis.
Conflicting Pedestrians/Bicycles
Should always be considered and based on existing data from a one-hour interval.
Bus Blockages Should only be considered when there is a minimum of 6 blockages per hour.
Parking Maneuvers Should only be considered when there is a minimum of 50 maneuvers per hour
in urban and CBD areas.

Chapter 7 – Standard Assumptions for Tools
Traffic Operations Analysis Tool Guidebook Version 1.1
Page | 46
7.2.1 Geometric/Analytical Inputs
Model: Synchro allows the user to obtain results in both Synchro and HCM methodology formats. As detailed in Chapter 3, the HCM model shall be used for all 1395
operational analyses in Synchro, except for when the tool is used for signal optimization projects. Although HCM results can be obtained from the HCS software, the Synchro interface is much more efficient to use when compared to HCS 2010, especially since the tool will automatically optimize traffic signal timings, and is simulation-ready for use in SimTraffic. 1400
Traffic Volume: Traffic and pedestrian volumes shall be entered as a 60-minute interval.
Peak Hour Factors: PHF should be determined by approach based on existing traffic count data. Project managers will be responsible for identifying any case-by-case scenarios where PHF shall be required for each movement. For existing analyses, 1405
PHFs shall be computed from existing count data. For future year analyses, the PHF should be calculated based on future land use. If that is not possible, then use 0.92 or existing whichever is higher.
Heavy Vehicle Percentages: HVP should be determined by movement based on existing traffic count data. For future analyses, existing HVP shall be used, but if that 1410
is not available, use a minimum of 2%.
Link Speed: Link speeds should be obtained from existing field data. If existing speed data is not available, the link speed in the model should be the posted speed limit plus 7 mph. For future year analyses, the proposed posted speed plus 7 mph should be used. 1415
Grade: Grades should be based on existing data or existing design plans. If neither of these two sources are available, then the following ranges from the HCM 2010 should be used:
Level Terrain (L): 0-2% Rolling Terrain (R): 2-4% 1420
Mountainous Terrain (M): 4-6%
Link Distance: Link lengths should represent existing link lengths. Links should be continuous through areas of consistent lane configuration. Links should be broken at each intersection or at a change in the number lanes (e.g., lane drop). Links must be long enough to contain the queue determined from field measurements, if 1425
available, or the 95th percentile queue from SimTraffic, if microsimulation is required.
Lane and Median Widths: All lane and median widths should be based on either existing field measurements or existing design plans for existing analyses and from proposed design plans for all future analyses. 1430
Turn-Lane Storage Length: As described in Chapter 6, an “effective storage length” should be used in all analyses, which is equal to the storage length plus half of the taper length. Storage lengths can be obtained from either existing field measurements or existing design plans for existing analyses and proposed design plans for all future analyses. 1435

Chapter 7 – Standard Assumptions for Tools
Traffic Operations Analysis Tool Guidebook Version 1.1
Page | 47
Existing signal timings should
be used for existing analyses
and optimized timings should
be used for future analyses.
Right-Turn Lane Channelization: Right-turn channelization shall be identified for all right-turn movements (Free, Yield, Stop, or None), with the appropriate curb radii provided for all selections other than “None”. Curb radii should be determined from either existing field measurements or existing design plans for existing analyses and proposed design plans for all future year analyses. 1440
7.2.2 Signal Timing Inputs
Existing signal timing information should be
obtained from the entity that controls the traffic
signal. If not available, existing signal timing and
offsets information should be measured in the 1445
field during the peak hour(s) of operation or as
agreed upon with the project manager based on documentation. Existing signal timings should
be used for existing analyses and optimized timings should be used for future analyses.
Cycle Length: Cycle lengths can vary based on VDOT region/district preferences; however, typical values should range between 60 and 240 seconds. Existing cycle 1450
lengths from the field should be used in existing analyses. Cycle lengths used in future analyses should be agreed upon with the project manager prior to any analysis being performed taking into account the system cycle lengths for intersections within a corridor.
Minimum Green Time: Use existing data for existing analyses. For future analyses, 1455
minimum green time can vary based on VDOT region/district preferences; however the typical value should be 5 seconds. Any deviation from 5 seconds should be approved by the project manager prior to any analysis being performed. This minimum green time will be modified if a concurrent pedestrian phase exists.
Lost Time Adjustment: Lost Time Adjustment is not the same as lost time. Lost time 1460
is equal to the extension of effective green time (2.5 seconds) subtracted from the sum of yellow time, all red time, and startup lost time (2.5 seconds). Evaluating this expression, lost time simply results in the sum of yellow time and all-red time. The Lost Time Adjustment is defaulted at -2 seconds in Synchro, and accounts for those vehicles that continue to enter the intersection during the yellow time. The default 1465
value of -2 seconds should not be modified unless the project manager approves the adjustment. Technical justification must accompany the request to adjust the factor.
Yellow Time: Use existing data for existing analyses. For future analyses, yellow times should be consistent with current VDOT clearance interval standards with a minimum of 3 seconds (based on latest VDOT Yellow Change Intervals and Red 1470
Clearance Intervals Memo).
All-Red Time: Use existing data for existing analyses. For future analyses, all-red times should be consistent with current VDOT clearance interval standards with a minimum of 1 second (based on latest VDOT Yellow Change Intervals and Red Clearance Intervals Memo). 1475
Offsets: Use existing data for existing analyses. For future analyses, offsets should be optimized from the Synchro developed time-space diagrams.

Chapter 7 – Standard Assumptions for Tools
Traffic Operations Analysis Tool Guidebook Version 1.1
Page | 48
For roundabout
analyses conducted with
SIDRA Intersection, use
the SIDRA model.
Left-Turn Phasing: Existing left-turn phasing should be used for existing analyses. For all future left-turn phasing alternatives, proposed left-turn phasing should be agreed to by the project manager prior to any operational analysis being performed. 1480
7.2.3 Pedestrian, Parking, and Bus Inputs
“WALK” Time: Existing “WALK” time data should be used for existing analyses. If existing timing is not available and for all future analyses, “WALK” time should be developed based on latest MUTCD standards.
Flash “DON’T WALK” Time: Existing flash “DON’T WALK” time data should be used 1485
for existing analyses. If existing timing is not available and for all future analyses, “DON’T WALK” time should be developed based on MUTCD standards.
Conflicting Pedestrians/Bicycles: This parameter should always be considered in the analyses and be based on existing data for a one-hour interval.
Bus Blockages: This parameter should only be considered when there is a minimum 1490
of 6 blockages per hour (approximately 1 every 10 minutes). Bus blockages only include stops that occur within 250 feet (upstream or downstream) from the stop bar of an approach, as shown in Figure 7.
Parking Maneuvers: This parameter should only be considered when there is a minimum of 50 maneuvers per hour and when the site is located within an urban or 1495
Central Business District (CBD).
Figure 7 – Bus Blockages to Include in Analysis
7.3 SIDRA Intersection
There are two models provided in SIDRA Intersection to 1500
analyze roundabouts, including SIDRA “Standard Right”
(referred to as “SIDRA Model”) and HCM Roundabout
(referred to as the “HCM Model”); however, only SIDRA
Model is accepted for VDOT roundabout analyses. Prior to coding the model, the user should set
the units to English units. The various inputs for this model are described below and are 1505
summarized in Table 7.
Model: Based on standard practice for analyzing roundabouts in Virginia, the SIDRA Model has been widely accepted as the preferred methodology; therefore, the SIDRA Model shall be used for roundabout analyses. Justification and written

Chapter 7 – Standard Assumptions for Tools
Traffic Operations Analysis Tool Guidebook Version 1.1
Page | 49
approval from the project manager is required for using the HCM Model. Prior to 1510
using the model, the user should change the units to English units.
Traffic Volume/Peak Flow Period: All traffic and pedestrian volumes shall be entered as a single 60-minute interval with 15-minute peak flow periods.
Grade: This parameter only affects fuel consumption results and can be left at 0% for operational analyses. 1515
Basic Saturation Flow Rate: 1,900 through car units per hour (tcu/hr) should be used.
Table 7 – SIDRA Intersection Standard Parameters
SIDRA Intersection PARAMETER
TYPICAL VALUE, ACCEPTABLE RANGES, and/or SPECIAL NOTES
Model Use SIDRA “Standard Right" Roundabout Model.
Traffic Volume/ Peak Flow Period
Use 60-minute peak traffic volume with 15-minute peak flow periods.
Peak Hour Factors Use existing count data. For future year analyses, the PHF should be calculated
based on future land use. If that is not possible, then use 0.92 or existing whichever is higher.
Heavy Vehicle Percentages
Use existing count data. For future analyses, existing HVP shall be used, but if that is not available, use a minimum of 2%.
Grade This parameter only affects fuel consumption/estimate results and should
be 0% for basic operational analyses.
Basic Saturation Flow Rate
Use 1,900 tcu/h.
Flow Scale Use default (100%). This parameter should only be used in sensitivity
analyses for particular movements.
Practical Degree of Saturation
Use default (0.85, based on FHWA).
Vehicle Occupancy Use default (1.2 persons/vehicle).
Maximum Number of Circulating Lanes
Use existing number of lanes up to 2 lanes.
Extra Bunching See SIDRA Intersection Help File for acceptable ranges and/or values as described
in text.
Environmental Factor Use default (1.2).
Pedestrians Use existing count data. If data is not available, SIDRA Intersection recommends
using 400 ped/h for CBD areas and 50 ped/h for all other areas.
Approach Lane and Circulating Lane Widths
Use existing field measurements for existing analyses and proposed design plans for future analyses.
Island Diameter Use existing field measurements for existing analyses and
proposed design plans for future analyses.
Entry Radius and Entry Angles
Use existing field measurements for existing analyses and proposed design plans for future analyses.

Chapter 7 – Standard Assumptions for Tools
Traffic Operations Analysis Tool Guidebook Version 1.1
Page | 50
Peak Hour Factors: PHF should be determined by approach based on existing traffic count data. Project managers will be responsible for identifying any case-by-case 1520
scenarios where PHF shall be required for each movement. For existing analyses, PHFs shall be computed from existing count data. For future year analyses, the PHF should be calculated based on future land use. If that is not possible, then use 0.92 or existing whichever is higher.
Heavy Vehicle Percentages: Heavy Vehicle Percentages (HVP) need to be 1525
determined by movement based on existing count data. For future analyses, existing HVP shall be used, but if that is not available, use a minimum of 2%.
Flow Scale: This parameter can be used to depict “growth” in particular movements. This parameter should only be used or modified in cases where sensitivity analyses are being performed. 1530
Practical Degree of Saturation: This parameter is a key threshold supported by FHWA as the point at which a roundabout reaches capacity (similar to a volume-to-capacity ratio). FHWA recommends that a value of 0.85 be used for all roundabout analyses.
Vehicle Occupancy: Default value of 1.2 persons per vehicle should not be modified 1535
unless approved by the project manager based on technical justification.
Maximum Number of Circulating Lanes: Roundabouts are limited to no more than 2 circulating lanes.
Extra Bunching: This parameter should be used to account for traffic platoons and impacts from upstream traffic signals. Based on the SIDRA Intersection “Help” 1540
Manual, the following values should be used.
Distance to
Upstream
Signal (ft)
0 -
350
350 -
700
700 -
1,300
1,300 -
2,000
2,000 -
2,600 2,600+
Extra
Bunching % 25% 20% 15% 10% 5% 0%
Environmental Factor: Default value of 1.2 should be used and not be modified unless approved by the project manager based on technical justification. For existing conditions analyses, VDOT standard practice is to use 1.2 for all districts other than Northern Virginia, in which 1.1 is used. For future conditions analyses, 1545
VDOT standard practice is to use 1.1 for all districts other than Northern Virginia, in which 1.05 is used.
Pedestrians: This parameter should always be considered and should be a 60-minute interval taken from existing count data. If count data is not available, SIDRA Intersection recommends using 400 pedestrians per hour for locations in the CBD 1550
and 50 pedestrians per hour for all other areas.
Approach Lane and Circulating Lane Widths: All lane widths should be representative of either existing field measurements or existing design plans for existing analyses and proposed design plans for all future analyses. The entry lane width should be a maximum of 15 feet. 1555

Chapter 7 – Standard Assumptions for Tools
Traffic Operations Analysis Tool Guidebook Version 1.1
Page | 51
Island Diameter: All center island diameters should be based on either existing field measurements or existing design plans for existing analyses and proposed design plans for all future analyses.
Entry Radii and Entry Angles: All entry radii and angles should be based on either existing field measurements or existing design plans for existing analyses and 1560
proposed design plans for all future analyses.
7.4 CORSIM
CORSIM has many inputs that need to be considered. These inputs include analytical, geometric, and driver/vehicular characteristic components. Although the majority of these inputs have default values that should remain constant (unless technical justification is available), there are 1565
some that can and should be modified. The following information, which is summarized in Table 8, either details these specific inputs, or further emphasizes the necessity for technical justification for modifying particular critical inputs.
Entry Traffic Volumes (Flows): Traffic volume intervals will vary by project; however, a minimum of four 15-minute intervals should be used. If an hourly 1570
volume is over capacity, additional 15-minute intervals may be necessary, either before and/or after the peak hour of interest, to account for peak hour spreading.
Heavy Vehicle Percentages: HVPs should be based on existing count data. For future analyses, existing HVP shall be used, but if that is not available, use a minimum of 2%. 1575
Grade: Grades should be based on existing data or existing design plans. If neither of these two sources are available, then the following ranges from the HCM 2010 should be used:
Level Terrain (L): 0-2% Rolling Terrain (R): 2-4% 1580
Mountainous Terrain (M): 4-6%
Vehicle Entry Headway (Distribution Type): These distributions should be set to an Erlang Distribution with an “a” parameter equal to 1, which represents a negative exponential distribution, for networks with FRESIM dominance. A negative exponential distribution is commonly used for generating the inter-arrival time of 1585
vehicles to a system. Normal distribution should be set to a normal distribution for networks with NETSIM dominance.
Minimum Separation for Generation of Vehicles: This parameter adjusts capacity on all freeway links throughout the entire network. The CORSIM default value of 1.6 seconds should not be modified unless technical justification is provided as to why a 1590
network-wide adjustment is necessary. If individual freeway links have varying capacities, then Car Following Sensitivity Multipliers (CFSM) should be used.
Car Following Model: The CORSIM default model for freeways is the Pitt Model, which should not be modified unless technical justification is provided.
Freeway Free-Flow Speed: Freeway free-flow speed should be based on existing 1595
data. If existing data is not available, then a base free-flow speed equal to the posted speed limit +7 mph should be used. CORSIM will not allow any freeway free-flow speeds greater than 70 mph.
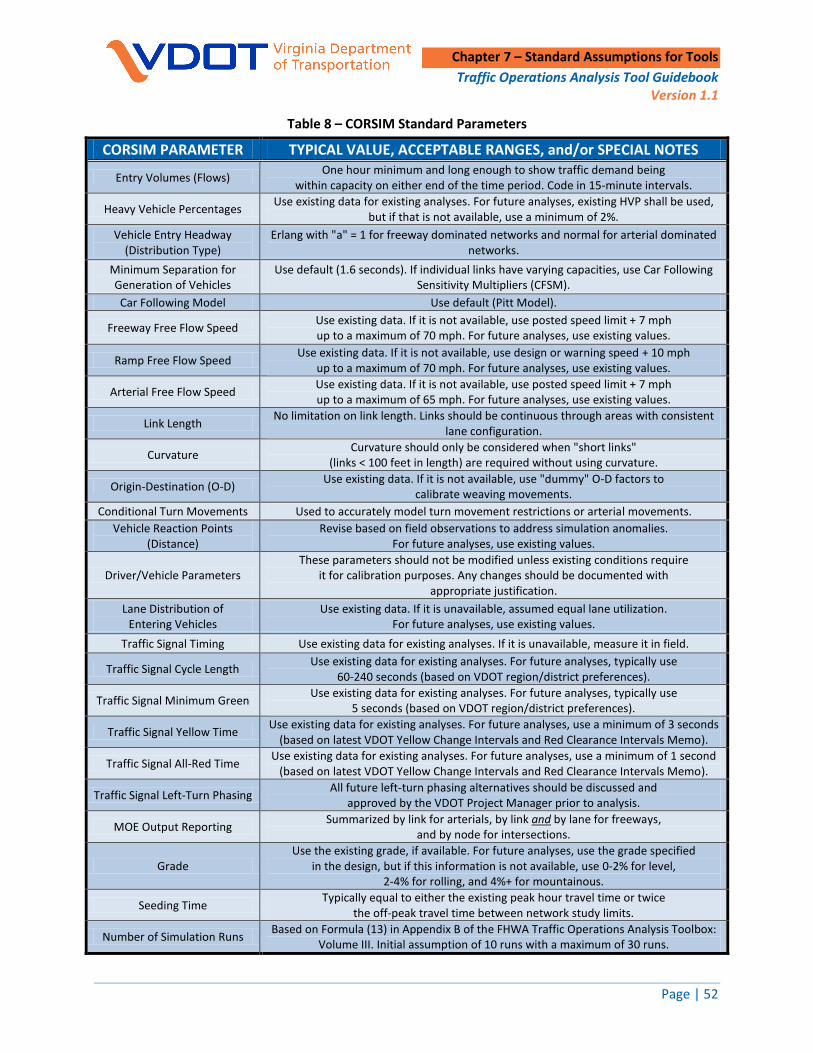
Chapter 7 – Standard Assumptions for Tools
Traffic Operations Analysis Tool Guidebook Version 1.1
Page | 52
Table 8 – CORSIM Standard Parameters
CORSIM PARAMETER TYPICAL VALUE, ACCEPTABLE RANGES, and/or SPECIAL NOTES
Entry Volumes (Flows) One hour minimum and long enough to show traffic demand being
within capacity on either end of the time period. Code in 15-minute intervals.
Heavy Vehicle Percentages Use existing data for existing analyses. For future analyses, existing HVP shall be used,
but if that is not available, use a minimum of 2%.
Vehicle Entry Headway (Distribution Type)
Erlang with "a" = 1 for freeway dominated networks and normal for arterial dominated networks.
Minimum Separation for Generation of Vehicles
Use default (1.6 seconds). If individual links have varying capacities, use Car Following Sensitivity Multipliers (CFSM).
Car Following Model Use default (Pitt Model).
Freeway Free Flow Speed Use existing data. If it is not available, use posted speed limit + 7 mph up to a maximum of 70 mph. For future analyses, use existing values.
Ramp Free Flow Speed Use existing data. If it is not available, use design or warning speed + 10 mph
up to a maximum of 70 mph. For future analyses, use existing values.
Arterial Free Flow Speed Use existing data. If it is not available, use posted speed limit + 7 mph up to a maximum of 65 mph. For future analyses, use existing values.
Link Length No limitation on link length. Links should be continuous through areas with consistent
lane configuration.
Curvature Curvature should only be considered when "short links"
(links < 100 feet in length) are required without using curvature.
Origin-Destination (O-D) Use existing data. If it is not available, use "dummy" O-D factors to
calibrate weaving movements.
Conditional Turn Movements Used to accurately model turn movement restrictions or arterial movements.
Vehicle Reaction Points (Distance)
Revise based on field observations to address simulation anomalies. For future analyses, use existing values.
Driver/Vehicle Parameters These parameters should not be modified unless existing conditions require
it for calibration purposes. Any changes should be documented with appropriate justification.
Lane Distribution of Entering Vehicles
Use existing data. If it is unavailable, assumed equal lane utilization. For future analyses, use existing values.
Traffic Signal Timing Use existing data for existing analyses. If it is unavailable, measure it in field.
Traffic Signal Cycle Length Use existing data for existing analyses. For future analyses, typically use
60-240 seconds (based on VDOT region/district preferences).
Traffic Signal Minimum Green Use existing data for existing analyses. For future analyses, typically use
5 seconds (based on VDOT region/district preferences).
Traffic Signal Yellow Time Use existing data for existing analyses. For future analyses, use a minimum of 3 seconds
(based on latest VDOT Yellow Change Intervals and Red Clearance Intervals Memo).
Traffic Signal All-Red Time Use existing data for existing analyses. For future analyses, use a minimum of 1 second
(based on latest VDOT Yellow Change Intervals and Red Clearance Intervals Memo).
Traffic Signal Left-Turn Phasing All future left-turn phasing alternatives should be discussed and
approved by the VDOT Project Manager prior to analysis.
MOE Output Reporting Summarized by link for arterials, by link and by lane for freeways,
and by node for intersections.
Grade Use the existing grade, if available. For future analyses, use the grade specified
in the design, but if this information is not available, use 0-2% for level, 2-4% for rolling, and 4%+ for mountainous.
Seeding Time Typically equal to either the existing peak hour travel time or twice
the off-peak travel time between network study limits.
Number of Simulation Runs Based on Formula (13) in Appendix B of the FHWA Traffic Operations Analysis Toolbox:
Volume III. Initial assumption of 10 runs with a maximum of 30 runs.

Chapter 7 – Standard Assumptions for Tools
Traffic Operations Analysis Tool Guidebook Version 1.1
Page | 53
Ramp Free-Flow Speed: Ramp free-flow speed should be based on existing data. If 1600
existing data is not available, then a free-flow speed equal to the design/warning speed limit +10 mph should be used. CORSIM will not allow any ramp free-flow speeds greater than 70 mph.
Arterial Free-Flow Speed: Arterial free-flow speed should be based on existing data. If existing data is not available, then a base free-flow speed equal to the posted 1605
speed limit +7 mph should be used. CORSIM will not allow any arterial free-flow speeds greater than 65 mph.
Curvature: This parameter should only be considered when “short links” (lengths less than 100 feet) are the only option to represent actual roadway curvature.
Link Length: Links should be continuous in areas of consistent lane configuration 1610
and be broken at each intersection. Typically, link lengths should range between 100 and 1,500 feet based on the length of influence areas defined for merge and diverge areas in the HCM 2010, but there is no limitation on link length.
Origin-Destination: This parameter should be used if O-D data is available. If actual O-D data is not available, then the O-D parameter should still be used to calibrate 1615
weaving movements on the freeway network to prevent inaccurate ramp-ramp movements.
Conditional Turn Movements: This parameter should be used to accurately model turning-movement restrictions (i.e., time-of-day left-turn prohibition). If turning movement restrictions are not present, this parameter should still be considered to 1620
calibrate arterial movements on the arterial network.
Vehicle Reaction Points (Distance): This parameter should be iteratively modified through simulation inspection to reflect existing travel conditions. In these cases, technical justification is not required; however, changes must be justified as a solution to an anomaly in the simulation. For future analyses, existing distances 1625
should be used unless modifications are required to help with calibrating the model.
Driver/Vehicle Parameters: These parameters should all remain consistent to the CORSIM default values. Technical justification is required before any modification can be considered.
Lane Distribution of Entering Vehicles: Both freeway and arterial lane distributions 1630
should be based on existing data. If existing data or other technical justification is not available, then equal distributions should be assumed. For future analyses, existing lane distributions should be maintained unless the network changes in way that will not permit the existing lane to distributions to be used.
Traffic Signal Timing: Existing traffic signal timing information should be obtained 1635
from the entity that controls the traffic signal. If not available, existing traffic signal timing information should be measured in the field during peak hour operations. Existing traffic signal timings should be used for existing analyses and optimized traffic signal timings should be used for future analyses.
Cycle Length: Cycle lengths can vary based on VDOT region/district preferences; 1640
however, typical values should range between 60 and 240 seconds. Use existing cycle lengths from the field in existing analyses taking into account the system cycle

Chapter 7 – Standard Assumptions for Tools
Traffic Operations Analysis Tool Guidebook Version 1.1
Page | 54
MOE Output Reporting
All arterial results should be
reported by link, all freeway
results should be reported by
link and by lane, and all
intersection results should be
reported by node.
lengths for intersections within a corridor. Cycle lengths used in future analyses should be agreed upon with the project manager prior to any analysis being performed taking into account the system cycle lengths for intersections within a 1645
corridor.
Minimum Green Time: Use existing data for existing analyses. For future analyses, minimum green time can vary based on VDOT region/district preferences; however, the typical value should be 5 seconds. Any deviation from 5 seconds should be approved by the project manager prior to any analysis being performed. 1650
Simulation Run Time: The simulation run time is the time it takes for the model to process the entire peak period.
Yellow Time: Use existing data for existing analyses. For future analyses, yellow times should be consistent with current VDOT clearance interval standards identified in TE-306.1 (Traffic Signals – Yellow Change Intervals and Red Clearance 1655
Intervals) with a minimum of 3 seconds.
All-Red Time: Use existing data for existing analyses. For future analyses, all-red times should be consistent with current VDOT clearance interval standards identified in TE-306.1 (Traffic Signals – Yellow Change Intervals and Red Clearance Intervals) with a minimum of 3 seconds. 1660
Left-Turn Phasing: Existing left-turn phasing should be maintained in all existing analyses. For all future left-turn phasing alternatives, proposed left-turn phasing shall be reviewed by the project manager prior to any analysis being performed.
MOE Output Reporting: All arterial results should be reported by link, all 1665
freeway results should be reported by link and by lane, and all intersection results should be reported by node. Also provide spreadsheet in electronic format for review. 1670
Lane-Change Parameters (Freeways Only): On heavily congested freeways, there are multiple lane-change parameters that may require adjustment to assist in the calibration process. These parameters include time to complete a lane-change maneuver (could be reduced 1675
from the default value of 20 seconds), percent of drivers desiring to yield right-of-way to lane-changing vehicles attempting to merge (could be increased from the default value of 20 percent), and mandatory lane-change gap acceptance parameter (could be reduced from the default value of 3 with 1 being the most aggressive and 6 being the least aggressive). 1680
Warning Sign Location (Freeways Only): The distance from downstream end of link to exit warning sign parameters default value of 2,500 feet can be increased to give vehicles more time to prepare for exiting the freeway. This factor aids in the calibration of freeway operations, especially under congested conditions.
Lane-Change Parameters (Arterials Only): On heavily congested arterials, there are 1685
multiple lane-change parameters that may require adjustment to assist in the
Chapter 7 – Standard Assumptions for Tools
Traffic Operations Analysis Tool Guidebook Version 1.1
Page | 55
calibration process. These parameters include duration of a lane-change maneuver (could be reduced from the default value of 3 seconds in a range of 1 to 8 seconds) and percentage of drivers who cooperate with a lane changer (could be increased from the default value of 50 percent). 1690
Seeding Time: The seeding time should be long enough to distribute traffic throughout the entire network. Typically, seeding times should be approximately equal to either the actual peak hour travel time or twice the off-peak travel time, when traversing from one end of the network to the other.
Number of Simulation Runs: The minimum number of simulation runs shall be 1695
based on Formula (13) in Appendix B of the FHWA Traffic Operations Analysis Toolbox Volume III up to a maximum of 30 runs. An initial assumption of 10 simulation runs, with different random number seeds, will be performed prior to applying the aforementioned formula and methodology.
7.5 VISSIM 1700
VISSIM is a complex microsimulation tool that allows for the flexibility to model a wide range of
traffic environments. The majority of its parameters have default values that should remain
constant (unless technical justification is provided). The following information describes the
specific settings, which are also summarized in Table 9 . These parameters have the greatest
impact on model behavior and adherence to VDOT standards. Prior to running the model, the 1705
user should change the units to English units.
Entry Traffic Volumes: Traffic volume intervals will vary by project; however, a minimum of four 15-minute intervals (1 hour) should be used. Additional 15-minute intervals are necessary to illustrate a time period where traffic demand begins and ends within capacity, refer back to Figure 1 for an illustrative example. 1710
Heavy Vehicle Percentages (Vehicle Compositions): HVPs should be based on existing count data. For future analyses, existing HVP shall be used, but if that is not available, use a minimum of 2%.
Arrival Distribution: Arrival distribution cannot be changed in VISSIM. However, the software developer suggests that all inputs be set to “Exact Volume” instead of the 1715
default of “Stochastic Volume” to reduce the number of simulation runs required.
Link Parameters: Use individual lane widths as measured in the field.
Grade: Grades should be based on existing data or existing design plans. If neither of these two sources are available, then the following ranges from the HCM 2010 should be used: 1720
Level Terrain (L): 0-2% Rolling Terrain (R): 2-4% Mountainous Terrain (M): 4-6%
Link Length: There is no limitation on link length in VISSIM. Links should be continuous through areas of constant lane configuration. As a general practice, links 1725
should be broken at each intersection.

Chapter 7 – Standard Assumptions for Tools
Traffic Operations Analysis Tool Guidebook Version 1.1
Page | 56
Table 9 – VISSIM Standard Parameters
VISSIM PARAMETER TYPICAL VALUE, ACCEPTABLE RANGES, and/or SPECIAL NOTES
Entry Volumes (Inputs) One hour minimum and long enough to show traffic demand being within capacity on
either end of the time period. Code data in 15-minute intervals.
Heavy Vehicle Percentages
Use existing data. For future analyses, existing HVP shall be used, but if that is not available, use a minimum of 2%.
Arrival Distribution Arrival distribution cannot not be changed in VISSIM. Manufacturer suggests setting all
inputs to "Exact Volume" instead of the default "Stochastic Volume".
Link Length No limitation on link length. Links should be continuous through areas with consistent
lane configuration.
Link Speed (Desired Speed Distributions)
Posted speed limits should be used for existing analyses. For arterial networks, use linear distribution ranging +/- 5 mph from posted speed limit.
For freeway networks, a detailed speed profile should be considered.
Turning Speed (Reduced Speed Areas)
For right turns, use 7.5 mph to 15.5 mph. For left turns, use 12.4 mph and 18.6 mph.
Origin-Destination (O-D) Use existing data. Routing decisions can be combined or set up as O-D.
Car Following Model For urban facilities and arterials, use Wiedemann 74.
For freeways, use Wiedemann 99.
Vehicle Parameters Individual vehicle parameter defaults should not be changed.
Vehicle Fleet Use vehicle fleet in example file "NorthAmericaDefault.inp"
provided with VISSIM installation.
Traffic Signal Timing Use existing data for existing analyses. If it is not available, measure it in field during the
peak hour.
Traffic Signal Cycle Length
Use existing data for existing analyses. For future analyses, typically use 60-240 seconds (based on VDOT region/district preferences).
Traffic Signal Left-Turn Phasing
All future left-turn phasing alternatives should be discussed with the project manager prior to analysis.
Traffic Signal Minimum Green Time
Use existing data for existing analyses. For future analyses, typically use 5 seconds (based on VDOT region/district preferences).
Traffic Signal Yellow Time
Use existing data for existing analyses. For future analyses, use a minimum of 3 seconds (based on latest VDOT Yellow Change Intervals and Red Clearance Intervals Memo).
Traffic Signal All-Red Time
Use existing data for existing analyses. For future analyses, use a minimum of 1 second (based on latest VDOT Yellow Change Intervals and Red Clearance Intervals Memo).
Traffic Signal Walk Time Use existing timings, when applicable, for existing analyses. For future analyses,
calculate new time based on MUTCD requirements.
Traffic Signal Flashing Don’t Walk Time
Use existing timings, when applicable, for existing analyses. For future analyses, calculate new time based on MUTCD requirements.
Grade Use the actual grade, if available, for existing analyses. For future analyses, use 0-2% for
level, 2-4% for rolling, and 4%+ for mountainous.
Performance Measure Intervals
Report in one-hour intervals, unless otherwise specified in project requirements.
Simulation Resolution A value between 5 and 10 should be used on all models. Use the same resolution for
existing and future conditions.
Number of Simulation Runs
Based on Formula (13) in Appendix B of the FHWA Traffic Operations Analysis Toolbox: Volume III. Initial assumption of 10 runs with a maximum of 30 runs.
Chapter 7 – Standard Assumptions for Tools
Traffic Operations Analysis Tool Guidebook Version 1.1
Page | 57
Link Speed (Desired Speed Distributions): Posted speed limits should be used for all existing analyses. For arterial networks, a linear distribution ranging +/- 5 mph of 1730
the speed limit is sufficient. For freeway networks, a more detailed speed profile should be considered.
Turning Speed (Reduced Speed Areas): Reduced speed areas for turning vehicles should typically be set to Desired Speed Distributions ranging from 7.5 to 15.5 mph for right turns and 12.4 to 18.6 mph for left-turns as a starting point. These values 1735
can be adjusted (with technical justification documentation) as needed during the calibration process to match real-world conditions.
Vehicle Parameters: Individual vehicle defaults should not be changed, unless there is hard data indicating that a modification is required (i.e. LRT vehicle length, acceleration). 1740
Origin-Destination: Origin-Destination (O-D) data, if available, should be coded as static routes. Dynamic Assignment features of VISSIM should only be used with prior approval from the project manager. Static routes can also be combined between closely spaced intersections as needed to control localized O-D behavior and to better replicate lane utilization. 1745
Car Following Model: Driver behavior models, used during the calibration process, are coded on a link-by-link basis. Wiedemann 74 is intended to be used for arterials and Wiedemann 99 is used for freeway links. If individual parameters need to be changed, do not change or delete the default value, then create a new driving behavior profile, and modify the values as necessary. As a final step, document the 1750
justification for modifying the factors.
Vehicle Fleet: Use vehicle fleet in example file "NorthAmericaDefault.inp" provided with VISSIM installation. Vehicle models in this fleet are available on PTV website.
Traffic Signal Timing: The Ring-Barrier Controller (RBC) is the preferred traffic signal emulator. Existing traffic signal timing information should be obtained from the 1755
entity that controls the traffic signal. If not available, existing traffic signal timing information should be measured in the field during peak hour operations or agreed upon with the project manager. Existing traffic signal timings should be used for existing analyses and optimized traffic signal timings should be used for future analyses. 1760
Cycle Length: Cycle lengths can vary based on VDOT region/district preferences; however, typical values should range between 60 and 240 seconds. Use existing cycle lengths from the field should in existing analyses. Cycle lengths used in future analyses should be agreed upon with the project manager prior to any analysis being performed taking into account the system cycle lengths for intersections 1765
within a corridor.
Left-Turn Phasing: Existing left-turn phasing should be maintained in all existing analyses. For all future left-turn phasing alternatives, proposed left-turn phasing shall be reviewed by the project manager prior to any analysis being performed.
Yellow Time: Use existing data for existing analyses. For future analyses, yellow 1770
times should be consistent with current VDOT clearance interval standards

Chapter 7 – Standard Assumptions for Tools
Traffic Operations Analysis Tool Guidebook Version 1.1
Page | 58
identified in TE-306.1 (Traffic Signals – Yellow Change Intervals and Red Clearance Intervals) with a minimum of 3 seconds.
All-Red Time: Use existing data for existing analyses. For future analyses, all-red times should be consistent with current VDOT clearance interval standards 1775
identified in TE-306.1 (Traffic Signals – Yellow Change Intervals and Red Clearance Intervals) with a minimum of 1 second.
Minimum Green Time: Use existing data for existing analyses. For future analyses, minimum green time can vary based on VDOT region/district preferences; however the typical value should be 5 seconds. Any deviation from 5 seconds should be 1780
approved by the project manager prior to any analysis being performed.
Performance Measure Intervals: Report in one-hour intervals unless otherwise specified in project requirements.
“WALK” Time: Existing “WALK” time data should be used for existing analyses. If existing timing is not available and for all future analyses, “WALK” time should be 1785
developed based on MUTCD standards.
Flash “DON’T WALK” Time: Existing flash “DON’T WALK” time data should be used for existing analyses. If existing timing is not available and for all future analyses, “DON’T WALK” time should be developed based on MUTCD standards.
Number of Simulation Runs: The minimum number of simulation runs shall be 1790
based on Formula (13) in Appendix B of the FHWA Traffic Operations Analysis Toolbox: Volume III up to a maximum of 30 runs. An initial assumption of 10 simulation runs, with different random number seeds, will be performed by setting the random number seed increment in the multi-run tool to one prior to applying the aforementioned formula and methodology (refer to Chapter 5). 1795
Simulation Run Time: The simulation run time is the time it takes for the model to process the entire peak period, including the seeding time.
Simulation Resolution: The number of times the vehicle’s position will be calculated within one simulated second (range 1 to 10). The input of 1 will result in the vehicles moving once per simulation second while an input of 10 results in the vehicles’ 1800
position being calculated 10 times per simulation second thus making vehicles move more smoothly. The change of simulation speed is inversely proportional to the number of time steps. A value between 5 and 10 should be used on all models and this value shall not change between existing and future conditions analyses.
Evaluations: VISSIM has numerous evaluation output file options available. The 1805
most common options are Link, Node, Queue Length, Travel Time, and Network Performance. The content of each of these output files should be customized for the individual needs of each project and submitted for approval by the VDOT Project Manager at the start of the project.
Link: primarily used for freeway links to collect average speed, volume, and 1810
density. Link Evaluation must be activated on a link-by-link basis. To ensure one set of results are reported for the entire link, the segment length should be set to a value larger than the link length. Link evaluation should be collected on a “by lane” basis in most cases.

Chapter 7 – Standard Assumptions for Tools
Traffic Operations Analysis Tool Guidebook Version 1.1
Page | 59
Node: used to collect arterial intersection delays, queue lengths, and 1815
throughput volumes. Boundaries of each node should be placed at the stop line on all approaches and avoid boundaries between links and connectors to avoid errors in reporting.
Queue Length: Queue lengths should be obtained from the Node Evaluation in most cases. If additional queuing locations or time collection intervals are 1820
needed, queue counters can be placed at the stop line on each approach.
Travel Time: Travel time segments should be placed at the same start and end points as the field data collection runs.
Network Performance: Aggregates results from Node and Travel Time evaluation into overall summaries. Typical MOEs included are Average 1825
Delay, Total number of stops, and total delay time. Latent demand and latent delay can be used to determine the number of vehicles that could not enter the network due to congestion.
Data Analyzer: All individual evaluations listed above (with the exception of Link Evaluation) can be summarized and reported using the Data Analyzer 1830
post-processor, or another post-processor tool as approved by the VDOT Project Manager.
7.6 SimTraffic
Since SimTraffic is the microsimulation module of Synchro, a complete Synchro model is
required prior to any SimTraffic analysis. Therefore, all of the inputs for Synchro are necessary 1835
for SimTraffic. In addition, the following simulation inputs, which are summarized in Table 10,
should be addressed.
Mandatory and Positioning Distances: These inputs should only be modified to address any existing simulation anomalies. In these cases, technical justification is not required; however, the changes must be justified as a solution to an anomaly in 1840
the simulation.
Headway Factors: These inputs are automatically calculated through SimTraffic based on other inputs, and should not be modified. Technical justification is required for any modification to these factors.
Seeding Time: The seeding time should be long enough to distribute traffic 1845
throughout the entire network. Typically, seeding times should be approximately equal to either the peak hour travel time OR twice the off-peak travel time, when traversing from one end of the network to the other.
Number of Intervals: One seeding interval and four, 15-minute simulation analysis periods. 1850
Number of Simulation Runs: The minimum number of simulation runs shall be based on Formula (13) in Appendix B of the FHWA Traffic Operations Analysis Toolbox: Volume III up to a maximum of 30 runs. An initial assumption of 10 simulation runs, with different random number seeds, will be performed prior to applying the aforementioned formula and methodology. 1855

Chapter 7 – Standard Assumptions for Tools
Traffic Operations Analysis Tool Guidebook Version 1.1
Page | 60
Table 10 – SimTraffic Standard Assumptions
SIMTRAFFIC PARAMETER TYPICAL VALUE, ACCEPTABLE RANGES, and/or SPECIAL NOTES
Mandatory Distances (MD) These should only be modified if simulation anomalies exist.
Positioning Distances (PD) These should only be modified if simulation anomalies exist.
Headway Factors Automatically calculated by SimTraffic and should not be modified, unless it is
required for calibration purposes as discussed in Chapter 5.
Seeding Time Typically equal to either the actual peak hour travel time or
twice the off-peak travel time between network study limits.
Simulation Settings Number of Intervals
One seeding period and four 15-minute analysis periods.
Number of Simulation Runs Based on Formula (13) in Appendix B of the FHWA Traffic Operations Analysis Toolbox: Volume III. Initial assumption of 10 runs with a maximum of 30 runs.
Note: All Synchro inputs are valid for SimTraffic (Synchro network must be completed prior to a SimTraffic analysis).

Chapter 7 – Standard Assumptions for Tools
Traffic Operations Analysis Tool Guidebook Version 1.1
Page | 61
This page is intentionally left blank. 1860

Chapter 8 – Traffic Operations Analysis Tool Selection
Traffic Operations Analysis Tool Guidebook Version 1.1
Page | 62
8 Traffic Operations Analysis Tool Selection
This chapter describes the methodology to be used for selecting the most appropriate traffic
analysis tool. This selection process includes identifying the most appropriate tool(s) for any
given analytical scenario presented in Chapter 2 in this guidebook. A Tool Selection Matrix
(TSM), which is included in Appendix C, was developed to identify the various conditions under 1865
which specific traffic analysis tools were applicable. To assist users of this guidebook with
selecting the most appropriate traffic analysis tool, an automated, Excel-based tool was
developed to replicate the results derived from the TSM. This companion tool to the guidebook
was created to assist users with identifying the most appropriate tool from the over 400
possible permutations. 1870
8.1 Software Selection Tool
In conjunction with the development of tool selection methodologies, assumptions for the
various analysis types, and assumptions on the inputs for each individual tool, a Software
Selection Tool (SST) was developed. The SST is a self-guided decision matrix that allows a user to
select from a range of traffic analysis criteria and MOEs to determine the appropriate traffic 1875
analysis tool(s). The SST was produced in Microsoft Excel and consists of 4 Visual Basic macros:
1. Input Form: Opens the “Input Form” and records the various analytical scenarios
2. Tool Identification: Identifies the applicable tools available for each analytical scenario
3. Clear Form: Clears the tool results when the user is finished or wishes to perform 1880
other analyses
4. Set Print Area: Sets the appropriate print area for the user to conveniently print the results of the tool evaluation
The following sections will describe the use of these macros in more detail.
8.2 Software Selection Tool Input Form Macro 1885
Provided in the following sections is a description of the SST. If the user is looking for step-by-
step instructions for using the SST, they are included with the SST itself. To use the software
selection tool, a user must first identify one of three specific analysis categories (e.g.,
intersection, highway/freeway/interchange, or multimodal/miscellaneous). The SST Input Form
makes this step very simple with the use of a pushbutton. Once the pushbutton (depicted as a 1890
light blue rectangle in the SST labeled “Open Form”) is clicked, a window appears prompting the
user for input on all analysis scenarios under consideration. The SST Input Form provides 6
categories of analysis criteria to specify:

Chapter 8 – Traffic Operations Analysis Tool Selection
Traffic Operations Analysis Tool Guidebook Version 1.1
Page | 63
Analysis Type (variable depending on the Analysis Category selected) 1895
Oversaturated or Undersaturated Conditions
Location Type a. Point b. Segment or Facility c. Corridor, Area, or System 1900
Measures of Effectiveness (variable(s) depending on the Analysis Category and Type selected)
Microsimulation Preference a. This input accounts for those analyses where a microsimulation tool is
preferred and deterministic tools should not be considered 1905
Figure 8 is a screenshot of the SST Input Form. All input selections are in either Option Button
(e.g., Analysis Category) or List Box (e.g., Analysis Type) formats. Once all input fields have been
selected, the user can decide to export the information into the SST, where it will remain until
the next macro is activated (Tool Determination Macro).
The user may export up to 65,000 scenarios before closing the form and running the Tool 1910
Determination Macro. The SST Input Form has two “validation checks” in place to ensure that all
fields have been identified and that the appropriate “Location Type” has been selected (see
Figure 8 and Figure 9, respectively). For the first selection check, if the user does not identify a
particular field, a warning message will appear when the “Export to Spreadsheet” button is
selected. The second check is in place for various Highway/Freeway/Interchange Type analyses 1915
where a “Point” analysis is not feasible (“Segment” is the most isolated choice feasible). If the
user attempts to identify “Point” for any of these analyses, a warning message will appear
indicating that it is not feasible and that a different Location Type must be selected as shown in
Figure 10.
Once a scenario has been accurately identified in the form, the user must export the scenario to 1920
the SST worksheet using the “Export to Spreadsheet” button (see Section 8.3). Once all desired
scenarios have been exported, the user should select “Cancel/Close” to exit the form. This
button returns the user back to the SST with all of the exported analysis scenarios listed in the
order they were generated from the form as shown in Figure 11. The “Tool Determination
Macro” is used to generate the recommended software tools for each scenario. 1925
8.3 Tool Determination Macro, Set Print Area, and Clear Table Macros
Having generated the list of analysis scenarios, the user can then initiate the Tool Determination
Macro with another execution button, depicted as a light purple rectangle in the SST labeled
“Calculate Software Options”). In the spreadsheet, a total of 7 different software packages are
listed, including the following: 1930
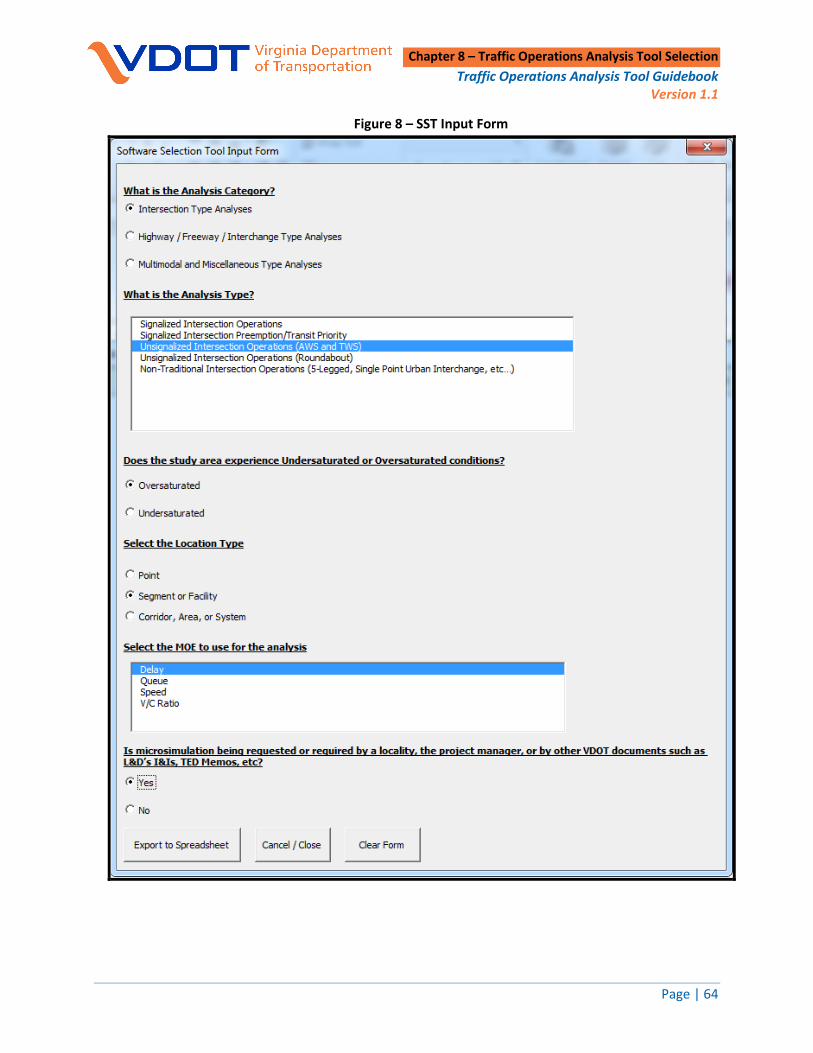
Chapter 8 – Traffic Operations Analysis Tool Selection
Traffic Operations Analysis Tool Guidebook Version 1.1
Page | 64
Figure 8 – SST Input Form
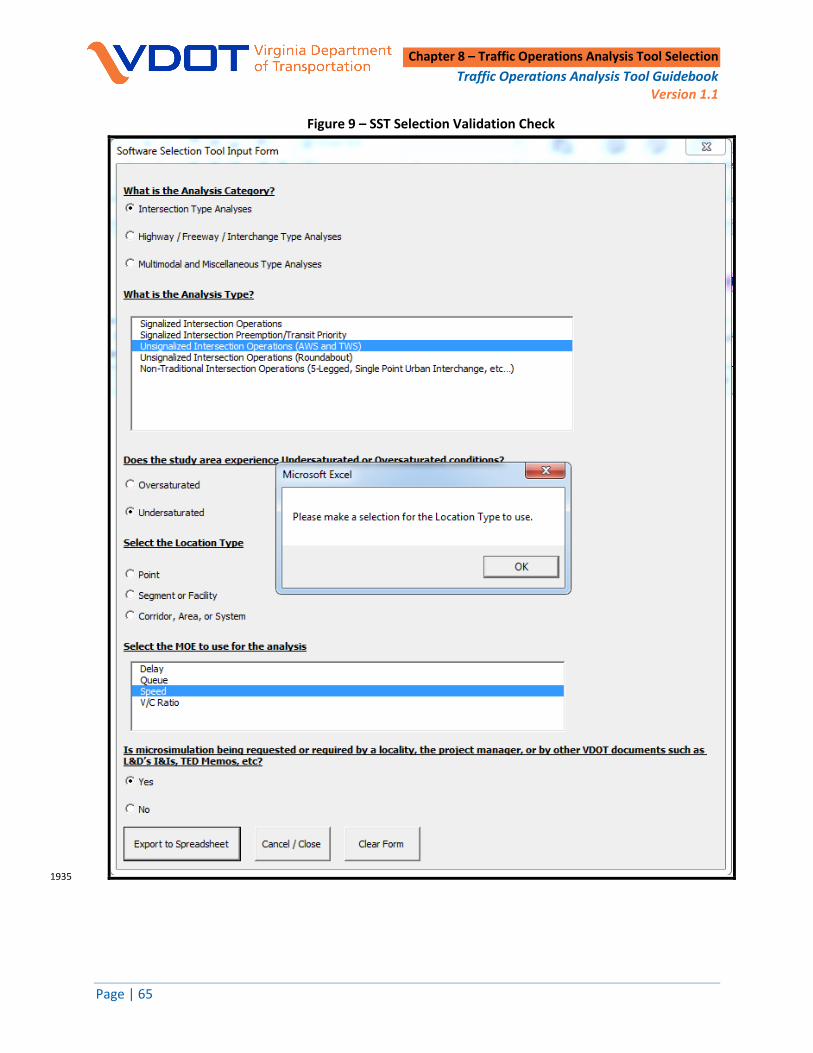
Chapter 8 – Traffic Operations Analysis Tool Selection
Traffic Operations Analysis Tool Guidebook Version 1.1
Page | 65
Figure 9 – SST Selection Validation Check
1935

Chapter 8 – Traffic Operations Analysis Tool Selection
Traffic Operations Analysis Tool Guidebook Version 1.1
Page | 66
Figure 10 – SST Location Type Validation Check
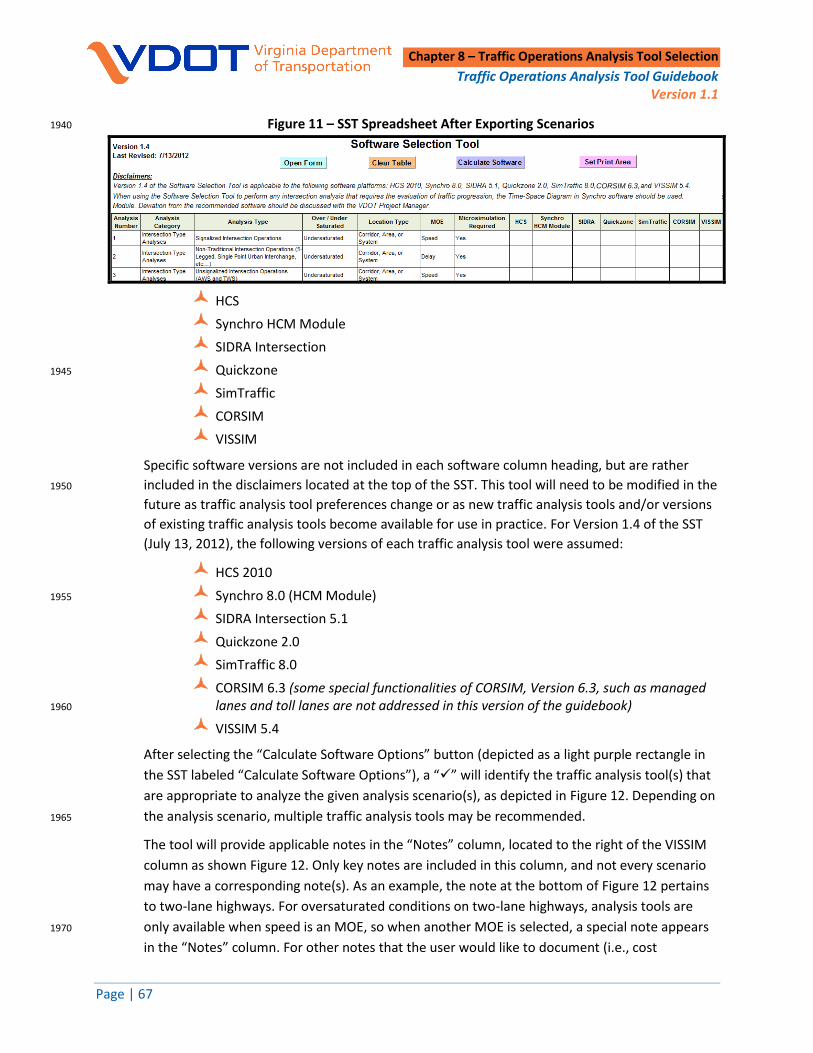
Chapter 8 – Traffic Operations Analysis Tool Selection
Traffic Operations Analysis Tool Guidebook Version 1.1
Page | 67
Figure 11 – SST Spreadsheet After Exporting Scenarios 1940
HCS
Synchro HCM Module
SIDRA Intersection
Quickzone 1945
SimTraffic
CORSIM
VISSIM
Specific software versions are not included in each software column heading, but are rather
included in the disclaimers located at the top of the SST. This tool will need to be modified in the 1950
future as traffic analysis tool preferences change or as new traffic analysis tools and/or versions
of existing traffic analysis tools become available for use in practice. For Version 1.4 of the SST
(July 13, 2012), the following versions of each traffic analysis tool were assumed:
HCS 2010
Synchro 8.0 (HCM Module) 1955
SIDRA Intersection 5.1
Quickzone 2.0
SimTraffic 8.0
CORSIM 6.3 (some special functionalities of CORSIM, Version 6.3, such as managed lanes and toll lanes are not addressed in this version of the guidebook) 1960
VISSIM 5.4
After selecting the “Calculate Software Options” button (depicted as a light purple rectangle in
the SST labeled “Calculate Software Options”), a “” will identify the traffic analysis tool(s) that
are appropriate to analyze the given analysis scenario(s), as depicted in Figure 12. Depending on
the analysis scenario, multiple traffic analysis tools may be recommended. 1965
The tool will provide applicable notes in the “Notes” column, located to the right of the VISSIM
column as shown Figure 12. Only key notes are included in this column, and not every scenario
may have a corresponding note(s). As an example, the note at the bottom of Figure 12 pertains
to two-lane highways. For oversaturated conditions on two-lane highways, analysis tools are
only available when speed is an MOE, so when another MOE is selected, a special note appears 1970
in the “Notes” column. For other notes that the user would like to document (i.e., cost
CORSIM 6.3,

Chapter 8 – Traffic Operations Analysis Tool Selection
Traffic Operations Analysis Tool Guidebook Version 1.1
Page | 68
constraints, tool preference, etc.), a “Comments” column is provided. This column is the only
area of the SST worksheet that is not protected, so the user can manually input text that helps
to describe the differences between scenarios.
Figure 12 – Output from Executing the Tool Determination Macro 1975
Once all comments have been inputted by the user, the user can print the result table using the
“Set Print Area” macro (depicted as a light pink rectangle in the SST labeled “Set Print Area”).
Running this macro will automatically set the printing extents to encompass the entire results
table. Once all printing is completed and/or the user wishes to start over, the user should clear 1980
the table using the “Clear Table Macro”. The Clear Table Macro is depicted as a light orange
rectangle in the SST labeled “Clear Table”. It is important to emphasize that all scenarios will be
cleared once this macro runs.
8.4 Software Selection Tool Maintenance
VDOT will have the primary responsibility for maintaining the methodology and logic in the tool; 1985
however, future refinements (e.g., analysis type, analytical tools, input assumptions, and MOEs)
should be based on input and feedback from a multidisciplinary technical advisory committee.
When reevaluating the methodology and logic for the SST, the vision and goals of this guidebook
should serve as the benchmark for any modification(s).
8.5 Roundabout Analysis Methodology 1990
Supported by guidance provided in the current VDOT Road Design Manual, all roundabout
analysis submissions shall be accompanied by a SIDRA Intersection analysis. The use of the
SIDRA Intersection model is required for roundabout analyses conducted with SIDRA
Intersection. However, there are conditions, such as those listed below, where VISSIM should be
used to analyze the operations of roundabouts. 1995

Chapter 8 – Traffic Operations Analysis Tool Selection
Traffic Operations Analysis Tool Guidebook Version 1.1
Page | 69
Two- or three-lane roundabouts
Hybrid roundabout configurations
Roundabouts in close proximity to traffic signals or other roundabouts
Roundabouts that are at or over capacity
Even when a VISSIM analysis is conducted, a SIDRA Intersection analysis shall be submitted 2000
assuming the tool can analyze the configuration that is being proposed. If VISSIM is used for a
roundabout analysis, the calibration methodology should be documented and submitted with
the results.

Chapter 9 – Output
Traffic Operations Analysis Tool Guidebook Version 1.1
Page | 70
9 Output
When multiple output formats are currently submitted to VDOT for review, VDOT staff must 2005
first familiarize themselves with the format of the output summary before actually reviewing
the content of the information for accuracy and validity. This section describes approved,
standardized formats to display results from the various types of traffic analysis tools described
in previous chapters. The purpose of developing standardized output formats with this
guidebook is twofold: 2010
1. To provide consistent output formats to assist VDOT reviewers in:
a. reducing the potential for requiring multiple submittals
b. reducing review time required by VDOT staff
2. To relay key MOE information from traffic analysis tool outputs
It is important to note that the output formats presented in this chapter are standards, and 2015
should serve as the minimal for submittals, but can be expanded upon with approval from the
VDOT project manager. The only case in which a modification will be considered by a project
manager is one where a particular MOE will not conform to the standard presentation format. In
these cases, it must be justified why the MOE will not conform to the associated output
format(s). If and only then will consideration be made by the project manager to allow 2020
modifications to a particular output format for the associated analysis only. Revisions to the
output formats will not constitute a permanent change in the approved output format for a
particular tool, but could be considered as an additional output format if the project manager
determines that it will be used in future analyses.
9.1 Output Formats 2025
The two main types of output formats discussed in this guidebook are depictive and tabular. In a
depictive output format, data and results are represented with colors, shapes, and/or symbols
with numerical results. Tabular output formats display the results in tabular form with a varying
number of rows and columns. Examples of each output style are described, with examples
provided, in the following sections. Associated 2030
electronic outputs shall be included (actual model
and results in .xls or .dbf formats) with the hard
copy submittals.
Various examples of each output format were
assessed as to how they would correlate with the 2035
tools described in this guidebook. Depictive
results are required, but they should also always
be supplemented with tabular formats, which
allow for some redundancy with more than one
output format. In addition, a minimum of two 2040
Two output formats:
Depictive
Tabular
Depictive results are
required whenever possible,
but they should also always
be supplemented with
tabular formats.

Chapter 9 – Output
Traffic Operations Analysis Tool Guidebook Version 1.1
Page | 71
MOEs shall be summarized for each link or intersection
in the network when more than one MOE is available.
For example, since LOS is a description of density,
another MOE, such as speed must be included, or to
supplement intersection delay, queue length should be 2045
added. By using two different MOEs, transportation
professionals will make more informed decisions
regarding the adequacy of the network.
The following sections outline the output formats for each software tool (with exception of
Quickzone). The output format for Quickzone should be agreed upon with the project manager 2050
on a case-by-case basis. Deviations from the intent of the recommended templates presented in
this chapter will need to be discussed with and approved by the project manager. Modifications
of the templates to meet the needs of specific projects will need to be approved by the project
manager.
9.2 HCS Output Formats 2055
Two output formats were selected for HCS 2010.
Figure 13 illustrates a depictive output format for
freeway operations, including ramps and weaving areas,
which was created in Microsoft Excel. This template
presents LOS and density in a depictive output style. 2060
Sections are appropriately color-coded according to the corresponding LOS and density. Other
items illustrated on the figure include free-flow speed, traffic volume, distances between ramps,
ramp lengths, ramp speeds, and acceleration/ deceleration lane lengths. A brief description of
the ramps is also included on the figure. Additionally, an aerial that depicts the overall study
area is included on the figure to serve as a geographical reference for the reviewer. The aerial is 2065
not a required on the output summary; however, an aerial should be included if one is available
to help with the review process.
The second template is presented in a tabular format, which was also created in Microsoft Excel.
Table 11 displays LOS and density for various ramp junctions/weave segments. In the table,
results from multiple scenarios (both AM and PM) can be presented with this format. 2070
HCS output formats:
Depictive
Tabular
A minimum of two MOEs
shall be summarized for
each link or intersection
in the network when
more than one MOE is
available.

Chapter 9 – Output
Traffic Operations Analysis Tool Guidebook Version 1.1
Page | 72
Figure 13 – HCS Depictive Figure - Freeways
B / 16.8 [23.7] [21.8]
[34.6]
A / 6.2 [24.8] [30.2]
F / 50.6
* Numbers in this graphic t are for provided for illustrative purposes only
Project Title
Somewhere, VirginiaRamp / Merge Level of Service
FIGURE
X
A / 0-10
B / 10-20
C / 20-28
D / 28-35
F / 43+
Volume = 2,235 vph 6,000 feet to
FFS = 55 mph I-64 EB Off-Ramp to B Avenue
Legend
Volume = 1,025
E / 42.3
1,760 feet 2,500 feet
FFS = 55 mph FFS = 55 mph (See Figure XX)
[22.8] B / 16.5
E / 35-43
6,800 feet from
I-64 WB Off-Ramp to EB A Street
Ramp Length: 3,680 feet
Volume = 795 vph
FFS = 35 mph
Volume = 1,265 I-64 WB On-Ramp from B Avenue
FFS = 25 mph FFS = 25 mph FFS = 35 mph460 feet
Volume = 50 vph380 feet
Volume = 260 vph
I-64 WB Off-Ramp to EB A Street
Ramp Length: 3,680 feetI-64 WB On-Ramp from A Street
Ramp Length: 1,820 feet
850 feet
(See Figure XX)
6,000 feet to
I-64 EB Off-Ramp to B Avenue
C / 21.3
Volume = 1,850 vph
(See Figure XX)
Volume = 680 vph
FFS = 25 mph
I-64 WB On-Ramp from A Street
Ramp Length: 1,820 feet
I-64 WB Off-Ramp to EB A Street
Ramp Length: 1,000 feet
[11.4]
I-64 EB On-Ramp from EB A Street
Ramp Length: 1,540 feet
Volume = 190 vph
FFS = 55 mph
Volume = 1,680
2,500 feet
I-64 EB On-Ramp from WB A Street
Ramp Length: 1,600 feet
6,800 feet from
460 feetVolume = 600 vph
FFS = 25 mph
F / 45.2
1,760 feet
380 feet
I-64 WB On-Ramp from B Avenue
FFS = 55 mph
C / 25.6
985 feet
Volume = 1,400
FFS = 55 mph
FFS = 35 mph
Volume = 235 vph
FFS = 30 mph
[22.2] D / 28.7
300 feet
AM
Volume = 725 vph850 feet
Volume = 350 vph
I-64 EB Off-Ramp to EB A Street
Ramp Length: 1,600 feet
FFS = 30 mph
985 feet
I-64 WB Off-Ramp to EB A Street
Ramp Length: 1,000 feet
(See Figure XX)
[Speed]
(mph)
300 feet
I-64 EB On-Ramp from WB A Street
Ramp Length: 1,600 feet
I-64 EB Off-Ramp to EB A Street
Ramp Length: 1,600 feet
I-64 EB On-Ramp from EB A Street
Ramp Length: 1,540 feet
FFS = 30 mph
Volume = 625 vph
A / 9.2
LOS / DENSITY (pc/ln/mi)
[14.8]
PM
Not to Scale
Volume = 480 vph Volume = 315 vph
FFS = 35 mph FFS = 30 mph
[34.5]
64
3535
35
2525
30
64
35 35
35
2525
30
N

Chapter 9 – Output
Traffic Operations Analysis Tool Guidebook Version 1.1
Page | 73
Synchro/SimTraffic
output formats:
Depictive
Tabular
Table 11 – HCS Tabular Output Format
Direction Movement
2012 Baseline LOS
(Density- vplpm)
2012 Baseline LOS
(Density- vplpm)
AM PM AM PM
Northbound I-95
Diverge: Off-ramp to Eastbound Main Street
C (22.7)
B (11.4)
D (33.4)
B (18.0)
Weave C
(20.5) A
(9.0) E
(36.2) B
(14.4)
Merge: I-95 Northbound On-ramp from Westbound Main Street
B (19.3)
A (9.9)
D (29.5)
B (15.8)
Southbound I-95
Diverge: Off-ramp to Main Street A
(6.7) B
(15.6) A
(8.5) B
(19.4)
Merge: On-ramp from Main Street A
(3.8) B
(11.6) A
(5.6) B
(17.4)
9.3 Synchro/SimTraffic Output Formats 2075
Intersections in Synchro 8.0 can currently be analyzed
using both HCM 2000 and HCM 2010 methodologies,
with several restrictions using HCM 2010 (e.g., only
NEMA phasing can be used, no more than four legs can
be analyzed, etc.). Due to the difference in computation 2080
methodologies between the two HCM releases, the
output values differ. It may be argued that the latest HCM 2010 methodology yields more
realistic output; hence, the analyst may be inclined to use the outputs from the HCM 2010 to
estimate intersection performance. However, at this time, the arterial analysis in Synchro 8.0
can only be performed using the HCM 2000 methodology. Trafficware is currently expanding the 2085
functionality of Synchro 8.0 to include the HCM 2010 methodology, but indicated that it will
take time to finish the updates. Therefore, only the HCM 2000 methodology is currently useable
for the analysis of a network that includes both arterials and intersections.
Until such time that the HCM 2010 methodologies are uniformly incorporated into Synchro 8.0,
the users of this guidebook shall continue to use outputs from the HCM 2000 methodology. If 2090
outputs from HCM 2010 methodology become available before the next version of this
guidebook is developed, then those results may only be used to supplement the HCM 2000
methodology output.
Three required output templates were created to summarize Synchro/SimTraffic results. The
first two templates are depictive formats, which are presented in Figure 14 and Figure 15, were 2095
created in Microsoft Excel.

Chapter 9 – Output
Traffic Operations Analysis Tool Guidebook Version 1.1
Page | 74
Figure 14 – Synchro/SimTraffic/CORSIM/VISSIM LOS Depictive Figure – Intersections

Chapter 9 – Output
Traffic Operations Analysis Tool Guidebook Version 1.1
Page | 75
Figure 15 – Synchro/SimTraffic/CORSIM/VISSIM Queue Depictive Figure - Intersections
2100

Chapter 9 – Output
Traffic Operations Analysis Tool Guidebook Version 1.1
Page | 76
In both figures, multiple MOEs (in the example outputs, it is LOS and queue) are illustrated at
four intersections. An aerial image helps to depict the general study area while a number labels
each individual study intersection. Results are then reported off to the side of the labeled aerial
image for each study intersection. The aerial is not a required piece of the output; however, an
aerial should be included if one is available. 2105
The third Synchro/SimTraffic template presents MOEs (LOS and delay) in a tabular format as
shown for delay/LOS in Table 12 and queue length in Table 13. The tables, which were created
in Microsoft Excel, can be used to summarize a multitude of scenarios and provide both overall
results and results by individual intersection approach. In Table 12, the eastbound through and
right-turn lane is shared; hence the respective cells are merged to provide one output for the 2110
lane group. The specific information shown in Table 12 and Table 13 may vary slightly depending
on the requirements of the specific project as defined by the project manager.
9.4 SIDRA Intersection Output Formats
Three required output templates were created to summarize SIDRA Intersection results. Figure
16 shows a screen shot of a depictive output template, 2115
which was created in SIDRA Intersection, but it can
show any MOE (in this case, delay). The second
depictive template, Figure 17, shows LOS for each lane
of a roundabout. Note that the LOS reported in this
figure is the delay from the HCM as opposed to the 2120
degree of saturation from SIDRA Intersection. The final
output template is in tabular format, as shown in Table 14. SIDRA Intersection automatically
develops this tabular format once a roundabout analysis is processed.
9.5 CORSIM and VISSIM Output Formats
Since CORSIM and VISSIM have similar MOEs, five required output templates were created to 2125
summarize the results for these software programs
depending on whether the results pertain to freeway
operations or intersection operations. The first two
templates pertain to intersections and are the same as
the ones developed for Synchro and SimTraffic as shown 2130
in Figure 14 and Figure 15.
The third template is a depictive freeway schematic for
CORSIM illustrated in Figure 18, which was created in Microsoft Excel. This template includes
actual volumes, simulated volumes, link distances, speeds, and density between nodes.
Additionally, results are reported for every lane of every segment, providing an in-depth 2135
evaluation of operations. With this template, various MOEs can be color coded to help the
reviewer differentiate
SIDRA Intersection
output formats:
Depictive
Tabular
CORSIM / VISSIM
output formats:
Depictive
Tabular

Chapter 9 – Output
Traffic Operations Analysis Tool Guidebook Version 1.1
Page | 77
Table 12 – Level of Service Table for Synchro/SimTraffic Output
Scenario Overall
LOS
Level of Service per Movement by Approach
(Delay in sec/veh)
Eastbound Westbound Northbound Southbound
LT TH RT LT TH RT LT TH RT LT TH RT
AM Peak Hour
2012
Existing
D
(40.9)
D
(51.1)
D
(49.0)
D
(47.2)
B
(19.0)
A
(2.6)
C
(30.6)
E
(66.1)
A
(4.0)
D
(44.6)
B
(11.8)
A
(4.1)
D (49.1) C (27.8) E (56.8) C (26.1)
2020
No Build
D
(35.8)
D
(47.7)
E
(58.9)
D
(39.5)
D
(36.2)
B
(11.4)
B
(14.5)
C
(31.7)
A
(4.4)
D
(52.9)
C
(33.1)
B
(17.1)
D (54.0) C (32.2) C (27.4) D (41.6)
2020
Build-Out
D
(40.1)
D
(48.0)
E
(60.5)
D
(54.8)
C
(32.4)
A
(6.3)
B
(14.4)
D
(40.9)
B
(14.0)
D
(54.8)
C
(30.6)
B
(10.4)
D (55.0) D (37.8) D (36.0) D (41.4)
PM Peak Hour
2012
Existing
C
(27.3)
E
(59.8)
D
(53.6)
C
(28.5)
C
(21.0)
A
(1.3)
E
(62.3)
C
(31.9)
C
(25.7)
D
(38.8)
B
(12.1)
A
(4.5)
D (54.1) B (18.3) C (33.6) B (15.9)
2020
No Build
C
(24.4)
D
(54.5)
E
(59.4)
C
(33.7)
C
(32.5)
A
(7.4)
E
(59.5)
C
(24.7)
C
(20.2)
D
(36.5)
A
(9.6)
A
(2.8)
E (57.0) C (26.0) C (27.0) B (13.5)
2020
Build-Out
C
(28.8)
D
(52.8)
E
(60.8)
C
(33.1)
C
(30.0)
A
(4.9)
E
(60.2)
C
(33.9)
C
(20.7)
D
(43.1)
B
(10.9)
A
(3.1)
E (57.4) C (25.9) C (34.1) B (16.7)
Table 13 – Queue Table for Synchro/SimTraffic Output
Intersection Movement 95th Percentile
Queue Length (ft) Storage Length
Available (ft)
Main Street/First Street Westbound RT/LT 225 300
Main Street/First Street Southbound TH 450 850
2140

Chapter 9 – Output
Traffic Operations Analysis Tool Guidebook Version 1.1
Page | 78
Figure 16 – SIDRA Intersection Depictive Output Figure

Chapter 9 – Output
Traffic Operations Analysis Tool Guidebook Version 1.1
Page | 79
Figure 17 – SIDRA Intersection LOS Depictive Summary Figure
2145

Chapter 9 – Output
Traffic Operations Analysis Tool Guidebook Version 1.1
Page | 80
Table 14 – SIDRA Intersection Movement Summary Table

Chapter 9 – Output
Traffic Operations Analysis Tool Guidebook Version 1.1
Page | 81
between results. In this sample, density values were color coded. The fourth output template is
also a freeway schematic, illustrated in Figure 19, which is similar to the other freeway template, 2150
but it is tailored to provide more flexibility for the summary of VISSIM output. The fifth output
template, also created in Microsoft Excel, presents the results in tabular form as shown in Table
15. In addition, companion macros for this guidebook convert the traffic simulation results into
results compatible with level of service. This table summarizes travel times on a specific link in
the network, but it can be modified to summarize delay, queue lengths, traffic volumes, or a 2155
number of other MOEs from the microsimulation tools for multiple links in the analysis network.
The output table may be used to summarize results for any MOE. Depending on the complexity
of the project, the project manager may require additional MOEs to be summarized. The results
from the multiple runs must be averaged and then summarized in the tables and figures 2160
previously described. If the project manager wants to compare the results from the
microsimulation tools to levels of service, the traffic simulation MOEs must be converted to
equivalent deterministic model MOEs. An example of this conversion is provided in Appendix D
for CORSIM. In this example, the density computed from CORSIM is converted to an adjusted
density taking into account passenger car equivalency factors. The adjusted density is then 2165
assigned a corresponding level of service.
Table 15 – CORSIM/VISSIM Output Results Table
Location
Speed Results for Link 1-2 (mph)
Scenario 1 Scenario 2
AM PM AM PM
Location 1 51.8 33.8 55.4 50.9
Location 2 50.3 31.7 56.2 51.1
Location 3 48.6 33.2 54.8 49.5

Chapter 9 – Output
Traffic Operations Analysis Tool Guidebook Version 1.1
Page | 82
Figure 18 – CORSIM Lane Schematic Figure
Actual Volumes 2 4,134 2 4,134 2 4,134 2 3,376 2 3,799 2 3,799 2 3,799 2 3,131 2 3,131 2 3,560 2 3,560 2 3,560 2 3,560 2 3,560 2 3,560
Simulated Volumes 1 4,126 1 4,126 1 4,129 1 3,384 1 3,806 1 3,806 1 3,806 1 3,141 1 3,143 1 3,549 1 3,550 1 3,551 1 3,551 1 3,550 1 3,549
9 9 9 9
845 ft 706 ft 656 ft
758 vph 423 vph 668 vph 429 vph
745 vph 422 vph 665 vph 406 vph
Distance (ft) 636 583 1,381 961 184 296 226 509 495 1,477 575 594 539 618 533
Speed (mph) 65.8 66.9 65.1 65.2 61.6 62.8 63.2 64.4 65.3 63.5 64.3 64.7 64.9 64.8 64.8
Density (pc/ln/mi) 31.6 30.9 24.3 26.0 20.6 20.2 20.1 24.4 24.1 22.9 27.6 27.4 27.4 27.4 27.4
100 101 102 103 104 105 106 107 108 109 110 111 112 113 114 115
Actual Volumes 2 4,134 2 4,134 2 4,134 2 3,376 2 3,799 2 3,799 2 3,799 2 3,131 2 3,131 2 3,560 2 3,560 2 3,560 2 3,560 2 3,560 2 3,560
Simulated Volumes 1 4,126 1 4,126 1 4,129 1 3,384 1 3,806 1 3,806 1 3,806 1 3,141 1 3,143 1 3,549 1 3,550 1 3,551 1 3,551 1 3,550 1 3,549
9 9 9 9
Distance (ft) 636 583 1,381 961 184 296 226 509 495 1,477 575 594 539 618 533
` `
Speed (mph) 66.0 67.8 66.2 66.0 66.0 65.3 65.0 65.3 65.5 65.1 64.9 65.0 65.1 65.1 65.1
Density (pc/ln/mi) 31.6 27.9 26.3 23.5 23.3 24.2 24.7 24.8 24.8 26.1 27.5 27.6 27.6 27.6 27.7
Speed (mph) 65.7 66.1 64.8 64.5 59.8 60.1 61.6 63.5 65.0 62.2 63.8 64.5 64.7 64.5 64.5
Density (pc/ln/mi) 33.2 33.8 29.8 28.4 27.5 25.9 24.9 24.0 23.4 29.2 27.7 27.3 27.2 27.2 27.1
Speed (mph) 62.4 56.9 63.8 62.9 55.4
Density (pc/ln/mi) 7.3 10.9 10.5 10.6 0.6
100 101 102 103 104 105 106 107 108 109 110 111 112 113 114 115
NOTE: numbers in chart are provided for illustrative purposes only
LEGEND Network StatisticsSelected Measures of Effectiveness
Overall Delay (min.)
100 Node Number Total Number of Stops
Other MOEs
Freeway Density Weave/Ramp Density Freeway, Weave, and Ramp Other MOEs
(pc/ln/mi) (pc/ln/mi) Density Coloring Other MOEs
45 and above 43 and above Density above 75 pc/ln/mi
35 to 45 35 to 43 Density above 55 pc/ln/mi
26 to 35 28 to 35 Density above 43 pc/ln/mi
18 to 26 20 to 28
11 to 18 10 to 20
0 to 11 0 to 10
INTERSTATE 95 NORTHBOUND
INTERSTATE 95 NORTHBOUND
FREEWAY SEGMENTS
Actual Ramp Volumes
Simulated Ramp Volumes
FREEWAY SEGMENTS
Ov
era
ll S
eg
me
nt
Lan
e 2
Lan
e 1
RA
MP
RAMP/WEAVE FREEWAY RAMP/WEAVE SEGMENTS FREEWAY SEGMENTS RAMP/WEAVE FREEWAY SEGMENTS
To PB
EB
From
PB EB
To PB
WB
From
PB WB
FREEWAY SEGMENTSRAMP/WEAVE FREEWAY RAMP/WEAVE SEGMENTS FREEWAY SEGMENTS RAMP/WEAVE
Results
Figure XXNorthbound PM Peak Hour MOEs
Washington Boulevard 2012 Build Scenario
2170

Chapter 9 – Output
Traffic Operations Analysis Tool Guidebook Version 1.1
Page | 83
Figure 19 – VISSIM Lane Schematic Figure
Actual Volumes 5,284 5,284 4,531 5,512 4,228 5,350 3,838 3,992 3,992 6,483 5,579 5,912 5,912 5,912 5,375 6,096 2,149 4,634 4,634 4,634 4,286
Simulated Volumes 5,018 5,014 4,268 5,243 3,972 5,130 3,773 3,851 3,930 6,226 5,434 5,703 5,735 5,735 5,121 5,778 2,169 4,398 4,470 4,441 4,262
Chamberlayne Ave
753 vph 981 vph 1,285 vph 1,122 vph 1,512 vph 154 vph 2,491 vph 904 vph 327 vph 537 vph 723 vph 3,947 vph 2,448 vph 349 vph
739 vph 978 vph 1,217 vph 1,153 vph 1,346 vph 165 vph 2,304 vph 782 vph 325 vph 497 vph 701 vph 3,586 vph 2,303 vph 250 vph
Distance (ft) 1,093 304 2,111 1,072 732 1,677 1,440 198 1,172 1,027 1,424 279 8,975 549 2,400 1,615 4,679 295 630 141 4,246
Speed (mph) 49.4 50.3 52.0 32.7 49.6 50.1 50.9 41.1 52.3 39.0 54.0 46.3 54.3 43.3 43.9 48.0 57.8 52.0 55.3 50.6 57.4
Density (pc/ln/mi) 34.5 24.6 27.8 42.1 26.8 25.6 24.7 21.0 25.1 40.3 33.5 28.0 35.2 44.2 40.6 31.1 12.6 21.3 27.1 20.3 24.8
302 328 400 304 403 306 307 308 309 337 339 341 311 312 315 317 319 349 350 426 581
INTERSTATE 95 NORTHBOUND
3 3 3 3 3 3 3 3 3 3 3 3 3 3 3 3 3 3 3 3
Actual Volumes 2 5,284 2 5,284 2 4,531 2 5,512 2 4,228 2 5,350 2 3,838 2 3,992 2 3,992 2 6,483 2 5,579 2 5,912 2 5,912 5,912 2 5,375 2 6,096 2 2,149 2 4,634 2 4,634 2 4,634 2 4,286
Simulated Volumes 1 5,018 1 5,014 1 4,268 1 5,243 1 3,972 1 5,130 1 3,773 1 3,851 1 3,930 1 6,226 1 5,434 1 5,703 1 5,735 5,735 1 5,121 1 5,778 1 2,169 1 4,398 1 4,470 1 4,441 1 4,262
9 9 9 9 9 9 9 9 9 9
Distance (ft) 1,093 304 2,111 1,072 732 1,677 1,440 198 1,172 1,027 1,424 279 8,975 549 2,400 1,615 4,679 295 630 141 4,246
`
Speed (mph) 53.7 54.1 54.4 44.0 52.1 53.4 53.1 50.7 51.8 43.9 56.0 56.1 54.7 50.9 54.8 57.1 57.1 57.6 58.2 57.5
1626 1608 1357 1455 1399 1363 1291 1313 1318 1539 1916 1913 1932 1311 1185 1073 1023 1228 1342 1425
Density (pc/ln/mi) 30.3 29.8 25.1 33.5 26.9 25.6 24.3 25.9 25.5 35.2 34.2 34.1 35.3 25.9 21.6 18.8 17.9 21.3 23.1 24.8
Speed (mph) 51.6 53.0 52.8 34.1 50.4 51.0 50.6 47.1 53.2 39.1 53.7 51.4 54.7 45.5 42.9 49.0 57.4 55.2 56.6 57.7 57.6
1511 1474 1428 1275 690 1175 1284 1260 1154 1258 1654 392 1851 1889 1950 1432 1673 940 1822 956 918 1636 1671 1544
Density (pc/ln/mi) 29.3 27.9 27.3 38.2 23.3 25.2 24.9 24.5 23.7 42.4 34.5 36.7 35.7 31.8 39.2 19.3 16.7 16.6 28.9 29.0 26.8
Speed (mph) 42.9 47.6 48.7 27.8 46.4 48.1 49.0 43.7 51.9 37.0 52.4 48.7 53.4 43.2 37.9 43.8 58.8 50.3 51.7 50.6 56.9
1881 1445 739 1482 978 1635 527 1398 1153 1183 1346 1222 165 1293 1355 2304 2007 391 1667 325 1756 1853 2326 497 2138 701 2054 1763 140 2303 1593 1607 1315 250 1294
Density (pc/ln/mi) 43.9 30.4 31.1 60.0 30.2 24.6 25.0 29.6 26.2 54.5 31.8 36.1 34.7 54.3 56.7 47.1 2.4 31.7 31.1 26.0 22.7
Speed (mph) 46.5 24.8 47.9 22.8 35.8 29.2 41.1 44.2 45.3 36.1
487 878 1300 91 1026 146 1886 1600 864 113
Density (pc/ln/mi) 10.5 36.8 27.2 4.0 29.1 5.0 46.5 36.5 19.1 3.1
302 328 400 304 403 306 307 308 309 337 339 341 311 312 315 317 319 349 350 426 581
NOTE: numbers in chart are provided for illustrative purposes only
LEGEND Network StatisticsSelected Measures of Effectiveness
Overall Delay (min.)
500 Link Number Total Number of Stops
Other MOEs
Freeway Density Weave/Ramp Density Other MOEs
(pc/ln/mi) Other MOEs
Density above pc/ln/mi
Density above pc/ln/mi
Density above pc/ln/mi
442
To
Westbrook Ave
Lan
e 1
Lan
e 3
Acc/D
ec/
Au
xil
lary
Lan
e 2
FREEWAY
I-64 EB
From
7th St
FREEWAY
416
To
Hermitage Rd
INTERSTATE 95 NORTHBOUND
FREEWAYFREEWAY
Actual Ramp Volumes
Simulated Ramp Volumes
FREEWAY RAMP/WEAVERAMP/WEAVE
FREEWAY RAMP/WEAVE FREEWAY
420 402
To
Broad St/Oliver Hill Way
FREEWAYRAMP/WEAVE RAMP/WEAVEFREEWAY FREEWAY FREEWAYRAMP/WEAVE
FREEWAYRAMP/WEAVE FREEWAY RAMP/WEAVE
414
From
Belvedere NB
415 436
From
N Blvd
To
I-64
318
RAMP/WEAVE RAMP/WEAVE
FREEWAY RAMP/WEAVE RAMP/WEAVE FREEWAY RAMP/WEAVE FREEWAY RAMP/WEAVE FREEWAY RAMP/WEAVE FREEWAY FREEWAY RAMP/WEAVE
FREEWAY FREEWAY FREEWAY FREEWAY
From
I-64
444
RAMP/WEAVE RAMP/WEAVEO
ve
rall S
eg
me
nt
412
To
Dow ntow n Expy
From
Dow ntow n Expy
408404405
From
I-64 WB
To
413
From
Broad St
To
FREEWAY
Results
0 to 10
45 and above
35 to 45
26 to 35
18 to 26
11 to 18
0 to 11
Freeway, Weave, and Ramp
Density Coloring
75
43
55
(pc/ln/mi)
35 to 43
43 and above
28 to 35
20 to 28
10 to 20
Figure XXI-64 and I-95 Overlap Report
Northbound I-95 AM Peak Hour MOEs2022 No-Build Scenario
7:15 - 8:15 AM

Technical Appendix
Traffic Operations Analysis Tool Guidebook Version 1.1
Technical Appendix
2175 TECHNICAL APPENDIX

Technical Appendix
Traffic Operations Analysis Tool Guidebook Version 1.1
Technical Appendix
This page is intentionally left blank.

Appendix A – Additional Resources
Traffic Operations Analysis Tool Guidebook Version 1.1
A-1
APPENDIX A
ADDITIONAL RESOURCES REVIEWED

Appendix A – Additional Resources
Traffic Operations Analysis Tool Guidebook Version 1.1
A-2
2180
This page is intentionally left blank.

Appendix A – Additional Resources
Traffic Operations Analysis Tool Guidebook Version 1.1
A-3
TRAFFIC ANALYSIS TOOLBOX VOLUME II: DECISION SUPPORT METHODOLOGY FOR
SELECTING TRAFFIC ANALYSIS TOOLS FHWA
JULY 2004 http://ops.fhwa.dot.gov/trafficanalysistools/tat_vol2/Vol2_Methodology.pdf
TRAFFIC ANALYSIS TOOLBOX VOLUME III: GUIDELINES FOR APPLYING TRAFFIC
MICROSIMULATION MODELING SOFTWARE FHWA
JULY 2004 http://ops.fhwa.dot.gov/trafficanalysistools/tat_vol3/vol3_guidelines.pdf
TRAFFIC ANALYSIS TOOLBOX VOLUME IV: GUIDELINES FOR APPLYING CORSIM
MICROSIMULATION MODELING SOFTWARE FHWA
JANUARY 2007 http://ops.fhwa.dot.gov/trafficanalysistools/tat_vol4/vol4_guidelines.pdf

Appendix A – Additional Resources
Traffic Operations Analysis Tool Guidebook Version 1.1
A-4
PROTOCOL FOR VISSIM SIMULATION - Oregon Department of Transportation
JUNE 2011 http://www.oregon.gov/ODOT/TD/TP/docs/apm/addc.pdf
ADVANCED CORSIM TRAINING MANUAL -
Minnesota Department of Transportation MAY 2004
http://www.dot.state.mn.us/trafficeng/modeling/resources/CORSIMmanual/final%20corsim%20manual%209-19-09.pdf
MICROSIMULATION CALIBRATION AND VALIDATION HANDBOOK -
Virginia Transportation Research Council OCTOBER 2006
http://www.virginiadot.org/vtrc/main/online_reports/pdf/07-cr6.pdf
TRAFFIC ANALYSIS TOOLBOX VOLUME VIII: WORK ZONE MODELING AND SIMULATION-
A GUIDE FOR DECISION-MAKERS FHWA
AUGUST 2008 http://ops.fhwa.dot.gov/wz/traffic_analysis/tatv8_wz/tatv8workzone.pdf

Appendix A – Additional Resources
Traffic Operations Analysis Tool Guidebook Version 1.1
A-5
FHWA SAMPLE SIZE INFORMATION

Appendix A – Additional Resources
Traffic Operations Analysis Tool Guidebook Version 1.1
A-6
2185
This page is intentionally left blank.

Appendix A – Additional Resources
Traffic Operations Analysis Tool Guidebook Version 1.1
A-7

Appendix A – Additional Resources
Traffic Operations Analysis Tool Guidebook Version 1.1
A-8

Appendix A – Additional Resources
Traffic Operations Analysis Tool Guidebook Version 1.1
A-9
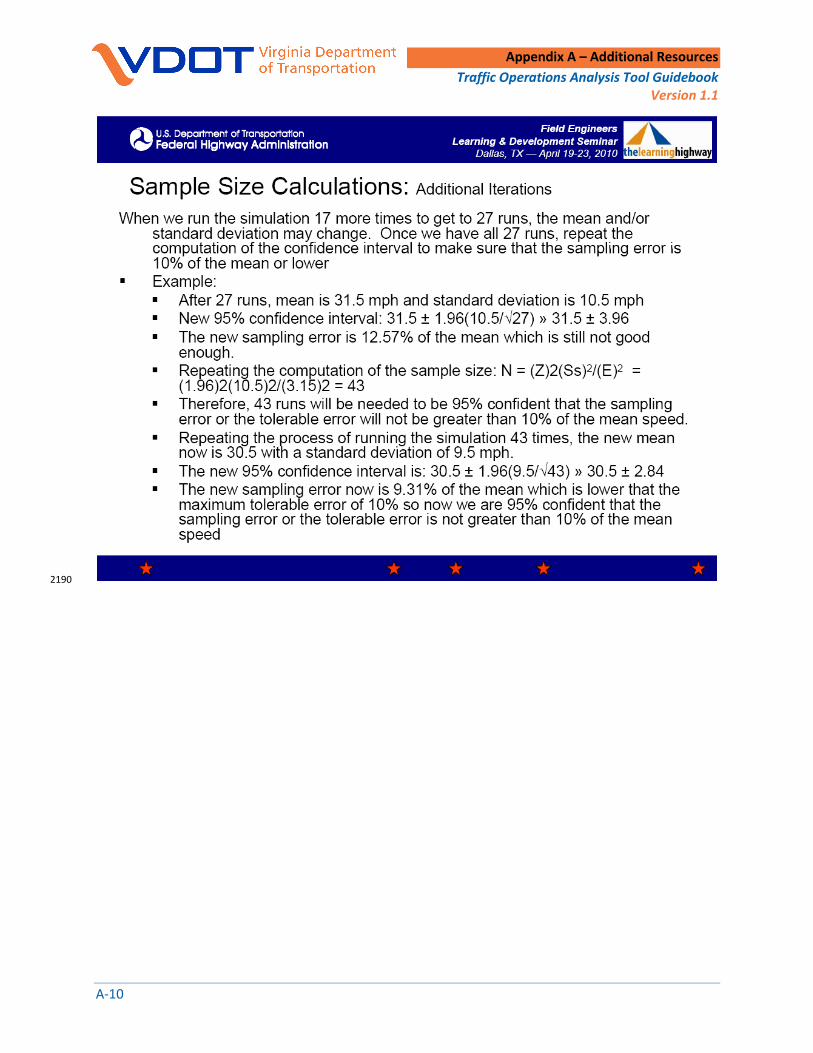
Appendix A – Additional Resources
Traffic Operations Analysis Tool Guidebook Version 1.1
A-10
2190

Appendix B – Analysis Tool Selection Matrix
Traffic Operations Analysis Tool Guidebook Version 1.1
B-1
APPENDIX B
TRAFFIC OPERATIONS ANALYSIS TOOL SELECTION MATRIX

Appendix B – Analysis Tool Selection Matrix
Traffic Operations Analysis Tool Guidebook Version 1.0
B-2
This page is intentionally left blank.

Appendix B – Traffic Operations Analysis Tool Selection Matrix
Traffic Operations Analysis Tool Guidebook Version 1.1
B-3
Traffic Operations Analysis Tool Selection Matrix
Saturation Level (General Description)
UNDERSATURATED CONDITIONS (No prolonged queuing approaching free-flow conditions)
OVERSATURATED CONDITIONS* (Queuing exists beyond peak hour, HCM capacity checks fail)
Special Notes Location Description Point Segment and
Facility Corridor, Area,
and System Point
Segment and Facility
Corridor, Area, and System
INTE
RSE
CTI
ON
/ A
RTE
RIA
L /
HIH
GW
AY
AN
ALY
SES
Signalized Intersection Operations
HCS SimTraffic Synchro
HCS SimTraffic Synchro
SimTraffic Synchro
SimTraffic Synchro
CORSIM SimTraffic Synchro VISSIM
CORSIM SimTraffic Synchro VISSIM
Synchro, supplemented by SimTraffic, is the preferred tool for this type of analysis
Use both SIDRA Intersection and Synchro for networks including roundabouts and signalized/unsignalized intersections
CORSIM and VISSIM should only be considered for oversaturated Segments, Facilities, Corridors, Areas, and Systems analyses due to modeling effort
Do not use HCS in oversaturated conditions or on Corridors, Areas, and Systems analyses
Signalized Intersection Preemption/Transit Priority
VISSIM VISSIM VISSIM VISSIM VISSIM VISSIM VISSIM is the preferred tool for this type of analysis
Unsignalized Intersection Operations
(AWS and TWS)
HCS SimTraffic Synchro
HCS SimTraffic Synchro
SimTraffic Synchro
SimTraffic Synchro
SimTraffic Synchro
SimTraffic Synchro
HCS is the preferred tool for undersaturated Points, Segments and Facilities analyses, but should not be used on Corridors, Areas, and Systems analyses in or oversaturated conditions
For conditions where HCS cannot be used, Synchro is the preferred tool for this type of analysis supplemented by SimTraffic
Use both SIDRA Intersection and Synchro in networks including roundabouts and signalized/unsignalized intersections
CORSIM and VISSIM should not be used to model this intersection type unless the intersection is included in a larger model
Unsignalized Intersection Operations
(Roundabout)
SIDRA Intersection VISSIM
SIDRA Intersection VISSIM
SIDRA Intersection VISSIM
SIDRA Intersection VISSIM
SIDRA Intersection VISSIM
SIDRA Intersection VISSIM
SIDRA Intersection is the preferred tool for this type of analysis
HCS, Synchro, SimTraffic, and CORSIM do not have acceptable roundabout analysis capabilities, and therefore, cannot be used for roundabout analysis
If roundabouts are included in a Synchro network, then a separate analysis using SIDRA Intersection must be completed for the analysis of the roundabout(s)
Use both SIDRA Intersection and Synchro in networks including roundabouts and signalized/unsignalized intersections
Two-Lane Highway Operations
Not Applicable
HCS VISSIM
VISSIM Not
Applicable VISSIM VISSIM
HCS is the preferred tool for undersaturated Points, Segments and Facilities analyses, but should not be used on analyses in oversaturated conditions
Only use SIDRA Intersection if there are networks with roundabouts
Point analyses are not applicable for this type of facility
Multi-Lane Highway Operations
Not Applicable
CORSIM HCS
SimTraffic Synchro VISSIM
CORSIM SimTraffic Synchro VISSIM
Not Applicable
CORSIM SimTraffic Synchro VISSIM
CORSIM SimTraffic Synchro VISSIM
Synchro, SimTraffic and HCS are the preferred tools for this type of analysis (HCS in undersaturated conditions only)
Use SIDRA Intersection for this type of analysis if a roundabout is included
Do not use HCS in oversaturated conditions or on Corridors, Areas, and Systems analyses
When a simulation-based tool is required, or chosen in lieu of HCS, there is no priority between CORSIM and VISSIM
Point analyses are not applicable for this type of facility
Non-Traditional Intersection Operations (5-Legs, SPUI)
CORSIM VISSIM
CORSIM VISSIM
CORSIM VISSIM
CORSIM VISSIM
CORSIM VISSIM
CORSIM VISSIM
VISSIM is the preferred tool for these types of analyses
HCS, Synchro, or SIDRA Intersection should not be used to analyze non-traditional intersections
***GENERAL NOTES***
The tools included in each box, in alphabetical order, are identified as acceptable tools for the subject analysis. If a tool is not listed, then VDOT will not accept it for that type of operational analysis. Refer to "Special Notes" for tool preferences.
Exact definitions for "Oversaturated Conditions" will differ between VDOT regions. Traffic analysis tools referred to in matrix: HCS 2010, Synchro/SimTraffic 8.0, SIDRA Intersection 5.1, VISSIM 5.4, and CORSIM 6.3. Page 1 of 3

Appendix B – Traffic Operations Analysis Tool Selection Matrix
Traffic Operations Analysis Tool Guidebook Version 1.1
B-4
2195
Traffic Operations Analysis Tool Selection Matrix
Saturation Level (General Description)
UNDERSATURATED CONDITIONS (No prolonged queuing approaching free-flow conditions)
OVERSATURATED CONDITIONS*
Special Notes Location Description Point Segment and
Facility Corridor, Area, and
System Point
Segment and Facility
Corridor, Area, and System
FREE
WA
Y/I
NTE
RC
HA
NG
E A
NA
LYSE
S
Freeway Segment Operations
(limited access)
Not Applicable
CORSIM HCS
VISSIM
CORSIM VISSIM
Not Applicable
CORSIM VISSIM
CORSIM VISSIM
HCS should not be used in oversaturated conditions or on Corridors, Areas, and Systems analyses, but is the preferred tool for undersaturated Segments and Facilities analyses
Point analyses are not applicable for this type of facility
When a simulation-based tool is required, or chosen in lieu of HCS, there is no priority between CORSIM and VISSIM
Merge/Diverge Operations
CORSIM HCS
VISSIM
CORSIM HCS
VISSIM
CORSIM VISSIM
CORSIM VISSIM
CORSIM VISSIM
CORSIM VISSIM
HCS should not be used in oversaturated conditions or on Corridors, Areas, and Systems analyses, but is the preferred tool for undersaturated Points, Segments and Facilities analyses
When a simulation-based tool is required, or chosen in lieu of HCS, there is no priority between CORSIM and VISSIM
Weaving Segment Operations
Not Applicable
CORSIM HCS
VISSIM
CORSIM VISSIM
Not Applicable
CORSIM VISSIM
CORSIM VISSIM
HCS should not be used in oversaturated conditions or on Corridors, Areas, and Systems analyses, but is the preferred tool for undersaturated Segments and Facilities analyses
Point analyses are not applicable for this type of facility
When a simulation-based tool is required, or chosen in lieu of HCS, there is no priority between CORSIM and VISSIM
Freeway HOV/Ramp Metering Operations /
Managed Lanes VISSIM VISSIM VISSIM VISSIM VISSIM VISSIM
VISSIM is the preferred tool for these analyses
Synchro, SIDRA Intersection , and HCS cannot be used for these types of analyses
Collector-Distributor Facilities
Not Applicable
CORSIM HCS
VISSIM
CORSIM VISSIM
Not Applicable
CORSIM VISSIM
CORSIM VISSIM
HCS should not be used in oversaturated conditions or on Corridors, Areas, and Systems analyses, but is the preferred tool for undersaturated Segments and Facilities analyses with more than one lane
Point analyses are not applicable for this type of facility
When a simulation-based tool is required, or chosen in lieu of HCS, there is no priority between CORSIM and VISSIM
***GENERAL NOTES***
The tools included in each box, in alphabetical order, are identified as acceptable tools for the subject analysis. If a tool is not listed, then VDOT will not accept it for that type of operational analysis. Refer to "Special Notes" for tool preferences.
Exact definitions for "Oversaturated Conditions" will differ between VDOT regions. Traffic analysis tools referred to in matrix: HCS 2010, Synchro/SimTraffic 8.0, SIDRA Intersection 5.1, VISSIM 5.4, and CORSIM 6.3. Page 2 of 3
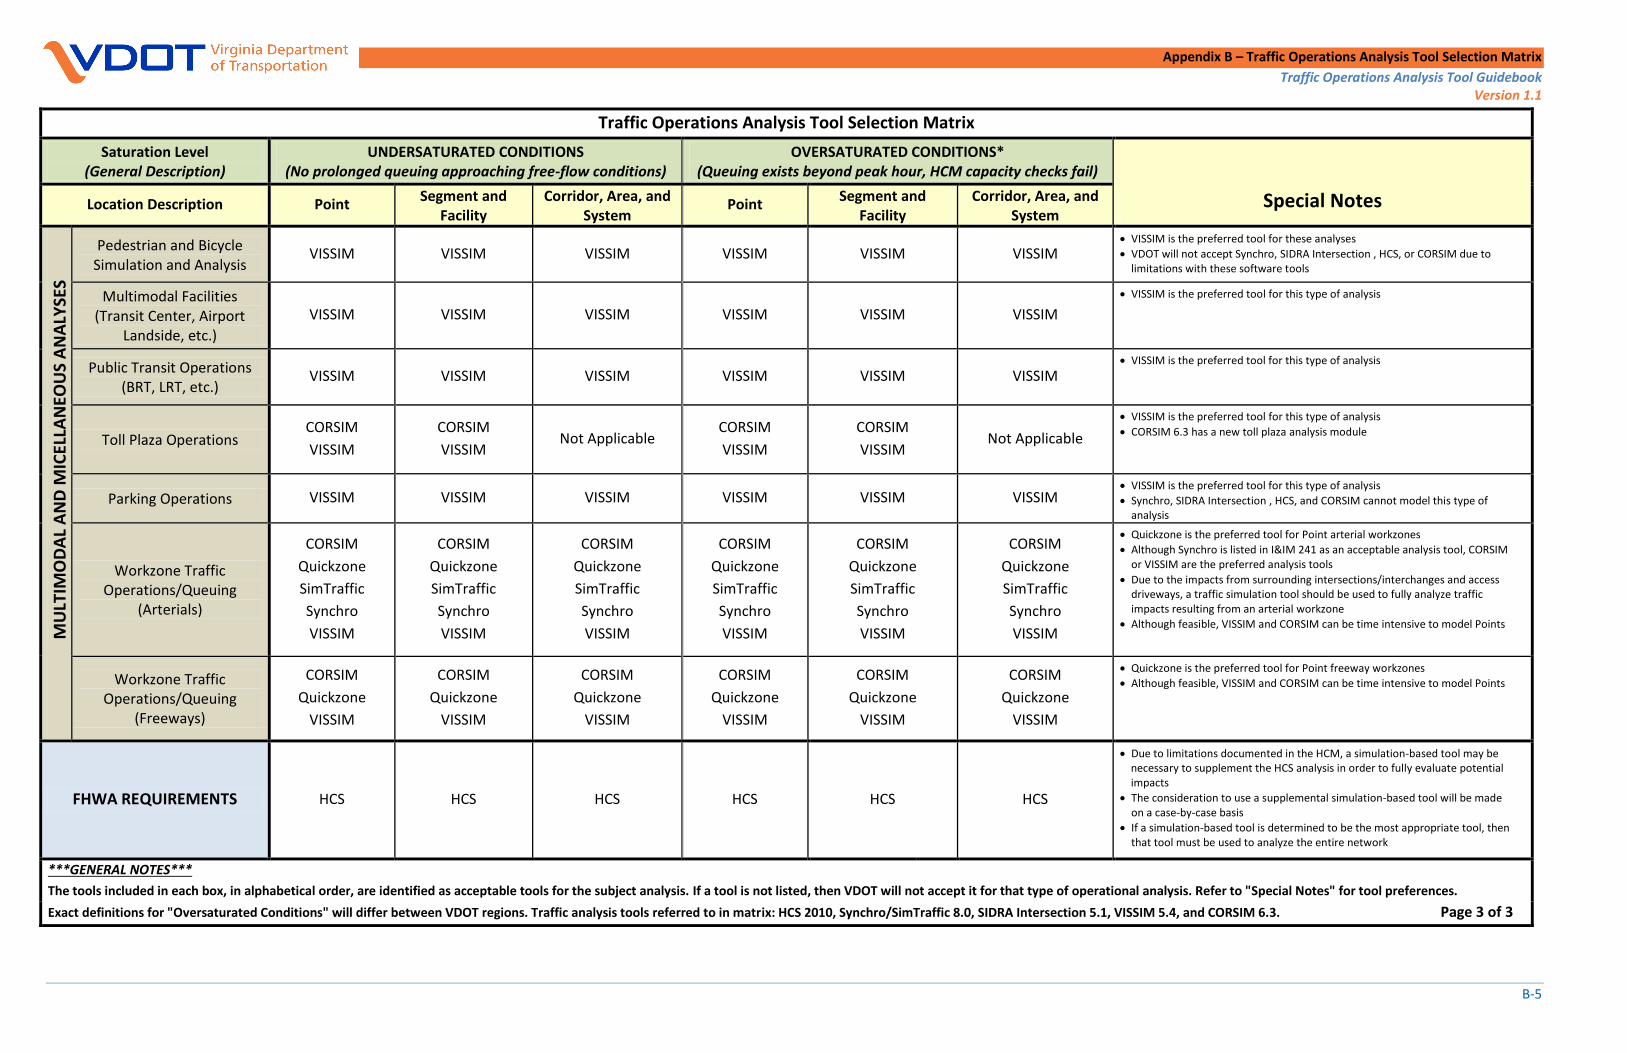
Appendix B – Traffic Operations Analysis Tool Selection Matrix
Traffic Operations Analysis Tool Guidebook Version 1.1
B-5
Traffic Operations Analysis Tool Selection Matrix
Saturation Level (General Description)
UNDERSATURATED CONDITIONS (No prolonged queuing approaching free-flow conditions)
OVERSATURATED CONDITIONS* (Queuing exists beyond peak hour, HCM capacity checks fail)
Special Notes Location Description Point Segment and
Facility Corridor, Area, and
System Point
Segment and Facility
Corridor, Area, and System
MU
LTIM
OD
AL
AN
D M
ICEL
LAN
EOU
S A
NA
LYSE
S
Pedestrian and Bicycle Simulation and Analysis
VISSIM VISSIM VISSIM VISSIM VISSIM VISSIM VISSIM is the preferred tool for these analyses
VDOT will not accept Synchro, SIDRA Intersection , HCS, or CORSIM due to limitations with these software tools
Multimodal Facilities (Transit Center, Airport
Landside, etc.)
VISSIM VISSIM VISSIM VISSIM VISSIM VISSIM
VISSIM is the preferred tool for this type of analysis
Public Transit Operations (BRT, LRT, etc.)
VISSIM VISSIM VISSIM VISSIM VISSIM VISSIM VISSIM is the preferred tool for this type of analysis
Toll Plaza Operations CORSIM
VISSIM
CORSIM
VISSIM Not Applicable
CORSIM
VISSIM
CORSIM
VISSIM Not Applicable
VISSIM is the preferred tool for this type of analysis
CORSIM 6.3 has a new toll plaza analysis module
Parking Operations VISSIM VISSIM VISSIM VISSIM VISSIM VISSIM VISSIM is the preferred tool for this type of analysis
Synchro, SIDRA Intersection , HCS, and CORSIM cannot model this type of analysis
Workzone Traffic Operations/Queuing
(Arterials)
CORSIM
Quickzone
SimTraffic
Synchro
VISSIM
CORSIM
Quickzone
SimTraffic
Synchro
VISSIM
CORSIM
Quickzone
SimTraffic
Synchro
VISSIM
CORSIM
Quickzone
SimTraffic
Synchro
VISSIM
CORSIM
Quickzone
SimTraffic
Synchro
VISSIM
CORSIM
Quickzone
SimTraffic
Synchro
VISSIM
Quickzone is the preferred tool for Point arterial workzones
Although Synchro is listed in I&IM 241 as an acceptable analysis tool, CORSIM or VISSIM are the preferred analysis tools
Due to the impacts from surrounding intersections/interchanges and access driveways, a traffic simulation tool should be used to fully analyze traffic impacts resulting from an arterial workzone
Although feasible, VISSIM and CORSIM can be time intensive to model Points
Workzone Traffic Operations/Queuing
(Freeways)
CORSIM
Quickzone
VISSIM
CORSIM
Quickzone
VISSIM
CORSIM
Quickzone
VISSIM
CORSIM
Quickzone
VISSIM
CORSIM
Quickzone
VISSIM
CORSIM
Quickzone
VISSIM
Quickzone is the preferred tool for Point freeway workzones
Although feasible, VISSIM and CORSIM can be time intensive to model Points
FHWA REQUIREMENTS HCS HCS HCS HCS HCS HCS
Due to limitations documented in the HCM, a simulation-based tool may be necessary to supplement the HCS analysis in order to fully evaluate potential impacts
The consideration to use a supplemental simulation-based tool will be made on a case-by-case basis
If a simulation-based tool is determined to be the most appropriate tool, then that tool must be used to analyze the entire network
***GENERAL NOTES***
The tools included in each box, in alphabetical order, are identified as acceptable tools for the subject analysis. If a tool is not listed, then VDOT will not accept it for that type of operational analysis. Refer to "Special Notes" for tool preferences.
Exact definitions for "Oversaturated Conditions" will differ between VDOT regions. Traffic analysis tools referred to in matrix: HCS 2010, Synchro/SimTraffic 8.0, SIDRA Intersection 5.1, VISSIM 5.4, and CORSIM 6.3. Page 3 of 3
Appendix C – Simulation Calibration Factors
Traffic Operations Analysis Tool Guidebook Version 1.1
C-1
2200
APPENDIX C
TRAFFIC SIMULATION CALIBRATION FACTORS

Appendix C – Simulation Calibration Factors
Traffic Operations Analysis Tool Guidebook Version 1.1
C-2
This page is intentionally left blank.

Appendix C – Simulation Calibration Factors
Traffic Operations Analysis Tool Guidebook Version 1.1
C-3
CORSIM Calibration Factors
Freeways – key calibration factors: speeds, travel time, queues 2205
Truck fleet
Vertical grades
Link free-flow speed
Headway factor
O-D matrix 2210
Vehicle entry headway distributions
Erlang – preferred for freeways
Normal – preferred for arterials
Anticipatory lane change parameter – ramp merge speed (default – 43 mph)
Warning sign location (merge) – location of warning sign upstream of merge 2215
(default – 1500 ft)
Warning sign location (diverge/lane drop) – location of warning sign upstream of
diverge (default – 2500 ft)
Fresim vehicle parameters information
Current fleet percentages 2220
Maximum non-emergency deceleration
Maximum emergency deceleration
Fresim model parameters
Minimum separation for generation of vehicles – controls freeway capacity
(default – 1.6 sec = 2250 vplph) 2225
Arterials – key calibration factors: speeds, travel time, queues
Headway spacing
Truck fleet
Vertical grades 2230
Link free-flow speed
Existing signal timing (if applicable)
Vehicle entry headway distributions
Normal – preferred for arterials
Netsim vehicle parameters information 2235
Current fleet percentages
Maximum non-emergency deceleration
Maximum emergency deceleration

Appendix C – Simulation Calibration Factors
Traffic Operations Analysis Tool Guidebook Version 1.1
C-4
VISSIM Calibration Factors 2240
Freeways – key calibration factors: output volumes, speeds, travel time, queues
Truck fleet – vehicle compositions
Vertical grades
Free-flow speed – desired speed decisions
O-D matrix – routing decisions 2245
Connector lane change and emergency stop distances
Location of static route decision points
Car following parameters
Wiedemann 99 model – freeway traffic
o Standstill distance 2250
o Headway time
o Necessary lane change parameters
o Waiting time before diffusion
o Safety distance reduction factor
o Advanced merging 2255
o Cooperative lane change
Arterials – key calibration factors: output volumes, speeds, travel time, queues
Truck fleet – vehicle compositions
Free-flow speed – desired speed decisions 2260
Turning speeds – reduced speed areas
Existing signal timing (if applicable)
Connector lane change and emergency stop distances
Location of static route decision points
Dwell time distribution at STOP signs (if needed) 2265
Minimum headway – priority rules (if applicable)
Conflict area parameters
Front gap
Rear gap
Safety Distance Factor 2270
Car following parameters
Wiedemann 74 model – arterial / urban traffic
o Average standstill distance
o Saturation flow rate (additive/multiplicative part of safety distance)
o Necessary lane change parameters 2275
o Waiting time before diffusion
o Safety distance reduction factor
o Advanced merging
o Cooperative lane change
Unique parameters sets by link type (i.e., high speed arterial, bike path, etc.)2280

Appendix D – Simulation Output LOS Conversion
Traffic Operations Analysis Tool Guidebook Version 1.1
D-1
APPENDIX D
Traffic Simulation Output Level of Service Conversion

Appendix D – Simulation Output LOS Conversion
Traffic Operations Analysis Tool Guidebook Version 1.1
D-2
This page is intentionally left blank.
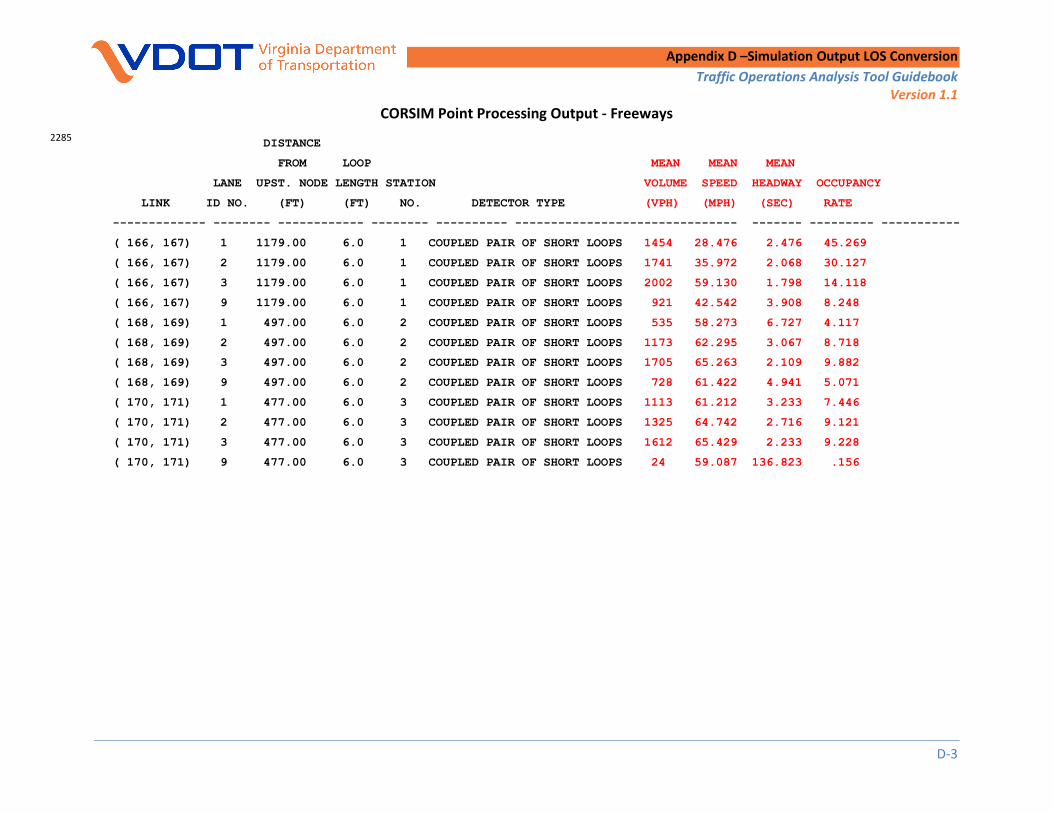
Appendix D –Simulation Output LOS Conversion
Traffic Operations Analysis Tool Guidebook Version 1.1
D-3
CORSIM Point Processing Output - Freeways
2285 DISTANCE FROM LOOP MEAN MEAN MEAN LANE UPST. NODE LENGTH STATION VOLUME SPEED HEADWAY OCCUPANCY LINK ID NO. (FT) (FT) NO. DETECTOR TYPE (VPH) (MPH) (SEC) RATE ------------- -------- ------------ -------- ---------- ------------------------------- ------- --------- ----------- ( 166, 167) 1 1179.00 6.0 1 COUPLED PAIR OF SHORT LOOPS 1454 28.476 2.476 45.269 ( 166, 167) 2 1179.00 6.0 1 COUPLED PAIR OF SHORT LOOPS 1741 35.972 2.068 30.127 ( 166, 167) 3 1179.00 6.0 1 COUPLED PAIR OF SHORT LOOPS 2002 59.130 1.798 14.118 ( 166, 167) 9 1179.00 6.0 1 COUPLED PAIR OF SHORT LOOPS 921 42.542 3.908 8.248 ( 168, 169) 1 497.00 6.0 2 COUPLED PAIR OF SHORT LOOPS 535 58.273 6.727 4.117 ( 168, 169) 2 497.00 6.0 2 COUPLED PAIR OF SHORT LOOPS 1173 62.295 3.067 8.718 ( 168, 169) 3 497.00 6.0 2 COUPLED PAIR OF SHORT LOOPS 1705 65.263 2.109 9.882 ( 168, 169) 9 497.00 6.0 2 COUPLED PAIR OF SHORT LOOPS 728 61.422 4.941 5.071 ( 170, 171) 1 477.00 6.0 3 COUPLED PAIR OF SHORT LOOPS 1113 61.212 3.233 7.446 ( 170, 171) 2 477.00 6.0 3 COUPLED PAIR OF SHORT LOOPS 1325 64.742 2.716 9.121 ( 170, 171) 3 477.00 6.0 3 COUPLED PAIR OF SHORT LOOPS 1612 65.429 2.233 9.228 ( 170, 171) 9 477.00 6.0 3 COUPLED PAIR OF SHORT LOOPS 24 59.087 136.823 .156

Appendix D – Simulation Output LOS Conversion
Traffic Operations Analysis Tool Guidebook Version 1.1
D-4
A B C D E F G H I J K L
LinkLane
#
Loop
Postion
Length
(feet)
Station
#VOL
Mean
Speed
(mph)
Mean
Headway
Mean
Occup
Non-
Adjusted
Density
Mean
Speed
(fps)
Mean Veh.
Occ. (sec)
Avg. Veh.
to car
Length (ft)
Avg. Veh.
To Car
Length
Ratio
Equivalent
pcphpl
Adj.
Density
(pc/mi/ln)
Lane
LOS
Mainline
LOS
(166, 167) 1 1179 6 1 1454 28.5 2.5 45.3 51.1 41.8 1.1 40.8 2.6 3828.4 134.4 F
(166, 167) 2 1179 6 1 1741 36.0 2.1 30.1 48.4 52.8 0.6 26.9 1.7 3017.7 83.9 F
(166, 167) 3 1179 6 1 2002 59.1 1.8 14.1 33.9 86.7 0.3 16.0 1.0 2068.7 35.0 E
(166, 167) 9 1179 6 1 921 42.5 3.9 8.2 21.7 62.4 0.3 14.1 1.0 921.0 21.6 C
(168, 169) 1 497 6 2 535 58.3 6.7 4.1 9.2 85.5 0.3 17.7 1.1 610.1 10.5 B
(168, 169) 2 497 6 2 1173 62.3 3.1 8.7 18.8 91.4 0.3 18.4 1.2 1395.9 22.4 C
(168, 169) 3 497 6 2 1705 65.3 2.1 9.9 26.2 95.7 0.2 14.0 1.0 1705.0 26.1 D
(168, 169) 9 497 6 2 728 61.4 4.9 5.1 11.9 90.1 0.3 16.6 1.1 779.2 12.7 B
(170, 171) 1 477 6 3 1113 61.2 3.2 7.4 18.2 89.8 0.2 15.6 1.0 1121.8 18.3 C
(170, 171) 2 477 6 3 1325 64.7 2.7 9.1 20.5 95.0 0.2 17.5 1.1 1498.6 23.1 C
(170, 171) 3 477 6 3 1612 65.4 2.2 9.2 24.6 96.0 0.2 13.8 1.0 1612.0 24.6 D
(170, 171) 9 477 6 3 24 59.1 136.8 0.2 0.4 86.7 0.2 14.3 1.0 24.0 0.4 A
F
C
C
CORSIM Level of Service Conversion – Freeways
LOS Conversion (by lane):
A – length of detector expressed in feet (input to point processing)
B – traffic volume expressed in vehicles per hour (direct output from point processing) 2290
C – mean speed expressed in miles per hour (direct output from point processing)
D – mean headway expressed in seconds (direct output from point processing)
E – mean occupancy rate (direct output from point processing)
F (non-adjusted density expressed in vehicles per mile per lane) = (3600 / C) / D
G (mean speed expressed in feet per second) = (C X 5280) / 3600 2295
H (mean vehicle occupancy expressed in seconds) = [(E / 100) X 3600] / B
I (average vehicle to car length expressed in feet) = (G X H) – A
J (average vehicle to car length ratio) = (I / 15.5) [if < 1.0, then 1.0]
K (equivalent passenger cars per hour per lane) = B X J L (adjusted density expressed in passenger cars per mile per lane) = K / C 2300
Lane LOS – equivalent HCM LOS for basic freeways for each lane Mainline LOS – weighted HCM LOS for basic freeways by segment