Traffic Safety Fundamentals Handbook · 2016-09-16 · professionals in both government agencies...
121
Traffic Safety Fundamentals Handbook Minnesota Department of Transportation Office of Traffic, Safety and Technology Revised June 2015 Prepared by CH2M, Inc.
-
Upload
nguyenkhuong -
Category
Documents
-
view
214 -
download
0
Transcript of Traffic Safety Fundamentals Handbook · 2016-09-16 · professionals in both government agencies...
Traffic Safety Fundamentals Handbook
Minnesota Department of TransportationOffice of Traffic, Safety and Technology
Revised June 2015Prepared by CH2M, Inc.

MnDOT Traffic Safety Fundamentals Handbook – IntroductionThe Minnesota Department of Transportation (MnDOT) published the original version of the Traffic Safety Fundamentals Handbook in 2001 and an updated version in 2008. Over 3,500 copies have since been distributed through MnDOT’s education and outreach efforts to practicing professionals in both government agencies and the private sector. In addition, the Handbook has been used as a resource in undergraduate and graduate traffic engineering classes at the University of Minnesota and is available to professionals in other states through the online posting on MnDOT’s website.
In the years since 2001, the field of traffic safety has witnessed a number of important changes. First, federal legislation (SAFETEA-LU) raised the level of importance of highway safety by making it a separate and distinct program and by increasing the level of funding dedicated to safety. In response to this legislation, the Federal Highway Administration (FHWA) provided implementation guidelines that required the states to prepare Strategic Highway Safety Plans (SHSPs) and encouraged their safety investments to be focused on low-cost stand-alone projects that can be proactively deployed across both state and local highway systems.
MnDOT initially prepared a Comprehensive Highway Safety Plan in 2004 and then completed updated Strategic Highway Safety Plans in 2007 and 2014. These documents included identification of a statewide safety goal, safety focus areas, and lists of high-priority safety strategies. These Plans also included key commitments intended to address FHWA’s safety objectives – adopting a long-term goal of achieving no traffic-related fatalities, a focus on reducing the most serious crashes, adding a new approach to the safety project development process that uses the results of systemic risk assessments to identify candidates for safety investment (in addition to the traditional site assessment approach used at high crash locations), dedicating a fraction of Highway Safety Improvement Program (HSIP) funds to improvements on local roadway systems, and increasing the level of engagement of local agencies in the statewide safety planning process. The key outcomes of these commitments include revising the priorities for HSIP, directing approximately 50% of HSIP funds toward implementing safety projects on the State’s local system of roadways, and completion of a project that was a first of its kind – the County Roadway Safety Plans (CRSPs). This project involved MnDOT providing
Traffic Safety Fundamentals Handbook – 2015 1
the technical assistance necessary to complete systemwide risk assessments and individual Safety Plans for each of Minnesota’s 87 counties. The county plans identified the priority crash types, a short list of effective, low-cost safety strategies, and the identification of the high-priority locations for HSIP investment. The CRSP project identified more than 17,000 safety projects, with an estimated implementation cost of approximately $246M.
As a result of these strategic safety planning efforts and the hard work of safety professionals in both state and local highway agencies, hundreds of highly effective safety projects have been implemented, and the results are impressive – Minnesota met the initial goal of achieving under 500 fatalities by 2008, and by 2011 the number fell to fewer than 400 fatalities. However, one fact remains constant – highway traffic fatalities are still the leading cause of death for Minnesotans under 35 years of age. This suggests there is still much work to do in order to move Minnesota Toward Zero Deaths.
This new edition of the Handbook has been updated to reflect new safety practices, policies, and research and is divided into four sections:
• Crash Characteristics – national and state crash totals, including the basic characteristics as a function of roadway classification, intersection control, roadway design, and access density.
• Safety Improvement Process – Site Analysis at High Crash Locations + Systemic Analysis = Comprehensive Safety Improvement Process.
• Traffic Safety Toolbox – identification of new tools (Highway Safety Manual and Crash Modification Clearinghouse) and an update on strategies, with an emphasis on effectiveness.
• Lessons Learned
For additional information regarding traffic safety, please contact either MnDOT’s Office of Traffic, Safety and Technology, State Traffic Safety Engineer (651) 234-7011 or Division of State Aid, State Aid Program Support Engineer (651) 366-3839.
Document Information and DisclaimerPrepared by: CH2M, Inc.
Authors: Howard Preston, PE, Veronica Richfield, and Nicole Farrington, PE
Funding: Provided by MnDOT Division of State Aid for Local Transportation
Published by: MnDOT Office of Traffic, Safety and Technology
The contents of this handbook reflect the views of the authors who are responsible for the facts and accuracy of the data presented. The contents do not necessarily reflect the views of policies of the Minnesota Department of Transportation at the time of the publication. This handbook does not constitute a standard, specification or regulation.
Traffic Safety Fundamentals Handbook – 2015 2
Table of ContentsCrash CharacteristicsA-2 Nationwide Historical Crash TrendsA-3 Upper Midwest Area 2013 Crash DataA-4 Fatality Rates of Surrounding States – 2013A-5 Minnesota Urban vs. Rural Crash ComparisonA-6 AASHTO’s Strategic Highway Safety Plan A-7 Role of Driver, Road, and VehicleA-8 Emergency Response Time Comparison A-9 Fatal Crashes are DifferentA-10 Minnesota’s Crash Mapping Analysis Tool (MnCMAT)A-12 Crash Involvement by Age and GenderA-13 Total Crashes by Road, Weather, and Lighting ConditionsA-14 Access vs. Mobility – The Functional Class ConceptA-15 Typical Functionally Classified Urban SystemA-16 Roadway Segment Crash Rates as a Function of Facility
Type and Access Density (MN) A-18 Intersection Crash Rates (MN) by Control Type and FamilyA-19 Intersection Crash Severity (MN) by Control Type and
FamilyA-20 Intersection Crash Distribution by Control Type and
Rural vs. UrbanA-21 Intersection Crashes – Severity vs. Frequency A-22 Roadway Segment Crash and Fatality Rates by
Jurisdictional ClassA-23 Roadway Segment Crash Rates Facility Type by Rural
vs. UrbanA-24 Roadway Segment Crash Distribution by Rural vs. Urban A-25 Segment Crashes – Severity vs. FrequencyA-26 Pedestrian/Bicycle Crash Distribution by Intersection
Control TypeA-27 Pedestrian/Bicycle Crash Distribution by Age
Safety Improvement Process B-2 Minnesota’s Strategic Highway Safety Plan (SHSP)B-3 Minnesota’s Safety Focus AreasB-4 Safety Focus Areas – Greater Minnesota vs. MetroB-5 Behavior Focus Area
– SpeedingB-6 – Impaired DrivingB-7 – Inattentive DrivingB-8 – Seat BeltsB-9 Infrastructure Focus Area
– IntersectionsB-10 – Lane DepartureB-11 Comprehensive Safety Improvement ProcessB-12 Why Have a Sustained High Crash Location
Identification Process?B-13 Alternative Methods for Identifying Potentially
Hazardous LocationsB-14 Effect of Random Distribution of CrashesB-15 Calculating Crash RatesB-16 Supplemental Analysis – More Detailed Record ReviewB-17 MnDOT’s Identification of At-Risk Trunk Highway
FacilitiesB-18 Systematic Analysis – State HighwaysB-19 Systematic Analysis – County HighwaysB-20 Systematic Analysis
– County Highway Crash Data for Greater MinnesotaB-21 – County Highway AssessmentB-22 – County Highway Crash Data for MetroB-23 – County Highway Assessment for MetroB-24 Implementation Guidance for State HighwaysB-25 Implementation Guidance for County HighwaysB-26 Safety Planning at the Local Level
Traffic Safety Fundamentals Handbook – 2015 3

Traffic Safety Tool Box C-2 Traffic Safety Tool Box – Then vs. NowC-4 Effectiveness of Safety StrategiesC-5 Safety Strategies
– HSIP Impact PyramidC-6 – CMF ClearinghouseC-8 – Highway Safety ManualC-10 – Highway Capacity ManualC-11 – Countermeasures that WorkC-12 – InfrastructureC-13 – BehaviorC-14 Roadside Safety InitiativesC-15 – Edge TreatmentsC-17 – Horizontal CurvesC-19 – Slope Design/Clear Recovery AreasC-20 – Upgrade Roadside HardwareC-21 Effectiveness of Roadside Safety InitiativesC-22 Addressing Head-On CollisionsC-24 Intersection Safety StrategiesC-25 Intersections
– Conflict Points – Traditional DesignC-26 – Conflict Points – New DesignC-28 – Enhanced Signs and MarkingsC-29 – Sight DistanceC-30 – Turn Lane DesignsC-31 – Roundabouts and Indirect TurnsC-32 – Traffic Signal OperationsC-33 – Red Light EnforcementC-35 Rural Intersections
– Safety Effects of Street LightingC-36 – Flashing BeaconsC-37 – Transverse Rumble Strips
Table of Contents
C-38 Pedestrian Safety StrategiesC-39 Pedestrian Safety
– Crash Rates vs. Crossing FeaturesC-40 – Curb Extensions and MediansC-41 Pedestrian/Bike StrategiesC-42 Complete StreetsC-43 Neighborhood Traffic Control MeasuresC-44 Speed ZoningC-46 Speed Reduction EffortsC-47 Speed Zoning – School ZonesC-48 Speed StrategiesC-49 Technology ApplicationsC-50 Impaired Driver StrategiesC-51 Inattention StrategiesC-52 Unbelted StrategiesC-53 Temporary Traffic Control ZonesC-55 Average Crash CostsC-56 Crash Reduction Benefit/ Cost (B/C) Ratio WorksheetC-57 Typical Benefit/Cost Ratios for Various Improvements
Lessons Learned D-2 Lessons Learned – Crash Characteristics D-3 Lessons Learned – Safety Improvement Process D-4 Lessons Learned – Traffic Safety Tool Box
Traffic Safety Fundamentals Handbook – 2015 4

Traffic Safety Fundamentals Handbook – 2015 A-1
Crash Characteristics
A-1
A-2 Nationwide Historical Crash Trends
A-3 Upper Midwest Area 2013 Crash Data
A-4 Fatality Rates of Surrounding States – 2013
A-5 Minnesota Urban vs. Rural Crash Comparison
A-6 AASHTO’s Strategic Highway Safety Plan
A-7 Role of Driver, Road, and Vehicle
A-8 Emergency Response Time Comparison
A-9 Fatal Crashes are Different
A-10 Minnesota’s Crash Mapping Analysis Tool (MnCMAT)
A-12 Crash Involvement by Age and Gender
A-13 Total Crashes by Road, Weather, and Lighting Conditions
A-14 Access vs. Mobility – The Functional Class Concept
A-15 Typical Functionally Classified Urban System
Section A
A-16 Roadway Segment Crash Rates as a Function of Facility Type and Access Density (MN)
A-18 Intersection Crash Rates (MN) by Control Type and Family
A-19 Intersection Crash Severity (MN) by Control Type and Family
A-20 Intersection Crash Distribution by Control Type and Rural vs. Urban
A-21 Intersection Crashes – Severity vs. Frequency
A-22 Roadway Segment Crash and Fatality Rates by Jurisdictional Class
A-23 Roadway Segment Crash Rates Facility Type by Rural vs. Urban
A-24 Roadway Segment Crash Distribution by Rural vs. Urban
A-25 Segment Crashes – Severity vs. Frequency
A-26 Pedestrian/Bicycle Crash Distribution by Intersection Control Type
A-27 Pedestrian/Bicycle Crash Distribution by Age
Traffic Safety Fundamentals Handbook – 2015

A-2
Highlights• Nationally,overthepast10yearstherehavebeenalmost55millioncrashes.
Overthatsametimeperiod,thenumberoffatalitieshasapproximatelydecreasedfrom42,000to32,000annually.
• Overthe10-yearperiod,exposure(VMT)hasincreasedonlyslightlyandhasbeenalmostflatduringthepast5years.
• Thelong-termtrendisfewercrashesandfatalitiesandarelativelyflatlevelofexposure.
1972 1979 1989 1999 2004 2007 2009 2012 2013CrashesTotal(thousand) N/A N/A 6,700 6,300 6,181 6,024 5,505 5,615 5,687
Fatal(thousand) N/A N/A 41 37 38 37 31 31 30
Injury(thousand) N/A N/A 2,153 2,026 1,862 1,711 1,517 1,634 1,591
PDO(thousand) N/A N/A 4,459 4,226 4,281 4,275 3,957 3,950 4,066
FatalitiesTotal 54,589* 51,093 45,582 41,717 42,836 41,259 33,883 33,561 32,719
TrafficRegisteredVehicles(million) 122 144 181 213 238 257 259 266 N/A
VMT(trillion) 1.3 1.5 2.1 2.7 3.0 3.0 3.0 3.0 3.0
RatesCrashes/100MVM N/A N/A 317 235 206 199 186 189 192
Fatalities/100MVM 4.3 3.3 2.2 1.5 1.4 1.4 1.1 1.1 1.1
Fatalitiespermillionregisteredvehicles 458 355 252 195 180 161 131 126 N/A
National Highway Traffic Safety Administration (NHTSA)*1972wastheworstyearforfatalitiesinU.S. VMT VehicleMilesTraveled100MVM 100MillionVehicleMiles
N/A NotAvailablePDO PropertyDamageOnly
Nationwide Historical Crash Trends
• Thedramaticdecreaseinthenumberoftrafficfatalities–24%overthe10-yearperiodbringstheannualnumberofdeaths(32,719)toalevelthatislowerthananytimeintheprevious60years.
• Thecombinationofdecreasingfatalitiesandaflatexposureresultsinafatalityrateof1.1,whichisa21%reductionandthelowestfatalityrateever.
Traffic Safety Fundamentals Handbook – 2015

Traffic Safety Fundamentals Handbook – 2015 A-3
Upper Midwest Area 2013 Crash Data
Highlights• Regionally,thereisawidevariationfromstateto
stateinboththetotalnumberofcrashes(16,000to120,000)andthenumberoffatalities(121to491).
• Minnesotahasaveragedapproximately75,000crashesandhasrecordedbetween357and455fatalitiesannuallysince2008.
• ThetrendinMinnesotaisfewercrashesandfatalities,inspiteofanincreaseinexposure(VMT).
• Minnesotahasbeenaleaderintheareaofhighwaysafety,withoneoftheloweststatewideaveragecrashandfatalityratescomparedtootherstatesinboththeregionandthenation.
• Thereisarelationshipbetweenthenumberoffatalcrashesandfatalities.Ingeneralacrosstheuppermidwestarea,theratiowas1.1fatalitiesperfatalcrash.
MinnesotaNorth Dakota
South Dakota Iowa Wisconsin
CrashesTotal 77,707 18,977 16,620 49,798 118,254
Fatal 357 133 121 290 491
Injury 21,960 3,901 3,921 13,091 28,747
PDO 55,390 14,943 12,578 36,417 89,016
FatalitiesTotal 387 148 135 317 527
TrafficRegisteredVehicles(million) 5.1 0.8 1.0 4.3 5.7
VMT(billion) 57.0 10.1 9.1 31.5 59.5
RatesCrashes/MVM 1.4 1.9 1.8 1.6 2.0
Fatalities/100MVM 0.7 1.5 1.5 1.0 0.9
Fatalities/MRV 76 184 134 75 93
CostsUSDollars(million)* $6,765 $2,063 $2,050 $4,853 $10,149
2013 Publications of MnDOT, NDDOT, SDDOT and IowaDOT
WisDOT data is preliminary
PDO PropertyDamageOnlyVMT VehicleMilesTraveledMRV MillionRegisteredVehicles100MVM 100MillionVehicleMiles
*EstimatedbasedondistributionofinjuriesandusingMnDOT2013crashcosts.
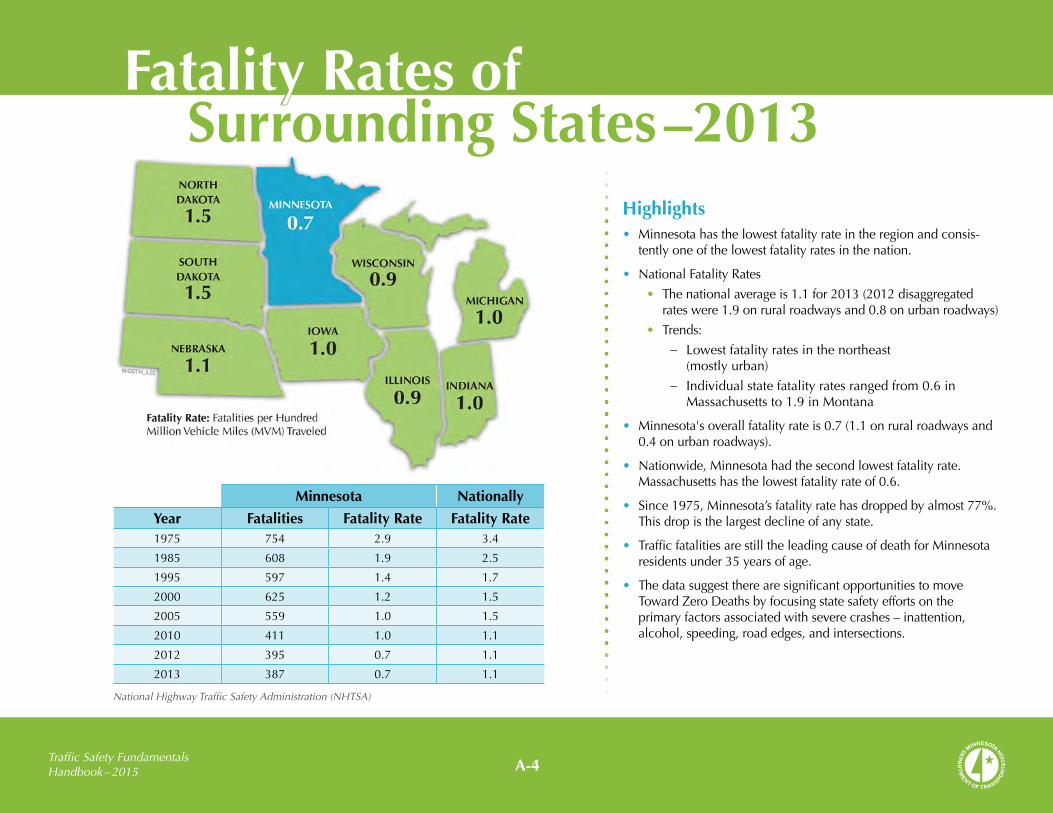
Traffic Safety Fundamentals Handbook – 2015 A-4
Fatality Rates of Surrounding States –2013
Highlights • Minnesotahasthelowestfatalityrateintheregionandconsis-
tentlyoneofthelowestfatalityratesinthenation.
• NationalFatalityRates
• Thenationalaverageis1.1for2013(2012disaggregatedrateswere1.9onruralroadwaysand0.8onurbanroadways)
• Trends:
− Lowestfatalityratesinthenortheast(mostlyurban)
− Individualstatefatalityratesrangedfrom0.6inMassachusettsto1.9inMontana
• Minnesota'soverallfatalityrateis0.7(1.1onruralroadwaysand0.4onurbanroadways).
• Nationwide,Minnesotahadthesecondlowestfatalityrate.Massachusettshasthelowestfatalityrateof0.6.
• Since1975,Minnesota’sfatalityratehasdroppedbyalmost77%.Thisdropisthelargestdeclineofanystate.
• TrafficfatalitiesarestilltheleadingcauseofdeathforMinnesotaresidentsunder35yearsofage.
• ThedatasuggesttherearesignificantopportunitiestomoveTowardZeroDeathsbyfocusingstatesafetyeffortsontheprimaryfactorsassociatedwithseverecrashes–inattention,alcohol,speeding,roadedges,andintersections.
National Highway Traffic Safety Administration (NHTSA)
Minnesota Nationally
Year Fatalities Fatality Rate Fatality Rate1975 754 2.9 3.4
1985 608 1.9 2.5
1995 597 1.4 1.7
2000 625 1.2 1.5
2005 559 1.0 1.5
2010 411 1.0 1.1
2012 395 0.7 1.1
2013 387 0.7 1.1

Traffic Safety Fundamentals Handbook – 2015 A-5
Minnesota Urban vs. Rural Crash Comparison
Highlights• Thetotalnumberofcrashesistypicallyafunctionof
exposure(VMT).
• InMinnesota,approximately40%oftheVMTisinurbanareasandapproximately60%ofthetotalnumberofstatewidecrashesareinurbanareas.
• However,77%ofthefatalcrashesinMinnesotaareinruralareas.
• Onaverage,ruralcrashestendtobemoreseverethanurbancrashes–thefatalityrateonruralroadsismorethan2.5timestherateinurbanareas.
• Thehigherseverityofruralcrashesappearstoberelatedtocrashtype,speed,andaccesstoemergencyservices.
MnDOT TIS, 2009-2013
“Rural”referstoanon-municipalareaandcitieswithapopulationlessthan5,000.
Total Crashes Fatal Crashes
Miles Vehicle Miles Traveled

Traffic Safety Fundamentals Handbook – 2015 A-6
AASHTO’s Strategic Highway Safety Plan
Highlights• Inthe1990s,AASHTOconcludedthathistoricalefforts
toaddresstrafficsafetywerenotsufficienttocauseacontinueddeclineintheannualnumberoftrafficfatalities.
• AASHTO’sStrategicHighwaySafetyPlanwasfirstpublishedin1997andthenupdatedin2004.
• Theplansuggestedsettinganewnational safety performance measure–thenumberoftrafficfatalitiesandsettingagoaltoreducethenation’shighwayfatalityratetonotmoretheonefatalityper100millionVMTby2008.
• The2004planintroducedinnovativeideas,including:
• SharedResponsibility–allroads,alllevelsofroadauthorities
• SafetyEmphasisAreas
• FocusonProvenStrategies
• ConsiderationofDriver,RoadwayandVehicleinter-actionswhenanalyzingcrashcausation
• DevelopmentofStateandLocalComprehensiveSafetyPlans
National Highway Traffic Safety Administration (NHTSA)
Persons Killed in Traffic Crashes
Note:2013fatalitiesfromFARSstatisticalprojections

Traffic Safety Fundamentals Handbook – 2015 A-7
Role of Driver, Road, and Vehicle
Highlights• Factorsthatcontributetoseriouscrashesinvolve
drivers,theroadway,andvehicles:
• Driverbehaviorsthatcontributetocrashesincludenotwearingasafetybelt,usingalcohol,beingdistracted,anddrivingaggressively.Driverbehaviorsareafactorin93%ofcrashes.
• Roadwayfeaturesincluderoadedges,curves,andintersections.Roadwayfeaturesareafactorin34%ofcrashes.
• Vehicleequipmentfailures,includingtireblowouts,towingtrailers,oversizeandloaddistribution.Vehiclefailuresareafactorin12%ofcrashes.
• StudieshaveshownthatsafetyprogramsthataddressmultiplefactorsofthefourSafetyE’s–Education,Enforcement,Engineering,andEmergencyServices–willbethemosteffective.
• ExamplesofeducationandenforcementprogramsincludetheDepartmentofPublicSafety’sProjectNightCap(alcohol)andCLICKITorTicket(safetybeltusage).The Role of Perceptual and Cognitive Filters in Observed Behavior, Kåre Rumar, 1985
Crash Causation Factors
Inthisexample,roadwaysarethesolecontributingfactorin3%ofcrashesandtheroadwayanddriverinteractionisthefactorin27%ofcrashes.

Traffic Safety Fundamentals Handbook – 2015 A-8
Highlights• ItappearsthatEmergencyResponsetimemay
beasignificantcontributingfactortothehigherfrequencyoffatalcrashesinruralareas.
• Nationally,responsetimesinruralareasaverage55minutesandarealmost45%longerthaninurbanareas.
• InMinnesota,theaverageruralresponsetimeis44minutes,whichisamongthelowestinthecountryandisthelowestresponsetimeinanystateintheupperMidwest.
• Thehigherfrequencyoffatalcrashesinruralareas,combinedwiththelongerEMSresponsetimes,hasledtodiscussionsinbothMinne-sotaandnationally,abouthowtobothreduceresponsetimesandtoimproveoutcomesfortheseriouslyinjured.InMinnesota,twotechniquesarewidelyusedtoaddressresponsetimes:theuseofAirAmbulanceinurbanareaswithlargenumbersofsignalsalongarterialcorridorsandEmergencyVehiclePreemptionoftrafficsignals.
• Minnesotahaswidelydistributedairambulancebaseswhichprovidecoveragetoallpartsofthestateandtransportcrashvictimsto15levelIandIItraumacenters.
Emergency Response Time ComparisonNational EMS Response Time
Levels 1 and 2 Trauma Centers
Timesareroundedtothenearestminute.
"Rural"referstoanon-municipalareaandcitieswithapopulationlessthan5,000.
National Highway Traffic Safety Administration (NHTSA)

Traffic Safety Fundamentals Handbook – 2015 A-9
Fatal Crashes Are Different
Highlights• Forthepast30years,theprimarysafetyperformancemeasure
wasthetotalnumberofcrashes.Thisprocessresultedinsafetyinvestmentsbeingfocusedonlocationswiththehighestnumberofcrashes,whichalsohavelargernumbersofthemostcommontypesofcrashes.
• ThemostcommontypesofcrashesinMinnesotaareRear-End(31%)andRightAngle(27%).Thesecrashesoccurmostfrequentlyatsignalizedintersectionsalongurban/suburbanarterials,whichbecamethefocusofsafetyinvestment.
• Oneproblemwithdirectingsafetyinvestmentstowardssignal-izedurban/suburbanintersectionsisthattherewaslittleeffectonreducingfatalities–onlyabout10%offatalcrashesoccurattheselocations.
• TheadventofMinnesota’sTowardZeroDeaths(TZD)programandthe2003adoptionofafatality-basedsafetyperformancemeasureledtoresearchthatfirstidentifiedthatfatalcrashesaredifferentfromotherlessseverecrashes.
• Fatalcrashesareoverrepresentedinruralareasandonthelocalroadsystem.ThemostcommontypesoffatalcrashesareRun-Off-Road(22%),RightAngle(12%),andHead-On(12%).
• ThesefactsaboutfatalcrasheshavechangedMnDOT’ssafetyinvestmentstrategies,whicharenowfocusedonroaddeparturesinruralareasandonlocalsystems.
Minnesota Crash Mapping Analysis Tool, 2009-2013

Traffic Safety Fundamentals Handbook – 2015 A-10
Minnesota’s Crash Mapping Analysis Tool (MnCMAT)
Highlights• Inordertoassistcitiesandcountiesingainingabetterunderstanding
ofcrashcharacteristicsontheirsystems,MnDOTStateAidforLocalTransportation,theMinnesotaLocalRoadResearchBoardandMinnesotaCountyEngineersAssociation(MCEA)havemadeanonlinetoolavailable-theMinnesotaCrashMappingAnalysisTool(MnCMAT).
• MnCMATisamap-basedcomputerapplicationthatprovides10yearsofcrashdataforallpublicroadsinMinnesota.
• Individualcrashesarelocatedspatiallybyreferencepointalongallroadwaysinthestate.
• Upto67piecesofinformationareprovidedforeachcrash,includingroute,location(referencepoint),date/day/time,severity,vehicleactions,crashcausation,weather,roadcharacteristics,anddrivercondition.
• Outputsthatcanbegeneratedfromtheapplicationforanalysispurposesincludemaps,crashdataexports,charts,andreports.
• Analystscanselectspecificintersectionsorroadwaysegmentsforstudy.Anoverviewoftheentirestate,MnDOTdistrict,county,city,ortribalgovernmentcanalsobegenerated.
• FormoreinformationaboutMnCMATandtoaccesstheonlineapplication,seewww.dot.state.mn.us/stateaid/crashmapping.html.
Minnesota Crash Mapping Analysis Tool

Traffic Safety Fundamentals Handbook – 2015 A-11
Highlights• Therecommendedanalyticalprocessforconductingasafety/
crashstudyistocompareactualconditionsataspecificlocation(intersectionorsegmentofhighway)comparedtoexpectedconditions(basedondocumentingtheaveragecharacteristicsforalargesystemofsimilarfacilities).
• MnCMATsupportsthisanalyticalprocessbyprovidingboththedataforindividuallocationsandforlargersystems–individualormultiplecounties.
• Thedatainthesegraphsindicatethatcrashesfortheselectedareapredominatelyoccurunderdaylightconditionsandamajorityarerear-endandrightanglecrashtypes.Additionally,thegraphsshowthedistributionofcrashesbyseverity.
Minnesota Crash Mapping Analysis Tool
Minnesota’s Crash Mapping Analysis Tool (MnCMAT)

Traffic Safety Fundamentals Handbook – 2015 A-12
Crash Involvement by Age and Gender
2013 Minnesota Motor Vehicle Crash Facts
MnDOT TIS, 2009-2013
Highlights• Thedistributionoffatalcrashesandtotalcrashesbyageindicatesthatyoung
peopleareoverrepresented.
• Minnesota’sStrategicHighwaySafetyPlanhasdocumentedthatyoungdrivers(under21yearsold)areinvolvedin24%offatalcrashes.Asaresult,addressingyoungdriversafetyissueshasbeenadoptedasoneofMinnesota’ssafetyfocusareas.
• Onestrategyhasbeenfoundtobeparticularlyeffectiveatreducingthecrashinvolvementrateofyoungdrivers–adoptionofacomprehensiveGraduatedDriversLicense(GDL)program.TheMinnesotaLegislaturetookastepinthisdirectionin2008byaddingprovisionsthatprohibitdrivingbetweenmidnightand5a.m.duringthefirst6monthsoflicensureandlimitingthenumberofunrelatedteenpassengersduringthefirst12monthsoflicensure.SinceadoptionofthismorecomprehensiveGDL,thenumberofseverecrashesinvolvingyoungdrivershasdroppedbyanaverageof13%peryear(comparedtoa4.5%peryeardropinallseverecrashes).
• Encouragingdrivereducationproviderstorequireaparenteducationcompo-nentisdemonstratingpromisingresultsinengagingparentstomoreeffectivelymonitorandcoachtheirteendriver.Educationprogramsincorporatingbothparentandteeneducationhelpparentsunderstandtheimportanceofteendrivingrestrictionstoreducedrivingriskasnovicedriversgainexperience.TheMinnesotaOfficeofTrafficSafety(OTS)developedthenationallyrecognizedPointofImpact:TeenDriverSafetyParentAwarenessProgramasacommunity-basedclassforparentsandtheirteendrivers.

Traffic Safety Fundamentals Handbook – 2015 A-13
Total Crashes by Road, Weather, and Lighting Conditions
Highlights• Someelementsoftrafficsafetyarecounterintuitive.Manypeople
thinkthatmostcrashesoccuratnightorduringbadweather.However,thedataclearlyindicatesthatcrashfrequencyisafunctionofexposure.Mostcrashesoccurduringthedayondryroadsingoodweatherconditions.
• Itshouldbenotedthatsomeresearch1haslookedatsafetyissuesduringnighttimehoursandduringsnowevents.Theresearchconcludesthattheconditionsrepresentasignificantsafetyriskbecauselowlevelofexposureresultsinveryhighcrashrates.
• Inaddition,thenewfocusonfatalcrashesreinforcestheconcernaboutnighttimehoursbeingmoreatrisk–approximately25%ofVMToccursduringhoursofdarkness,but31%offatalcrashes.
1MnDOTResearchReport1997-17,Table5.4,estimatedbasedonasamplefromMnDOT’sAutomaticRecordingStations.Minnesota Crash Mapping Analysis Tool, 2009-2013
All Crashes Fatal Crashes

Traffic Safety Fundamentals Handbook – 2015 A-14
Access vs. Mobility – The Functional Class Concept
Highlights• Oneofthekeyconceptsintransportationplanningdealswiththefunctionalclas-
sificationofaroadsystem.Thebasicpremiseisthattherearetwoprimaryroadwayfunctions–accessandmobility–andthatallroadwaysserveonefunctionortheother,orinsomecases,bothfunctions.
• ThefourcomponentsofmostfunctionallyclassifiedsystemsincludeLocalStreets,Collectors,MinorArterials,andPrincipalArterials.
• Theprimaryfunctionoflocalstreetsislandaccess,andtheprimaryfunctionofprincipalarterialsismovingtraffic.Collectorsandminorarterialsareusuallyrequiredtoservesomecombinationofaccessandmobilityfunctions.
• Keyreasonssupportingtheconceptofafunctionallyclassifiedsystemincludethefollowing:
• Itisgenerallyagreedthatsystemsthatincludetheappropriatebalanceofthefourtypesofroadwaysprovidethegreatestdegreeofsafetyandefficiency.
• Ittakesacombinationofvarioustypesofroadwaystomeettheneedsofthevariouslandusesfoundinmosturbanareasaroundthestate.
• Mostagenciescouldnotaffordasystemmadeupentirelyofprincipalarterials.Aregioncanbegridlockedifitisonlyservedbyasystemoflocalstreets.
• Roadwaysthatonlyserveonefunctionaregenerallysaferandtendtooperatemoreefficiently.Forexample,freewaysonlyservethemobilityfunctionandasagrouphavethelowestcrashratesandthehighestlevelofoperationalefficiency.
• Functionalclassificationcanbeusedtohelpprioritizeroadwayimprovements.
• Thedesignfeaturesandlevelofaccessforspecificroadwaysshouldbematchedtotheintendedfunctionofindividualroadways.
• Theappropriatebalancepointbetweenthecompetingfunctionsmustbedeterminedforeachroadwaybasedonananalysisofspecificoperational,safety,design,andlandfeatures.
FHWA Publication No. FHWA-RD-91-044 (Nov 1992)

Traffic Safety Fundamentals Handbook – 2015 A-15
Typical Functionally Classified Urban System
Highlights• Local Streets
• Lowvolumes(lessthan2KADT)
• Lowspeeds(30MPH)
• Shorttrips(lessthanonemile)
• Twolanes
• Frequentdrivewaysandintersections
• Unlimitedaccess
• 75%systemmileage/15%VMT
• Jurisdiction–CitiesandTownships
• Constructioncost:$250Kto$500K/mile
• Collectors
• Lowervolumes(1Kto8KADT)
• Lowerspeeds(30or35MPH)
• Shortertrips(1to2miles)
• Twoorthreelanes
• Frequentdriveways
• Intersectionsto1/8thmilespacing
• 10%systemmileage/10%VMT
• Jurisdiction–CitiesandCounties
• Constructioncost:$1Mto$2M/mile
ADT AverageDailyTrafficVMT VehicleMilesTraveledMPH MilesPerHour2K 2,0001M 1,000,000
FHWA Publication No. FHWA-RD-91-044 (Nov 1992)
• Minor Arterials
• Moderatevolumes(5Kto40KADT)
• Moderatespeeds(35to45MPH)
• Mediumlengthtrips(2to6miles)
• Three,four,orfivelanes
• Onlymajordriveways
• Intersectionsat1/4milespacing
• 10%systemmileage/25%VMT
• Jurisdiction–CountiesandMnDOT
• Constructioncost:$2.5Mto$7M/mile
• Principal Arterials
• Highvolumes(greaterthan20KADT)
• Highspeeds(greaterthan45MPH)
• Longertrips(morethan6miles)
• 4ormorelanes–accesscontrol
• Intersectionsat1/2milespacingandInterchanges1+milespacing
• 5%systemmileage/50%VMT
• Jurisdiction–MnDOT
• Constructioncost:$10Mto$50M/mile

Traffic Safety Fundamentals Handbook – 2015 A-16
Roadway Segment Crash Rates as a Function of Facility Type and Access Density (MN)
Highlights• Previoussafetyresearchgoingback30yearsindicatedapotentialrelationship
betweenaccessdensityandcrashrates.However,thisresearchdidnotaccountforotherfactorsthatareknowntoaffectcrashrates(ruralvs.urban,designtypeoffacility,etc.)andnoneofthedatawasfromMinnesota.
• Asaresult,in1998,MnDOTundertookacomprehensivereviewoftherelation-shipbetweenaccessandsafetyonMinnesota’sTrunkHighwaySystem.ThiseffortendedwiththepublicationofResearchReportNo.1998-27,“StatisticalRelation-shipBetweenVehicularCrashesandHighwayAccess.”
• Thesignificantresultsinclude:
• Documentingforthefirsttimetheactualaccessdensity(anaverageof8accesspermileinruralareasand28accesspermileinurbanareasalongStatehighways).
• Observingarelationshipbetweenaccessdensityandcrashratesin10of11categories.
• Identifyingastatisticallysignificanttendency(in5outof6categorieswithsufficientsamplesize)forsegmentswithhigheraccessdensitiestohavehighercrashratesinbothurbanandruralareas.
“Rural”referstoanon-municipalareaandcitieswithapopulationlessthan5,000.
MnDOT Research Report 1998-27 “Statistical Relationship between Vehicular Crashes and Highway Access”

Traffic Safety Fundamentals Handbook – 2015 A-17
Roadway Segment Crash Rates as a Function of Facility Type and Access Density (MN)
Highlights• MnDOThascompletedtheprojectthatpreparedasafetyplanforeverycountyin
thestate.Oneofthefocusareasoftheplansinvolvedaddressingseverecrashesonruralcountyroadways.TheanalysisofMinnesota’scrashrecordsandtheresultsofasystemwideriskassessmentfoundacorrelationbetweenthedensityofaccessandcrashdensityalong27,000milesofruralcountyroadways.Thehigherthedensityofaccess,thehighertheaveragecrashdensity.
• Thesignificantresultsinclude:
• Documentingthattheaverageaccessdensityforcountyroadways(approximately8permile)issimilartorural,2-lanestatehighways.
• Observingarelationshipbetweenaccessdensityandcrashdensityinsegmentswithaboveaverageaccessdensitycrashesareover-representedandtheaveragecrashdensityincreasesasaccessdensityincreases.
“Rural”referstoanon-municipalareaandcitieswithapopulationlessthan5,000.
Minnesota County Road Safety Plans, Data 2007-2011

Traffic Safety Fundamentals Handbook – 2015 A-18
Intersection Crash Rates (MN) by Control Type and Family
Highlights• Crashfrequencyatintersectionstendstobeafunctionofexposure–thevolume
oftraffictravelingthroughtheintersection.Asaresult,themostcommonlyusedintersectioncrashstatisticisthecrashrate–thenumberofcrashespermillionenteringvehicles(MEV).
• Crashfrequencyalsotendstobearesultofthetypeoftrafficcontrolattheintersection.Contrarytothepopularlyheldopinionthatincreasingtheamountofintersectioncontrolresultsinincreasedsafety,theaveragecrashrateatsignalizedintersections(0.5perMEV)ismorethan67%higherthanaveragecrashrateatstopsign-controlledintersections(0.3perMEV).Inaddition,theaverageseverityrateandtheaveragecrashdensityarealsogreaterforsignalizedcomparedtostopsigncontrolledintersections.
• Awealthofresearchalsosupportstheconclusionthattrafficsignalsarerarelysafetydevices.Mostbeforevs.afterstudiesoftrafficsignalinstallationsdocumentincreasesinthenumberandrateofcrashes,achangeinthedistributionofthetypeofcrashes,andamodestdecreaseinthefractionoffatalcrashes.
• Asaresultofcrashcharacteristicsassociatedwithsignalizedintersections,installingtrafficsignalsisNOToneofMinnesota’shighprioritysafetystrategies.
• Therearealsodatatosupportaconclusionthatsometypeofleftturnphasing(eitherexclusiveorexclusive/permitted),addressingclearanceintervalsandprovidingcoordinationhelpstominimizethenumberofcrashesatsignalizedintersections.
• ThecrashdatadocumentingcrashratesforintersectionsbytypeofcontrolwaspreviouslylimitedtotheStatehighwaysystem.However,completionoftheCountryRoadSafetyPlansincludedanalysisofalmost13,000intersectionsalongthecountysystem.TheresultsindicatethatintersectionsalongcountyroadshavecrashratesvirtuallyidenticaltosimilarintersectionsalongStatehighways.
2013 MnDOT Crash Data Toolkit, 2011-2013, and Minnesota County Road Safety Plans, Data 2007-2011

Traffic Safety Fundamentals Handbook – 2015 A-19
Intersection Crash Severity (MN) by Control Type and Family
Highlights• Thedistributionofintersectioncrashseverityappears
tobearesultofthetype/degreeofintersectioncontrolmethods.Basedonareviewofover29,000crashesatmorethan8,100intersections,lowspeed/lowvolumesignalizedintersectionswerefoundtohavethehighestpercentageofpropertydamageonlycrashes(73%)andthelowestpercentageofinjurycrashes(27%).Inter-sectionswithAll-waySTOPcontrolandlowspeed/lowvolumesignalizedintersectionshadthelowestpercentageoffatalcrashes(0.00%).
• Thedataalsosuggestthat(onaverage)theinstallationofatrafficsignaldoesnotresultinareductionincrashseverity.Theseverityrateatsignalizedintersections,rangingfrom0.5to1.0,isabout25to50%higherthanatintersectionswithThru/STOPcontrol(0.4).
• Thedatasupportsthetheorythatincreasingtheamountofintersectioncontrolsdoesnotresultinahigherlevelofintersectionsafety.
2013 MnDOT Crash Data Toolkit, 2011-2013
Note:OnlyforTrunkHighwayIntersections

Traffic Safety Fundamentals Handbook – 2015 A-20
Intersection Crash Distributionby Control Type and Rural vs. Urban
Highlights• Thecrashtypedistributionthatcanbeexpectedatanintersectionispri-
marilyafunctionofthetypeofintersectioncontrol.
• Atstop-controlledintersections,inbothruralandurbanareas,themostcommontypesofcrashesarerightangleandrear-endcollisions.
• Atsignalizedintersections,themostcommontypesofcrashesarerear-end,rightangle,andleftturncollisions.
Key Points• Trafficsignalsappeartoreducebutnoteliminaterightanglecrashes.
• Rightturnspresentaverylowriskofacrash(1%to3%ofintersectioncrashes).
• Leftturnspresentaverylowriskofacrash(5%to11%ofintersectioncrashes).
• Crossingconflictspresentaveryhighriskofacrash(20%to50%ofintersectioncrashes).
• Rear-endconflictspresentthehighestriskofacrash(13%to52%ofintersectioncrashes).
• However,whenseverityisconsidered,anewpictureemerges–seepageA-21.
Minnesota Crash Mapping Analysis Tool, 2009-2013
Traffic Safety Fundamentals Handbook – 2015 A-21
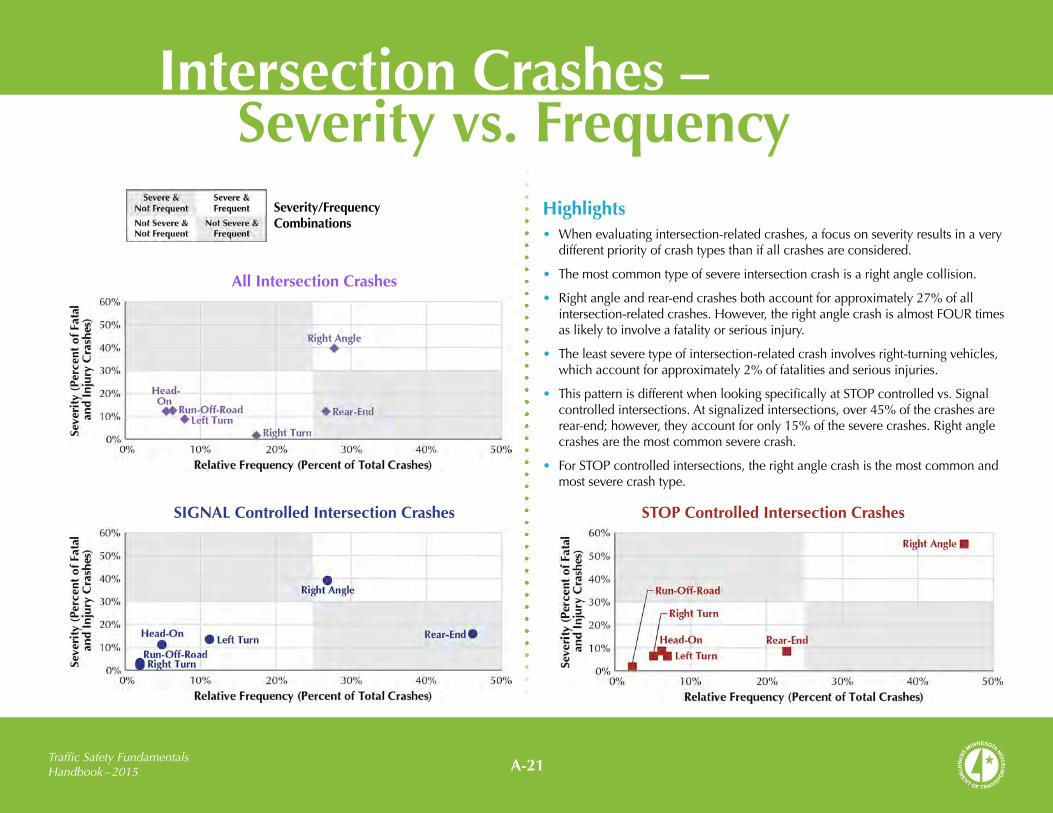
Intersection Crashes – Severity vs. Frequency
Highlights• Whenevaluatingintersection-relatedcrashes,afocusonseverityresultsinavery
differentpriorityofcrashtypesthanifallcrashesareconsidered.
• Themostcommontypeofsevereintersectioncrashisarightanglecollision.
• Rightangleandrear-endcrashesbothaccountforapproximately27%ofallintersection-relatedcrashes.However,therightanglecrashisalmostFOUR timesaslikelytoinvolveafatalityorseriousinjury.
• Theleastseveretypeofintersection-relatedcrashinvolvesright-turningvehicles,whichaccountforapproximately2%offatalitiesandseriousinjuries.
• ThispatternisdifferentwhenlookingspecificallyatSTOPcontrolledvs.Signalcontrolledintersections.Atsignalizedintersections,over45%ofthecrashesarerear-end;however,theyaccountforonly15%oftheseverecrashes.Rightanglecrashesarethemostcommonseverecrash.
• ForSTOPcontrolledintersections,therightanglecrashisthemostcommonandmostseverecrashtype.
STOP Controlled Intersection Crashes
All Intersection Crashes
SIGNAL Controlled Intersection Crashes
Severity/Frequency Combinations

Traffic Safety Fundamentals Handbook – 2015 A-22
Roadway Segment Crash and Fatality Rates by Jurisdictional Class
• Countyandtownshiproadshadmoderatelyhighcrashratesandthehighestfatalityrates.
• Thisdistributionofcrashesgenerallysupportstheideathatgreaternumbersofcrashesoccurinurbanareasandgreaternumbersoffatalcrashesoccurinruralareas.
• Crashratesandfatalityratesbyroadwayjurisdiction(andforthestateasawhole)areinteresting;however,thereisagreatdealofevidencetosuggestthatcrashratesaremoreafunctionofroadwaydesignthanwhoownstheroad.
Roadway Jurisdiction Classification Miles Crashes Fatalities Crash
Rate* Fatality Rate**
Interstate 916 12,309 25 0.99 0.20
Trunk Highway 10,930 21,221 168 1.04 0.82
CSAH/County Roads 44,958 20,705 151 1.49 1.09
City Streets 22,373 21,975 24 2.42 0.26
Township & Other 63,799 1,497 19 1.21 1.53
State Total 142,976 77,707 387 1.36 0.68
**permillionvehiclemiles(MVM)
**per100millionvehiclemiles(100MVM)
Highlights• Asaclass,interstateshadlowercrashandfatalityratesthanconventionalroad-
ways.Thisfactislikelyduetothreefactors:
• Interstatesonlyserveamobilityfunction
• Interstatestendtohaveaconsistentlyhighstandardofdesign
• Interstateshaveverystrictcontrolofaccess
• Oftheconventionalroadways,trunkhighwayshadthelowestcrashrateandthesecond-lowestfatalityrate.
• Citystreetshadthehighestcrashrateandalowfatalityrate.
2013 Minnesota Roadway & Crash Facts

Traffic Safety Fundamentals Handbook – 2015 A-23
Roadway Segment Crash Rates Facility Type by Rural vs. Urban
Highlights• Averagecrashratesvarybylocation(ruralvs.urban)andtypeoffacility.
• Freewayshavethelowestcrashratesandarethesafestroadwaysysteminthestate.
• RuralroadwaysasidentifiedintheToolkithavelowercrashratesthansimilarurbanroads.
• Urbanconventionalroadways(notfreewaysorexpressways)–oftenminorarterialswhichservebothamobilityandlandaccessfunction–havethehighestcrashrates.
• Four–laneundividedroadwayshavethehighestcrashrate;thesefacilitiesareusuallyfoundincommercialareaswithhighturningvolumesandwithlittleornomanagementofaccess.Overtheyears,theaveragehasbeenlowered(fromarateof8.0in1990)duetoMnDOT’seffortstoconverttheworstsegmentstoeitherthree-lane,four-lanedivided,orfive-laneroads.Theadditionofleftturnlanestosegmentsofurbanconventionalroadwaystypicallyreducescrashesby25%to40%.
• Thedistributionofcrashratesbyfacilitytypepointstothefollowingrelationshipbetweenaccessdensityandsafety:highwayswithlowlevelsofaccess(freeways)havelowcrashrates,andhighwayswithhigherlevelsofaccess(conventionalroads)havecomparativelyhighercrashrates.
Minnesota County Road Safety Plans, Data 2007-2011 2013 MnDOT Crash Data Toolkit, 2009-2013

Traffic Safety Fundamentals Handbook – 2015 A-24
Roadway Segment Crash Distribution by Rural vs. Urban
Highlights• Thereisasignificantdifferenceinthetypesofcrashesthatoccuronurban
versusruralroads.
• Urbancrashesarepredominatelytwo-vehicle(about85%),andruralcrashesarepredominatelysingle-vehicle(about55%).
• Themostcommontypesofurbancrashesinclude:
• Rear-end–33%ofallcrashesand7%offatalcrashes
• Rightangle–20%ofallcrashesand20%offatalcrashes
• Themostcommontypesofruralcrashesinclude:
• Run-off-road–44%ofallcrashesand37%offatalcrashes
• Rear-end–12%ofallcrashesand5%offatalcrashes
• Rightangle–9%ofallcrashesand20%offatalcrashes
• Sometypesofcrashesaremoreseverethanothers.Only8%ofallruralcrashesinvolvehead-oncollisions,buttheyaccountfor20%ofthefatalcrashes.
• Deerhitsareunderreportedbecausetheyrarelyresultininjurytovehicleoccupants.Aconservativeestimateisthatasmanyas24%ofruralcrashesinvolvehittingadeer.StateFarmInsuranceestimatesindicatethattherewereapproximately40,000deerhitsinMinnesotain2012.Formoreinfor-mationaboutcollisionsinvolvingadeer,seewww.deercrash.org.
• ThedistributionofcrashesreinforcesthesafetyprioritiesestablishedforbothStateandlocalsystemroadways–rightangleandrear-endcrashesinurbanareasandrun-off-road,rightangleandhead-oninruralareas.
Minnesota Crash Mapping Analysis Tool, 2009-2013
Urban
Rural

Traffic Safety Fundamentals Handbook – 2015 A-25
Segment Crashes – Severity vs. Frequency
Highlights• Themostcommontypeofsegment-relatedcrashisarear-endcollision(42%).
However,rear-endcollisionsaccountforonlyaround12%ofseriouscrashes.
• Run-off-roadcrashesarethemostcommontypeofseverecrash,accountingfor24%ofthecrashesandover40%ofthefatalandseriousinjurycrashes.
• Head-oncrashesarethesecond-mostseveretypeofcrash,accountingfor8%ofallsegment-relatedcrashesbut20%ofseriouscrashes.
• Segment-relatedcrashesinvolvingrightandleftturningvehiclesarebothinfre-quent(fewerthan5%ofcrashes)andrarelysevere(fewerthan5%ofseriouscrashes).
Segment Crashes – 2-Lane Roadway
All Segment Crashes
Segment Crashes – Multi-Lane Roadway
Severity/Frequency Combinations

Traffic Safety Fundamentals Handbook – 2015 A-26
Pedestrian/Bicycle Crash Distributionby Intersection Control Type
Highlights• Minnesotaaverages184fatalandseriousinjurycrashesinvolving
pedestriansandbicyclesperyear(approximately14%ofallseverecrashes).
• 66%ofallseriouspedestrian/bicyclecrashesoccurinthesevencountyMinneapolis/St.Paulmetropolitanarea.
• 61%oftheseriouspedestrian/bicyclecrashesintheMetropolitanAreaoccuratanintersectionand81%areonthelocal(cityandcounty)roadsystem.
• 58%oftheseriouspedestrian/bicyclecrashesoccuratintersec-tionscontrolledbytrafficsignals,incontrast30%ofintersectionsaretrafficsignalsontheStatesystemand45%onthecountysystem.
• Basedonthedistributionofcrashesbyintersectioncontroltype,itcanbeconcludedthatseriouscrashesinvolvingpedestrians/bicyclesareoverrepresentedattrafficsignals.
• ThedatasupportstheconclusionthattrafficsignalsaloneareNOTsafetydevicesforpedestriansorbicyclists.(SeepagesC-38-C-41foradiscussionofpedestrianandbicyclesafetystrategies.)
• 61%ofseriouspedestrian/bicyclecrashesoccuronstreetswitha30mphspeedlimitand82%ofthecrashesoccuronstreetswithaspeedlimitof40mphorless.
• Thisdatasupportstheconclusionthatlowerspeedlimitsalonearenotsufficienttoeliminatetheriskoftrafficcrashesforpedestriansandbicyclists.
MnDOT TIS, 2009-2013
Crash Location
Intersection Type
Roadway Speed
Roadway Speed at Signalized Crashes

A-27Traffic Safety Fundamentals Handbook – 2015
Pedestrian/Bicycle Crash Distribution by Age
Highlights• Pedestriansbetweentheagesof15and25andthose
olderthan65areinvolvedin38%ofseriousinjurycrashes.
• Bicyclistsbetweentheagesof10and25areinvolvedin42%ofseriousinjurycrashes.
• Beyondtheoverallcrashnumbers,theinvolvementofeachoftheseagegroupswasfoundtobeoverrepresentedwhennormalizedforpopulation.
MnDOT TIS, 2009-2013
Age Distribution of Pedestrians and Bicycles Involved in Severe (K+A) Crashes Between 2009 and 2013

B-1
Safety Improvement ProcessSection B
B-2 Minnesota’s Strategic Highway Safety Plan (SHSP)B-3 Minnesota’s Safety Focus AreasB-4 Safety Focus Areas – Greater Minnesota vs. MetroB-5 Behavior Focus Area – SpeedingB-6 – Impaired DrivingB-7 – Inattentive DrivingB-8 – Seat BeltsB-9 Infrastructure Focus Area – IntersectionsB-10 – Lane DepartureB-11 Comprehensive Safety Improvement ProcessB-12 Why Have a Sustained High Crash Location Identification Process?B-13 Alternative Methods for Identifying Potentially Hazardous Locations
B-14 Effect of Random Distribution of CrashesB-15 Calculating Crash RatesB-16 Supplemental Analysis – More Detailed Record ReviewB-17 MnDOT’s Identification of At-Risk Trunk Highway FacilitiesB-18 Systemic Analysis – State HighwaysB-19 Systemic Analysis – County HighwaysB-20 Systemic Analysis – County Highway Crash Data for Greater MinnesotaB-21 – County Highway AssessmentB-22 – County Highway Crash Data for MetroB-23 – County Highway Assessment for MetroB-24 Implementation Guidance for State HighwaysB-25 Implementation Guidance for County HighwaysB-26 Safety Planning at the Local Level
Traffic Safety Fundamentals Handbook – 2015

B-2
Minnesota’s Strategic Highway Safety Plan (SHSP)
Highlights• MinnesotaStrategicHighwaySafetyPlan(SHSP)isadata-drivendocumentthat
providesinsightanddirectiononhowtoreducetrafficrelatedcrashes.
• TheSHSPisintendedtoguidesafetyeffortsduringthenext5years.
• Itdocumentsanew,short-termsafetygoal:300orfewerfatalitiesand850orfewerseriousinjuriesby2020.
• Itadoptsalong-termgoalofZEROfatalitiesandidentifieschangingthesafetycultureasafundamentalsafetyfocusarea.
• TheSHSPnotesthattrafficfatalitieshavedecreasedby40%duringthepast10yearsandattributesmuchofthatsuccesstotheformationofMinnesota’sTowardZeroDeathsprogram.
• TheSHSPadoptsseverecrashes–thoseinvolvingfatalitiesandincapacitatinginjuriesasthesafetyperformancemeasureinMinnesota.
• MnDOTSHSPwebsite:www.dot.state.mn.us/trafficeng/safety/shsp/index.html
Traffic Safety Fundamentals Handbook – 2015
B-3Traffic Safety Fundamentals Handbook – 2015
Minnesota’s Safety Focus Areas
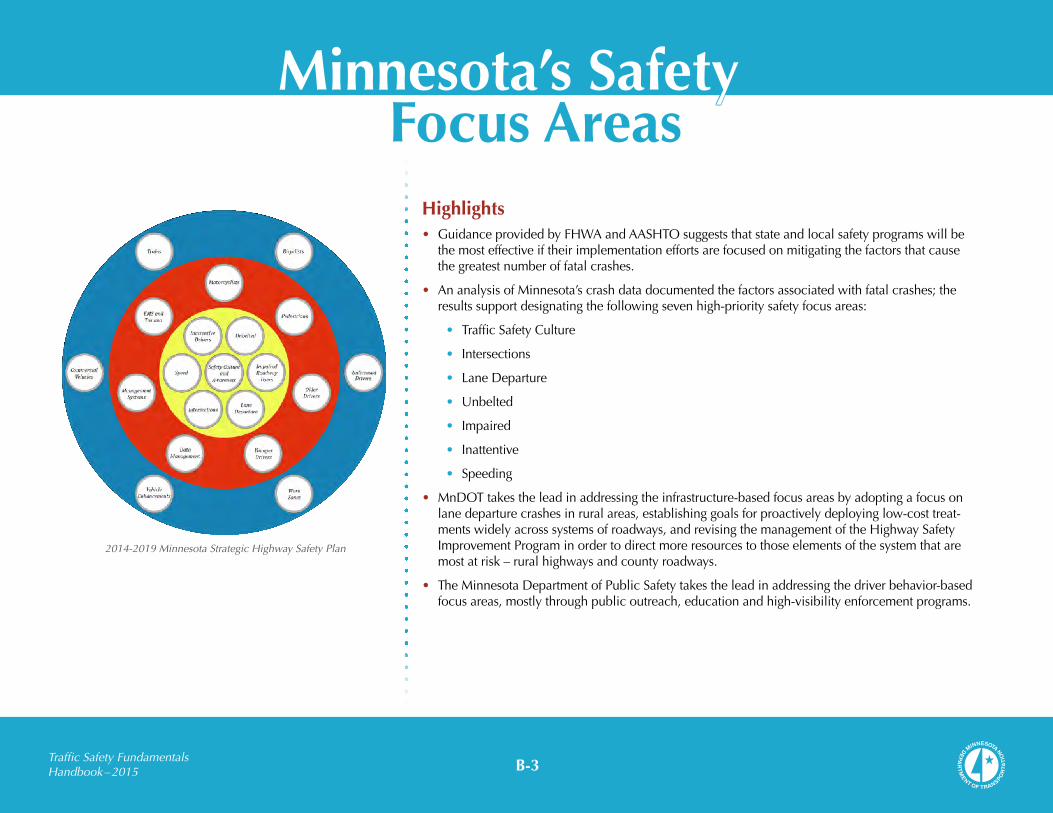
Highlights• GuidanceprovidedbyFHWAandAASHTOsuggeststhatstateandlocalsafetyprogramswillbe
themosteffectiveiftheirimplementationeffortsarefocusedonmitigatingthefactorsthatcausethegreatestnumberoffatalcrashes.
• AnanalysisofMinnesota’scrashdatadocumentedthefactorsassociatedwithfatalcrashes;theresultssupportdesignatingthefollowingsevenhigh-prioritysafetyfocusareas:
• TrafficSafetyCulture
• Intersections
• LaneDeparture
• Unbelted
• Impaired
• Inattentive
• Speeding
• MnDOTtakestheleadinaddressingtheinfrastructure-basedfocusareasbyadoptingafocusonlanedeparturecrashesinruralareas,establishinggoalsforproactivelydeployinglow-costtreat-mentswidelyacrosssystemsofroadways,andrevisingthemanagementoftheHighwaySafetyImprovementPrograminordertodirectmoreresourcestothoseelementsofthesystemthataremostatrisk–ruralhighwaysandcountyroadways.
• TheMinnesotaDepartmentofPublicSafetytakestheleadinaddressingthedriverbehavior-basedfocusareas,mostlythroughpublicoutreach,educationandhigh-visibilityenforcementprograms.
2014-2019 Minnesota Strategic Highway Safety Plan

B-4Traffic Safety Fundamentals Handbook – 2015
Safety Focus Areas – Greater Minnesota vs. Metro
Highlights• Approximately60%oftheseriouscrashesinMinnesotaareinthe79
countiesoutsideofthe8-countyMinneapolis-St.PaulMetropolitanArea.
• Approximately62%ofseriouscrashesoccuronthelocalroadwaysystem,whichalsoresultsinhigherfatalityratesonthelocalsystem.
2014-2019 Minnesota Strategic Highway Safety Plan, Data 2008-2012
Driver Behavior-Based Focus Areas Infrastructure-Based Focus AreasTotal Severe
Crashes Unbelted Impaired Inattentive Speeding Lane Departure Intersection
Statewide7,036 2,463 1,850 1,319 1,309 3,199 2,945
Greater Minnesota Districts (2008-2012 Severe Crashes)StateTrunkHighway 1,813 666 414 430 326 919 686
CountyRoads 1,699 743 580 309 342 1,017 545
City 435 141 99 70 87 146 224
Township 278 150 116 24 73 175 62
Other 17 3 9 1 4 9 2
Greater Minnesota Total 4,242 1,703 1,218 834 832 2,266 1,519
Metro District (2008-2012 Severe Crashes)StateTrunkHighway 831 242 216 179 172 295 360
CountyRoads 1,148 285 223 200 151 386 668
City 786 222 182 106 148 237 391
Township 22 11 10 0 5 11 6
Other 7 0 1 0 1 4 1
Metro District Total 2,794 760 632 485 477 933 1,426
• Inruralareas,theprimaryfactorsassociatedwithseriouscrashesarenotusingsafetybelts,impaireddriving,androaddeparture.
• Inurbanareas,theprimaryfactorsassociatedwithseriouscrashesareintersections,notusingsafetybelts,impaireddriving,andinattentive/distracteddriving.

B-5Traffic Safety Fundamentals Handbook – 2015
Behavioral Focus Area – Speeding
Highlights• OnMinnesotaroadways,therewere1,309severespeeding-relatedcrashes
between2008and2012.Thisisanaverageof262severecrashesperyear,accountingfor19%ofallseverecrashesduringthe5-yearperiod.
• Severecrashesinvolvingspeedarenotablyrepresentedwithinbothstateandlocalroadwaysystems,aswellasinbothrural(55%)andurban(41%)areas,asdefinedbyinvestigatingofficers.
• 70%ofseverespeeding-relatedcrashesinruralareasoccuronruralhigh-speedtwo-laneroads.
• 58%ofseverespeeding-relatedcrashesonruralcountyroadsoccuralongcurves,comparedto39%onallroadwaysstatewide.
• Severecrashesinvolvingspeedoccuramongdifferingcrashtypes:
• 62%arelanedeparturecrashtypes.
• 70%ofseverespeed-relatedcrashesoccurondrypavement.
• Driversaged35andyoungeraccountfor63%ofspeeding-relatedseverecrashes;77%ofdriversinseverespeeding-relatedcrashesaremale.
• Thenumberofspeed-relatedcrashesfellsteadilybetween2004and2010andthenflattenedout.
• Duringthe2004to2010timeframe,theStatesponsoredtwoenhancedenforce-mentcampaigns(HEAT–HighEnforcementofAggressiveTraffic)focusedonticketingspeedingdriversandreducingthenumberofseverespeeding-relatedcrashes.
• Nearlyequalnumbersofspeeding-relatedcrashesoccuronthestateandcountyroadwaysystemsandthesesystemsexperiencedthegreatestreductionovertime.
2014-2019 Minnesota Strategic Highway Safety Plan
B-6Traffic Safety Fundamentals Handbook – 2015
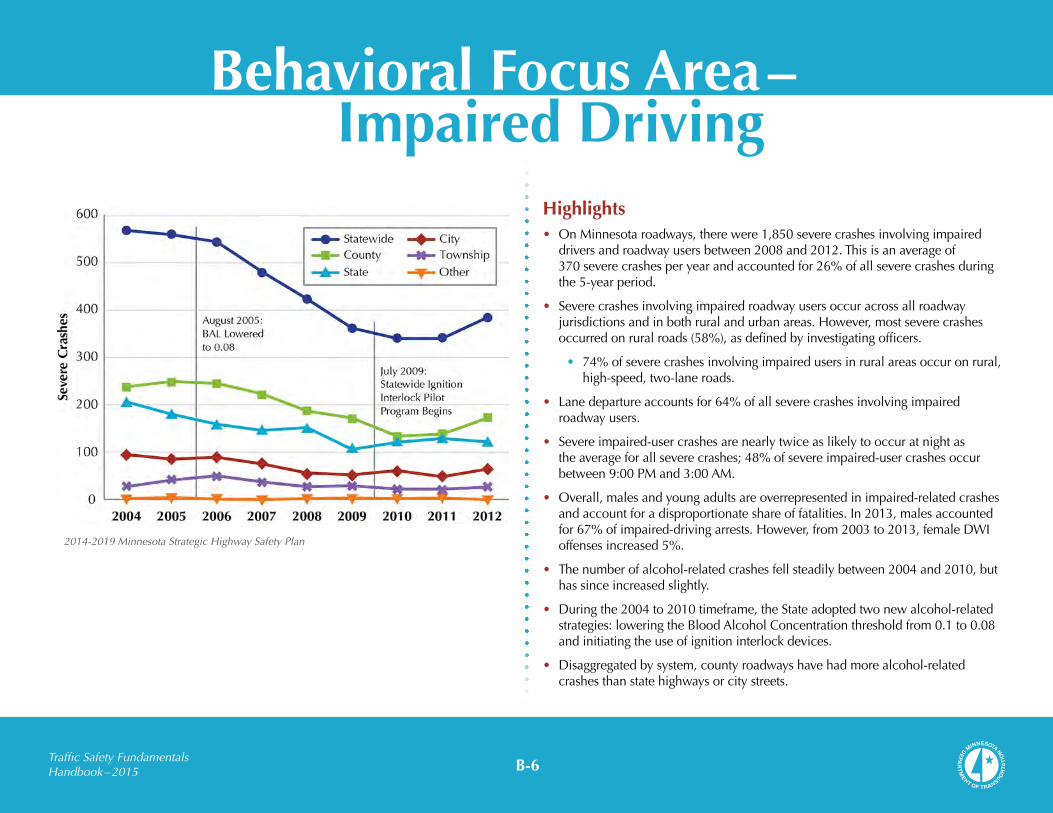
Highlights• OnMinnesotaroadways,therewere1,850severecrashesinvolvingimpaired
driversandroadwayusersbetween2008and2012.Thisisanaverageof370severecrashesperyearandaccountedfor26%ofallseverecrashesduringthe5-yearperiod.
• Severecrashesinvolvingimpairedroadwayusersoccuracrossallroadwayjurisdictionsandinbothruralandurbanareas.However,mostseverecrashesoccurredonruralroads(58%),asdefinedbyinvestigatingofficers.
• 74%ofseverecrashesinvolvingimpairedusersinruralareasoccuronrural,high-speed,two-laneroads.
• Lanedepartureaccountsfor64%ofallseverecrashesinvolvingimpairedroadwayusers.
• Severeimpaired-usercrashesarenearlytwiceaslikelytooccuratnightastheaverageforallseverecrashes;48%ofsevereimpaired-usercrashesoccurbetween9:00PMand3:00AM.
• Overall,malesandyoungadultsareoverrepresentedinimpaired-relatedcrashesandaccountforadisproportionateshareoffatalities.In2013,malesaccountedfor67%ofimpaired-drivingarrests.However,from2003to2013,femaleDWIoffensesincreased5%.
• Thenumberofalcohol-relatedcrashesfellsteadilybetween2004and2010,buthassinceincreasedslightly.
• Duringthe2004to2010timeframe,theStateadoptedtwonewalcohol-relatedstrategies:loweringtheBloodAlcoholConcentrationthresholdfrom0.1to0.08andinitiatingtheuseofignitioninterlockdevices.
• Disaggregatedbysystem,countyroadwayshavehadmorealcohol-relatedcrashesthanstatehighwaysorcitystreets.
Behavioral Focus Area – Impaired Driving
2014-2019 Minnesota Strategic Highway Safety Plan

B-7Traffic Safety Fundamentals Handbook – 2015
Highlights• Whileanythingthattakesyoureyesofftheroad,handsoffthewheel,ormind
offdrivingisahazard,texting/readingemail/accessingtheinternetisparticularlydangerous,bycombiningallthreetypesofdistraction–visual,manual,andcognitive.
• OnMinnesotaroadways,therewere1,319severecrashesinvolvinginattentivedriversbetween2008and2012.Thisisanaverageof264severecrashesperyearandaccountedfor19%ofallseverecrashesduringthe5-yearperiod.
• Themajorityofsevereinattentivedrivingcrashesdonotoccurunderadversedrivingconditions:
• 92%ofthesecrashesoccurduringcalmweatherconditions(clearorcloudy).
• 70%ofthesecrashesoccurduringdaylight.
• 84%ofthesecrashesoccurondrypavement.
• Severecrashesinvolvinginattentivedriversoccuramongdifferingcrashtypes,with46%intersection-relatedand39%lanedeparture-related.
• Intersectioncrashtypesoccurpredominantlyonstraightsegments(92%),butthepresenceofcurvesnearlydoublestheoccurrenceoflanedeparturecrashtypes(36%).
• Severecrashesinvolvinginattentivedriversarenotablyrepresentedinbothrural(54%)andurban(44%)areas,asdefinedbyinvestigatingofficers.
• 71%ofsevereinattentivedrivingcrashesinruralareasoccuronruraltwo-laneroadswithahighspeedlimit.
Behavioral Focus Area – Inattentive Driving
2014-2019 Minnesota Strategic Highway Safety Plan

B-8Traffic Safety Fundamentals Handbook – 2015
Highlights• OnMinnesotaroadways,therewere2,463severecrashesinvolvinganunbelted
orimproperlybeltedoccupantbetween2008and2012.Thisisanaverageof493severecrashesperyearandaccountedfor35%ofallseverecrashesduringthe5-yearperiod.
• Severecrashesinvolvingunbeltedorimproperlybeltedoccupantsprimarilyoccurredinruralareas(61%),asdesignatedbyinvestigatingofficers;themajorityofthesecrashesoccurredonlocalroadways(63%).
• 74%ofseverecrashesinvolvingunbeltedoccupantsinruralareasoccuronrural,high-speedtwo-laneroads.
• Severecrashesinvolvingunbelteddriversoccuramongdifferingcrashtypes,with42%asrun-off-roadcrashes,ascomparedto30%forallseverecrashes.
• Duringthe2004to2010timeframe,thestateadoptedaprimaryseatbeltlaw–thisallowslawenforcementtostopandticketdriversiftheyarenotwearingasafetybelt.Minnesota’sseatbeltlawisaprimaryoffense,meaningdriversandpassengersinallseatingpositionsmustbebuckleduporinthecorrectchildrestraintorlawenforcementwillstopandticketunbelteddriversorpassengers–includingthoseinthebackseats.
• Minnesotaoccupantrestraintusagerateis95%(June,2013)–thehighestinMinnesotahistory.Nationally,seatbeltuseismuchlower(86%in2012).
• A2014studysponsoredbytheMinnesotaDepartmentofPublicSafetyandledbytheUniversityofMinnesotaHumphreySchoolofPublicAffairsindicatethatfromJune2009(whenMinnesota’sprimarylawwasimplemented)throughJune2013,therewereatleast132fewerdeaths,434fewersevereinjuries,and1,270fewermoderateinjuriesthanexpectedwithoutaprimaryseatbeltlaw.Forfurtherinformation,seeEvaluation Update on the Effectiveness of the Minnesota Primary Seatbelt Lawatwww.cts.umn.edu/Research/ProjectDetail.html?id=2014053.
Behavioral Focus Area – Seat Belts
2014-2019 Minnesota Strategic Highway Safety Plan

B-9Traffic Safety Fundamentals Handbook – 2015
Highlights• Intersection-relatedcrashesaccountfornearly42%ofallseverecrashesin
Minnesota.
• Thenumberofintersection-relatedcrashesfellsteadilybetween2004and2011andthenincreasedslightly.
• ThemostfrequenttypeofseverecrashatbothSTOP(55%)andsignalcontrolled(38%)intersectionsinvolvesarightanglecollision.
• Inresponsetotheoverrepresentationofrightanglecollisionsatintersec-tions,agencieshaveimplementedvariousintersectionsafetystrategiessuchaslightingatruralcountyroadintersections,innovativedesignsthatlimitaccessatexpresswayintersections,andnewtechnologytohelplawenforcementaddressredlightviolationsattrafficsignals.
• Disaggregatedbysystem,Countyroadwayshavethegreatestnumberofintersection-relatedcrashesfollowedbyStatehighwaysandthenCitystreets.
Infrastructure Focus Area –Intersections
2014-2019 Minnesota Strategic Highway Safety Plan

B-10Traffic Safety Fundamentals Handbook – 2015
Highlights• Lanedeparture-relatedcrashesaccountforapproximately45%ofallsevere
crashesinMinnesota.
• Thenumberoflanedeparture-relatedcrashesfellsteadilybetween2004and2011andthenincreasedslightly.
• Roadwayfeaturesthatcontributetolanedeparturecrashesincludethelackofuseableshoulders,steepslopes,andfixedobjectsintheditches.Oneadditionalfeature,thepresenceofcurves,especiallythosewithradiiunder1,200feet,isassociatedwithsinglevehicleroaddeparturecrashes.Onthecountysystemmorethanone-halfofthesecrashesoccuralongcurvesandapproximatelyone-thirdofthestatesystem.
• Inresponsetothesecrashes,theStateandCountyagenciesimplementedvariouslanedeparturesafetystrategiessuchasedgelineandcenterlinerumblestripsandtheadditionofchevronsalongruralhorizontalcurves.
• Disaggregatedbysystem,Countyroadwayshavethegreatestnumberoflanedeparture-relatedcrashes,followedbyStatehighways.
Infrastructure Focus Area –Lane Departure
2014-2019 Minnesota Strategic Highway Safety Plan
B-11Traffic Safety Fundamentals Handbook – 2015
Comprehensive Safety Improvement Process
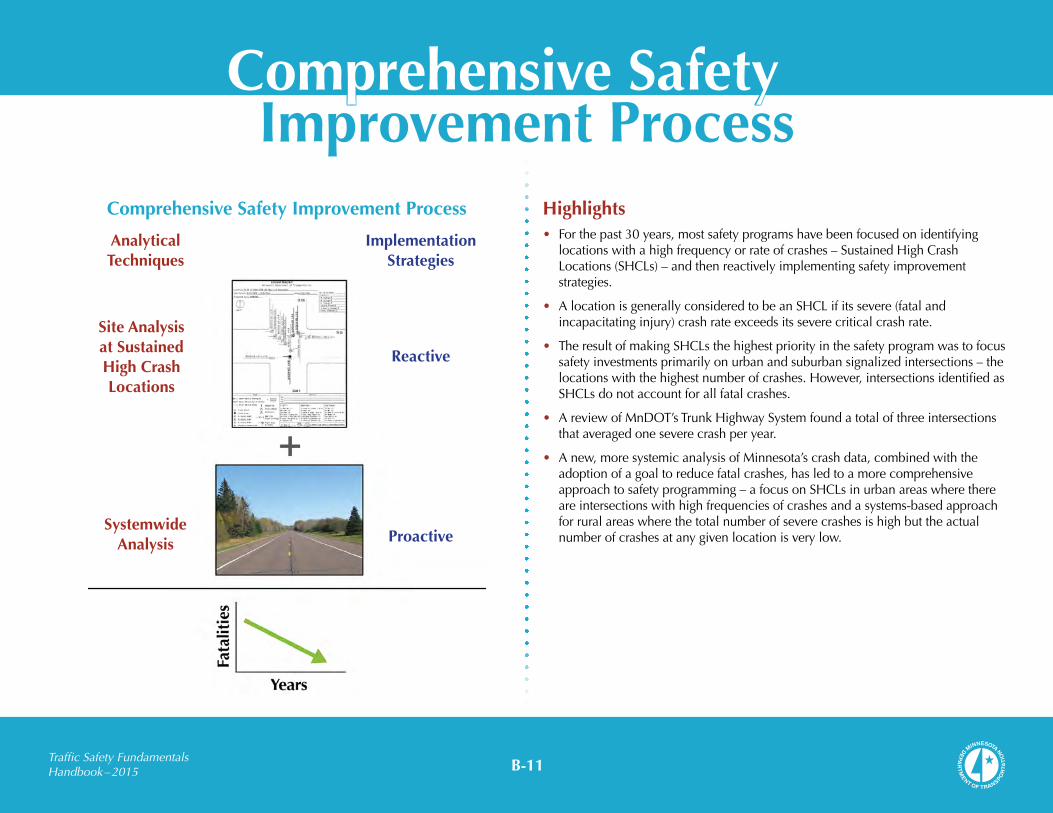
Highlights • Forthepast30years,mostsafetyprogramshavebeenfocusedonidentifying
locationswithahighfrequencyorrateofcrashes–SustainedHighCrashLocations(SHCLs)–andthenreactivelyimplementingsafetyimprovementstrategies.
• AlocationisgenerallyconsideredtobeanSHCLifitssevere(fatalandincapacitatinginjury)crashrateexceedsitsseverecriticalcrashrate.
• TheresultofmakingSHCLsthehighestpriorityinthesafetyprogramwastofocussafetyinvestmentsprimarilyonurbanandsuburbansignalizedintersections–thelocationswiththehighestnumberofcrashes.However,intersectionsidentifiedasSHCLsdonotaccountforallfatalcrashes.
• AreviewofMnDOT’sTrunkHighwaySystemfoundatotalofthreeintersectionsthataveragedoneseverecrashperyear.
• Anew,moresystemicanalysisofMinnesota’scrashdata,combinedwiththeadoptionofagoaltoreducefatalcrashes,hasledtoamorecomprehensiveapproachtosafetyprogramming–afocusonSHCLsinurbanareaswherethereareintersectionswithhighfrequenciesofcrashesandasystems-basedapproachforruralareaswherethetotalnumberofseverecrashesishighbuttheactualnumberofcrashesatanygivenlocationisverylow.
Analytical Techniques
Implementation Strategies
Reactive
Site Analysis at Sustained High Crash Locations
Systemwide Analysis Proactive
Comprehensive Safety Improvement Process

B-12Traffic Safety Fundamentals Handbook – 2015
Why Have a Sustained High Crash Location Identification Process?
Highlights • Conductingperiodicreviewsofyoursystemtoidentifylocationswithasustainedhigh
crashfrequencysupportsprojectdevelopmentactivitiesandareanintegralpartofabestpracticesapproachtoriskmanagement.Monitoringthesafetyofyoursystemisgoodpracticeandistheindustry“norm”againstwhichyouwillbeevaluated.
Project Development
• Crashesareonemeasurableindicatorofhowwellasystemofroadwaysandtrafficcon-troldevicesisfunctioning.
• UnderstandingsafetycharacteristicscanassistintheprioritizationanddevelopmentofroadwayimprovementprojectsbyhelpingdocumentPurposeandNeed.
Risk Management
• Activelyidentifyingpotentiallyhazardouslocationsisbetterthanbeinginthemodeofreactingtoclaimsofpotentiallyhazardouslocationsbythepublic(orplaintiff’sattor-neys).
• Knowledge(actualorconstructive)ofhazardousconditionsisoneoftheprerequisitesforprovinggovernmentagencynegligenceintortcasesresultingfrommotorvehiclecrashes.
• Allcrashanalysisperformedaspartofasafetyimprovementprogramisnot subject to discoveryintortlawsuits.
Data Systems
• Inordertobeabletodevelopcountermeasurestomitigatetheeffectsofcrashes,agen-ciesneedamonitoringsystemtoidentifycrashlocationsandthekeycharacteristicsandcontributingfactorsassociatedwiththecrashes.TheMnDOT“Toolkit”providesallofthenecessarycrash,roadwayandtrafficcontrolcharacteristicsforsegmentsandinter-sectionsontheTrunkHighwaysystem.MnCMATpluslocalagencyinventorieswouldprovidethedatanecessarytosupportsiteanalysesatlocationsidentifiedashavingsustainedhighcrashfrequencyorrateofcrashesalongcountyroadsandcitystreets.
“Rural”referstoanon–municipalareaandcitieswithapopulationlessthan5,000.
B-13Traffic Safety Fundamentals Handbook – 2015
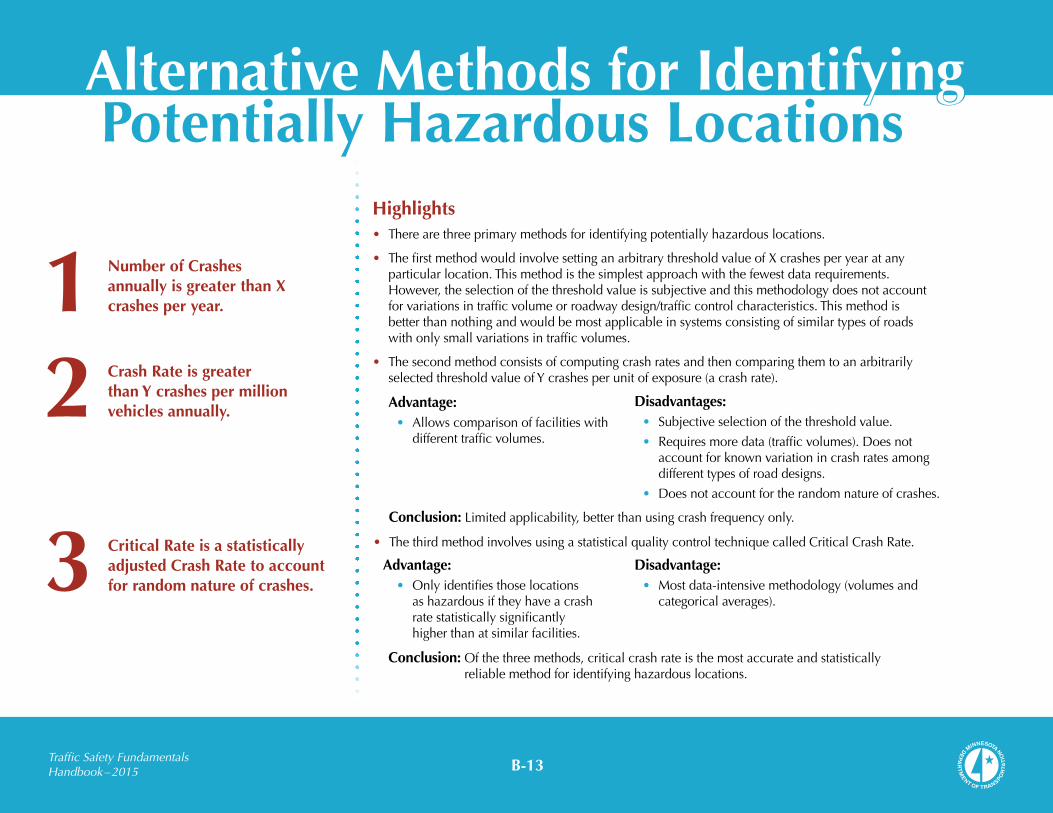
Alternative Methods for Identifying Potentially Hazardous Locations
1 Number of Crashes annually is greater than X crashes per year.
2 Crash Rate is greater than Y crashes per million vehicles annually.
3 Critical Rate is a statistically adjusted Crash Rate to account for random nature of crashes.
Highlights• Therearethreeprimarymethodsforidentifyingpotentiallyhazardouslocations.
• ThefirstmethodwouldinvolvesettinganarbitrarythresholdvalueofXcrashesperyearatanyparticularlocation.Thismethodisthesimplestapproachwiththefewestdatarequirements.However,theselectionofthethresholdvalueissubjectiveandthismethodologydoesnotaccountforvariationsintrafficvolumeorroadwaydesign/trafficcontrolcharacteristics.Thismethodisbetterthannothingandwouldbemostapplicableinsystemsconsistingofsimilartypesofroadswithonlysmallvariationsintrafficvolumes.
• ThesecondmethodconsistsofcomputingcrashratesandthencomparingthemtoanarbitrarilyselectedthresholdvalueofYcrashesperunitofexposure(acrashrate).
Advantage:• Allowscomparisonoffacilitieswith
differenttrafficvolumes.
Disadvantages:• Subjectiveselectionofthethresholdvalue.
• Requiresmoredata(trafficvolumes).Doesnotaccountforknownvariationincrashratesamongdifferenttypesofroaddesigns.
• Doesnotaccountfortherandomnatureofcrashes.
Conclusion: Limitedapplicability,betterthanusingcrashfrequencyonly.
• ThethirdmethodinvolvesusingastatisticalqualitycontroltechniquecalledCriticalCrashRate.
Advantage:• Onlyidentifiesthoselocations
ashazardousiftheyhaveacrashratestatisticallysignificantlyhigherthanatsimilarfacilities.
Disadvantage: • Mostdata-intensivemethodology(volumesand
categoricalaverages).
Conclusion: Ofthethreemethods,criticalcrashrateisthemostaccurateandstatisticallyreliablemethodforidentifyinghazardouslocations.

B-14Traffic Safety Fundamentals Handbook – 2015
Effect of Random Distribution of Crashes
Highlights
The Concept of Critical Crash Rate
• Thetechniquethatusesthecriticalcrashrateisconsideredtobeahighlyeffectivetech-niqueforidentifyinghazardouslocations.
• Thecriticalcrashrateaccountsforthekeyvariablesthataffectsafety,including:
• Thedesignofthefacility
• Thetypeofintersectioncontrol
• Theamountofexposure
• Therandomnatureofcrashes
• Theconceptsuggeststhatanysampleorcategoryofintersectionsorroadwaysegmentscanbedividedintothreebasicparts:
• Locationswithacrashratebelowthecategoricalaverage:TheselocationsareconsideredtobeSAFEbecauseofthelowfrequencyofcrashesandcanbeeliminatedfromfurtherreview.
• Locationswithacrashrateabovethecategoricalaverage,butbelowthecriticalrate:TheselocationsareconsideredtobeSAFEbecausethereisaveryhighprobability(90-95%)thatthehigherthanaveragecrashrateisduetotherandomnatureofcrashes.
• Locationswithacrashrateabovethecriticalrate:TheselocationsareconsideredtobeUNSAFEandinneedoffurtherreviewbecausethereisahighprobability(90-95%)thatconditionsatthesitearecontributingtothehighercrashrate.
• Theotheradvantageofusingthecriticalcrashrateisthatithelpsscreenout90%ofthelocationsthatdonothaveaproblemandfocusesanagency’sattentionandresourcesonthelimitednumberoflocationsthatdohaveadocumentedproblem(asopposedtoaperceivedproblem).
• Therelationshipbetweenthecriticalcrashrateandthelevelofvehicularexposureshouldbenoted.Asthevolumeoftrafficattheintersectionorsegmentbeingstudiedincreases,thedifferencebetweenthesystemaverageandthecriticalratediminishes.
B-15Traffic Safety Fundamentals Handbook – 2015
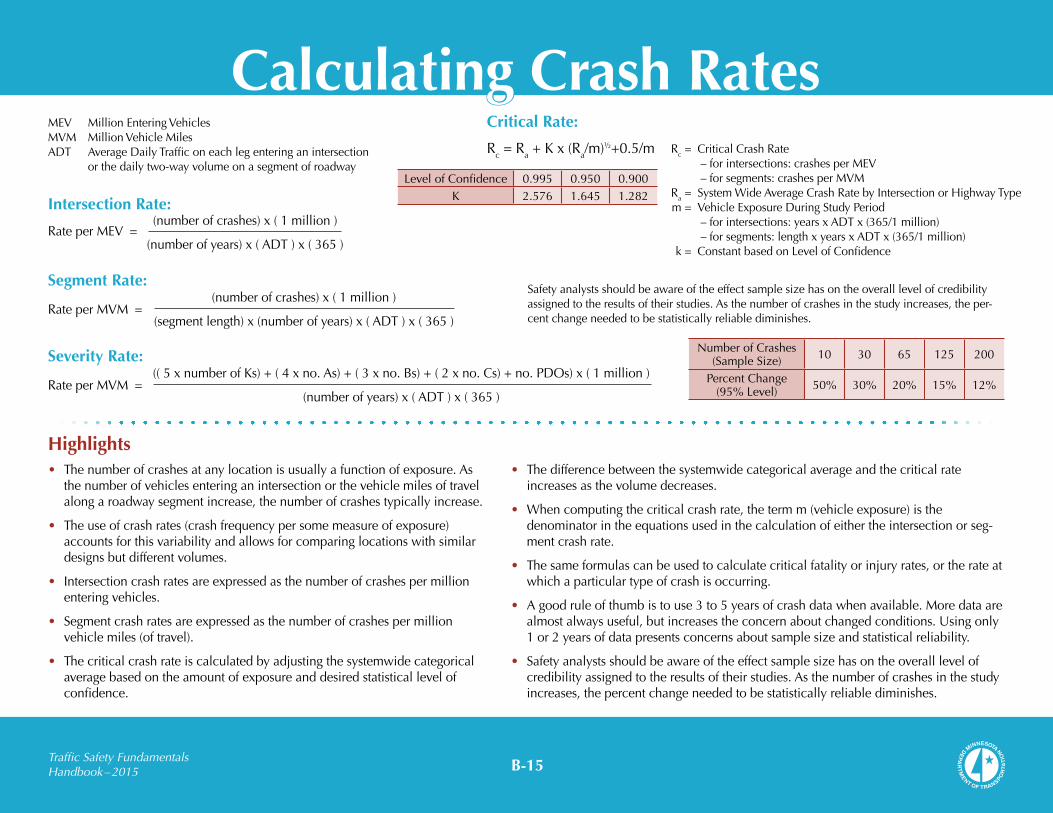
Calculating Crash Rates
Highlights• Thenumberofcrashesatanylocationisusuallyafunctionofexposure.As
thenumberofvehiclesenteringanintersectionorthevehiclemilesoftravelalongaroadwaysegmentincrease,thenumberofcrashestypicallyincrease.
• Theuseofcrashrates(crashfrequencypersomemeasureofexposure)accountsforthisvariabilityandallowsforcomparinglocationswithsimilardesignsbutdifferentvolumes.
• Intersectioncrashratesareexpressedasthenumberofcrashespermillionenteringvehicles.
• Segmentcrashratesareexpressedasthenumberofcrashespermillionvehiclemiles(oftravel).
• Thecriticalcrashrateiscalculatedbyadjustingthesystemwidecategoricalaveragebasedontheamountofexposureanddesiredstatisticallevelofconfidence.
LevelofConfidence 0.995 0.950 0.900K 2.576 1.645 1.282
MEV MillionEnteringVehiclesMVM MillionVehicleMilesADT AverageDailyTrafficoneachlegenteringanintersection
orthedailytwo-wayvolumeonasegmentofroadway
• Thedifferencebetweenthesystemwidecategoricalaverageandthecriticalrateincreasesasthevolumedecreases.
• Whencomputingthecriticalcrashrate,thetermm(vehicleexposure)isthedenominatorintheequationsusedinthecalculationofeithertheintersectionorseg-mentcrashrate.
• Thesameformulascanbeusedtocalculatecriticalfatalityorinjuryrates,ortherateatwhichaparticulartypeofcrashisoccurring.
• Agoodruleofthumbistouse3to5yearsofcrashdatawhenavailable.Moredataarealmostalwaysuseful,butincreasestheconcernaboutchangedconditions.Usingonly1or2yearsofdatapresentsconcernsaboutsamplesizeandstatisticalreliability.
• Safetyanalystsshouldbeawareoftheeffectsamplesizehasontheoveralllevelofcredibilityassignedtotheresultsoftheirstudies.Asthenumberofcrashesinthestudyincreases,thepercentchangeneededtobestatisticallyreliablediminishes.
RateperMVM =(numberofcrashes)x(1million)
(segmentlength)x(numberofyears)x(ADT)x(365)
Segment Rate:
Intersection Rate:
RateperMEV =(numberofcrashes)x(1million)
(numberofyears)x(ADT)x(365)
Severity Rate:
RateperMVM =((5xnumberofKs)+(4xno.As)+(3xno.Bs)+(2xno.Cs)+no.PDOs)x(1million)
(numberofyears)x(ADT)x(365)
Rc=Ra+Kx(Ra/m)½+0.5/m Rc= CriticalCrashRate –forintersections:crashesperMEV –forsegments:crashesperMVMRa=SystemWideAverageCrashRatebyIntersectionorHighwayTypem=VehicleExposureDuringStudyPeriod –forintersections:yearsxADTx(365/1million) –forsegments:lengthxyearsxADTx(365/1million) k=ConstantbasedonLevelofConfidence
Critical Rate:
NumberofCrashes(SampleSize) 10 30 65 125 200
PercentChange(95%Level) 50% 30% 20% 15% 12%
Safetyanalystsshouldbeawareoftheeffectsamplesizehasontheoveralllevelofcredibilityassignedtotheresultsoftheirstudies.Asthenumberofcrashesinthestudyincreases,theper-centchangeneededtobestatisticallyreliablediminishes.

B-16Traffic Safety Fundamentals Handbook – 2015
Supplemental Analysis – More Detailed Record Review
Highlights • Afteridentifyinghazardouslocations,thenextstepisto
conductsupplementalanalysesinordertobetterunderstandthenatureoftheproblemandtohelpdevelopappropriatemitigativestrategies.
• Amoredetailedunderstandingofthecontributingfactorsisnecessarytodevelopcountermeasuresbecausethereiscurrentlynoexpertsysteminplacethatallowsmappingfromahighcrashratetothebasesafetysolution.Trafficengineersneedtoknowmoreabouttheparticularproblemsatspecificlocationsbecauseour“Toolkit”isfarlessdevelopedthanotherareasofroadwayengineering.
• ThesupplementalanalysisofcrashdatainvolvescomparingACTUALcrashcharacteristicstoEXPECTEDcharacteris-ticsandthenevaluatingfordifferences.Thesedifferencesdocumentcrashcausationfactorsthathelpidentifyeffectivecountermeasures.
• Itisimportanttorememberthatroadsthataresimilarindesign,withsimilarvolumes,willoperateinasimilarmannerandwillprobablyhavesimilarcrashcharacteristics.
• MnDOT’s“Toolkit”andtheinformationprovidedinSectionAofthishandbookprovideinsightaboutexpectedcondi-tionsalongMinnesota’sroadways.
• TheHighwaySafetyManual(seepageC-8)cancontributetoadetailedanalysisbydocumentingSafetyPerformanceFunctions(SPFs)thatcomputetheexpectedcrashfrequencyforavarietyofroadwaycross-sectionsandintersectiontypes.
B-17Traffic Safety Fundamentals Handbook – 2015
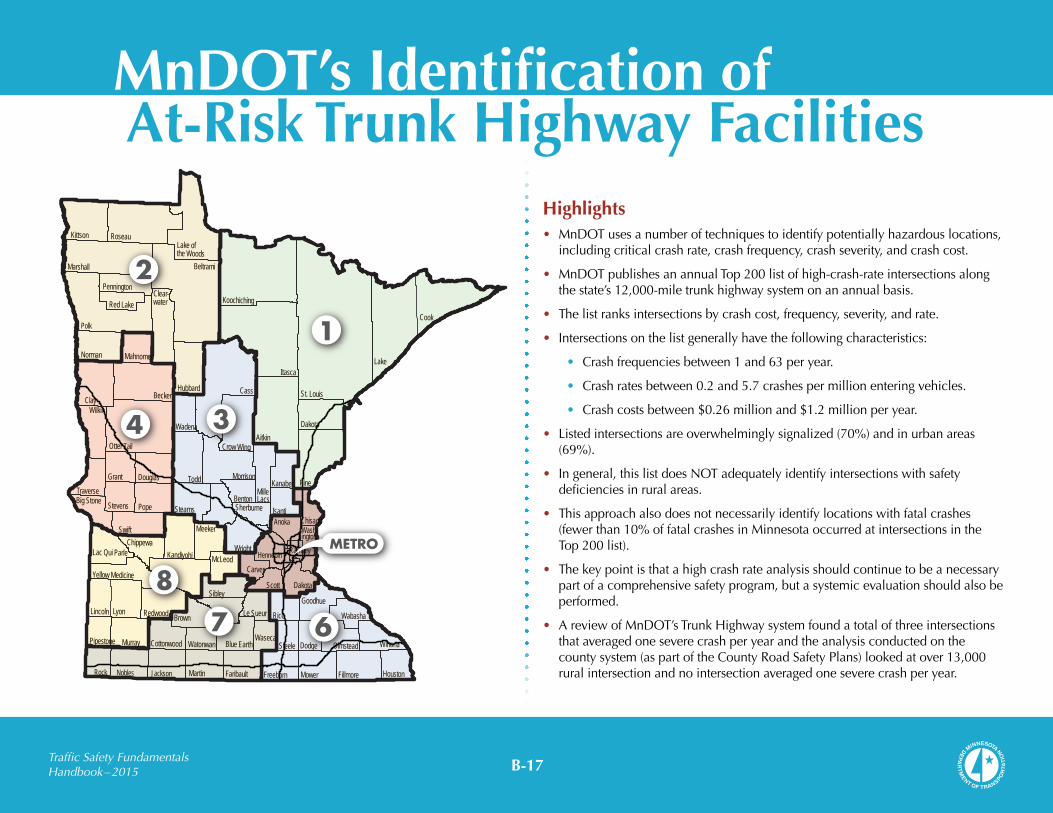
Highlights • MnDOTusesanumberoftechniquestoidentifypotentiallyhazardouslocations,
includingcriticalcrashrate,crashfrequency,crashseverity,andcrashcost.
• MnDOTpublishesanannualTop200listofhigh-crash-rateintersectionsalongthestate’s12,000-miletrunkhighwaysystemonanannualbasis.
• Thelistranksintersectionsbycrashcost,frequency,severity,andrate.
• Intersectionsonthelistgenerallyhavethefollowingcharacteristics:
• Crashfrequenciesbetween1and63peryear.
• Crashratesbetween0.2and5.7crashespermillionenteringvehicles.
• Crashcostsbetween$0.26millionand$1.2millionperyear.
• Listedintersectionsareoverwhelminglysignalized(70%)andinurbanareas(69%).
• Ingeneral,thislistdoesNOTadequatelyidentifyintersectionswithsafetydeficienciesinruralareas.
• Thisapproachalsodoesnotnecessarilyidentifylocationswithfatalcrashes(fewerthan10%offatalcrashesinMinnesotaoccurredatintersectionsintheTop200list).
• Thekeypointisthatahighcrashrateanalysisshouldcontinuetobeanecessarypartofacomprehensivesafetyprogram,butasystemicevaluationshouldalsobeperformed.
• AreviewofMnDOT’sTrunkHighwaysystemfoundatotalofthreeintersectionsthataveragedoneseverecrashperyearandtheanalysisconductedonthecountysystem(aspartoftheCountyRoadSafetyPlans)lookedatover13,000ruralintersectionandnointersectionaveragedoneseverecrashperyear.
MnDOT’s Identification of At-Risk Trunk Highway Facilities
Kittson Roseau
Marshall
Pennington
Red Lake
Clay Becker Wilkin
Otter Tail
Traverse Grant Douglas
Wadena
Todd
Crow Wing
Morrison
Mille Lacs
Kanabec Pine
Chisago Isanti Sherburne
Wright
Benton
Meeker
Stearns Pope Stevens Big Stone
Swift Chippewa
Yellow Medicine
Lincoln Lyon Redwood
Sibley Scott
Goodhue
Dodge
Mower Fillmore
Olmstead
Wabasha
Winona
Houston
Pipestone Murray Cottonwood
Brown Le Sueur Rice
Martin Faribault Freeborn
Watonwan Waseca
Steele Blue Earth
Lac Qui Parle Kandiyohi McLeod Carver
Mahnomen
Beltrami
Lake of the Woods
Koochiching
St. Louis
Dakota
Lake
Cook
Itasca
Aitkin
Cass Hubbard
Clear-water
Norman
Dakota
Ramsey
Rock Nobles Jackson
Hennepin
Polk
Wash- ington
Anoka
6
2
8
7
1
34
METRO

B-18Traffic Safety Fundamentals Handbook – 2015
Crash Summary by Facility Types – Greater Minnesota Districts
Facility Type Miles
CrashesCrash Rate
Severity Rate Fatal Rate
Crash DensityFatal
Serious Injury
Rura
l
Freeway 742.8 62 141 0.54 0.61 0.27 3.394-LaneExpressway 735.8 99 169 0.65 1.12 0.66 2.684-LaneUndivided 27.5 2 3 0.63 0.80 0.53 1.734-LaneDividedConventional(Non-Expressway) 103.6 13 27 0.82 1.40 0.67 3.06
2-La
ne
ADT<1,500 3,953.2 99 171 0.64 2.59 1.50 0.211,500<ADT<5,000 3,744.3 184 299 0.54 1.56 0.96 0.565,000<ADT<8,000 556.4 54 96 0.59 1.51 0.85 1.35ADT>8,000 126.4 17 30 0.56 1.18 0.67 2.23
Sub Total 9,990 530 936
Urb
an
Freeway 20.6 4 16 1.33 1.00 0.25 20.734-LaneExpressway 44.1 7 30 2.16 2.35 0.55 12.524-LaneUndivided 42.7 4 18 3.05 2.06 0.46 12.464-LaneDividedConventional(Non-Expressway) 55.3 8 31 2.43 1.80 0.47 15.123-Lane 26.3 6 4 2.02 0.87 1.31 7.055-Lane 16.9 0 8 2.39 1.84 0.00 12.34
2-La
ne
ADT<1,500 77.2 5 10 1.91 7.74 3.87 0.641,500<ADT<5,000 266.9 12 25 1.35 1.78 0.85 1.435,000<ADT<8,000 96.5 4 33 1.80 2.95 0.36 4.17ADT>8,000 51.7 2 24 2.29 2.41 0.20 8.80
Sub Total 698 52 199
Crash Summary by Facility Types – Metro District
Facility Type Miles
CrashesCrash Rate
Severity Rate Fatal Rate
Crash DensityFatal
Serious Injury
Rura
l
Freeway 122 22 24 0.6 0.9 0.5 11.14-LaneExpressway 111 17 65 1.0 1.5 0.7 10.34-LaneUndivided 0 0 0 2.5 3.1 0.0 14.84-LaneDividedConventional(Nonexpressway) 1 0 0 1.3 2.0 0.0 9.2
2-La
ne
ADT<1,500 13 0 2 0.0 0.0 0.0 0.51,500<ADT<5,000 89 5 8 1.0 1.5 2.0 1.35,000<ADT<8,000 98 8 18 1.2 2.0 1.8 2.7ADT>8,000 137 17 33 1.3 2.0 1.2 6.9
Sub Total 571 69 150
Urb
an
Freeway 267 43 128 1.2 1.6 0.2 41.74-LaneExpressway 124 17 81 1.9 2.7 0.5 23.94-LaneUndivided 20 2 25 5.8 7.8 0.7 41.34-LaneDividedConventional(Nonexpressway) 21 3 19 5.0 6.8 0.9 38.63-Lane 9 0 2 3.1 4.3 0.0 16.85-Lane 2 0 3 5.6 8.8 0.0 52.4
2-La
ne
ADT<1,500 1 0 0 4.0 6.3 0.0 2.11,500<ADT<5,000 9 0 0 2.8 3.9 0.0 3.75,000<ADT<8,000 26 2 2 2.3 3.3 1.6 5.5ADT>8,000 54 6 20 3.0 4.2 1.1 15.6
Sub Total 533 73 280
Systemic Analysis – State HighwaysHighlights • Historically,theabsenceofsustainedhighcrashlocationsin
asystemofroadswasinterpretedtomeanthattherewerenosafetydeficienciesandthattherewerenoopportunitiestoeffectivelymakeinvestmentstoreducecrashes.
• However,anewinterpretationofthecrashdatabytheFHWAandanincreasingnumberofstatedepartmentsoftransportationsuggeststhatneitherassumptioniscorrect.
• AreviewofMinnesota’scrashdata,conductedaspartoftheSHSP,providesseveralinsightsinsupportofasystemicapproachforaddressingsafetydeficiencies.
• Onthestate’shighwaysystem,thefacilitytypesthatpresentthegreatestopportunitytoreducefatalcrashes(basedonthetotalnumberoffatalcrashes)areruraltwo-laneroads(50%)andfreeways(22%).However,untilrecentlytherehavebeenfewprojectsonthesefacilitiesbecausetheprocessoffilteringthedatafailedtoidentifyanysustainedhighcrashlocations.
• Furtheranalysisofthesepriorityfacilitiesshowsthatneithertheoverallcrashratenorthefatalityrateisatallunusual,butthepooloffatalcrashessusceptibletocorrectionisstilllargeandrepresentsthegreatestopportunityforreduction:addressingroaddeparturecrashesonruraltwo–laneroadsandcross-mediancrashesonfreeways.
• Thefinalpointinsupportofasystemicapproachtoaddresssafetyinruralareasistheverylowdensityofcrashesalongruraltwo-lanehighways–61%offatalcrashesoccuronthe87%ofthesystemthataverageslessthanonecrashpermileperyear.
2013 MnDOT Crash Data Toolkit, 2009-2013
Note:Crashrateiscrashespermillionvehiclemiles;fatalityrateisfatalcrashesper100millionvehiclemiles.

B-19Traffic Safety Fundamentals Handbook – 2015
Systemic Analysis – County Highways
Highlights • Historically,theprimarycandidatesforsafetyinvestmentwerelocationsidenti-
fiedashavingahighfrequencyofcrashescomparedtoothersimilarintersectionsorroadwaysegments(frequentlyreferredtoassustainedhighcrashlocationsorSHCLs).
• Overtime,itwasrecognizedthatthisapproachhadtwodistrictdisadvantages:
• First,thisapproachmadehighwayagenciesentirelyreactive(agencystaffhadtotrytorespondtothephonecallthatasked–“Howmanypeoplehavetodiebeforeyoudosomething?”)
• Second,in2005FHWArequiredstatestobasetheirsafetyprogramsonseverecrashes(fatal+seriousinjury)insteadofallseverities.SubsequentanalysisfoundthatthereareonlyafewlocationsinMinnesotawheremultipleseverecrashesoccurandvirtuallynonealonglocalsystems.
• Inresponse,MnDOTaddeda“systemic”componenttoitsHighwayImprovementProgramtocomplementthehistoricreactivecomponent.
• Thesystemicapproachusescrashsurrogates–roadwayandtrafficcharacteristicsthatappeartobeoverrepresentedatthelocationsaroundMinnesotawhereseriouscrashesoccur–toidentifyat-risklocationsthatarecandidatesforsafetyinvestment.
• Thesystemicapproachwasusedtopreparesafetyplansforall87countiesinMinnesota.Theanalysesofeachcounty’ssystemofroadsidentifiedthetypesofcrashesthatrepresentthegreatestopportunityforreductions,theshortlistofhighlyeffectivestrategiesandaprioritizedlistofcandidatelocationsforsafetyinvestmentbasedonthepretenseofroadwayandtrafficcharacteristicsthatwereassociatedwithlocationswithseverecrashes.Theoutcomeoftheeffortwastheidentificationofover17,000projectswithanestimatedimplementationcostofapproximately$246M.Itshouldbenotedthatnotasinglelocationidentifiedasbeingat-riskalongthecountysystemaveragedoneseverecrashperyearandwouldnothavebeenidentifiedasahigh-crashlocation.
Intersections with multiple severe crashes
in 5-year period.
Intersections considered high priority based on risk
assessment.

B-20Traffic Safety Fundamentals Handbook – 2015
Highlights
Greater Minnesota Crash Data Overview
• The“systemic”approachhasprovedtobepar-ticularlyeffectiveatidentifyingat-risklocationsforsafetyinvestmentalongMinnesota’scountyhighwaysystem.
• IngreaterMinnesota,thenumberofseverecrashesonthecountyroadwaysystemisvirtuallyidenticaltothenumberonthestatesystem(approximately500severecrashes/year).However,thetwomostcommontypes–roaddepartureandrightanglecrashes–arescatteredacrossalmost27,000milesofpavedroadsand13,000intersections.Thisresultsinaveragedensitiesof0.007permileand0.006perintersection.Inaddition,morethan90%ofthesefacilitieshadNOseverecrashes(over5years)andNONEaveragedoneseverecrashperyear.
• Thetraditionalreactive-basedanalysiswouldhaveconcludedthatthereareNOcandidatesforsafetyinvestment.Therisk-basedsystemicanalysiscametoadifferentconclusionandidentifiedapproximately$232Mofroadedge,curvedelineation,andinter-sectionsafetyimprovementsbasedontheprobabilityofacrashoccurringatthelocationwithmultipleriskfactorspresent.
Minnesota Crash Mapping Analysis Tool, 2009-2013
ATP’s 1, 2, 3, 4, 6, 7, and 8 – NO Metro
Severeisfatalandseriousinjurycrashes(K+A)
Systemic Analysis – County HighwayCrash Data for Greater Minnesota

B-21Traffic Safety Fundamentals Handbook – 2015
Highlights
Risk Rating Criteria for Rural Paved Roads
• ThesystemicriskassessmentofMinnesota’sruralcountyhighwaysusedavarietyofroadwayandtrafficcharacteristicsidentifiedfromareviewofpublishedsafetyresearchandinformationobtainedaboutthespecificlocationsinMinnesotawheresevereroaddepartureandrightanglecrashesoccurred.
• Thesystemofpaved,secondaryroadswasanalyzedineverycounty.Thisanalysisusedaerialphotography,videologs,andMnCMATtoidentifythecharacteristicsofeachsegment,horizontalcurve,andintersection.
• Theresultsoftheanalysisincludedprioritizedlistings(basedonthenumberofriskfactorspresent)ofsegments,curves,andintersectionsforeverycounty.Thepriorityliststypicallyidentifiedapproximately25%to30%ofeachcounty’sfacilitiesofbeingat-riskandthereforecandidatesforsafetyinvestment.
Roadway and Traffic Characteristics
Segments – Density of Road Departure– Traffic Volume– Critical Curve Radius Density– Access Density– Edge Risk Assessment
Curves – ADT Range– Radius Range – Severe Crash on Curve– Intersection on Curve
Intersections – Skewed Approaches– On/Near Curve– Volume– Proximity to Railroad Crossing– Proximity to Last STOP Sign– Intersection-Related Crashes– Commercial Development in
Quadrant
Systemic Analysis – County Highway Assessment

B-22Traffic Safety Fundamentals Handbook – 2015
Highlights
Metro County Crash Data Overview
• ThesystemicapproachwasalsoappliedtotheurbancountiesintheMinneapolis–St.PaulMetropolitanArea.Inthesecounties,thenumberofcrashesexceedsthenumberontheStatesystembyalmost45%.
• Themostcommontypesofseverecrashesinclude,forsegments:
• Rear-end
• Sideswipe
• Head-on
• Forintersectionsthemostcommenttypeofseverecrashesare:
• Rightangle
• Pedestrian/bicyclist
• However,thecrasheswerescatteredoveralmost1,600milesofroadwayand2,900intersections.Thisresultsinaveragedensi-tiesof0.05severecrashes/mile,and0.01crashes/intersections.Inaddition,approximately90%oftheurbanfatalitieshadNOseverecrashesandNONEaveragedoneseverecrashperyear.
• Aswasthecaseinruralareas,thetraditionalreactiveanalysiswouldhaveconcludedthatthereareNOcandidatesforsafetyinvestmentbasedonlyonthepresenceofcrashes.Therisk-basedsystemicanalysisidentifiedapproximately$14Mofsegmentandintersectionsafetyimprovementsthatcouldbedeployedproactivelythatwouldpreventtheoccurrenceoftheprioritycrashtypes.
Severeisfatalandseriousinjurycrashes(K+A)
Minnesota Crash Mapping Analysis Tool, 2009-2013
Systemic Analysis – County Highway Crash Data for Metro

B-23Traffic Safety Fundamentals Handbook – 2015
Highlights
Risk Assessment Findings – Urban Intersection
• Thesystemicriskassessmentoftheurbancountyhighwaysidentifiedtheroadwayandtrafficcharacteristicsthatwerecommontothelocationswheretheprioritycrashtypesoccurred:rightangleandped/bikecrashes.Alloftheurbancountyhighwayswerethenevaluatedusingaerialphotography,videologs,andMnCMATforpresenceofthesefeatures.
• Theresultoftheanalysisincludedprioritizedlistingsofsegmentsandintersectionsforeverycounty.Aswasthecasewiththeruralcounties,theprioritylistsfortheurbancountiestypicallyidentifiedapproximately25%to30%ofeachcounty’sfacilitiesofbeingatriskandcandidatesforsafetyinvestment.
Roadway and Traffic Characteristics
Urban Intersections (Right Angle Crashes)
– Density of Road Departure– Traffic Volume– Critical Curve Radius Density– Access Density– Edge Risk Assessment
Urban Intersections (Pedestrian/ Bicycle Crashes)
– ADT Range– Radius Range – Severe Crash on Curve– Intersection on Curve
Systemic Analysis – County Highway Assessment for Metro
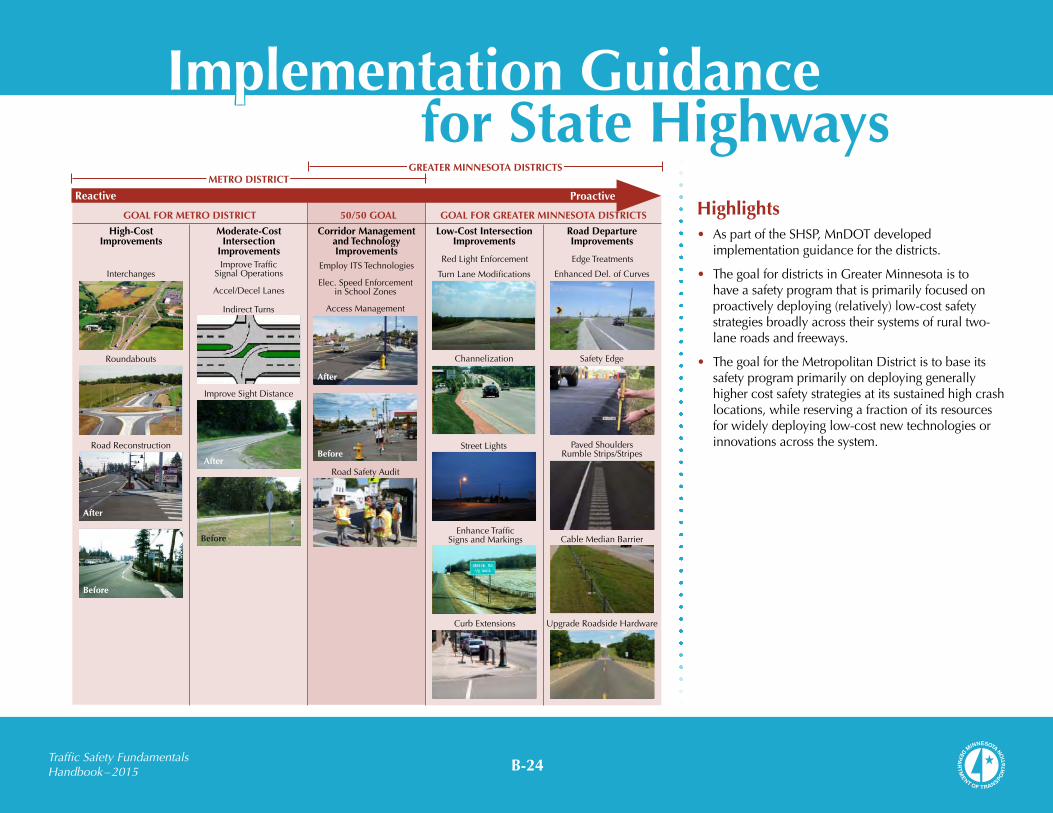
B-24Traffic Safety Fundamentals Handbook – 2015
Implementation Guidance for State Highways
GOAL FOR METRO DISTRICT
Reactive Proactive
GOAL FOR GREATER MINNESOTA DISTRICTS50/50 GOAL
High-Cost Improvements
Moderate-Cost Intersection
Improvements
Corridor Management and Technology Improvements
Low-Cost Intersection Improvements
Road Departure Improvements
TurnLaneModifications
StreetLights
Channelization
RedLightEnforcement
EnhanceTrafficSignsandMarkings
CurbExtensions
Interchanges
RoadReconstruction
Roundabouts
After
Before
IndirectTurns
ImproveSightDistance
After
Before
ImproveTrafficSignalOperations
Accel/DecelLanes
EmployITSTechnologies
Elec.SpeedEnforcementinSchoolZones
AccessManagement
After
Before
RoadSafetyAudit
EnhancedDel.ofCurves
CableMedianBarrier
SafetyEdge
EdgeTreatments
PavedShouldersRumbleStrips/Stripes
UpgradeRoadsideHardware
Highlights • AspartoftheSHSP,MnDOTdeveloped
implementationguidanceforthedistricts.
• ThegoalfordistrictsinGreaterMinnesotaistohaveasafetyprogramthatisprimarilyfocusedonproactivelydeploying(relatively)low-costsafetystrategiesbroadlyacrosstheirsystemsofruraltwo-laneroadsandfreeways.
• ThegoalfortheMetropolitanDistrictistobaseitssafetyprogramprimarilyondeployinggenerallyhighercostsafetystrategiesatitssustainedhighcrashlocations,whilereservingafractionofitsresourcesforwidelydeployinglow-costnewtechnologiesorinnovationsacrossthesystem.
METRO DISTRICTMETRO DISTRICTGREATER MINNESOTA DISTRICTSGREATER MINNESOTA DISTRICTS

B-25Traffic Safety Fundamentals Handbook – 2015
Highlights • Theprimaryobjectiveofthesafetyanalysisconductedaspartof
thecountyroadwaysafetyplanswastoidentifytheprimarycausesofseverecrashesandtoconductaprioritizationexerciselinkingat-risklocationswithashortlistofhighprioritysafetystrategies–theidentificationofsafetyprojectsthatarecandidatesforfundingthroughthestate’shighwaysafetyimprovementprogram.
• Thereviewofcountycrashdatafoundnosustainedhighcrashlocationsonthecountysystem,butdidfindapooloflife-changingcrashes(fatal+severeinjury)thatwouldbesusceptibletocorrection.
• Theanalysisfoundthemostfrequenttypesofseverecrashesinruralcountieswereroaddeparturecrashesalongsegmentsandhorizontalcurves,aswellasrightanglecrashesatThru/STOPcontrolledintersections.Intheurbancountiesthemostfrequentseverecrasheswererightangleandpedestrian/bicyclecrashesatsignalizedintersectionsandrear-endinsegments.
• Theprocessultimatelyidentifiedthefollowing:
• 16,500ruralroadedge,curvedelineation,andintersectionimprovementprojectsvaluedatmorethan$232M.
• 660urbansignalizedintersectionandroadwaysegmentimprovementsvaluedatapproximately$14M.
Implementation Guidance for County Highways
Street Lighting
Rumble Strips
Countdown Timers and Advanced Pedestrian Intervals
Dynamic Warning Signs
Red-Light Confirmation Lights

B-26Traffic Safety Fundamentals Handbook – 2015
Highlights • Minnesota Toward Zero Deathsisaninterdisciplinarypartnershipwhichbeganin2003
withtheDepartmentofHealth,Transportation,andPublicSafety.
• Ourmissionistocreateacultureforwhichtrafficfatalitiesandseriousinjuriesarenolongeracceptablethroughtheintegratedapplicationofeducation,engineering,enforcement,andemergency medical and trauma services.Theseeffortswillbedrivenbydata,bestpractices,andresearch.
Success
• Interdisciplinarypartnership,groundwork,legwork,teamwork,educateonother“E”stobenefiteducationofalltrafficsafety.
• TrafficSafetycoalitions:www.minnesotatzd.org/initiatives/saferoads/coalition/
• Statewidegoalsoftrafficsafetycoalitions:
• Coalitionscanincludeindividualsaswellasrepresentativesofotherorganizations,suchaspolicedepartmentsoremergencyservicesproviders.
• Coalitionsareoftenmoreeffectivethanindividualsworkingalone-orevendifferentorganizationsworkingindependently.
• Coalitionscandevelopstrongerpublicsupportforanissuebyincreasingvisibilityandpublicawareness.
• WorkingtogetheristhefoundationoftheTowardZeroDeathsprogram.
Public Service
• Media
• Workplacepolicyandimplementation
• Parentcomponenttodriver’seducation
• HighVisibilityCampaigns–linktocalendar:https://dps.mn.gov/divisions/ots/law-enforcement/Pages/calendar.aspx
FindyourlocalTZDcoordinator:www.minnesotatzd.org/whatistzd/mntzd/contact/
Safety Planning at the Local Level
TZD Regions

B-27Traffic Safety Fundamentals Handbook – 2015
Highlights • Federalhighwaylegislationrequiresallstatestopreparestrategicsafetyplans,andallofthestateshave
complied.
• Nationalcrashdataindicatebetween15%and60%oftrafficfatalitiesoccuronlocalroads(thenationalaverageis43%).Thisclearlyindicatestheneedforthestatestoengagelocalroadauthoritiesinstatewidestrategicsafetyplanningefforts.
• InMinnesota,almost65%ofcrashesinvolvingseriousinjuriesoccuronlocalroads.MnDOThassupportedsafetyplanningatthelocallevelbyincreasinglevelsoffinancialassistanceandtechnicalsupport.The2015-2016HighwaySafetyImprovementProgramallocatedalmost$10millionfor53projectsonthelocalsystem(includingprojectsthatinvolveenhancingtheedgeofruralroads,installingchevronsincurvesandaddingintersectionlighting).AlloftheseprojectswereidentifiedinplanspreparedforcountiesinMinnesotaaspartoftheMnDOTfundedCountyRoadwaySafetyPlans.
• Thesinglemostimportantpracticetosupportsafetyatthelocallevelisforagenciestodedicateapor-tionoftheircapitalimprovementprogramtoimplementinglow-coststrategiesontheirsystem.
• Inadditiontoimprovementstoroadways,otherlocalsafetybasedpracticescouldinclude:
• Initiating/participatinginSafeCommunitiesprogram
• Initiating/participatinginSafeRoutestoSchoolprogram
• Initiatingafatalcrashreviewprocessthatinvolveslawenforcementandengineeringstaffplusemergencyresponders
• Supportlawenforcementinitiativestoreducespeeding,improveseatbeltcomplianceandreducingdrinkinganddriving.AnexampleofahighlyeffectivelocallawenforcementinitiativeistheRiceCountyMODSquad.AteamconsistingofRiceCountysheriffs,theMinnesotaSatePatrolandlocalpoliceconductedahigh-visibilityenforcementcampaignto“MOD-ify”unsafedrivingbehavior.TheMODSquadtargetedsmallercommunitiesandlocalfestivalsandcelebrations.Inthe10yearspriortothehigh-visibilityenforcementcampaign,RiceCountyaveraged12alcohol-relatedfatalitiesperyear.Inthefirstyearofthecampaign,thenumberdroppedtozero.
Safety Planning at the Local Level

C-1Traffic Safety Fundamentals Handbook – 2015
C-2 Traffic Safety Tool Box – Then vs. NowC-4 Effectiveness of Safety StrategiesC-5 Safety Strategies
– HSIP Impact PyramidC-6 – CMF ClearinghouseC-8 – Highway Safety ManualC-10 – Highway Capacity ManualC-11 – Countermeasures that WorkC-12 – InfrastructureC-13 – BehaviorC-14 Roadside Safety InitiativesC-13 – Edge TreatmentsC-17 – Horizontal CurvesC-19 – Slope Design/Clear Recovery AreasC-20 – Upgrade Roadside HardwareC-21 Effectiveness of Roadside Safety InitiativesC-22 Addressing Head-On Collisions
C-24 Intersection Safety StrategiesC-25 Intersections
– Conflict Points – Traditional DesignC-26 – Conflict Points – New DesignC-28 – Enhanced Signs and MarkingsC-29 – Sight DistanceC-30 – Turn Lane DesignsC-31 – Roundabouts and Indirect TurnsC-32 – Traffic Signal OperationsC-33 – Red Light EnforcementC-35 Rural Intersections
– Safety Effects of Street LightingC-36 – Flashing BeaconsC-37 – Transverse Rumble StripsC-38 Pedestrian Safety StrategiesC-39 Pedestrian Safety
– Crash Rates vs. Crossing FeaturesC-40 – Curb Extensions and Medians
C-41 Pedestrian/Bike StrategiesC-42 Complete StreetsC-43 Neighborhood Traffic Control MeasuresC-44 Speed ZoningC-46 Speed Reduction EffortsC-47 Speed Zoning
– School ZonesC-48 Speed StrategiesC-49 Technology ApplicationsC-50 Impaired Driver StrategiesC-51 Inattention StrategiesC-52 Unbelted StrategiesC-53 Temporary Traffic Control ZonesC-55 Average Crash CostsC-56 Crash Reduction Benefit/ Cost (B/C) Ratio
WorksheetC-57 Typical Benefit/Cost Ratios for
Various Improvements
Traffic Safety Tool Box
C-1
Section C
Traffic Safety Fundamentals Handbook – 2015

C-2Traffic Safety Fundamentals Handbook – 2015
Then
Now STOP
ONE WAY
Highlights
THEN:
• Onlyafewsourcesofinformationabouttheeffectivenessofsafetyprojectswereavailable,nonewerecomprehensiveandtherewereconcernsaboutthestatis-ticalreliabilityoftheconclusionsbecauseoftheanalyticaltechniquesthatwereused.Mostoftheinformationavailablewasbasedonobservationsofalimitednumberoflocations.
NOW: • Betterandmorecomprehensivesetofreferencesareavailable:
• NCHRPSeries500Reports–ImplementationofAASHTO’sStrategicHighwaySafetyPlan:http://safety.transportation.org/guides.aspx
• FHWA’sCrashModificationFactorClearinghousewww.cmfclearinghouse.org
• HighwaySafetyManual:www.highwaysafetymanual.org
Traffic Safety Tool Box – Then vs. Now

C-3Traffic Safety Fundamentals Handbook – 2015
Engineering
• Trees in Hazardous Locations
• Head-On Crashes
• Unsignalized Inter-sections
• Run-Off-Road Crashes
• Pedestrians
• Horizontal Curves
• Signalized Intersec-tions
• Utility Poles
• Work Zones
Emergency Services
• Rural Emergency Medical Services
Highlights• TheNationalCooperativeHighwayResearchProgram
(NCHRP)developedaseriesofguidestoassiststateandlocalagenciesinreducingthenumberofseverecrashesinanumberoftargetedareas.
• Theguidescorrespondtothe22safetyemphasisareasoutlinedinAASHTO’sStrategicHighwaySafetyPlan(SHSP).
• Eachguideincludesadescriptionoftheproblemandalistofsuggestedstrategies/countermeasurestoaddresstheproblem.
• Thelistofstrategiesineachguidewasgeneratedbyanexpertpanelthatconsistedofbothacademicsandpractitionersinordertoprovideabalanceandafocusonfeasibility.
• Inadditiontodescribingeachstrategy,supplementalinforma-tionisprovided,includingthefollowing:
• Expectedeffectiveness(crashreductionfactors)
• Implementationcosts
• Challengestoimplementation
• Organizationalandpolicyissues
• DesignationofeachstrategyaseitherTried,Experimental,orProven
• http://safety.transportation.org/guides.aspx
Education
• Older Drivers
• Distracted/Fatigued Drivers
• Motorcycles
• Alcohol
Enforcement
• Aggressive Driving
• Unlicensed/Sus-pended/Revoked Drivers License
• Unbelted Occupants
• Heavy Trucks
Traffic Safety Tool Box – Then vs. Now
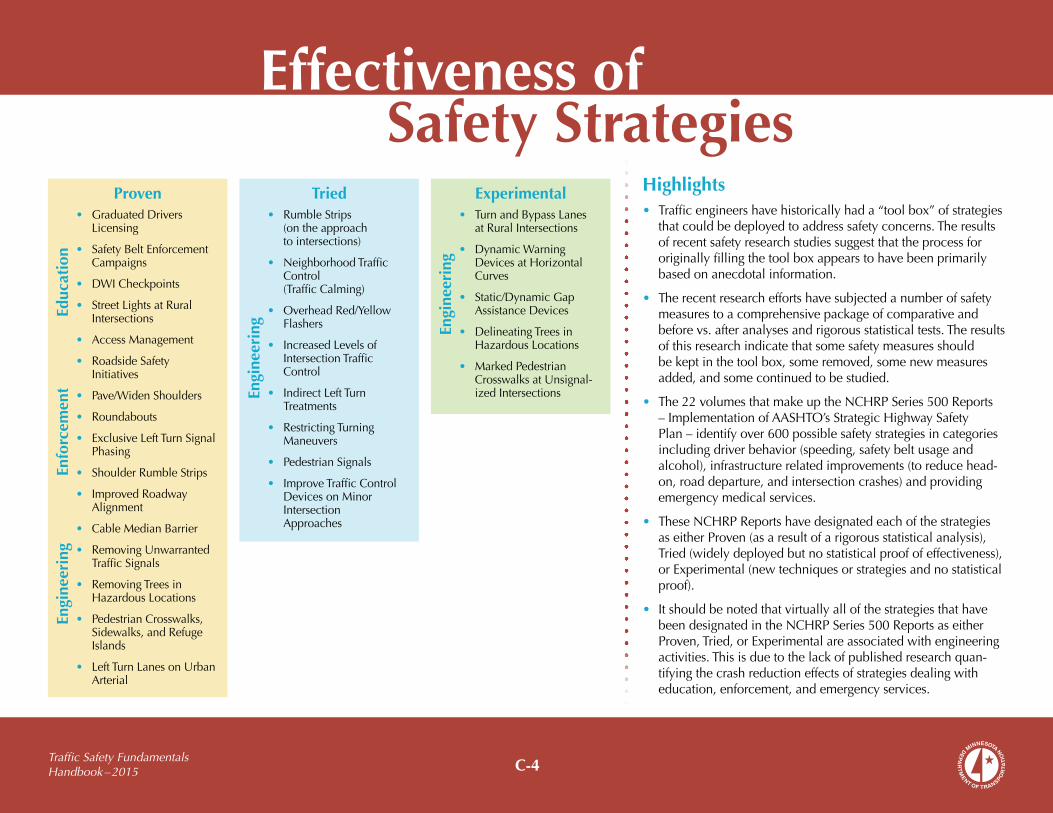
C-4Traffic Safety Fundamentals Handbook – 2015
Effectiveness of Safety Strategies
Highlights• Trafficengineershavehistoricallyhada“toolbox”ofstrategies
thatcouldbedeployedtoaddresssafetyconcerns.Theresultsofrecentsafetyresearchstudiessuggestthattheprocessfororiginallyfillingthetoolboxappearstohavebeenprimarilybasedonanecdotalinformation.
• Therecentresearcheffortshavesubjectedanumberofsafetymeasurestoacomprehensivepackageofcomparativeandbeforevs.afteranalysesandrigorousstatisticaltests.Theresultsofthisresearchindicatethatsomesafetymeasuresshouldbekeptinthetoolbox,someremoved,somenewmeasuresadded,andsomecontinuedtobestudied.
• The22volumesthatmakeuptheNCHRPSeries500Reports–ImplementationofAASHTO’sStrategicHighwaySafetyPlan–identifyover600possiblesafetystrategiesincategoriesincludingdriverbehavior(speeding,safetybeltusageandalcohol),infrastructurerelatedimprovements(toreducehead-on,roaddeparture,andintersectioncrashes)andprovidingemergencymedicalservices.
• TheseNCHRPReportshavedesignatedeachofthestrategiesaseitherProven(asaresultofarigorousstatisticalanalysis),Tried(widelydeployedbutnostatisticalproofofeffectiveness),orExperimental(newtechniquesorstrategiesandnostatisticalproof).
• ItshouldbenotedthatvirtuallyallofthestrategiesthathavebeendesignatedintheNCHRPSeries500ReportsaseitherProven,Tried,orExperimentalareassociatedwithengineeringactivities.Thisisduetothelackofpublishedresearchquan-tifyingthecrashreductioneffectsofstrategiesdealingwitheducation,enforcement,andemergencyservices.
Educ
atio
nEn
gine
erin
gEn
forc
emen
t
• GraduatedDriversLicensing
• SafetyBeltEnforcementCampaigns
• DWICheckpoints
• StreetLightsatRuralIntersections
• AccessManagement
• RoadsideSafetyInitiatives
• Pave/WidenShoulders
• Roundabouts
• ExclusiveLeftTurnSignalPhasing
• ShoulderRumbleStrips
• ImprovedRoadwayAlignment
• CableMedianBarrier
• RemovingUnwarrantedTrafficSignals
• RemovingTreesinHazardousLocations
• PedestrianCrosswalks,Sidewalks,andRefugeIslands
• LeftTurnLanesonUrbanArterial
• RumbleStrips(ontheapproachtointersections)
• NeighborhoodTrafficControl(TrafficCalming)
• OverheadRed/YellowFlashers
• IncreasedLevelsofIntersectionTrafficControl
• IndirectLeftTurnTreatments
• RestrictingTurningManeuvers
• PedestrianSignals
• ImproveTrafficControlDevicesonMinorIntersectionApproaches
Engi
neer
ing
• TurnandBypassLanesatRuralIntersections
• DynamicWarningDevicesatHorizontalCurves
• Static/DynamicGapAssistanceDevices
• DelineatingTreesinHazardousLocations
• MarkedPedestrianCrosswalksatUnsignal-izedIntersections
Engi
neer
ing
ExperimentalProven Tried

C-5Traffic Safety Fundamentals Handbook – 2015
Highlights• MnDOTcreatedavisualreferencetool,theHighway
SafetyImprovementProgram(HSIP)ImpactPyramid.
• TheHSIPImpactPyramidsuccinctlyshowstherelativebenefitsofvariousroadwaysafetymeasuresbygroupingindividualcountermeasuresinahierarchyoffour“impact”tiers.
• Thepyramidshowsthemostbeneficialstrategiesonthelargesttier(thepyramidbase/foundation)andnarrowstotheleastbeneficialitemsonthesmallesttier(thepinnacle).
• TheHSIPImpactPyramidreflectsMnDOT’spreferenceforsystemicHSIPimprovementsthatwillresultinthegreatestimpactstolocalroadwaysafety,whileacknowledgingthatreactivesite-specificmeasuresmustalsobeconsidered.
• Thistoolhashelpedlocalagenciesunderstandwhichimprovementsareeffective,selecteligibleprojects,andreducecrashpotentialonlocalroadways.
Safety Strategies – HSIP Impact Pyramid
FHWA, Noteworthy Practices: Addressing Safety on Locally Owned and Maintained Roads, A Domestic Scan, August 2010

C-6Traffic Safety Fundamentals Handbook – 2015
Highlights• Themostcomprehensivesourceofinformationabouttheeffectiveness
ofthevarietyofSafetyStrategiesisFHWA’sCrashModificationFactorsClearinghouse(www.cmfclearinghouse.org)
• TheuseofaCrashModificationFactor(CMF)allowstheestimationofthelong-termchangesinthenumberofcrashesthatcanbeexpectedasaresultofimplementingaparticularstrategyataparticularlocation.
• ACMFisamultiplicativefactor–forexampleaCMF=0.8suggeststhattheimplementationofastrategywillreducecrashesto80%ofthehistoricvalue.ACMFof1.1suggeststhatimplementationwillincreasecrashesto110%ofthehistoricvalue.
• TheCMFClearinghousereportsbothCMFsandCRFs(CrashReductionFactors).TheCRFrepresentstheexpectedcrashreductionandtheCMFisafactorusedtoestimatetheexpectednumberofcrashesfollowingimplementationofaspecificstrategy.
• Thedatapresentedintheclearinghouseisbasedonpublishedresearchandisupdatedasnewreportsareaddedtothedatabase.
Safety Strategies – CMF Clearinghouse

C-7Traffic Safety Fundamentals Handbook – 2015
Highlights• Theresultsreportedintheclearinghouseinclude:
• TheCMFandCRF
• Asubjectiveassessmentoftheresults(primarilybasedonthetypeofstatisticaltestingreportedintheresearch)
• IdentificationoftheCrashTypeandSeverity
• TheAreaType(ruralorurban)
• TheReference(sotheentirereportcanbereviewed)
• Thequalityassessmentinvolvesassigningbetweenzeroand5starstoeachCMFslisted,dependingonthetypeofstatisticaltestingconductedaspartoftheresearch.Aratingof5starsindicatesavigorousprogramoftestingandzerostarsindicatesnotesting.Theusercanselectthequalityofthereports,andthehighertherating,thehigherthelevelofconfidenceinthereportvalueoftheCMFs.
• ThistableofCMFsforEdgeLineRumbleStripsshows11values,rangingfroma43%reductionincrashestoa31%increase,withanaverageofa20%reduction.
Safety Strategies – CMF Clearinghouse

C-8Traffic Safety Fundamentals Handbook – 2015
Highlights• TheHighwaySafetyManual(HSM)waspublishedbyAASHTOin2010inordertoprovide
professionalswithanalyticaltoolsandtechniquestoquantifythepotentialeffectsoncrashesasaresultofdecisionsmadeinplanning,design,operations,andmaintenanceofhighwaysystems.
• Akeypointisthenotionthatthereisnosuchthingasabsolutesafety–therearerisksassociatedwithallelementsofthesystem.
• TheobjectiveoftheHSMistohelppractitionersunderstandandbalancesafetyimplicationsoftrade-offsmadewhenassessingthepossiblesocial,economic,andenvironmentaleffectsidentifiedduringprojectdevelopment.
• TheHSMfocusesonhowtoestimatecrashfrequencyforaparticularroadwaynetwork,facilityorsiteinthegivenperiod–measuresof“objective”safety.Incontrast,subjectivesafetyconcernstheperceptionsofhowsafedriversfeelwhileonthesystem.Itshouldbenotedthatwhatmanydriversfeelisbasedontheirintuitionastowhatissafe.However,researchhasshownthatmanyelementsoftrafficsafetyarecounterintuitive.
• Driversbelievethattrafficsignalsaresafetydevicesbutthedataisconclusivethatsignalizedinter-sectionshavemore(andmoresevere)crashesthanunsignalizedintersections(evenwhennormalizedforvolume).
• DriversbelievethatmostdriversStopatSTOPsignsbutdataindicatesthatfewerthan20%do.
• Driversbelievethatmostdriversobeythepostedspeedlimitandthatlowerspeedsresultinfewercrashes.Thedataindicatesthatmostdriverswillviolateapostedlimitifitdoesnotapproximatetheactual85thpercentilespeedandcrashesaremorecloselycorrelatedwithaccessdensitythanspeed.
• ThepredictivemethodintheHSMusesSafetyPerformanceFunctions(SPFs)whichareregressionequationstoestimatetheaveragecrashfrequencyforaspecificsiteasafunctionoftrafficvolume,crosssectionandavarietyofothercharacteristics.TheHSMencouragesuserstocalibratetheSPFsfortheirsystem.ThishasbeendoneonpartsoftheTrunkHighwaysystembutnotonanylocalroad-ways.WithoutcalibrationtheHSMsuggestslimitingtheanalysistotherelativedifferencebetweenalternativesandnotsite-specificcrashfrequencies.
Safety Strategies – Highway Safety Manual

C-9Traffic Safety Fundamentals Handbook – 2015
Highlights• Researchisunderwaytodocumentandquantifytherelationshipbetweenaroadway’sdesignfeatures
andsafetycharacteristics.Currentthinkingaboutthisrelationshipsuggeststherearetwodimensionsofsafety–NominalandSubstantive.
• Theconceptofnominalsafetyinvolvesacomparisonofthedimensionsofdesignfeaturestoanagency’sadopteddesigncriteria.Inthisconcept,aroadwayoraproposedsetofdesignfeaturesisconsideredtobenominallysafeifthefeaturesmeetorexceedtheminimumvalues.Nominalsafetyisanabsolute,thedesignfeatureseithermeettheminimumcriteriaortheydonot.
• Theconcernwiththisconceptisarecognitionthatthesafetyeffectsofincrementaldifferencesinagivendesigndimensionisexpectedtoproduceincrementalandnotabsolutechangeinsafety.Thenominalsafetyconceptislimitedinthatitdoesnotaddresstheactualorexpectedsafetyperformance.
• Substantivesafetyisdefinedastheexpectedlong-termsafetyperformance(crashfrequency,type,andseverity).
• TheHSMquantifiesthesesubstantivesafetyrelationshipswheretheyareknown.Forexample,agenciesaroundthecountryhaveworkedforyearstoachieve12-footlanewidthsalongruralroad-waysasawaytooptimizesafetyperformance.However,currentresearchindicatesthattheactualdifferenceincrashfrequencyis5%atvolumesgreaterthan2,000vehiclesperdayand1%atvolumesunder400vehiclesperday.
Safety Strategies – Highway Safety Manual
NCHRP Report 480 Transportation Research Board, 2002 FHWA – SA-07-011, Mitigation Strategies for Design Exceptions, 2007

C-10Traffic Safety Fundamentals Handbook – 2015
Highlights• Recentresearchhasidentifiedarelationshipbetweentrafficsafetyandtraffic
operations,withcertaintypesofroadwaysexperiencinghighernumbersofcrashesaslevelsofcongestionincreases.
• TheHighwayCapacityManual(HCM)providesanalyticaltechniquestoassistengineersandplannersdocumentthequalityofthetrafficoperation(thelevelofcongestion)basedonsetofvariables,including;trafficcharacteristics,roadwaycharacteristicsandintersectioncontrols.
• Thecurrentedition(2010)isthefirstHCMtoprovideamultimodalapproachtotheanalysisandevaluationofurbanstreetsfromthepointofviewofdrivers,transit,bicyclistsandpedestrians.Thiseditionalsoprovidestoolsandgeneralizedservicevolumestoassistinsizingfuturefacilities.
• TheFederalHighwayAdministrationhasdevelopedanewtool–TheCapacityAnalysisforPlanningofJunctions(CAP-X)–thatcanbeusedtoevaluateavarietyoftypesofinnovativejunctiondesigns(eightintersections,fiveinterchanges,threeroundaboutsandtwomini-roundabouts).
• http://www.fhwa.dot.gov/software/research/operations/cap-x/
• Trafficoperationsanalysestosupportdesignlevelstudiesarebasedonpeaktrafficflows.However,anunder-standingoftherelationshipbetweentrafficvolumeandroadwaycross-sectioncanaddvaluetosystemplanningefforts.Toaidtheseplanningstudies,effortshavebeenmadetodevelopestimatesofthelevelofcongestionacrossgeneralizedroadwaytypesbasedondailytrafficvolumesandassumedvaluesfordetailssuchasthefractionofpeakhourtraffic,directionaldistribution,pedestriansandheavyvehicles.
Safety Strategies – Highway Capacity Manual
Note:Approximatevaluesbasedonhighlydependentassumptions.Donotuseforoperationalanalysesorfinaldesign.
Capacity Assumptions*
ThroughOnlyLane 800vphLT/THLane 600vphTH/RTLane 700vphTH/RT/FTLanes 600vphTurnLanes 350vph
*Assumes1/4milesignalspacing.Forlessthan1/4milesignalspacing,roadwaybecomestoovolatiletodetermineLOSbyADT.
Peak Hour Percentages
ArterialRoadway 10%
DirectionalOrientation 60/40
Planning Level Estimate of Level of Service (LOS)

C-11Traffic Safety Fundamentals Handbook – 2015
Highlights• ThisguideisabasicreferencetoassistStateHighwaySafetyOffices
inselectingeffective,evidence-basedcountermeasuresforbehavioraltrafficsafetyproblemsareasincluding:
• Alcohol-impairedandDruggedDriving
• SeatBeltsandChildRestraints
• AggressiveDrivingandSpeeding
• DistractedandDrowsyDriving
• MotorcycleSafety
• YoungDrivers
• OlderDrivers
• Pedestrians
• Bicycles
• Theguidecontainsinformationoneachproblemareaincludingabriefoverviewoftheproblemarea’ssizeandcharacteristics,themaincountermeasurestrategies,alongwithatablethatlistsspecificcountermeasuresandsummarizestheireffectiveness,costs,use,andimplementationtime.
Safety Strategies – Countermeasures that Work
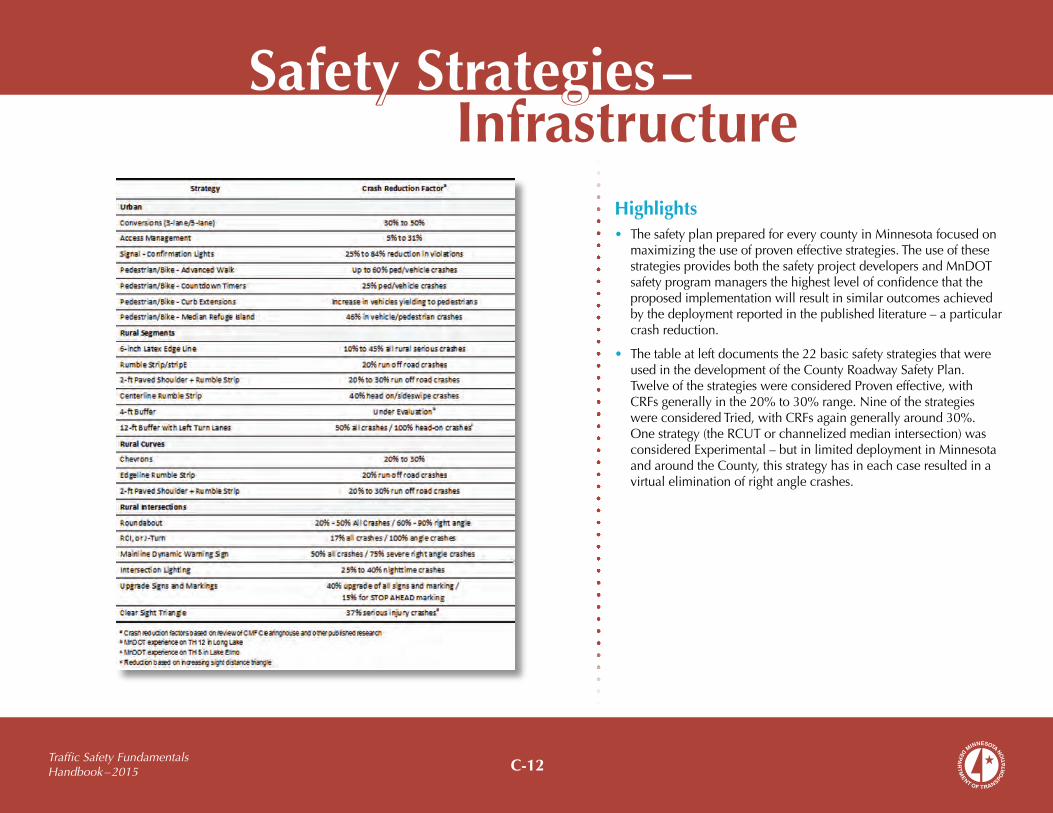
C-12Traffic Safety Fundamentals Handbook – 2015
Highlights• ThesafetyplanpreparedforeverycountyinMinnesotafocusedon
maximizingtheuseofproveneffectivestrategies.TheuseofthesestrategiesprovidesboththesafetyprojectdevelopersandMnDOTsafetyprogrammanagersthehighestlevelofconfidencethattheproposedimplementationwillresultinsimilaroutcomesachievedbythedeploymentreportedinthepublishedliterature–aparticularcrashreduction.
• Thetableatleftdocumentsthe22basicsafetystrategiesthatwereusedinthedevelopmentoftheCountyRoadwaySafetyPlan.TwelveofthestrategieswereconsideredProveneffective,withCRFsgenerallyinthe20%to30%range.NineofthestrategieswereconsideredTried,withCRFsagaingenerallyaround30%.Onestrategy(theRCUTorchannelizedmedianintersection)wasconsideredExperimental–butinlimiteddeploymentinMinnesotaandaroundtheCounty,thisstrategyhasineachcaseresultedinavirtualeliminationofrightanglecrashes.
Safety Strategies – Infrastructure

C-13Traffic Safety Fundamentals Handbook – 2015
Highlights• Thetablesatleftsummarizethebehaviorstrategiesfrom
Countermeasures that Work forbehavioralfocusareas.
• Cost to implement:
• $$$:requiresextensivenewfacilities,staff,equipment,orpublicity,ormakesheavydemandsoncurrentresources
• $$:requiressomeadditionalstafftime,equipment,facilities,and/orpublicity
• $:canbeimplementedwithcurrentstaff,perhapswithtraining;limitedcostsforequipment,facilities,andpublicity
• Theseestimatesdonotincludethecostsofenactinglegislationorestablishingpolicies.
• Use:
• High:morethantwo-thirdsoftheStates,orasubstantialmajorityofcommunities
• Medium:betweenone-thirdandtwo-thirdsofStatesorcommunities
• Low:lessthanone-thirdoftheStatesorcommunities
• Unknown:datanotavailable
• Time to implement:
• Long:morethanoneyear
• Medium:morethanthreemonthsbutlessthanoneyear
• Short:threemonthsorless
• Theseestimatesdonotincludethetimerequiredtoenactlegislationorestablishpolicies.
Safety Strategies – Behavior
Alc
ohol
Unb
elte
dIn
atte
ntiv
eSp
eed
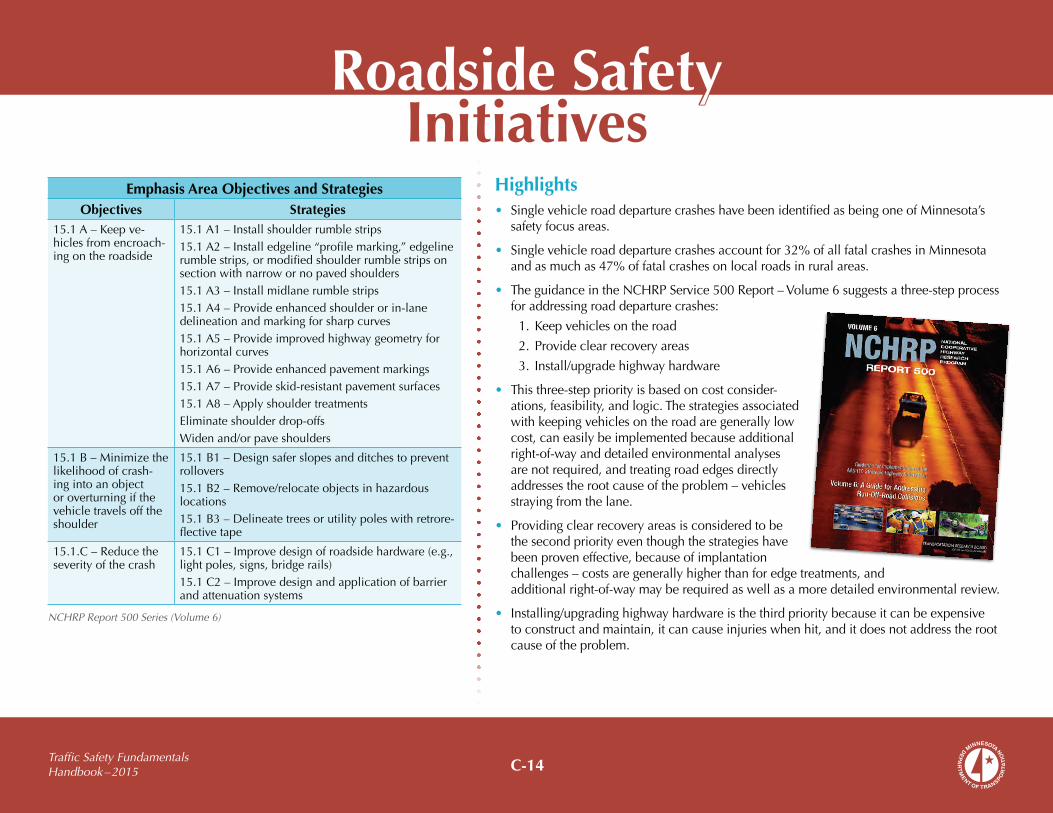
C-14Traffic Safety Fundamentals Handbook – 2015
Roadside SafetyInitiatives
Highlights• SinglevehicleroaddeparturecrasheshavebeenidentifiedasbeingoneofMinnesota’s
safetyfocusareas.
• Singlevehicleroaddeparturecrashesaccountfor32%ofallfatalcrashesinMinnesotaandasmuchas47%offatalcrashesonlocalroadsinruralareas.
• TheguidanceintheNCHRPService500Report–Volume6suggestsathree-stepprocessforaddressingroaddeparturecrashes:
1.Keepvehiclesontheroad
2.Provideclearrecoveryareas
3. Install/upgradehighwayhardware
• Thisthree-steppriorityisbasedoncostconsider-ations,feasibility,andlogic.Thestrategiesassociatedwithkeepingvehiclesontheroadaregenerallylowcost,caneasilybeimplementedbecauseadditionalright-of-wayanddetailedenvironmentalanalysesarenotrequired,andtreatingroadedgesdirectlyaddressestherootcauseoftheproblem–vehiclesstrayingfromthelane.
• Providingclearrecoveryareasisconsideredtobethesecondpriorityeventhoughthestrategieshavebeenproveneffective,becauseofimplantationchallenges–costsaregenerallyhigherthanforedgetreatments,andadditionalright-of-waymayberequiredaswellasamoredetailedenvironmentalreview.
• Installing/upgradinghighwayhardwareisthethirdprioritybecauseitcanbeexpensivetoconstructandmaintain,itcancauseinjurieswhenhit,anditdoesnotaddresstherootcauseoftheproblem.
Emphasis Area Objectives and StrategiesObjectives Strategies
15.1A–Keepve-hiclesfromencroach-ingontheroadside
15.1A1–Installshoulderrumblestrips15.1A2–Installedgeline“profilemarking,”edgelinerumblestrips,ormodifiedshoulderrumblestripsonsectionwithnarrowornopavedshoulders15.1A3–Installmidlanerumblestrips15.1A4–Provideenhancedshoulderorin-lanedelineationandmarkingforsharpcurves15.1A5–Provideimprovedhighwaygeometryforhorizontalcurves15.1A6–Provideenhancedpavementmarkings15.1A7–Provideskid-resistantpavementsurfaces15.1A8–ApplyshouldertreatmentsEliminateshoulderdrop-offsWidenand/orpaveshoulders
15.1B–Minimizethelikelihoodofcrash-ingintoanobjectoroverturningifthevehicletravelsofftheshoulder
15.1B1–Designsaferslopesandditchestopreventrollovers15.1B2–Remove/relocateobjectsinhazardouslocations15.1B3–Delineatetreesorutilitypoleswithretrore-flectivetape
15.1.C–Reducetheseverityofthecrash
15.1C1–Improvedesignofroadsidehardware(e.g.,lightpoles,signs,bridgerails)15.1C2–Improvedesignandapplicationofbarrierandattenuationsystems
NCHRP Report 500 Series (Volume 6)

C-15Traffic Safety Fundamentals Handbook – 2015
Highlights• Typicaledgetreatmentsincludeshoulder/edgeline
rumblestrips,enhancedpavementmarkings,andeliminatingshoulderdrop-offs.
• Implementationcostsvaryfromlowcost(safetyedge)toseveralthousanddollarspermileforrumblestrips/stripEsandembeddedwetreflectivemarkings.
• Nationalsafetystudieshavedocumentedcrashreductionsintherangeof20%to50%forroaddeparturecrashes.
• Additionalbenefitshavebeenobservedonprojectswhereedgelineshavebeenpaintedovertheedgelinerumblestrips–nighttimevisibilityinwetpave-mentconditionswasimproved(thereflectivebeadsappliedtothenearlyverticalfaceoftherumblestripremainabovethefilmofwateronthepavementsurface)andthelifeofthepavementmarkingwasextended(snowplowscannotscrapeawaythebeadsontheverticalfaces).
• St.LouisCountyhasinstalled114milesofrumblestripsand82milesofrumblestripEsandhasdocumentedasubstantialreductioninpavementmarkingmaintenancecosts.
Without Safety Edge
With Safety Edge
Paved Shoulder and Rumble Strip
Rumble StripE
Roadside Safety Initiatives – Edge Treatments

C-16Traffic Safety Fundamentals Handbook – 2015
Highlights• Theinstallationofedgerumblestripshasproventobeeffectiveatreducinglanedeparturecrashes,
themostfrequenttypeinGreaterMinnesota.
• Theyhavegeneratedcomplaintsaboutnoise,bicyclesafety,andaccommodatingfarmequipment.
• MnDOThasconductednoisestudiesthatindicaterumbleswillincreasenoiselevels,butnotbeyondestablishedthresholds.
• Toreducethechanceofbicycleshavingtotraversearumblestrip,MnDOThasadoptedtheuseofaninnovativedesignthatprovides12feetofsmoothpavementedgebetween48footsectionswithgrooves.Thisdesignprovidesbicyclistswiththeopportunitytomovefromthetravellanetotherefugeoftheshoulderwhenbeingovertakenbyavehiclewithouthavingtotraversetherumbles.
• Anotherstrategyforreducingthenumberofcomplaintsaboutnoiseistoconsiderboththevolumeoftrafficandthedensityofadjacentresidentialdevelopmentaspartofasystemicriskassessment.FocusingtheinstallationofedgerumblesonroadwayswithfewwidelyspacedhomeshasbeenusedsuccessfullybyanumberofcountiesinMinnesota.
• Ifaroadwaywithahighdensityofresidentialdevelopmentisidentifiedasapriorityforlanedeparturecrashes,considerationshouldbegiventosubstitutinganembeddedwetreflectiveedgelinefortheedgerumble.Theembeddedwetreflectiveedgelinewillprovideenhancednighttimewetpavementedgedelineationwithoutconcernsfortrafficnoise.Theonlydisadvantageoftheembeddedwetreflectivestrategyaresomewhathighcostandtheeffectonlanedeparturecrashesisnotyetknown.
• Anotheralternativetoaddressnoiseconcernsassociatedwithground-inrumblestripsiscurrentlybeinginvestigatedandinvolvestheuseofasinusoidalprofile.Initialtestsofthe“quiet”rumbleindicatetheyproducenoiselevelsintherangeof3to6decibelsbelowtheground-inrumblestrips.
Roadside Safety Initiatives – Edge Treatments

C-17Traffic Safety Fundamentals Handbook – 2015
Highlights• Anumberofpreviouslypublishedresearchreportshaveidentifiedhorizontalcurves
asat-riskelementsorruralroadssystems,however,thedegreeofriskwasnotquantified.
• ArecentreportpreparedbytheTexasTransportationInstitute(TTI)(FHWA/X-07/0-5439-1)relatedactualcrashratesonruralroadstotheradiusofcurvature.Theresultsofthisresearchindicatethatthecrashrateoncurveswithradiigreaterthan2,500feetisapproximatelyequaltothecrashrateontangentsections.
• Oncurveswithradiiof1,000feet,thecrashrateistwicetherateontangentsandcurves;curveswithradiiof500feetareequaltothecrashrateontangentsections.
• Theanalysisofapproximately19,000horizontalcurvesalongruralcountyhighwaysinMinnesotafoundresultssimilartotheTTIresearch.Curveswithradiibetween500feetand1,200feetweremostat-risk.
• Curveswithradiiwithinthis500-to1,200-footrangeaccountedforapproximately50%ofcurvesbut70%ofsevereroaddeparturecrashes.Thesecurvesalsohadthehighestdensityofseverecrashes.
• Otherkeyfindingsinclude:
• Eventhough50%ofallsevereroaddeparturecrashesalongruralcountyhighwaysoccurinahorizontalcurve,95%ofthecurveshadNOseverecrashesduringa5-yearstudyperiod.
• 2%ofcurveshadONEseverecrash.
• ThereareNO“DeadMan’sCurve”–nocurveaveragedoneseverecrashperyear.
• Theaveragecrashdensitywas0.005severecrashes/curve/year.
• TheanalysisofhorizontalcurvesalongruralcountyhighwaysinMinnesotaidentifiedmorethan10,000curvesashighprioritycandidatesforsafetyimprovementbasedonthepresenceofparticularroadwayandtrafficcharacteristics.Thesuggestedsafetyimprovementateachofthesehighprioritycurvesinvolvedtheinstallationofchevronsandedgelinerumblestripsthathadanaveragecostofslightlymorethan$7,000percurve.
Roadside Safety Initiatives – Horizontal Curves
FHWA-X-07-0-5439-1
Minnesota County Road Safety Plans, Data 2007-2011

C-18Traffic Safety Fundamentals Handbook – 2015
Highlights• InruralMinnesotathelocalroadsystemisagridof
north/southandeast/westsectionlineroads.Thisgridsystemresultsinnumerouslocationswherelocalroadsintersectwithpavedcountyroadsandstatehighwaysinhorizontalcurves.
• TheanalysisofhorizontalcurvesthatwasconductedaspartoftheCountyRoadSafetyPlansfoundthatcurvesthatcontainedanintersectionhadahighercrashfrequencythancomparablecurveswithoutanintersection.
• Thepresenceofanintersectioninacurvealsoproducesaconditioncalleda“visualtrap”causingadriveronthemajorroadtoseearoadwaycontinueonthetangentwhenthemajorroadactuallyturns.Theanalysisfoundthatcurveswith“visualtraps”haveahigherfrequencyofcrashesthancomparablecurveswithout.
Roadside Safety Initiatives – Horizontal Curves
• Theanalysisofruralintersectionsfoundthatinter-sectionsincurveshadahigherfrequencyofcrashesthancomparableintersectionslocatedontangentsections.Itappearsthatcloselyspacedintersectionwithskewedapproachestothemajorroadincreasetheriskforintersectioncrashes(seefiguretotheleft).Thepreferredsolutionforimprovingthemultipleintersectioncurveinvolvedreconstructingtoprovideasingle“T”intersectionwheretheminorlegisper-pendiculartothemajorroad.
• Beyondtheuseoftypicallowcostimprovements,suchaschevronsandedgelinerumblestrips,addi-tionaldesignstrategiescouldbeprovidingstrategi-callyplacedvegetationtoaddressthe“visualtrap”issueandpossiblyreplacingthesinglehorizontalcurvewithtwocurvesseparatedbyatangentsection.
• Thepreferredsolution,reconstructingtheroadways,isnotalow-costsolutionandwouldlikelynotbeacandidateforsafetyfunding.
Example of a Visual Trap
Visual Trap
Visual Trap Solution

C-19Traffic Safety Fundamentals Handbook – 2015
Highlights• Effortstoimproveclearzonesareusuallypartofreconstructionprojectsbecauseofhigher
costsassociatedwithflatteningslopesandreconstructingditches.Otherroadsideelementstypicallyaddressedasanintegralpartofreconstructioninclude:treeremoval,flatteningslopesatdrivewaysandfieldentrances,removingunnecessaryentrances,relocatingutilitypoles(iftheright-of-wayiswideenough)andupgradingroadsidehardware.
• Therecommendedclearzonedistanceisafunctionofspeed,slope,volume,andhorizontalcurvature.
• Generally,higherspeeds,steeperfillslopes,highervolumes,andlocationsalongtheoutsidesofhorizontalcurvesrequirelargerclearzones.
• Theconceptofprovidingclearrecoveryareasisprimarilyintendedforruralroadways.However,theconceptcanbeappliedtosuburbanorurbanroadwaysifroaddeparturecrashesareaconcern.
MnDOT Road Design Manual
Roadside Safety Initiatives –Slope Design/Clear Recovery Areas
Slope Design

C-20Traffic Safety Fundamentals Handbook – 2015
Highlights• Upgradingroadsidehardwareistypicallyapartofongoinghighwaymaintenanceand
reconstructionprograms.Projectstoupgradetrafficsignsshouldaddresssignposts.Allsignpostslocatedintheclearzoneonroadswithspeedlimitsgreaterthan50milesperhourarerequiredtohaveabreakawaydesignorbeprotectedbyabarrierorcrashcushion.Guard-railsaretypicallyinstalledorupgradedaspartofhighwayreconstructionprojects.Itshouldbenotedthattheuseofguardrailsaretypicallyreservedforhighervolumeroadways(over400vehiclesperday)duetothehighcostofinstallationplusongoingmaintenance.
• Allhighwayhardwaremustmeettherequirementsin2009theAASHTOManualforAssessingSafetyHardware(MASH).
• Typicaltreatmentsandtheirinstallationcostsincludethefollowing:
• Impactattenuator=$20,000
• Guardrailterminal=$1,500
• Guardrailtransition=$1,000
• CableorW-BeamGuardrail=$75,000-$150,000permile
• Itisconsideredabestpracticetoupgraderoadsidehardwareasapartofreconstructionprojectsbecauseofsafetybenefitsassociatedwithreducingtheseverityofcollisionswithstructuresthatagenciesinstallalongroadedges,includingsignposts,mailboxsupports,andguardrails.However,itshouldbenotedthateffortsfocusedononlyupgradinghardware(asopposedtoalsoimprovingroadedgesandclearzones),whilenominallyaddressingsafetywouldbeexpectedtoprovidealimitedincreaseinsubstantivesafetybecauseoftherelativelyfewreportedcrasheswiththesetypesofstructures.
Roadside Safety Initiatives – Upgrade Roadside Hardware
Exampleimplementationscompliant(above)andnotcompliant(below)withcurrentstandards(NCHRP350)
Compliant
Noncompliant

C-21Traffic Safety Fundamentals Handbook – 2015
Effectiveness of Roadside Safety Initiatives
Highlights• Anestimateofthesafetyimplicationsbyevaluatingtwovery
similarsegmentsoftwo-laneruraltrunkhighwaysinnorthernMinnesota:TH6andTH38.
• Bothroadshavethefollowingsimilarcharacteristics:• Havelowvolumes• Servesimilarfunctions(recreationalandlogging)• TraversetheChippewaNationalForest• Havescenicqualities
• In2008,TH6hadbeenreconstructedandTH38hadnot.(Note:ThissegmentofTH38hasrecentlybeenreconstructedbutaBeforevs.AfterStudyhasnotbeencompleted.)
• ThedifferencesincrashcharacteristicsTH38hadaresubstantial:• Morethantwiceasmanycrashes• Morethantwiceasmanyinjuries• Acrashratemorethantwicetheaveragefortwo-lanerural
roads(and30%greaterthanthecriticalrate)• AlmostfourtimesasmanySVRDcrashes(andmorethan
threetheaverageforsimilarroads).• Tentimesasmanytreehits• Morethantwiceasmanynighttimecrashes
• TH38hassincebeenreconstructedandthecrashreductionhasbeensubstantial–almost80%reductioninthenumberandrateofcrashes.TH38nowhassafetycharacteristicsbelowthenormsforsimilarroadways.
• Duringthesametimeperiod,TH6alsoexperiencedacrashreductionconsistentwithstatewidetrendsandcontinuestooperatewithinthetypicalrangefortwo-laneruralroadways.
PDO PropertyDamageOnlyVPD VehiclesPerDay
Minnesota Crash Mapping Analysis Tool
NOW THEN NOW11.2 11.2 Length (Miles) 11.2 11.2
9 23 Total Crashes (5 Years) 51 10
3 11 PDO Crashes 25 5
5 12 Injury Crashes 26 5
1 0 Fatal Crashes 0 0
575 1,100 Volume (VPD) 1,100 1,200
11.75 22.48 MVM 22.48 24.53
0.8 1.0 Crash Rates (Crashes/MVM) 2.3 0.4
1.5 1.5 Severity Rate 4.1 0.7
1.0 1.3 Critical Crash Rates 1.3 0.9
3 (33%) 10 (43%) SVRD Crashes 37 (73%) 8 (80%)
2 3 Hit Trees 30 3
0 8 (35%) Passing Crashes 3 (6%) 0
4 2 Angle Crashes 4 1
2 6 Deer Hits 1 1
0 10 (43%) Night 21 (41%) 4 (40%)
MVM MillionVehicleMilesSVRD SingleVehicleRoadDeparture
TH 6 TH 38

C-22Traffic Safety Fundamentals Handbook – 2015
Highlights• Head-oncrashesaccountforapproximately20%ofthetrafficfatalities
inMinnesota.
• Addressinghead-oncrashesisoneofMinnesota’scriticalsafetyfocusareas.
• Minnesotaaveragesapproximately120fatalhead-oncrashesperyear,97%areNOTpassingrelatedontwo-lanefacilities,63%areonthestatesystem,andabout75%areinruralareas.
• Centerlinerumblestripshavebeenfoundtoreducehead-oncrashesalongtwo-laneroads–datafrom98sitesinsevenstates(includingMin-nesota)indicatedsignificantreductionsforinjurycrashes(15%)aswellasforhead-onandopposingsideswipeinjurycrashes(25%).
• Additionalstrategiesfortwo-laneroadsincludeconductingfieldsurveystoconfirmthatdesignatedpassingzonesmeetcurrentguidelinesforsightdistanceandtheuseofthermoplasticmarkingswherepassingisnotpermitted.
• Theconstructionof“PassingLanes”alongtwo-laneroadshasbeenfoundtobeaconvenienceformotorists(providingopportunitiestopassslowermovingvehicles).However,thereisnoevidencethatthepassinglaneshavereducedhead-oncrashes.
• Anumberofstateshavebeguntoaddresscross-medianhead-oncrashesondividedhighwaysbyinstallingcablemedianbarriers.Reportedreductionsinseverehead-oncrasheshaverangedfrom70%to95%.
• MnDOThasinstalledapproximately450milesofcablebarrier,withplanstoinstallanadditional80miles.ApreliminaryanalysisofMnDOT’sfirstcablemedianbarrierinstallation(alongI-94inMapleGrove)founda100%reductioninfatalitiesanda90%reductioninoverallcrashseverity.
NCHRP 500 Series (Volume 4)
Head–On Crashes on a Two–Lane Rural Highway in Delaware
Before and After Use of Centerline Rumble Stripe
SeverityofCrash
Head–OnCrashFrequency
36MonthsBefore 24MonthsAfter
Fatal 6 0
Injury 14 12
DamageOnly 19 6
Total 39 18
CrashesperMonth 1.1 0.76
AASHTO, “Driving Down Lane Departure Crashes”, April 2008
Fatal Head-On Crashes on Rural Two-Lane Two-Way High-ways in Minnesota, Derek Leuer, MnDOT, January 2015
Addressing Head-On Collisions
Interstate Cross-Median Fatalities
I-44 Cross-Median Fatalities

C-23Traffic Safety Fundamentals Handbook – 2015
Highlights• Arecentlocalstudyoneffectsofcenterlinerumble
stripsonover200milesofruralroadwaysinMinne-sotafound40%to76%reductioninencroachmentsanda73%lowerfatalandseverecrashratesand42%lowercrashrateoverallthanlocationswithoutcenterlinerumbles.
• AnadditionalstudytodetermineifcenterlinerumblestripscontributetomotorcyclecrashesornegativelyaffectmotorcycleriderbehaviorwasconductedbyMnDOTin2008.Thestudyanalyzedcrashdataandobservationsfromaclosed-circuitcoursewith32ridersofvariousmotorcycletypes.
• Theclosed-circuitcourseobservationsshowednosteering,braking,orthrottleadjustmentduringstripcrossingsbytheriders.Inpost-circuitinterviews,noriderdescribedthestripsasahazard.
• Outofover9,000motorcyclecrashesreviewed,only29occurredatlocationswithrumblespresent.Noneofthecrashreportsmentionrumblestripsasafactor.
Addressing Head-On Collisions
Safety Effects of Centerline Rumble Strips in Minnesota(www.lrrb.org/media/reports/200844ts.pdf)
Effects of Centerline Rumble on Motorcycles: NCHRP 641 226(www.lrrb.org/media/reports/200807TS.pdf)

C-24Traffic Safety Fundamentals Handbook – 2015
Intersection Safety StrategiesObjectives Strategies
Relative Cost to Implement and Operate
EffectivenessTypical Timeframe for Implementation
A-Improveaccessmanagement
A1-Implementintersectionordrivewayclosures,relocations,andturningrestrictionsusingsigningorbyprovidingchannelization.
LowtoModerate Tried Medium(1-2yrs)
B-Reducethefrequencyandseverityofinter-sectionconflictsthroughgeometricdesignimprovements
B1-Provideleft-turnlanesatintersections;providesufficientlengthtoaccommodatedecelerationandqueuing;anduseoffsetturnlanestoprovidebettervisibilityifneeded.
ModeratetoHigh
Proven Medium(1-2yrs)
B2-ProvidebypasslanesonshouldersatT-intersections. Low Tried Short(<1yr)
B3-Provideright-turnlanesatintersections;providesufficientlengthtoaccommodatedecelerationandqueuing;useoffsetturnlanestoprovidebettervisibilityifneeded;andprovideright-turnaccelerationlanes.
ModeratetoHigh
Proven Medium(1-2yrs)
B4-Realignintersectionapproachestoreduceoreliminateinter-sectionskew.
High Proven Medium(1-2yrs)
C-Improvedriverawarenessofintersectionsasviewedfromtheinter-sectionapproach.
C1-Improvevisibilityofintersectionsbyprovidingenhancedsigning.Thismayincludeinstallinglargerregulatory,warning,andguidesigningandsupplementarystopsigns.
Low Tried Short(<1yr)
C2-Improvevisibilityofintersectionsbyprovidinglighting(installorenhance)orredflashingbeaconsmountedonstopsigns.
LowtoModerate Proven Medium(1-2yrs)
C3-Improvevisibilityofintersectionsbyprovidingenhancedpave-mentmarkings,suchasaddingorwideningstopbaronminor-roadapproaches,supplementarymessages(i.e.,STOPAHEAD).
Low Tried Short(<1yr)
C4-Improvevisibilityoftrafficsignalsusingoverheadmastarmsandlargerlenses.
Moderate Tried Short(<1yr)
C5-Deploymainlinedynamicflashingbeaconstowarndriversofenteringtraffic.
Low Experimental Short(<1yr)
D-Improvesightdistanceatintersections.
D1-Clearsighttrianglesapproachestointersections;inadditiontoeliminatingobjectsintheroadside,thismayalsoincludeeliminatingparkingthatrestrictssightdistance.
LowtoModerate Tried Short(<1yr)
E-Chooseappropriateintersectiontrafficcontroltominimizecrashfrequencyandseverity
E1-Provideall-waystopcontrolatappropriateintersections. Low Proven Short(<1yr)
E2-Provideroundaboutsatappropriateintersections. High Proven Long(>2yrs)
F-Improvedrivercompliancewithtrafficcontroldevicesandtrafficlawsatintersections
F1-Enhanceenforcementofred-lightrunningviolationsusingauto-matedenforcement(cameras)oraddingconfirmationlightsonthebackofsignalstoassisttraditionalenforcementmethods.
Moderate Proven/Tried Medium(1-2yrs)
G-Reducefrequencyandseverityofintersectionconflictsthroughtrafficsignalcontrolandopera-tionalimprovements.
G1-Employmultiphasesignaloperation,signalcoordination,emer-gencyvehiclepreemptionoptimizeclearanceintervals;implementdilemmazoneprotection;onhighspeedroadways,installadvancewarningflasherstoinformdriverofneedtostop;andretimeadjacentsignalstocreategapsatstop-controlledintersections.
LowtoModerate Proven/Tried Medium(1-2yrs)
MnDOT Strategic Highway Safety Plan, 2014
Highlights • AddressingcrashesatintersectionsisoneofMinnesota’ssafety
focusareas.
• Intersection-relatedcrashesaccountformorethan50%ofallcrashesandaboutone-thirdoffatalcrashes.
• Approximatelytwo-thirdsoffatalintersectioncrashesoccurinGreaterMinnesotaandslightlymorethanone-halfareonthelocalsystem.
• STOP-controlledintersectionsaverageslightlylessthanonecrashperyearandsignalizedintersectionsaveragealmostsevencrashesperyear.
• Thehigh-prioritysafetystrategiesforunsignalizedintersectionsinvolvemanagingaccessandconflicts,enhancingsignsandmarkings,improvingintersectionsightdistance,andprovidingroundabouts.
• Thehigh-prioritystrategiesforsignalizedintersectionsincludereducingredlightviolationsandoptimizingsignaloperations.
• Onthestatesystem,about55%ofintersectioncrashesoccuratlocationswithSTOPcontrol.However,thereareseventimesasmanySTOP-controlledascomparedtosignal-controlledintersections.
• Thedensityofseverecrashes(Fatals&AInjuries)isfourtimeshigheratsignalizedintersectionsthanatSTOP-controlledintersections.
• MnDOThasdevelopedatooltoassisthighwayagencieswithchoicesaboutintersectioncontrol.TheIntersectionControlEvaluation(ICE)guidelinesprovidesdirectionsandrecom-mendationsforanobjectiveanalysisofsafetyandtrafficoperationsperformancemeasuresforavarietyofalternativecontrolstrategieswiththegoalofhelpingagenciesdeterminetheoptimalintersectioncontrolforagivensetofroadwayandtrafficconditions.
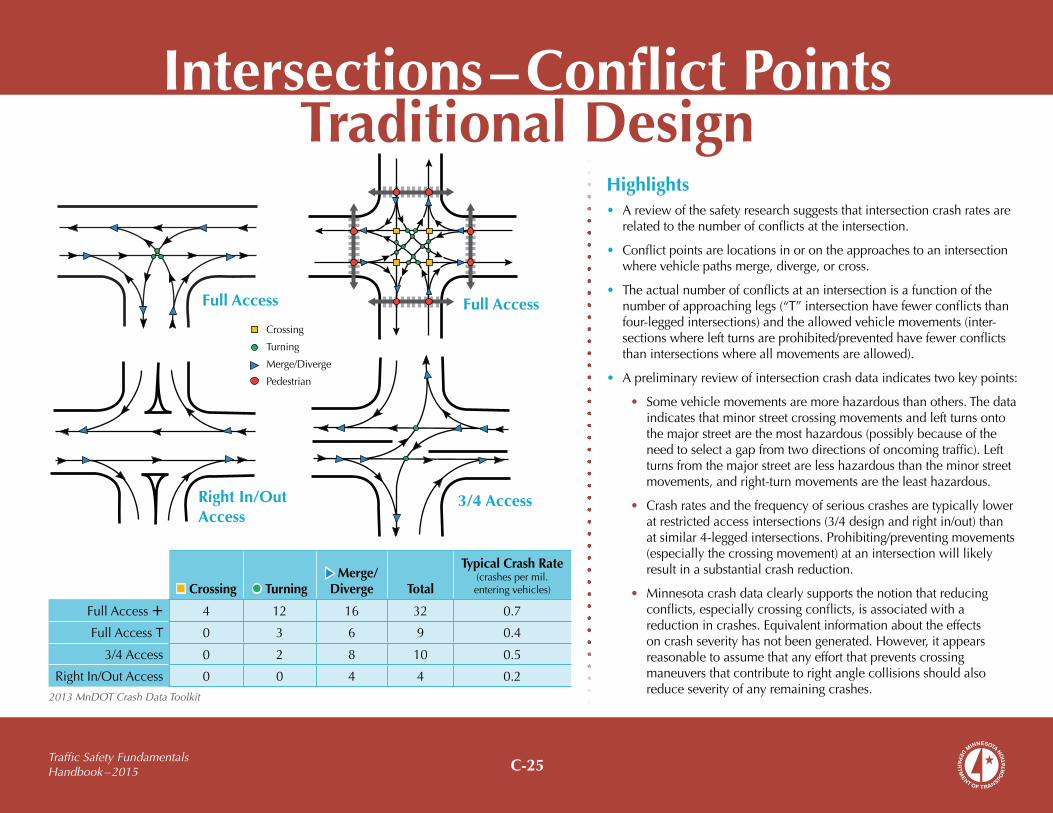
C-25Traffic Safety Fundamentals Handbook – 2015
Intersections – Conflict PointsTraditional Design
Highlights • Areviewofthesafetyresearchsuggeststhatintersectioncrashratesare
relatedtothenumberofconflictsattheintersection.
• Conflictpointsarelocationsinorontheapproachestoanintersectionwherevehiclepathsmerge,diverge,orcross.
• Theactualnumberofconflictsatanintersectionisafunctionofthenumberofapproachinglegs(“T”intersectionhavefewerconflictsthanfour-leggedintersections)andtheallowedvehiclemovements(inter-sectionswhereleftturnsareprohibited/preventedhavefewerconflictsthanintersectionswhereallmovementsareallowed).
• Apreliminaryreviewofintersectioncrashdataindicatestwokeypoints:
• Somevehiclemovementsaremorehazardousthanothers.Thedataindicatesthatminorstreetcrossingmovementsandleftturnsontothemajorstreetarethemosthazardous(possiblybecauseoftheneedtoselectagapfromtwodirectionsofoncomingtraffic).Leftturnsfromthemajorstreetarelesshazardousthantheminorstreetmovements,andright-turnmovementsaretheleasthazardous.
• Crashratesandthefrequencyofseriouscrashesaretypicallyloweratrestrictedaccessintersections(3/4designandrightin/out)thanatsimilar4-leggedintersections.Prohibiting/preventingmovements(especiallythecrossingmovement)atanintersectionwilllikelyresultinasubstantialcrashreduction.
• Minnesotacrashdataclearlysupportsthenotionthatreducingconflicts,especiallycrossingconflicts,isassociatedwithareductionincrashes.Equivalentinformationabouttheeffectsoncrashseverityhasnotbeengenerated.However,itappearsreasonabletoassumethatanyeffortthatpreventscrossingmaneuversthatcontributetorightanglecollisionsshouldalsoreduceseverityofanyremainingcrashes.
Crossing TurningMerge/ Diverge Total
Typical Crash Rate(crashespermil.enteringvehicles)
FullAccess 4 12 16 32 0.7
FullAccessT 0 3 6 9 0.4
3/4Access 0 2 8 10 0.5
RightIn/OutAccess 0 0 4 4 0.2
Full AccessFull Access
Right In/Out Access
3/4 Access
2013 MnDOT Crash Data Toolkit
Crossing
Turning
Merge/Diverge
Pedestrian
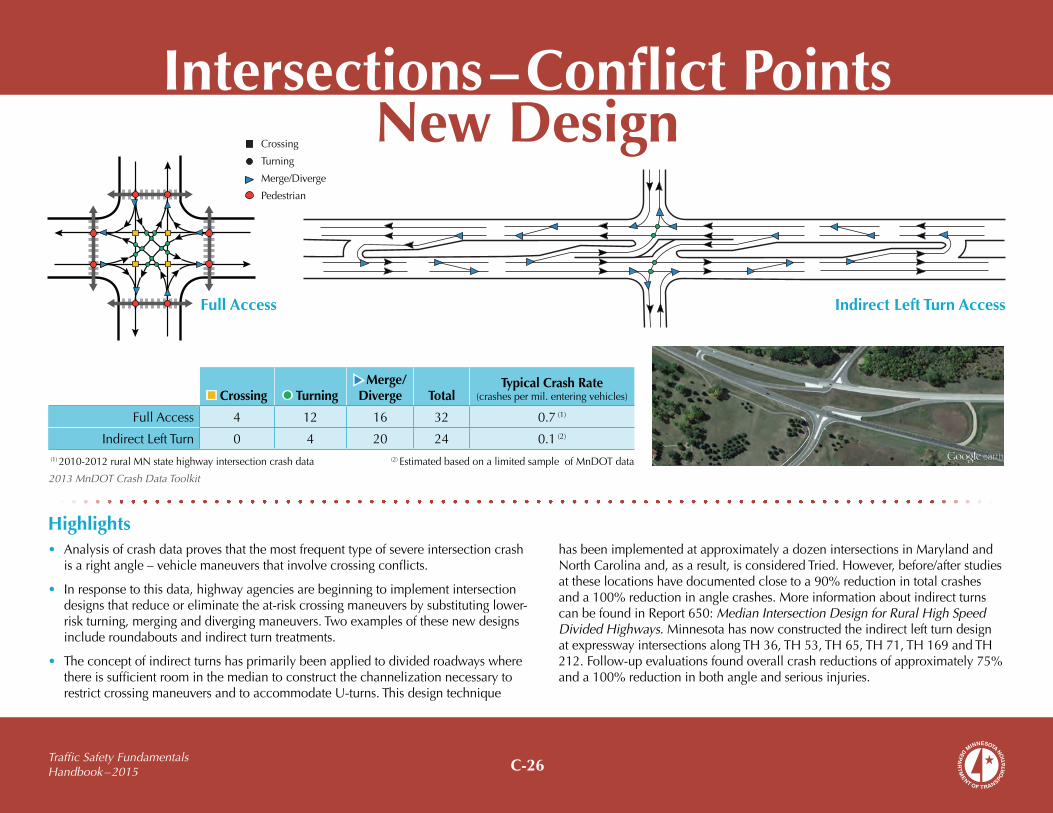
C-26Traffic Safety Fundamentals Handbook – 2015
Highlights • Analysisofcrashdataprovesthatthemostfrequenttypeofsevereintersectioncrash
isarightangle–vehiclemaneuversthatinvolvecrossingconflicts.
• Inresponsetothisdata,highwayagenciesarebeginningtoimplementintersectiondesignsthatreduceoreliminatetheat-riskcrossingmaneuversbysubstitutinglower-riskturning,merginganddivergingmaneuvers.Twoexamplesofthesenewdesignsincluderoundaboutsandindirectturntreatments.
• TheconceptofindirectturnshasprimarilybeenappliedtodividedroadwayswherethereissufficientroominthemediantoconstructthechannelizationnecessarytorestrictcrossingmaneuversandtoaccommodateU-turns.Thisdesigntechnique
Indirect Left Turn Access
Crossing TurningMerge/ Diverge Total
Typical Crash Rate(crashespermil.enteringvehicles)
FullAccess 4 12 16 32 0.7(1)
IndirectLeftTurn 0 4 20 24 0.1(2)
(1)2010-2012ruralMNstatehighwayintersectioncrashdata (2)EstimatedbasedonalimitedsampleofMnDOTdata
Intersections – Conflict PointsNew Design
Full Access
Crossing
Turning
Merge/Diverge
Pedestrian
hasbeenimplementedatapproximatelyadozenintersectionsinMarylandandNorthCarolinaand,asaresult,isconsideredTried.However,before/afterstudiesattheselocationshavedocumentedclosetoa90%reductionintotalcrashesanda100%reductioninanglecrashes.MoreinformationaboutindirectturnscanbefoundinReport650:Median Intersection Design for Rural High Speed Divided Highways.MinnesotahasnowconstructedtheindirectleftturndesignatexpresswayintersectionsalongTH36,TH53,TH65,TH71,TH169andTH212.Follow-upevaluationsfoundoverallcrashreductionsofapproximately75%anda100%reductioninbothangleandseriousinjuries.
2013 MnDOT Crash Data Toolkit
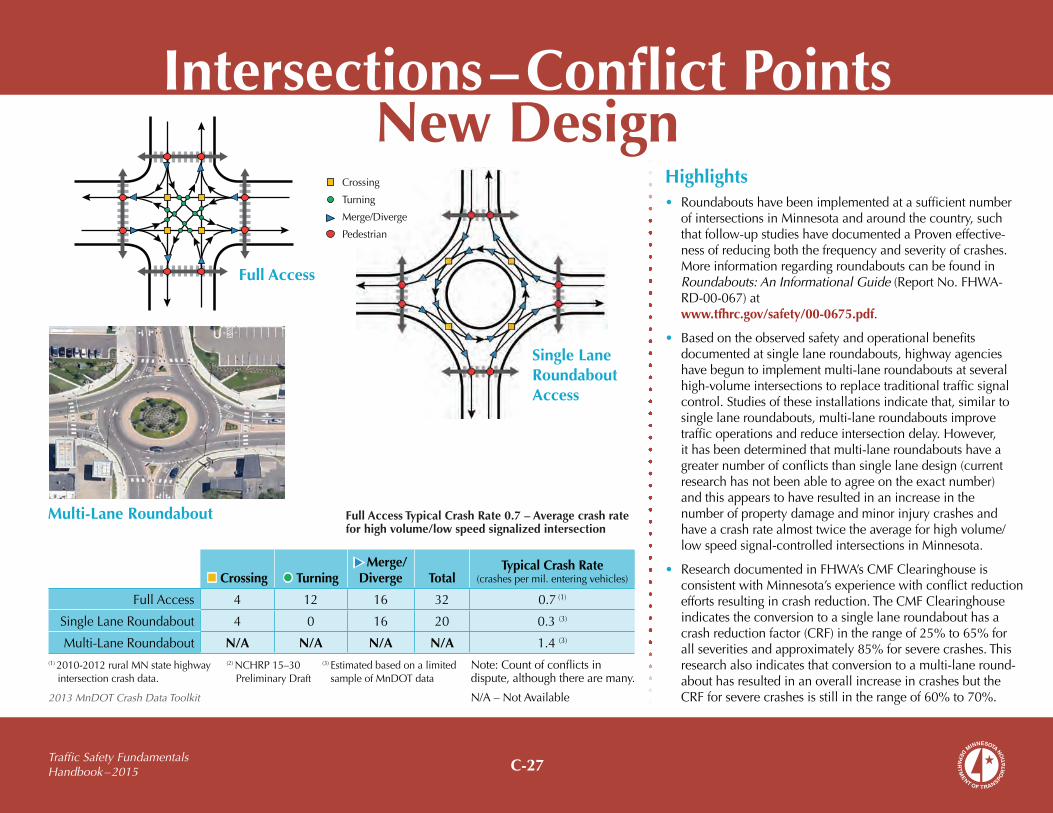
C-27Traffic Safety Fundamentals Handbook – 2015
Highlights • Roundaboutshavebeenimplementedatasufficientnumber
ofintersectionsinMinnesotaandaroundthecountry,suchthatfollow-upstudieshavedocumentedaProveneffective-nessofreducingboththefrequencyandseverityofcrashes.MoreinformationregardingroundaboutscanbefoundinRoundabouts: An Informational Guide(ReportNo.FHWA-RD-00-067)atwww.tfhrc.gov/safety/00-0675.pdf.
• Basedontheobservedsafetyandoperationalbenefitsdocumentedatsinglelaneroundabouts,highwayagencieshavebeguntoimplementmulti-laneroundaboutsatseveralhigh-volumeintersectionstoreplacetraditionaltrafficsignalcontrol.Studiesoftheseinstallationsindicatethat,similartosinglelaneroundabouts,multi-laneroundaboutsimprovetrafficoperationsandreduceintersectiondelay.However,ithasbeendeterminedthatmulti-laneroundaboutshaveagreaternumberofconflictsthansinglelanedesign(currentresearchhasnotbeenabletoagreeontheexactnumber)andthisappearstohaveresultedinanincreaseinthenumberofpropertydamageandminorinjurycrashesandhaveacrashratealmosttwicetheaverageforhighvolume/lowspeedsignal-controlledintersectionsinMinnesota.
• ResearchdocumentedinFHWA’sCMFClearinghouseisconsistentwithMinnesota’sexperiencewithconflictreductioneffortsresultingincrashreduction.TheCMFClearinghouseindicatestheconversiontoasinglelaneroundabouthasacrashreductionfactor(CRF)intherangeof25%to65%forallseveritiesandapproximately85%forseverecrashes.Thisresearchalsoindicatesthatconversiontoamulti-laneround-abouthasresultedinanoverallincreaseincrashesbuttheCRFforseverecrashesisstillintherangeof60%to70%.
Crossing TurningMerge/ Diverge Total
Typical Crash Rate(crashespermil.enteringvehicles)
FullAccess 4 12 16 32 0.7(1)
SingleLaneRoundabout 4 0 16 20 0.3(3)
Multi-LaneRoundabout N/A N/A N/A N/A 1.4(3)
(1)2010-2012ruralMNstatehighwayintersectioncrashdata.
(3)EstimatedbasedonalimitedsampleofMnDOTdata
(2)NCHRP15–30PreliminaryDraft
Multi-Lane Roundabout
Single Lane Roundabout Access
Full Access Typical Crash Rate 0.7 – Average crash rate for high volume/low speed signalized intersection
Note:Countofconflictsindispute,althoughtherearemany.
N/A–NotAvailable
Full Access
Crossing
Turning
Merge/Diverge
Pedestrian
2013 MnDOT Crash Data Toolkit
Intersections – Conflict PointsNew Design
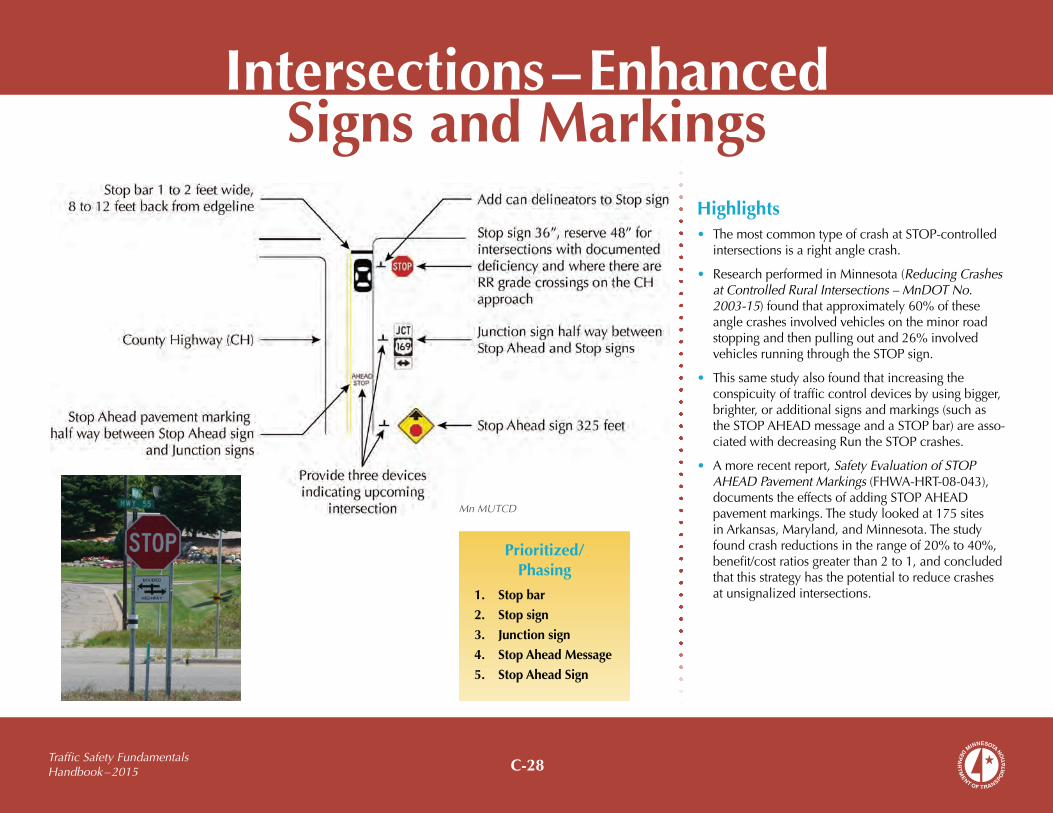
C-28Traffic Safety Fundamentals Handbook – 2015
Highlights • ThemostcommontypeofcrashatSTOP-controlled
intersectionsisarightanglecrash.
• ResearchperformedinMinnesota(Reducing Crashes at Controlled Rural Intersections – MnDOT No. 2003-15)foundthatapproximately60%oftheseanglecrashesinvolvedvehiclesontheminorroadstoppingandthenpullingoutand26%involvedvehiclesrunningthroughtheSTOPsign.
• Thissamestudyalsofoundthatincreasingtheconspicuityoftrafficcontroldevicesbyusingbigger,brighter,oradditionalsignsandmarkings(suchastheSTOPAHEADmessageandaSTOPbar)areasso-ciatedwithdecreasingRuntheSTOPcrashes.
• Amorerecentreport,Safety Evaluation of STOP AHEAD Pavement Markings(FHWA-HRT-08-043),documentstheeffectsofaddingSTOPAHEADpavementmarkings.Thestudylookedat175sitesinArkansas,Maryland,andMinnesota.Thestudyfoundcrashreductionsintherangeof20%to40%,benefit/costratiosgreaterthan2to1,andconcludedthatthisstrategyhasthepotentialtoreducecrashesatunsignalizedintersections.1. Stop bar
2. Stop sign
3. Junction sign
4. Stop Ahead Message
5. Stop Ahead Sign
Intersections – EnhancedSigns and Markings
Mn MUTCD
Prioritized/ Phasing
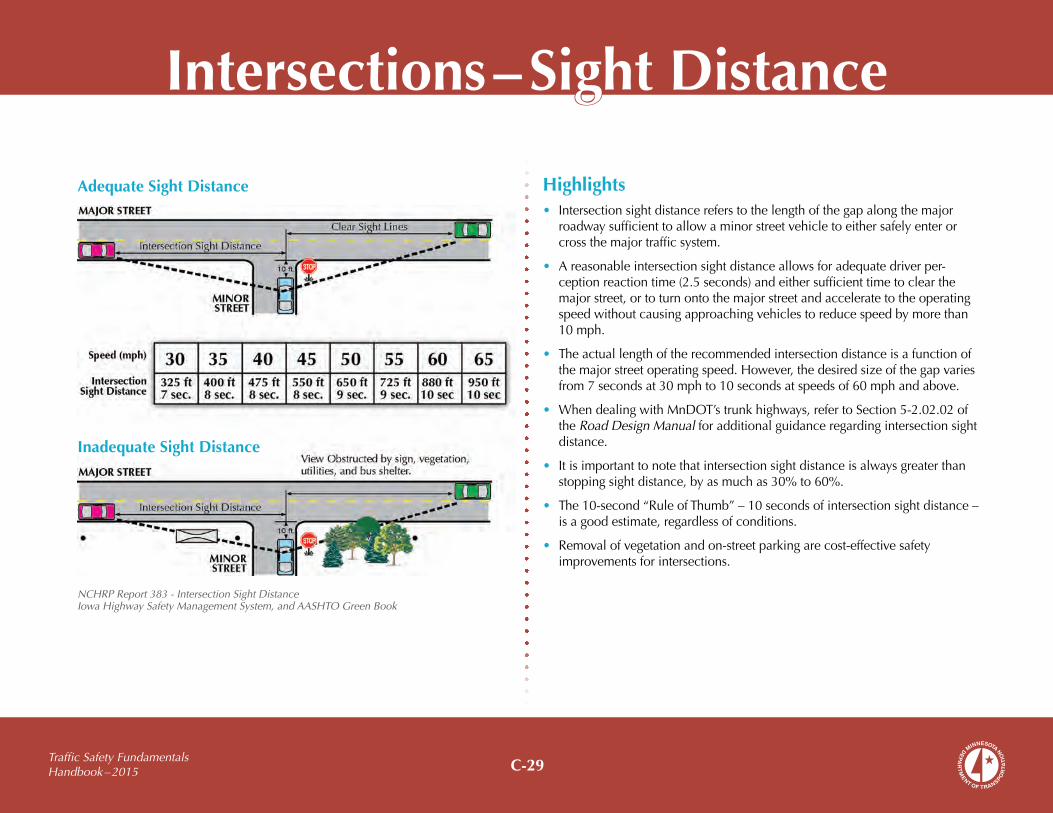
C-29Traffic Safety Fundamentals Handbook – 2015
Intersections – Sight Distance
Highlights• Intersectionsightdistancereferstothelengthofthegapalongthemajor
roadwaysufficienttoallowaminorstreetvehicletoeithersafelyenterorcrossthemajortrafficsystem.
• Areasonableintersectionsightdistanceallowsforadequatedriverper-ceptionreactiontime(2.5seconds)andeithersufficienttimetoclearthemajorstreet,ortoturnontothemajorstreetandacceleratetotheoperatingspeedwithoutcausingapproachingvehiclestoreducespeedbymorethan10mph.
• Theactuallengthoftherecommendedintersectiondistanceisafunctionofthemajorstreetoperatingspeed.However,thedesiredsizeofthegapvariesfrom7secondsat30mphto10secondsatspeedsof60mphandabove.
• WhendealingwithMnDOT’strunkhighways,refertoSection5-2.02.02oftheRoad Design Manualforadditionalguidanceregardingintersectionsightdistance.
• Itisimportanttonotethatintersectionsightdistanceisalwaysgreaterthanstoppingsightdistance,byasmuchas30%to60%.
• The10-second“RuleofThumb”–10secondsofintersectionsightdistance–isagoodestimate,regardlessofconditions.
• Removalofvegetationandon-streetparkingarecost-effectivesafetyimprovementsforintersections.
NCHRP Report 383 - Intersection Sight Distance Iowa Highway Safety Management System, and AASHTO Green Book
Adequate Sight Distance
Inadequate Sight Distance

C-30Traffic Safety Fundamentals Handbook – 2015
Highlights • ProvidingrightandleftturnlanesatintersectionsareincludedinMinnesota’slist
ofhighprioritystrategies.
• However,therearelocationswherevehiclesarestoppedordeceleratingintheturnlaneandcanblockthelineofsightforothervehicleswaitingattheinter-sections.Inthesecases,theuseofoffsetleftandrightturnlaneswillimprovethelineofsightforvehicleswaitingtocompletetheircrossingorturningmaneuvers.
• OffsetturnlanesareconsideredTried(asopposedtoProven).Abefore/afterstudyofoffsetleftturnlanesinNorthCarolinareporteda90%reductioninleftturncrashes.AsimilarstudyofoffsetrightturnlanesinNebraskafounda70%reductioninnear-siderightanglecrashes.
• TheMedianAccelerationLane(MAL)hasbeenusedatanumberoflocationsinMinnesotaandisalsoconsideredTried.Before/afterstudiesindicatea75%reductioninsamedirectionsideswipecrashes,a35%reductioninfar-siderightanglecrashes,anda25%reductioninvolvingleftturncrashesfromtheminorroad.
• Turnlanelength–newreport#2010-25,Base Turn Lane Length on Analysis of Deceleration and Storage Demand.
NCHRP 15-30 Preliminary Draft
Intersections – Turn Lane Designs
OFFSET Left-Turn Lane
OFFSET Right-Turn Lane
Median Acceleration Lane
B. Tapered
A. Parallel

C-31Traffic Safety Fundamentals Handbook – 2015
Minnesota Trunk Highway 13
at Scott County Highway 2
MnDOT Metro District Before: After Study
Highlights • ThemostcommonandmostseveretypeofcrashatSTOP-controlledintersectionsisarightangle
whichinvolvesavehicleontheminorroadattemptingtoselectasafegapalongthemajorhighwayinordertocross.
• Aprovenstrategytoreducegapselection-relatedanglecrashesinvolvesredesigningtheintersectionormediancrossovertoeliminatecrossingconflicts(whichhavethehighestprobabilityofacrash)bysubstitutingmerging,diverging,orturningconflicts(whichhavealowerprobabilityofacrash).
• Theprimaryexamplesofreduced-conflictdesignsatfour-leggedintersectionsincluderoundaboutsandindirectturns.
• RoundaboutsareconsideredtobeProveneffective(thereisvirtuallynopossibilityofananglecrash)withstatisticallysignificantcrashreductions–38%forallcrashes,and76%forinjurycrashesandforseriousinjuryandfatalcrashes.Notwithstandingthesuperiorsafetyperformance,caremustbetakenwhenconsideringconversiontoaroundabout–implementationcostsareintherangeof$1,000,000(rural)to$5,000,000(urban)andallenteringlegsaretreatedequally.Thekeyquestionisdothetrafficcharacteristicsandfunctionclassificationsupportthedegradingofmain-linetrafficoperations.
• Theconceptbehindindirectturnsisthatmerge,diverge,andturningconflictsresultinfewerandlessseverecrashesthancrossingconflicts.AnexampleoftheindirectturnappliedtoadividedroadwayistheJ-turn.Thisapplicationinvolvesconstructingabarrierinthemediancrossoverandforcingminorstreetcrossingtraffictoinsteadmakearightturn,followedbyadownstreamU-turn,followedbyanotherrightturn.J-turnshavebeenTriedataboutadozenlocationsinMarylandandNorthCarolina.Implementationcostsareintherangeof$500,000to$750,000,andapreliminarycrashanalysisfounda100%reductioninanglecrashesanda90%reductionintotalcrashes.
• AtTintersectionsthreenewdesignconceptshavebeendeveloped:thepartialT-interchange,thecontinuousgreenT,andthedivergingdiamondinterchange.
• ThepartialinterchangeisaninterestingconceptforTintersectionsalongdividedroadways–theconstructionofonebridgeonthe“near-side”oftheintersectioneliminatesallcrossingmaneuvers.ThisconceptisbeingconsideredforseverallocationsinMinnesota,butdeploymenthasnotbeensufficientlywidespreadtobeabletoidentifytypicalimplementationcostsordocumentcrashreductions.
NCHRP 15-30
Intersections – Roundaboutsand Indirect Turns
Photo provided by TKDA
Indirect Turns
Partial T-Interchange

C-32Traffic Safety Fundamentals Handbook – 2015
Highlights • InstallingtrafficsignalsisNOTconsideredtobeahighpriorityinter-
sectionsafetystrategybecauseoftheresultsofstudiesdonenationallyandinMinnesota.Atmostintersections,theinstallationofatrafficsignalwillincreasethenumberofcrashes,alongwithincreasingcrashandseverityrates.Also,asacategory,signalizedintersectionshaveahigheraveragecrashdensity,crashrate,andseverityratethantheaverageforSTOP-controlledintersections.
• However,ifatrafficsignalmustbeinstalledtoaddressintersectiondelayandcongestion,thereareseveralsuggestedhighprioritystrategiestoreducefrequencyandseverityofintersectioncrashes.Theseinclude:
• Useofmultiphasesignaloperationcombinedwithleftturnlanes
• Provideacoordinatedsignalsystemalongurbanarterials
• Useoverheadindications–oneperthroughlanemountedatthecenterofeachlane
• Providedilemmazoneprotectionandoptimizeclearanceintervals
• Useadvancewarningflasherstosupplementstaticsignswhereasignalmaybeunexpected
• Pedestrianindicationsincludingtheuseofcountdowntimers
Intersections – Traffic Signal Operations

C-33Traffic Safety Fundamentals Handbook – 2015
Highlights• RedLightRunning(RLR)isasafetyissueacrossthecountry.In2009,RLRresulted
in676trafficfatalities(10%ofallintersection-relatedfatalities).Inaddition,theInsuranceInstituteforHighwaySafetyestimatesthat130,000peoplewereinjuredincrashesin2009duetoRLR.
• RLRhasalsobeenfoundtobeanimportantsafetyissueinMinnesota.IntheMinneapolis-St.PaulMetropolitanArea,approximately60%ofseverecrashesareintersectionrelated,approximately50%ofthoseoccuratintersectionscontrolledbytrafficsignals,andalmostone-halfoftheseinvolvearightanglecollision.
• Inthemetropolitanarea,thenumberofsevererightanglecrashesvariesamongstate,countyandcityintersections,butonefactisconsistent–alongeachsystem,rightanglecrashesresultinmorefatalitiesandseriousinjuriesthanrear-end,left-turnandright-turncrashescombined.
• Publishedresearchsuggeststhatinitialstepstoaddressrightanglecrashesatsignal-controlledintersectionsinvolvecheckingclearance(YellowandAll-Red)intervalsandsignalhardware(overheadindications,12-inchlenses,andbackplatesprovidebettervisibilityfordrivers).
• AreviewofMinnesotacrashdataindicatesthattheuseof“good”clearanceintervalsandsignalhardwareisnotenoughtopreventrightanglecrashes.
• Intersectionswiththesefeatureshave(onaverage)ahigherdensityofseverecrashesthanintersectionswithonlypedestalmountedsignalswith8-inchlenses.
• Thisdatasuggeststhatadditionalenforcementeffortsarerequiredtoaddressdriverbehavior.AnAmericanAutomobileAssociationssurveyin2010foundthatmorethan30%ofrespondentsadmittedtorunningaredlightintheprevious30dayswhentheycouldhavesafelystopped.
Intersections – Red LightEnforcement

C-34Traffic Safety Fundamentals Handbook – 2015
Highlights• DiscussionswithavarietyoflawenforcementofficershasfoundthatRLR
enforcementhasnotbeenapriority.Thisisprimarilyduetothefactthatittakestwoofficerstodoitsafely–oneontheapproachtoobservetheviolationandonepasttheintersectiontoissuetheticket–andmostagenciesdonothaveenoughofficerstodevotethislevelofeffortatasinglelocation.
• Nationally,thesolutiontolawenforcementstaffinglevelshasbeentheuseofredlightcameras.Studiesofeffectivenessofcamerashasdocumentedan80%reductioninallcrashes,a75%reductioninanglecrashes,anda60%reductioninRLR-relatedcrashes.Thestudiesalsofoundthatcamerasmayincreaserear-endcrashes,buttheytendtobelesssevere.1
• InMinnesota,redlightcamerasarenotallowedbystatelaw.Asaresult,anumberofagencies(CityofBurnsville,OlmsteadCounty,andMnDOT)haveimplementedanalternative,low-cost(typicallylessthan$2,000perinter-section)techniquetoassistlawenforcementeffortstoreduceRLR–theuseofconfirmationlights.
• Thesesmallbluelightsaremountedonthesideorthebackoftrafficsignalsupportsandarewiredinparallelwiththesignalsothatwhenthesignaldisplaysaredindication,theconfirmationlightilluminatesatthesametime.Theuseofconfirmationlightsallowsasingleofficerpasttheintersectiontobothobserveaviolationandsafelyapprehendtheviolator.
• Studiesofeffectivenessofconfirmationlightshavedocumentedcrashreductionsbetween30%and47%inFlorida.InMinnesota,theinstallationsaretoonewandtoofewtobeabletodocumentareductionincrashes.However,astudyoftwoinstallationsinBurnsvillefounda50%reductioninthenumberofviolations.2
1Toolbox of Countermeasures to Reduce Red Light Running,MidwestTransportationConsortium,InTrans10-386
2UnpublishedTechnicalmemorandumpreparedbySEH(ThomasSohrweide)andprovidedbytheCityofBurnsville
Intersections – Red LightEnforcement

C-35Traffic Safety Fundamentals Handbook – 2015
Highlights• TheinstallationofstreetlightsisconsideredtobeaProven
effectivestrategyforreducingcrashes.
• Researchhasfoundthattheinstallationofstreetlightsatruralintersectionsreduced:
• Nightcrashesby26%to40%
• Nightcrashrateby25%to40%
• Nightsinglevehiclecrashesby29%to53%
• Nightmultiplevehiclecrashesby63%
• Nightcrashseverityby26%
• Abenefit/costanalysisfoundthatthecrashreductionbenefitsofstreetlightingatruralintersectionsoutweighcostsbyawidemargin.TheaverageB/Cratiowasabout15:1.
• Theresultsofrecentcasestudyresearchsuggeststhattheuseofstreetlightingismoreeffectiveatreducingnightcrashesthaneitherrumblestripsoroverheadflashers.
• AsurveyofpracticeamongMinnesotacountiesfoundtypicallightinginstallationcostsalongcountyfacilitiesintherangeof$1,000to$5,000perintersectionandannualoperationsmaintenancecostsintherangeof$100to$600perlight.
System-Wide Comparative Analysis
ItemIntersectionswithout
StreetLightsIntersectionswith
StreetLights ReductionStatistical
SignificanceIntersections 3236 259NightCrashes 34% 26% 26% YesNightCrashRate 0.63 0.47 25% YesNightSingleVehicleCrashes 23% 15% 34% YesNightSingleVehicleCrashRate 0.15 0.07 53% Yes
Before vs. After Crash Analysis
Item Before After ReductionStatistical
Significance
Intersections 12 12
NumberofNightCrashes 47 28 40% Yes
NightCrashes/Intersection/Year 1.31 0.78 40%
TotalCrashes/Intersection/Year 2.44 2.08 15%
NightCrashRate 6.06 3.61 40% Yes
TotalCrashRate 2.63 2.24 15% Yes
SeverityIndex 43% 32% 26% Yes
NightSingleVehicleCrashRate 4.0 2.84 29% Yes
NightMultipleVehicleCrashRate 2.06 0.77 63% Yes
Rural Intersections – Safety Effects of Street Lighting
MN/RC-1999-17
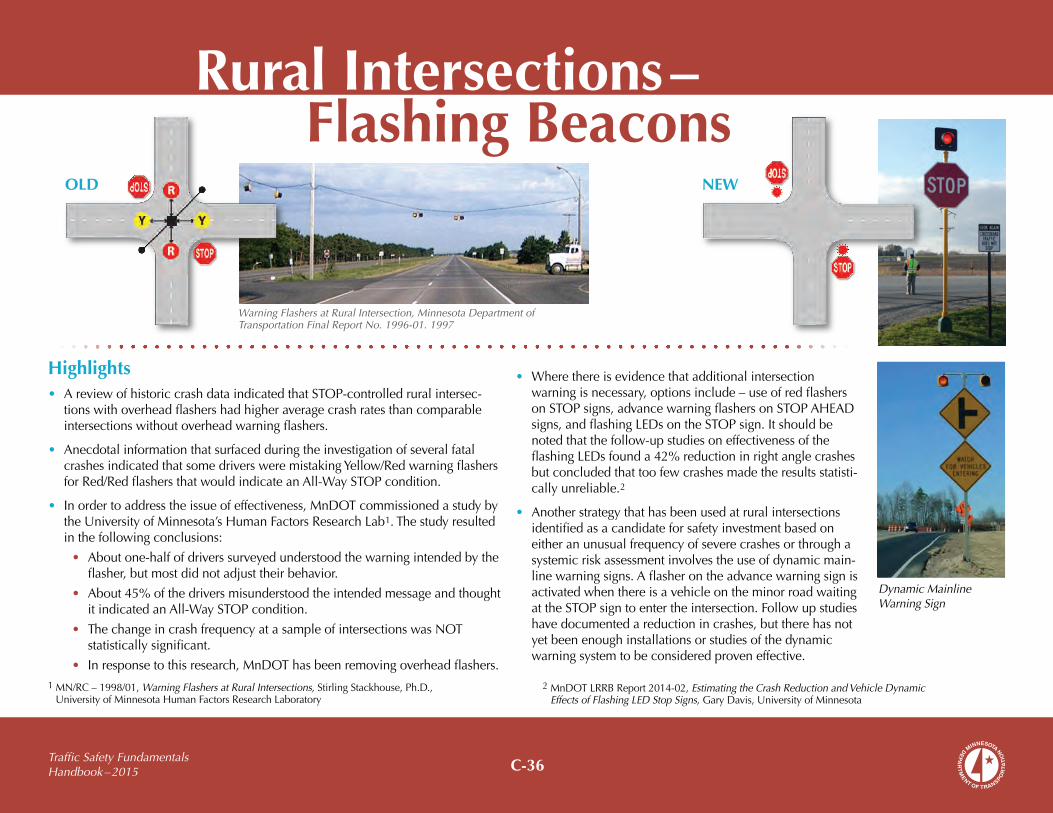
C-36Traffic Safety Fundamentals Handbook – 2015
Highlights• AreviewofhistoriccrashdataindicatedthatSTOP-controlledruralintersec-
tionswithoverheadflashershadhigheraveragecrashratesthancomparableintersectionswithoutoverheadwarningflashers.
• AnecdotalinformationthatsurfacedduringtheinvestigationofseveralfatalcrashesindicatedthatsomedriversweremistakingYellow/RedwarningflashersforRed/RedflashersthatwouldindicateanAll-WaySTOPcondition.
• Inordertoaddresstheissueofeffectiveness,MnDOTcommissionedastudybytheUniversityofMinnesota’sHumanFactorsResearchLab1.Thestudyresultedinthefollowingconclusions:
• Aboutone-halfofdriverssurveyedunderstoodthewarningintendedbytheflasher,butmostdidnotadjusttheirbehavior.
• About45%ofthedriversmisunderstoodtheintendedmessageandthoughtitindicatedanAll-WaySTOPcondition.
• ThechangeincrashfrequencyatasampleofintersectionswasNOTstatisticallysignificant.
• Inresponsetothisresearch,MnDOThasbeenremovingoverheadflashers.
Warning Flashers at Rural Intersection, Minnesota Department of Transportation Final Report No. 1996-01. 1997
NEWOLD
Rural Intersections – Flashing Beacons
• Wherethereisevidencethatadditionalintersectionwarningisnecessary,optionsinclude–useofredflashersonSTOPsigns,advancewarningflashersonSTOPAHEADsigns,andflashingLEDsontheSTOPsign.Itshouldbenotedthatthefollow-upstudiesoneffectivenessoftheflashingLEDsfounda42%reductioninrightanglecrashesbutconcludedthattoofewcrashesmadetheresultsstatisti-callyunreliable.2
• Anotherstrategythathasbeenusedatruralintersectionsidentifiedasacandidateforsafetyinvestmentbasedoneitheranunusualfrequencyofseverecrashesorthroughasystemicriskassessmentinvolvestheuseofdynamicmain-linewarningsigns.AflasherontheadvancewarningsignisactivatedwhenthereisavehicleontheminorroadwaitingattheSTOPsigntoentertheintersection.Followupstudieshavedocumentedareductionincrashes,buttherehasnotyetbeenenoughinstallationsorstudiesofthedynamicwarningsystemtobeconsideredproveneffective.
Dynamic Mainline Warning Sign
2MnDOTLRRBReport2014-02,Estimating the Crash Reduction and Vehicle Dynamic Effects of Flashing LED Stop Signs,GaryDavis,UniversityofMinnesota
1MN/RC–1998/01,Warning Flashers at Rural Intersections, StirlingStackhouse,Ph.D.,UniversityofMinnesotaHumanFactorsResearchLaboratory

C-37Traffic Safety Fundamentals Handbook – 2015
Highlights• Theuseoftransverserumblestripstoaddresssafetyissuesatruralintersectionshasbeenpartofthe
trafficengineer’stoolboxformanyyears.However,studiesonimplementationhavedemonstratedmixedresults.
• MnDOTtooktheopportunitytoperformathoroughstudyoftransverserumblestripsaspartofpreparingtheirdefenseinalawsuitallegingnegligenceonthestate’spartfornothavingrumblestripsataparticularintersection.Thestudyresultedinthefollowingconclusions:
• Theresultsofpreviousresearchdocumentedmixedresults,withsomestudiesshowingmodestimprovementandothersshowinganincreaseincrashes.Thelargeststudy,basicallystatewidealongsecondaryroads,showedanoverallincreaseincrashesattheintersectionswheretherumblestripswereinstalled.
• Abefore/afteranalysisof25ruralintersectionsinMinnesotafoundthattotalintersectioncrashesandrightanglecrashesactuallyincreasedafterinstallingrumblestrips.Thenumberoffatalplusinjurycrashesdeclinedslightly;however,noneofthechangeswerestatisticallysignificant.
• AprojectbytheUniversityofMinnesota’sHumanFactorsResearchLabfoundthatrumblestripshadaminoreffectondriverbehaviorrelativetospeedreductionandbreakingpatterns.However,therewasnoevidenceofcrashreduction.
• Formoreinformation,seeMnDOT’sTransportation Synthesis Report, TRS 0701 (www.lrrb.org/trs0701.pdf).
• StrategiesthathavebeenproveneffectiveatimprovingsafetyatruralThru/STOPintersectionsincludeenhancedsigns,markings(C-28),andstreetlights(C-35).
• Therelativeineffectivenessoftransverserumblestripsmaybeduetothefactthatthemajorityofcrashesatthru/STOPcontrolledintersectionsinvolvevehiclesthathavestoppedandthenproceedintotheintersection.Thesecrashesareattributedtogapselectionasopposedtointersectionrecognition.
• Ifaninvestigationofcrashesataruralintersectionindicatesmultiplerun-the-stopcrashes,theinstallationoftransverserumblestripscanbeconsidered.However,ifthereareanyhomesintheimmediatevicinityconsiderationshouldalsobegiventostrategiesthatwon’tgeneratenoisecomplaints.
MnDOT’s Transportation Synthesis Report, TRS 0701, August 2007
Rural Intersections – Transverse Rumble Strips
Number of Crashes (3-Year Period)
Before vs. After Change

C-38Traffic Safety Fundamentals Handbook – 2015
Pedestrian Safety Strategies
Highlights• FatalcrashesinvolvingpedestriansareoneofAASHTO’sSafetyEmphasisAreas.In
theU.S.,thereareabout5,000pedestrianskilledeachyear,whichrepresentsabout11%ofalltrafficfatalities.
• Minnesotaaveragesabout37pedestrianfatalitiesannually(about9%oftotaltrafficfatalities).Theinvolvementrate(0.4pedestrianfatalitiesper100,000population)ranks47th–onlyRhodeIsland,NewHampshire,andIdahohavealowerrate.
• Nationally,fatalpedestriancrashesmostoftenoccurinurbanareas(67%),awayfromintersections(58%),andduringgoodweather(85%).Overtwo-thirdsofthepedestrianskilledaremale.
• Themostcommonpedestrianactivitiesassociatedwithfatalcrashesarewalking/workingintheroadandcrossingtheroadway.
• Contributingfactorsassociatedwithmotorvehicledriversincludefailuretoyieldrightofway(35%)anddriverinattention/distraction(21%).
• Tobetterassistagenciesinaddressingpedestrianandbicyclesafetyconcerns,MnDOTpreparedMinnesota’s Best Practices for Pedestrian/Bicycle Safety.Thedocumentidentifies19commonsafetystrategies,includingcrosswalkenhance-ments,newtechnologies,roaddiets,andspeedreductionmeasures.Adescriptionisprovidedforeachstrategy,alongwithanoverviewofsafetybenefits,typicalcharacteristicsofcandidatelocation,implementationcosts,andastatementofwhatconstitutesa“best”practice.
• AnotherresourcethatcanprovideassistanceindevelopingpedestriancrossingsisMnDOTReport2014-21:UncontrolledPedestrianCrossingEvaluationIncorpo-ratingHighwayCapacityManualUnsignalizedPedestrianCrossingAnalysisMeth-odology.Thisreportprovidesanoverviewofprevioussafetyresearchandpresentsamethodologyforestimatingthedelaythatapedestrianwouldexperiencewaitingforasafegapintrafficbasedonroadwaywidthandtrafficvolumes.Locationswithshortwaittimeswouldbeconsideredlow-prioritycandidatesforcrosswalkdevel-opmentandlocationswithlongwaittimeswouldbehigh-prioritycandidates.

C-39Traffic Safety Fundamentals Handbook – 2015
Pedestrian Safety – Crash Rates vs. Crossing Features
Highlights• Threeofthemorecommonstrategiesintendedtoaddresspedestriancrashes
includereducingvehiclespeeds,providingamarkedcrosswalk,andinstallingatrafficsignal.
• Theresearchisabundantlyclear–merelychangingthepostedspeedlimithasneverreducedvehiclespeeds,paintingcrosswalksatunsignalizedintersectionsisactuallyassociatedwithhigherfrequenciesofpedestriancrashes,andinstallingatrafficsignalhasneverbeenproveneffectiveatreducingpedestriancrashes.
• Reducingvehiclespeedsisassociatedwithreducingtheseverityofapedestriancrash,butactuallyreducingspeedsrequireschangingdriverbehavior,whichrequireschangingtheroadwayenvironment.Strategiesthathavedemonstratedaneffectondriverbehaviorincludeverticalelements(speedbumpsandspeedtables),narrowingtheroadway(convertingfromaruraltoanurbansection),andextraordinarylevelsofenforcement.
• Across-sectionalstudyof2,000intersectionsin30citiesacrosstheU.S.foundthatmarkedcrosswalksatunsignalizedintersectionsareNOTsafetydevices.Thepedestriancrashratewashigheratthemarkedcrosswalksandthiseffectisgreatestformultilanearterialswithvolumesover15,000vehiclesperday.
• Abefore/afterstudyatover500intersectionsinSanDiegoandLosAngelesfounda70%reductioninpedestriancrashesfollowingtheremovalofmarkedcross-walksatuncontrolledintersections.
• Trafficsignalshavenotproventobeeffectiveatreducingpedestriancrashes–thehighestpedestriancrashfrequencylocationsinmosturbanareasaresignalizedintersections.
• Observationsofpedestrianbehaviorattrafficsignalssuggeststhatthereisalowlevelofunderstandingofthemeaningofthepedestrianindicationsandahighlevelofpedestrianviolations–veryfewpushthecallbuttonandfeweryetwaitforthewalkindication.
Charles V. Zegeer, et al., Safety Effects of Marked vs. Unmarked Crosswalks at Uncontrolled Locations: Executive Summary and Recommended Guide-lines, 1996-2001 (www.walkinginfo.org/pdf/r&d/crosswalk_021302.pdf)

C-40Traffic Safety Fundamentals Handbook – 2015
Pedestrian Safety – Curb Extensions and Medians
Highlights• Pedestrianstrategiesthathaveproventobeeffective
includethefollowing:
• Overpass(inordertobeeffective,crossingtheroadwayat-grademustbephysicallyprevented)
• Street Lighting
• Refuge/Median Islands –Reducesvehiclespeedsatpedestriancrossinglocationsorintersections.
• Curb Extensions–Reducespotentialvehicleconflictsbyreducingpedestriancrossingdistanceandtime,andimproveslinesofsight.
• Sidewalks
• Road Diets(convertingfour-laneundividedroadstoathree-lanecross-section) –Eliminatesthemulti-vehiclethreatthatcanoccuronfour-laneroads.
Median Refuge Near Intersection Curb Extensions and Sidewalks
Road Diet (3 Lanes)
4-Lane Road

C-41Traffic Safety Fundamentals Handbook – 2015
Highlights• Somemorerecentpedestrianandbicyclestrategies
include:
• Countdown Timers–Countdowntimersareflashingtimers,usuallyinstalledwithpedestrianindicationlights,whichprovidethenumberofsecondsremainingduringthepedestrianphase.
• Leading Pedestrian Interval –Aleadingpedestrianintervalprovidesthepedestrianwalk2or3secondsaheadofthevehiclegreen,allowingpedestriansaheadstartandtheabilitytoenterthecrosswalkbeforeright-turningvehiclescanturnintothecrosswalk.
• HAWK Signals–Shouldonlybeusedinconjunctionwithamarkedcrosswalkandtypicallynotatanintersection
• Bike Boulevards–stillconsideredexperimental–however,onestudylookingatsevenbikeboulevardsinBerkeley,founda60%reductioninbicycle-involvedcrashes.
Pedestrian/Bike Strategies

C-42Traffic Safety Fundamentals Handbook – 2015
Complete Streets
Highlights• CompleteStreetsisatransportationnetworkapproach,involvingtheprovisionof
safeaccessforallstreetusers,thatmustbeconsideredduringtheplanninganddesignphasesofallroadwayimprovementprojects.CompleteStreetsisneitherproscriptivenoramandateforanimmediateretrofit;itishowever,intendedtobereflectiveoflocalneedsandtoserveadjacentlanduses.
• MnDOThasapolicythatrequirestheprinciplesofCompleteStreetstobeconsideredontrunkhighwaysatallphasesofplanningandprojectdevelopmentinordertoestablishacomprehensive,integrated,andconnectedmultimodaltransportationsystem.
• Agoodphrasetosummarizetheneedtodeterminetherightlocationstoimplementpedestrianandbicycleamenitiesisasfollows:“Notallmodesonallroads,rightmodeonrightroad.”
• MnDOT’sStateAidbicycleguidelineshavebeenmodifiedtoallowdesignersgreaterflexibilityinordertobeabletofitbicyclefacilitiesintoconstrainedcross-sectionsfoundalongexistingroadways.

C-43Traffic Safety Fundamentals Handbook – 2015
Neighborhood Traffic Control Measures
Highlights • Neighborhoodtrafficcontrol(trafficcalming)usuallyinvolvesapplyingdesign
techniquesanddevicesonlocalstreetsinordertomodifydriverbehaviorandtrafficcharacteristics.
• Theapplicationofthesedevicesareusuallylimitedtoresidentialstreets,havebeeninfrequentlyusedonresidentialcollectors,andshouldnotbeconsideredonarterialsduetothepresenceoftransitvehicles,trucks,andemergencyresponders.
• Typicaltechniquesinvolvetheuseofsigns,markings,roadnarrowingordiverters,verticalelements,andtheuseoftechnologytoincreasetheenforcementpresence.
• Afewstudiesoftheeffectivenessofthesedeviceshavebeenconducted–thegeneralconclusionsare:
• Speedhumps/bumpsaremoderatelyeffectiveatloweringspeedsintherangeof3to7mphintheimmediatevicinityofthedevice.However,speedsbetweenthedeviceshavebeenobservedtoincrease.ItshouldalsobenotedthatthesedevicesareNOTallowedonanystate-aidedstreetorhighway.
• AddingSTOPsignslowersspeedsbyabout2mph,inthevicinityoftheSTOPsign,butalsoreducescompliance–agreaternumberofdriverscompletelydisregardthesignthancometoacompletestop.Inaddition,speedsinthesegmentsbetweenSTOPsignshavebeenobservedtoincreaseasdriversattempttomakeupforlosttime.OnefurtherpointshouldbeconsideredwhenevaluatingthepossibilityofaddingSTOPsignsforspeedmanagement-researchhasshownthatlowvolumeintersectionswithSTOPcontrolhaveahigherfrequencyofcrashesthanuncontrolledintersections.
• Changingspeedlimitsignshasneverchangeddriverbehavior.
• Enforcementdoeschangedriverbehavior-butthehaloeffectofenforcementmaybeassmallasafewminutes,soasustainedeffortisrequired.
www.ite.org/traffic/tcstate.asp
ITE, Traffic Calming - State of the Practice
ITE Traffic Calming Seminar
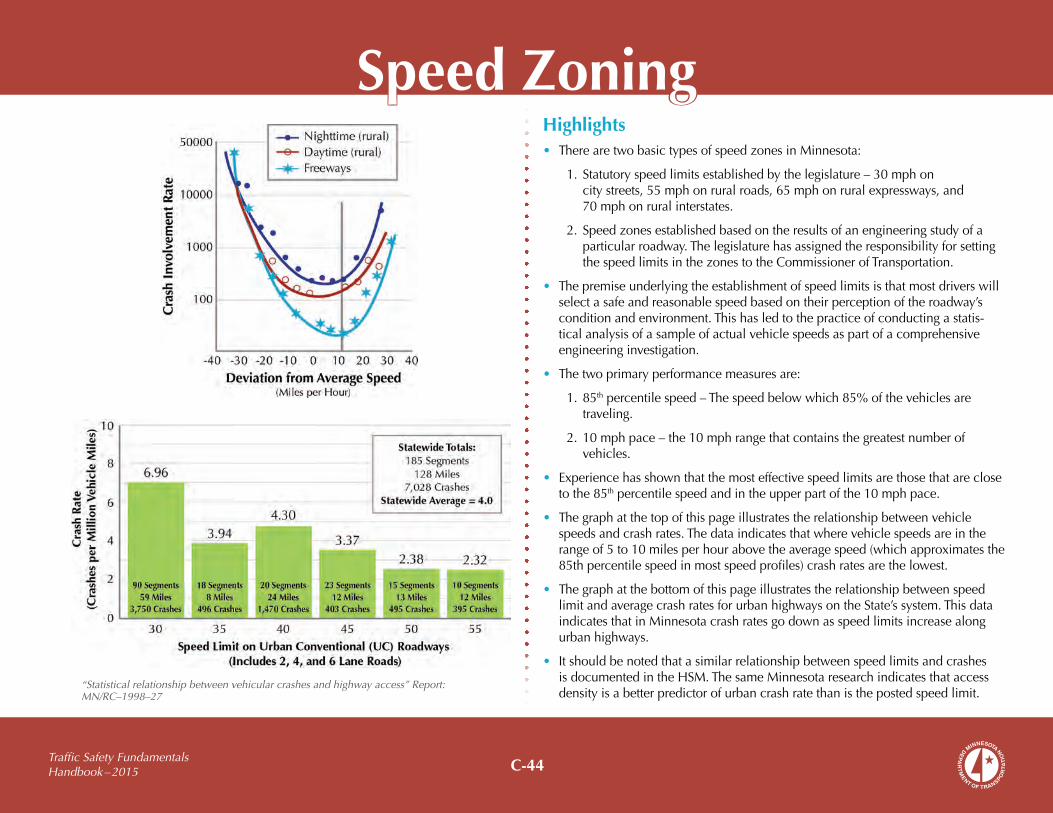
C-44Traffic Safety Fundamentals Handbook – 2015
Highlights• TherearetwobasictypesofspeedzonesinMinnesota:
1. Statutoryspeedlimitsestablishedbythelegislature–30mphoncitystreets,55mphonruralroads,65mphonruralexpressways,and70mphonruralinterstates.
2. Speedzonesestablishedbasedontheresultsofanengineeringstudyofaparticularroadway.ThelegislaturehasassignedtheresponsibilityforsettingthespeedlimitsinthezonestotheCommissionerofTransportation.
• Thepremiseunderlyingtheestablishmentofspeedlimitsisthatmostdriverswillselectasafeandreasonablespeedbasedontheirperceptionoftheroadway’sconditionandenvironment.Thishasledtothepracticeofconductingastatis-ticalanalysisofasampleofactualvehiclespeedsaspartofacomprehensiveengineeringinvestigation.
• Thetwoprimaryperformancemeasuresare:
1. 85thpercentilespeed–Thespeedbelowwhich85%ofthevehiclesaretraveling.
2.10mphpace–the10mphrangethatcontainsthegreatestnumberofvehicles.
• Experiencehasshownthatthemosteffectivespeedlimitsarethosethatareclosetothe85thpercentilespeedandintheupperpartofthe10mphpace.
• Thegraphatthetopofthispageillustratestherelationshipbetweenvehiclespeedsandcrashrates.Thedataindicatesthatwherevehiclespeedsareintherangeof5to10milesperhourabovetheaveragespeed(whichapproximatesthe85thpercentilespeedinmostspeedprofiles)crashratesarethelowest.
• ThegraphatthebottomofthispageillustratestherelationshipbetweenspeedlimitandaveragecrashratesforurbanhighwaysontheState’ssystem.ThisdataindicatesthatinMinnesotacrashratesgodownasspeedlimitsincreasealongurbanhighways.
• ItshouldbenotedthatasimilarrelationshipbetweenspeedlimitsandcrashesisdocumentedintheHSM.ThesameMinnesotaresearchindicatesthataccessdensityisabetterpredictorofurbancrashratethanisthepostedspeedlimit.
“Statistical relationship between vehicular crashes and highway access” Report: MN/RC–1998–27
Speed Zoning

C-45Traffic Safety Fundamentals Handbook – 2015
Highlights• InMinnesota,statestatutesassigntheestablishmentofspedzonesto
theCommissionerofTransportationinordertoachieveaconsistencyacrossallroadsinMinnesota.
• Speedzonesareestablishedbasedonananalysisofexistingvehiclespeedsalongasegmentofroadwayandavarietyofotherinformationincludingroadcross-section,densityofaccess,landuseandothercharacteristicsoftheroadenvironment.
• Inanumberofcases,localauthoritieshavequestionedtheoutcomesofthetechnicalanalysisandrequestedthepostingofalowerspeedlimit.Thetabletotheleftillustratestheoutcomeofexperimentsthatwereconducted–thepostedlimitswerechangedandlocalagen-cieswereinvitedtoapplyasmuchenforcementasstafflevelswouldallow.Theoutcomewasidenticalinallcases,driverbehaviordidnotchange.
• Theseexperimentssupportthenotionthatamajorityofdiverspickasafeandcomfortablespeedbasedontheirperceptionoftheroadenvironmentandonlychangingthepostedspeeddidnotchangetheirbehavior.
Speed Zoning Studies
Study Location Before After
Sign Change +/- MPH
85% Before After
Change MPH
TH 65SPEEDLIMIT40
SPEEDLIMIT30 -10 34
34 0
TH 65SPEEDLIMIT50
SPEEDLIMIT40 -10 44
45 +1
Anoka CSAH 1
SPEEDLIMIT45
SPEEDLIMIT40 -5 48
50 +2
Anoka CSAH 24
SPEEDLIMIT30
SPEEDLIMIT45 +15 49
50 +1
Anoka CSAH 51
SPEEDLIMIT40
SPEEDLIMIT45 +5 45
46 +1
Hennepin CSAH 4
SPEEDLIMIT50
SPEEDLIMIT40 -10 52
51 -1
Noble AveSPEEDLIMIT30
SPEED�LIMIT35
SPEED�LIMIT35
SPEEDLIMIT35 +5 37
40 +3
62nd Ave NSPEED�LIMIT35
SPEED�LIMIT35
SPEEDLIMIT35
SPEEDLIMIT30 -5 37
37 0
Miss. StSPEEDLIMIT30
SPEED�LIMIT35
SPEED�LIMIT35
SPEEDLIMIT35 +5 39
40 +1
Minnesota Department of Transportation (MnDOT)
Speed Zoning

C-46Traffic Safety Fundamentals Handbook – 2015
Speed Reduction Efforts
Highlights• Beyondmerelychangingthepostedspeedlimit,
effortstochangedriverbehaviorhavefocusedontwoapproaches–addedenforcement(remember–electronicenforcementisnotallowedinMinnesota)andmakingchangestotheroadenvironmentinordertoadjustdriverperception.
• Theuseofaddedenforcement(besuretocheckwithyourlocalpolice/sherifftodetermineiftheyhavetheresourcestoprovideahigherlevelofenforce-ment)producesahighlevelofconsistencywiththepostedlimitBUTonlywhentheofficersarepresent.Thespillover(“Halo”)effectofenforcementhasbeenobservedtobeaslittleasafewminutesandrarelyaslongasaweek.
• Oneapproachtochangingdriverperceptionofspeedinvolvesaddingpavementmarkings(toprovideanillusionofspeed),reinforcingpavementmessages,verticalelementsanddynamicsigning.Theresultsoftheseattempts(seetable)haveproven,inmostcases,tobeverylimited.
• Asecondapproachtochangingdriverperceptioninvolvesreconstructingtheroadwaytoadddesignelementsthatreinforcethenotionofanurbanenvironmentandlowerspeedsthataretypicalintheseareas.Atypicaloperatingspeedonatwo-lanesuburbanroadisinthe40to45mphrangebutonasimilartwo-laneurbanroadwithcurb,gutter,andsidewalk,thetypicaloperatingspeeddropstoaround30mph.
Summary of Impacts and Costs of Rural Traffic Calming Treatments
Treatment
Change in 85th Percentile Speed (mph) Cost Maintenance Application
Transversepavementmarkings(1) -2to0 $ Regularpainting Communityentrance
Transversepavementmarkings(1)withspeedfeedbacksigns -7to-3 $$$ Regularpainting Community
entrance
Lanenarrowingusingpaintedcenterislandandedgemarking -3to+4 $ Regularpainting Entranceorwithin
community
Convergingchevrons(1)and“25MPH”pavementmarkings -4to0 $ Regularpainting Community
entrance
Lanenarrowingusingshouldermark-ingsand“25MPH”pavementlegend -2to4 $ Regularpainting Entranceorwithin
community
Speedtable -5to-4 $$ Regularpainting Withincommunity
Lanenarrowingwithcenterislandusingtubularmarkers -3to0 $$$ Tubesoftenstruck
needingreplacementWithincommunity
Speedfeedbacksign(3monthsafteronly) -7 $$$ Troubleshooting
electronicsEntranceorwithincommunity
“SLOW”pavementlegend -2to3 $ Regularpainting Entranceorwithincommunity
“35MPH”pavementlegendwithredbackground(1) -9to0 $
Backgroundfadedquickly;acceleratedrepaintingcycle
Entranceorwithincommunity
Traffic Calming on Main Roads Through Rural Communities, FHWA-HRT-08-067, Krammes, R., 2009
(1)ExperimentalapprovalrequiredperSection1A.10ofMUTCD.
$ =under$2,500$$ =$2,500to$5,000$$$=$5,000to$12,000
Designing Roads That Guide Drivers to Choose Safety Speeds, Iran, J. & Garrick, N., Connecticut Transportation Institute, 2009
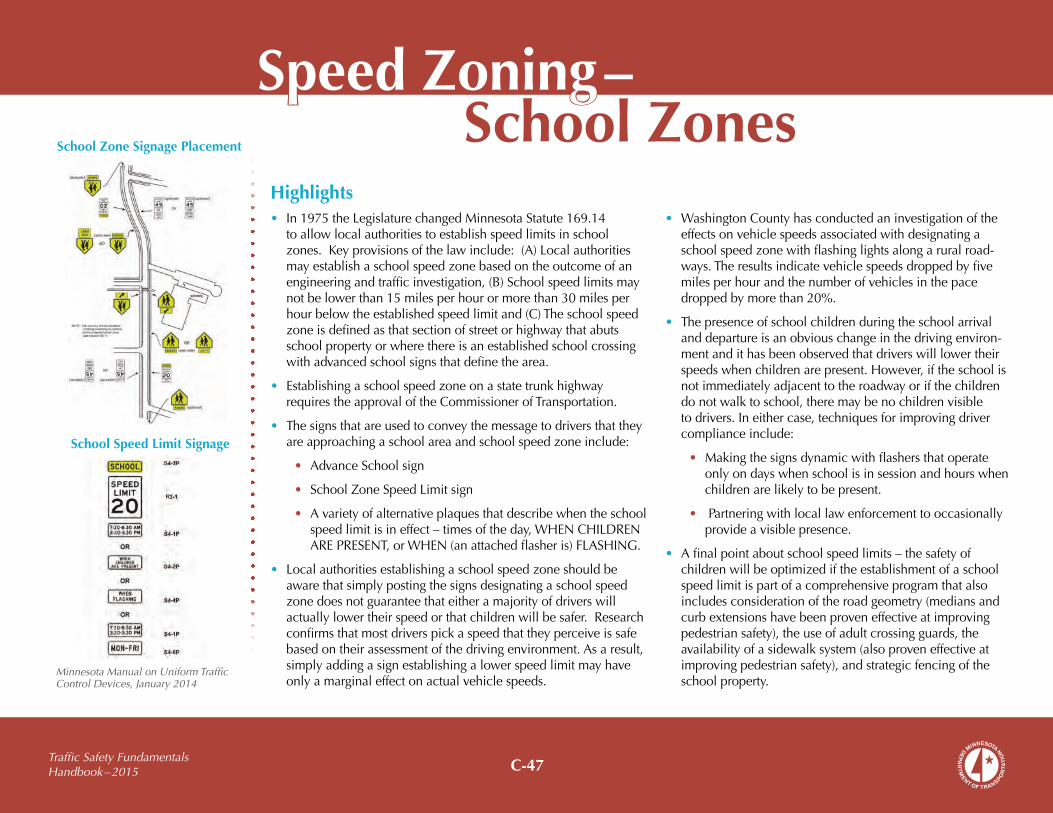
C-47Traffic Safety Fundamentals Handbook – 2015
Highlights• In1975theLegislaturechangedMinnesotaStatute169.14
toallowlocalauthoritiestoestablishspeedlimitsinschoolzones.Keyprovisionsofthelawinclude:(A)Localauthoritiesmayestablishaschoolspeedzonebasedontheoutcomeofanengineeringandtrafficinvestigation,(B)Schoolspeedlimitsmaynotbelowerthan15milesperhourormorethan30milesperhourbelowtheestablishedspeedlimitand(C)Theschoolspeedzoneisdefinedasthatsectionofstreetorhighwaythatabutsschoolpropertyorwherethereisanestablishedschoolcrossingwithadvancedschoolsignsthatdefinethearea.
• EstablishingaschoolspeedzoneonastatetrunkhighwayrequirestheapprovaloftheCommissionerofTransportation.
• Thesignsthatareusedtoconveythemessagetodriversthattheyareapproachingaschoolareaandschoolspeedzoneinclude:
• AdvanceSchoolsign
• SchoolZoneSpeedLimitsign
• Avarietyofalternativeplaquesthatdescribewhentheschoolspeedlimitisineffect–timesoftheday,WHENCHILDRENAREPRESENT,orWHEN(anattachedflasheris)FLASHING.
• Localauthoritiesestablishingaschoolspeedzoneshouldbeawarethatsimplypostingthesignsdesignatingaschoolspeedzonedoesnotguaranteethateitheramajorityofdriverswillactuallylowertheirspeedorthatchildrenwillbesafer.Researchconfirmsthatmostdriverspickaspeedthattheyperceiveissafebasedontheirassessmentofthedrivingenvironment.Asaresult,simplyaddingasignestablishingalowerspeedlimitmayhaveonlyamarginaleffectonactualvehiclespeeds.
Speed Zoning – School Zones
• WashingtonCountyhasconductedaninvestigationoftheeffectsonvehiclespeedsassociatedwithdesignatingaschoolspeedzonewithflashinglightsalongaruralroad-ways.Theresultsindicatevehiclespeedsdroppedbyfivemilesperhourandthenumberofvehiclesinthepacedroppedbymorethan20%.
• Thepresenceofschoolchildrenduringtheschoolarrivalanddepartureisanobviouschangeinthedrivingenviron-mentandithasbeenobservedthatdriverswilllowertheirspeedswhenchildrenarepresent.However,iftheschoolisnotimmediatelyadjacenttotheroadwayorifthechildrendonotwalktoschool,theremaybenochildrenvisibletodrivers.Ineithercase,techniquesforimprovingdrivercomplianceinclude:
• Makingthesignsdynamicwithflashersthatoperateonlyondayswhenschoolisinsessionandhourswhenchildrenarelikelytobepresent.
• Partneringwithlocallawenforcementtooccasionallyprovideavisiblepresence.
• Afinalpointaboutschoolspeedlimits–thesafetyofchildrenwillbeoptimizediftheestablishmentofaschoolspeedlimitispartofacomprehensiveprogramthatalsoincludesconsiderationoftheroadgeometry(mediansandcurbextensionshavebeenproveneffectiveatimprovingpedestriansafety),theuseofadultcrossingguards,theavailabilityofasidewalksystem(alsoproveneffectiveatimprovingpedestriansafety),andstrategicfencingoftheschoolproperty.
Minnesota Manual on Uniform Traffic Control Devices, January 2014
School Zone Signage Placement
School Speed Limit Signage

C-48Traffic Safety Fundamentals Handbook – 2015
Highlights• Nationalresearchsuggeststhatthemosteffectivespeedmanagementstrategy,Automated
SpeedEnforcement,resultsinbothlowerspeedsandfewercrashes.Crashreductionsintherangeof15to50%havebeendocumented.AutomatedSpeedEnforcementiscurrentlyusedin14statesbutnotMinnesota,eventhoughpublicopinionpollsshowsupport.
• AccordingtoNHTSA,acrashonaroadwithaspeedlimitof65mphorgreaterismorethantwiceaslikelytoresultinafatalitythanacrashonaroadwithaspeedlimitof45or50mphandnearlyfivetimesaslikelyasacrashonaroadwithaspeedlimitof40mphorbelow.
• CongressrepealedtheNationalMaximumSpeedLimitoninterstatehighwaysin1995.In2014,fourstateshaveraisedpostedlimitstoashighas80mphorextendedmaximumlimitstomoreroads.Inall,38stateshavespeedlimitsof70mphorhigheronsomeportionoftheirroads,despiteresearchshowingthatanincreaseintrafficdeathswasattributabletoraisedspeedlimitsonallroadtypes(www.iihs.org/iihs/sr/statusreport/article/49/6/3).
• Strategiesthathavebeenusedtoaddressspeedinginclude:
• Stepped-uphigh-visibilityspeedenforcement(HVE)suchasMinnesota’sStatewideSpeedEnforcementDayandspeedcampaigninvolvingenforcementagenciesacrossthestatefocusingonspeedviolationsinthesummermonths,thedeadliesttimeonMinne-sotaroads.HVEhasdemonstratedanabilitytoreducethenumberofdriversexceedingthespeedlimitbymorethan10milesperhourbyapproximately30%.However,itwasalsodeterminedthattheeffectofthistypeofsaturationenforcementdiminishedovertime(the“HaloEffect”).ObservedcrashreductionsassociatedwithHVEareintherangeof3%to5%ofallcrashesduringtheevent.
• Publicinformationandeducationprogramsthatpublicizeupcomingenforcementpro-gramsandeducatethepubliconthedangersofspeedandaggressivedriving.
• Increaseemphasisonemployerpoliciesrelatedtodrivingatlegalandsafespeeds.
Speed Strategies
2013 Minnesota Speeding Fact Sheet, Minnesota Department of Public Safety, Office of Traffic Safety, 2014
2014-2019 Minnesota Strategic Highway Safety Plan, Data 2008-2012
Survey of the States: Speeding and Aggressive Driving, 2012, GHSA
Countermeasures That Work: A Highway Safety Countermeasure Guide for State Highway Safety Offices, 2013, NHTSA

C-49Traffic Safety Fundamentals Handbook – 2015
Technology Applications
Highlights• TheFHWAandMnDOThaveinvestedinaconsiderableamountofresearchregardingtheuseofnew
technologytoaddresstrafficoperationsandsafetydeficiencies.
• Advancedtechnologieshavebeensuccessfullydeployedtoaddressfreewaytrafficmanagement,andanewgenerationoftrafficsignalcontrollersandopticaldetectorsareimprovingtrafficflowonurbanarterials.
• Researchiscurrentlyunderwayatseveraluniversities,includingtheUniversityofMinnesota,LRRBtobetterunderstandfactorscontributingtointersectioncrashesinordertodevelopnewdevicesforassistingdriversinselectingsafegapsatuncontrolledintersections,makingsaferturnsatcontrolledintersections,andprovidingadditionalwarningwhendriversviolatetheintersectioncontrol.
• InresponsetoanoverrepresentationofseverecrashesatruralThru/STOPintersections,MnDOTandtheUniversityofMinnesota–Duluthdevelopedandfield-testedanewdynamicwarningsystem–theAdvancedLEDWarningSystemforRuralIntersections(ALERT)1.Thesystemutilizesfourbasictechnologies:
• LEDsigns
• Renewableenergy
• Non-intrusivesensors
• Wirelesscommunication
• Thesystemdetectsthepresenceofvehiclesapproachingtheintersectiononboththemajor(Thru)andminor(STOP)approachesthatactivatesflashinglightsonaseriesofWarningsignsandtheSTOPsign.
• Anevaluationofthesystem’sperformancefoundthatvehiclespeedsonthemajorapproachwerereducedandthenumberofvehiclesthatrolledthroughtheSTOPsignwaseliminatedwhenaconflictexistedintheintersection.
• Theevaluationdidnotconsidercrashesbecausethereweretoofewcrashesatthesingleintersectionselectedforthefieldoperationaltesttobeconsideredstatisticallyreliable.
1MnDOTReportNo.2014-10,Advanced LED Warning System for Rural Intersections: Phase 2 (ALERT-2)

C-50Traffic Safety Fundamentals Handbook – 2015
Highlights• ThelegallimitfordrivingwhileimpairedinMinnesotais0.08–butmotoristscanbearrestedforDWIatlowerlevels.
Abloodalcoholconcentration(BAC)of0.08oraboveisacriminaloffenseand,inMinnesota,isaviolationofcivillawthattriggersautomaticdriverlicenserevocationforuptoayear.
• OfalloffendersinMinnesota,thevastmajority–nearly60%–arefirst-timeoffenders;nearly40%ofoffendersarerepeatoffenderswithoneormoreDWIsonrecord.OneoutofeverysevenlicenseddriversinMinnesotahasatleastoneDWI.
• Strategiesthatareproveneffectiveatdecreasingimpaireddrivinginclude:
• High-visibilityimpaired-drivingenforcementsuchasthenationwideDriveSoberorGetPulledOverdrunkdrivingcrackdownscombininghighvisibilitylawenforcementandpublicawarenesstodeterordetectdrunkdrivers.Researchshowsthathigh-visibilityenforcementcanreducedrunkdrivingfatalitiesbyasmuchas20%.
• Nighttimebeltenforcement.(Note:Eachyear,nearly70%ofdrinkingdriverskilledincrashesarenotbuckledup).
• AlcoholignitioninterlockstoseparatedrinkingdriversfromtheirvehicleandreducerepeatDWIoffenders.
− Ignitioninterlockshavebeenshowntoreducere-arrestbyarangeof50%to90%.
− InMinnesota,allrepeatDWIoffenders–andfirst-timeoffendersarrestedattwicethelegallimit–mustusealcoholignitioninterlocksorfaceatleast1yearwithoutadriver’slicense.
− In2012,therewere28,418impaired-drivingincidentsinMinnesotaand4,050interlockswereinuse.
− Bycomparison,sevenstateshavemorethan20,000interlocksinuse,ledbyTexas(38,000),andthreestatesdonotuseinterlocks(NorthDakota,MississippiandAlabama).
− Twostateshaveaninterlock-in-usetoDWIratiogreaterthan1.0–Washington(2.5)andNewMexico(1.1).Minnesota’sratiois0.2.
• Administrativelicenserevocation/suspension(immediatelicenserevocation/suspensionuponfailureorrefusalofaBACtest).
• DWIanddrugcourtstocloselymonitoroffendersandtheirtreatment.
• ScreeningandbriefinterventiontechniquesbythecourtsforDWIoffenders.
• TechnicalassistanceandsupporttothosewhoprosecuteDWIoffenses.
Impaired Driver Strategies
2013 Minnesota Impaired Driving Fact Sheet, Minnesota Department of Public Safety, Office of Traffic Safety, 2014
2014-2019 Minnesota Strategic Highway Safety Plan, Data 2008-2012
2012 Impaired Driving Crash Facts, Minnesota Department of Public Safety, Office of Traffic Safety, 2013
Countermeasures That Work: A Highway Safety Countermeasure Guide for State Highway Safety Offices, NHTSA, 2013
Ignition Interlocks – What You Need to Know, DOT HS 811 883, NTSA, 2014
NHTSA: www.trafficsafetymarketing.gov/laborday2014peak

C-51Traffic Safety Fundamentals Handbook – 2015
Highlights• Inattentionhasbeenfoundtocontributetoapproximately19%ofseverecrashesandMinnesotalawenforcement
expectsdriverinattentionordistractionasbeingsignificantlyunderreported.
• Strategiestoreducedistracteddrivinginclude:
• Stepped-up high-visibility enforcement (HVE)ofdistracteddrivinglaws,includingroutinetrafficpatrolsthatincludedistracteddrivingenforcementtotargetedeffortsfocusedonspecificeventssuchasthenationalannualDistractedDrivingAwarenessMonthcampaign.
• Focusing on high-risk young drivers and using social mediasuchasTwitter,YouTube,andFacebook,inadditiontotraditionalmedia,tomoreeffectivelycommunicatethesafetyrisksandchangingsocialnormsassociatedwithsmartphones,aswellasotherdistractions.
• Strengthening public/private partnershipstoreinforcesafedrivingpractices.Minnesota,similartoCalifornia,Nebraska,andTexas,isworkingwithitsstateaffiliateoftheNationalSafetyCounciltoprovideanddevelopedu-cationanddistracteddrivingpoliciestomajoremployers–theMinnesotaTowardsZeroDeathProgram.
• Improving crash data collectiontomoreaccuratelydeterminethemagnitudeandimpactofdistracteddrivingandtosupportthedevelopmentofsafetysolutions.
• Challengestoreducingandenforcingdistracteddrivinginclude:
• Themotoringpublic’sunwillingnesstoputdowntheirphones,despiterecognizingthedangersofdistracteddriving.
• Enforcementofficers’abilitytodiscernwhetheramotorististextingordialingaphone,asthelatterispermittedinMinnesotaandinmoststates.
• Distracteddrivingisunder-reportedduetodriverreluctancetoadmitbeingdistracted.
• Thelackoffundingforenforcement,media,andpubliceducation.
Inattention Strategies
Distracted Driving: Survey of the States, 2013, GHSA
2013 Inattentive Driving Facts, Minnesota Office of Traffic Safety
2014-2019 Minnesota Strategic Highway Safety Plan, Data 2008-2012
Countermeasures That Work: A Highway Safety Countermeasure Guide for State Highway Safety Offices, NHTSA, 2013
Distracted Driving High-Visibility Enforcement Demonstrations in California and Delaware, 2014, DOT HS 811 993
Four High Visibility Enforcement Waves in Connecticut and New York Reduce Hand-Held Phone Use, 2011, DOT HS 811 845.

C-52Traffic Safety Fundamentals Handbook – 2015
Highlights• Minnesota’sseatbeltlawisaprimaryoffense,meaningdriversandpassengersinallseating
positionsmustbebuckleduporinthecorrectchildrestraintorlawenforcementwillstopandticketunbelteddriversorpassengers–includingthoseinthebackseats.
• Minnesotaoccupantrestraintusagerateis95%(June,2013)–thehighestinMinnesotahistory.Nationally,seatbeltuseismuchlower(86%in2012).
• Properlywearingaseatbeltreducestheriskoffatalinjurytofront-seatpassengersby45%inacarand60%inalighttruck.Seatbeltsarethemosteffectivemeansofprotectingoneselffrominjuryintheeventofacrash.
• Inacrash,oddsaresixtimesgreaterforinjuryifamotoristisnotbuckledup.
• Minnesotansthatareleastlikelytobuckleupandmorelikelytodieincrashesareyoungervehicleoccupantsages15to29,whoannuallyaccountfornearly43%ofallunbelteddeathsandnearly50%ofallunbeltedseriousinjuries–yetthisgrouprepresentsonly23%ofalllicenseddrivers.
• Strategiesthatareproveneffectiveatincreasingoccupantseatbeltuseinclude:
• High-visibilityseatbeltenforcement(incorporatesmediaandpublicoutreachabouttheenforcement)
• Nighttimebeltenforcement
• Focusedenforcementandsupportingoutreachtohigh-risk,low-belt-usegroups.
Unbelted Strategies
2013 Seat Belt Overview, Minnesota Office of Traffic Safety
2014-2019 Minnesota Strategic Highway Safety Plan, Data 2008-2012
Occupant Protection 2012 Traffic Safety Facts, 2014, NHTSA
Countermeasures That Work: A Highway Safety Countermeasure Guide for State Highway Safety Offices, NHTSA, 2013

C-53Traffic Safety Fundamentals Handbook – 2015
Temporary Traffic Control Zones
Highlights • AddressingcrashesintemporarytrafficcontrolzonesisoneofAASHTO’ssafetyfocus
areas.Therewere87,600crashesintemporarytrafficcontrolzonesin2010thatresultedin576fatalitiesand37,476injuries.
• Minnesotaaveragesaround1,900crashesintemporarytrafficcontrolzones,withapproximately20resultingineitherafatalityorseriousinjury.
• CrashesintemporarytrafficcontrolzonesareidentifiedasasafetyfocusareainMinnesota’sStrategicHighwaySafetyPlan.
• Temporarytrafficcontrolzonescanbeachallengefordriversbecauseofavarietyofunexpectedconditions–distractions,congestion,andagreaterdemandformoreprecisenavigation.
• AreviewofMinnesota’stemporarytrafficcontrolzonecrashesfoundthatthemostfrequenttypeisarear-endcrash,andcommoncontributingfactorsincludeinattention(30%)andspeeding(26%).
• Providinganeffectivespeedlimitintemporarytrafficcontrolzonesisextremelyimportant,butitmustbenotedthatsigningalonewillnotreducevehiclespeeds.Driversmustclearlyperceivetheneedtoreducespeedbasedontheirreactiontothedesignoftheapproachandtheplacementoftrafficcontrolandchannelizingdevices.Considerationshouldalsobegiventohavinganenforcementpresencetofurtherencouragedriverstoslowdown.

C-54Traffic Safety Fundamentals Handbook – 2015
Highlights • Therearethreemethodsofspeedlimitsigningfortemporarytrafficcontrolzones:
AdvisorySpeeds,24/7ConstructionSpeedLimits,andWorkersPresentSpeedLimits.
• Advisory Speeds:AdvisoryspeedplaquescombinedwithWarningsignsnotifydriversofpotentiallyhazardousconditions,suchasbypasses,laneshifts,lowandnoshoulders,andwherevisibilitymaybereducedduetoworkactivities.TheuseofadvisoryspeedplaquesdoesNOTrequireauthorizationfromtheCommissionerofTransportation
• 24/7 Construction Speed Limit:Regulatoryspeedlimitsthatremaininplaceona24-hourbasisandrequireanorderfromtheCommissionerofTransportation.Thesespeedlimitsareusedwherethephysicalfeaturesoftheroadrequirelowervehiclespeeds,suchasbypassesoratwo-lane/two-wayoperationonwhatisnormallyafour-lanedividedhighway.
• Workers Present Speed Limit:Regulatoryspeedlimit,butdoesNOTrequireauthorizationfromtheCommissionerofTransportation.MinnesotaStatute169.14.5d.(c)allowslocalroadagenciestosetatemporarytrafficcontrolzonespeedlimitwhenworkersarepresentandworkingdirectlyadjacenttotravellanes.
• Minnesotasetsafineof$300forviolationofaregulatoryspeedlimitinatemporarytrafficcontrolzone.Asaresult,anENDWORKZONESPEEDLIMITorENDROADWORKsignmustbeusedtoindicatetheendofthehigher-finearea.
• MnDOTresearchsupportsthenotionthatsigningalonewillnotreducevehiclespeeds.Inadditiontousingthedesignoftheapproachtothetemporarytrafficcontrolzoneandtheplacementofchannelizingdevicestoconveyamessagetoslowdown,twootherstrategieshavebeenshowntoachievespeedreductions:thepresenceoflawenforce-mentandtheuseofdynamicspeedfeedbacksigns.
Temporary Traffic Control Zones
A“WhenWorkersPresent”speedlimitof45mphisrequiredwhen:
1.Atleastaportionofentirelaneisclosed
2.Workersarepresent
Itisnotrequiredif,
1. Positivebarriersareplacedbetweenworkersandtraveledlanes
2.Workzoneisinplaceforlessthan24hours
3.A24/7speedlimitisestablished
4.Areducedspeedlimitisauthorizedbytheroadauthoritywhenworkersarepresent
Minnesota Manual on Uniform Traffic Control Devices, January 2014

C-55Traffic Safety Fundamentals Handbook – 2015
Average Crash Costs
Highlights• MnDOTusesthefollowingcomprehensive
crashcostswhencomputingtheexpectedben-efitsassociatedwithroadwayandtrafficcontrolimprovements.
• Thecostsshownweredevelopedin2013byMnDOTonapercrashbasisforuseincalculatingbenefit/costcomparisonsonly.Thecostsincludeeco-nomiccostfactorsandameasureofthevalueoflostqualityoflifethatsocietyiswillingtopaytopreventdeathsandinjuriesassociatedwithmotorvehiclecrashes.CostsreflectMinnesota’s3-yearcrashhistoryandtheUSDOTprocedurescontainedinRevised Department Guidance 2013: Treatment of the Value of Preventing Fatalities and Injuries in Preparing Economic Analyses.
• Duetotheveryhighcostforfatalcrashesandtheeffectthiscanhaveontheoutcomeofbenefit/costanalyses,itisthepracticeinMinnesotatovaluefatalcrashesas2x”SeverityACrash”($1,100,000percrash)unlessthereisahighfrequencyoffatalcrashesofatypesusceptibletocorrectionbytheproposedaction.
$
$
$
$
$
10,300,000 Per FATAL Crash
550,000 Per SEVERITY A Crash
160,000 Per SEVERITY B Crash
81,000 Per SEVERITY C Crash
7,400 Per PROPERTY DAMAGE ONLY Crash
Developed by MnDOT Office of Traffic, Safety and Technology
Incapacitating Injury
Non-incapacitating Injury
Possible Injury

C-56Traffic Safety Fundamentals Handbook – 2015
Crash Reduction Benefit/Cost(B/C) Ratio Worksheet
Highlights• Comparingtheexpectedcrashreductionbenefitsofapar-
ticularsafetycountermeasuretotheestimatedcostofimple-mentationisanacceptedanalyticaltoolusedinevaluatingalternativesatonelocationortoaidintheprioritizationofprojectsacrossasystem.
• Thebasicconceptistogivepreferencetotheproject(s)thatproducedthegreatestbenefitfortheleastamountofinvest-ment.
• Theworksheetcalculatesbenefitsastheexpectedreductionincrashcostsonanannualbasisandcomparesthisvaluetotheannualizedvalueoftheestimatedconstructioncost.
• Themethodologyonlyaccountsforbenefitsassociatedwithcrashreduction.However,theprocesscouldberevisedtoalsoaccountforotherbenefits,suchasimprovedtrafficoperations(reduceddelayandtraveltimes).
• Itshouldbenotedthatbenefit/costanalysisdoesnotattempttoaccountforallpotentialbenefitsassociatedwithanyparticularproject,sincesomeeconomicandsocialbenefitsareverydifficulttoquantify.
• Substantialresearchisdedicatedtodevelopingcrashmodi-ficationfactors(CMFs)toquantifytheimpactofvarioussafetystrategies.Nationwide,CMFstudiesarestoredattheCMFClearinghouse(www.cmfclearinghouse.org)andshouldbeusedtoestimatetheimpactsofvarioussafetystrategieswhenconductingabenefit-coststudy.
Note:TheExcel™spreadsheetfilemaybedownloadedfromMnDOT’sWebsite

C-57Traffic Safety Fundamentals Handbook – 2015
Typical Benefit/Cost Ratios for Various Improvements
Highlights• TheFHWAhasdocumentedthebenefit/costratios
foravarietyoftypicalsafety-relatedroadwayimprovements.
• Typicalbenefits/costsrangedfrom1.9forskidoverlaysto21.0forillumination.
• Thesebenefits/costsshouldonlybeusedasaguideandnotasthedefinitiveexpectedvalueatanyparticularlocationinMinnesota.
• Benefits/costsintherangeof2to21wouldlikelyonlybeachievedatlocationswithcrashfrequenciessignificantlyhigherthantheexpectedvalues.
• MnDOT-fundedsafetyresearchhasdocumentedbenefits/costsforavarietyofsafetyprojects,including:
• Streetlightingatruralintersections(21:1)
• Cablemedianbarrieralongfreeways(10:1)
• Accessmanagement(intherangeof3:1to1:1)
Rank Construction Classification B/C Ratio1 Illumination 21.0
2 RelocatedBreakawayUtilityPoles 17.2
3 TrafficSigns 16.3
4 UpgradeMedianBarrier 13.7
5 NewTrafficSignals 8.3
6 NewMedianBarrier 8.3
7 RemoveObstacles 8.3
8 ImpactAttenuators 7.8
9 UpgradeGuardrail 7.6
10 UpgradedTrafficSignals 7.4
11 UpgradedBridgeRail 7.1
12 SightDistanceImprovements 7.0
13 GroovePavementforSkidResistance 5.6
14 ReplaceorImproveMinorStructure 5.2
15 TurningLanesandTrafficSeparation 4.4
16 NewRailRoadCrossingGates 3.9
17 ConstructMedianforTrafficSeparation 3.3
18 NewRailRoadCrossingFlashingLights 3.2
19 NewRailRoadFlashingLightsandGates 3.0
20 UpgradeRailRoadFlashingLights 2.9
21 PavementMarkingandDelineations 2.6
22 FlattenSideSlopes 2.5
23 NewBridge 2.2
24 WidenorImproveShoulder 2.1
25 WidenorModifyBridge 2.0
26 RealignRoadway 2.0
27 OverlayforSkidTreatment 1.9
FHW
A, H
ighw
ay S
afet
y Ev
alua
tion
Syst
em (A
pril
14, 1
999)
D-1
Lessons LearnedSection D
Traffic Safety Fundamentals Handbook – 2015
D-2 Crash Characteristics
D-3 Safety Improvement Process
D-4 Traffic Safety Tool Box

D-2
Lesson Learned – Crash Characteristics
Highlights• AttheNationallevelthenumberoftraffic-relatedfatalitiesduringthepast10
yearshasdroppeddramaticallyfromalmost43,000deathstojustunder33,000.
• Overthissame10-yearperiod,thetrendinMinnesotaissimilar–thenumberoftraffic-relatedfatalitieshasdeclinedfromover650trafficfatalitiestofewerthan400peryear.
• In2013thenationalfatalityratewas1.1fatalitiesper100millionvehiclemilestraveledandtherangewas0.6to1.9.Minnesota’sfatalcrashratewas0.7–thesecondlowestinthecountryandthelowestofanystatenotinthenortheast.
• FatalcrashesinMinnesotaarenotdistributedevenlyacrossthestate–66%offatalitiesareinruralareasandthefatalityrateonruralroadsisnearly3timestherateinurbanareas.
• Thenationalsafetyperformancemeasureisthenumberofsevereinjuries–fatalitiesplusincapacitatinginjuries.
• Factorsthatcontributetoseverecrashesinvolvedrivers,theroadwayandvehicles.Driverbehaviorisafactorinmorethan90%ofcrashes,roadwayfeaturesareafactorinslightlymorethanone-thirdofcrashesandvehiclefailuresareafactorinaround10%ofcrashes.
• Theadoptionofthenewsafetyperformancemeasurewithafocusonseverecrasheshasresultedinabetterunderstandingofthefactthatfatalcrashesaredifferentthanlessseverecrashes.Themostcommontypeofcrashisarear-end(31%ofallcrashes);however,themostcommontypesoffatalcrashesincluderun-off-road(32%),anglecrashes(21%)andhead-oncrashes(20%).
• Crashesarenotevenlydistributedacrossthepopulationofdrivers–youngdrivers(underage21)representabout6%ofalldriversbutareinvolvedinalmost11%ofcrashes.
Traffic Safety Fundamentals Handbook – 2015
• Mostcrashesoccurondryroadsingoodweatherandduringdaylightconditions–it’safunctionofexposure.However,nighttimehourspresentagreaterriskforseverecrashes–25%ofallcrashesoccurduringdarkconditionsbut31%offatalcrashesoccurduringthehoursofdarkness.
• Contrarytopopularopinion,signalizedintersectionsarerarelysafetydevices.Theaveragecrashrate,severityrate,andcrashdensityishigheratsignalizedintersectionscomparedtothestatisticsforSTOP-controlledlocations.
• Themostcommontypesofintersection-relatedcrashesarerear-endandrightangle.Theinstallationofatrafficsignalchangesthecrashtypedistribution–increasingrear-endandleftturncrashes.However,thefractionofrightanglecrashesremainsvirtuallyunchanged–thereisasubstantialandwidespreadprobleminvolvingred-lightrunning.
• Crashratesonroadwaysegmentsareafunctionoflocation(ruralvs.urban),design(conventionalvs.expresswayvs.freeway)andthedegreetowhichaccessismanaged.Ruralfreewaysandtwo-laneroadshavethelowestcrashrates,urbanminorarterialshavethehighestcrashrates,andruralcountyhighwaysandtown-shiproadshavethehighestfatalcrashrates.
• Urbancrashesarepredominantlytwovehicle(rear-endandrightangle)andruralcrashesarepredominantlysinglevehicle(run-off-roadanddeerhits).
• Withindesigncategoriesofroads(ruraltwo-lane,urbanfour-lane,expressway,etc.)thedensityofaccesscanbeusedtopredictcrashrates–segmentswithhigheraccessdensitieshavehighercrashratesinbothruralandurbanareas.
• Severeinjurycrashesinvolvingpedestriansandbicyclistsaccountforapproxi-mately14%ofallseverecrashesinMinnesota.Nearlytwo-thirdsofthesecrashesoccurintheMinneapolis-St.PaulMetropolitanAreaandthemajorityoftheseoccuronstreetswitha30MPHspeedlimitandatintersectionscontrolledbytrafficsignals.

D-3Traffic Safety Fundamentals Handbook – 2015
Lesson Learned – Safety Improvement Process
Highlights• MnDOT’sStrategicHighwaySafetyPlan(SHSP)isadata-drivendocumentthat
adoptsseverecrashesasthesafetyperformancemeasure(fatalandincapacitatinginjurycrashes).TheSHSPalsoadoptsashort-termsafetygoal–300orfewerfatalitiesby2020andthelong-termgoalofzerofatalities.
• TheSHSPidentifiedsevenprimarysafetyemphasisareasforMinnesota:trafficsafetyculture,safetybelts,impaireddriving,speeding,inattentive,intersectionsandlanedeparture.
• Inurbanareastheprimaryfactorsassociatedwithfatalcrashesareintersectionsandtheuseofsafetybelts;andinruralareastheprimaryfactorsaresafetybelts,impairmentandroaddepartures.
• Acomprehensivesafetyimprovementprocessincludesbothasiteanalysisathighcrashlocationsfocusedonreactiveimplementationofsafetystrategiesandasystemwideanalysisfocusedonproactivelyimplementinggenerallylow-costsafetystrategiesbroadlyacrossprioritylocationsalonganagency’ssystemofroads.
• Therecommendedanalyticalmethodforconductingadetailedstudyofanindividuallocationinvolvescomparingtheactualcrashcharacteristicstotheexpectedcharacteristicsandthenevaluatingthedifferences.Itisimportanttonotethattheexpectedcrashfrequencyofanygivenlocationisneverzero.
• Ofthethreetraditionalmethodsforidentifyingpotentiallyhazardouslocations(numberofcrashes,crashrate,andcriticalcrashrate),thecriticalcrashrateisthemoststatisticallyreliable,butthisisalsothemostdata-intensivemethod.However,theuseofanymethodisbetterthannotconductingaperiodicsafetyinventory.
• Therecommendedmethodforconductingsystemwidesafetyanalysesinvolvesconductingsystemicriskassessments.Thistechniqueisbasedonthepremisethatseverecrashesmaybewidelyscatteredaroundasystem,buttheyarenotran-domlyscattered.Asaresult,areviewoflocationswithseverecrashescanrevealasetofcommonroadwayandtrafficcharacteristics,thepresenceofwhichatlocationswithfewornoseverecrashescanestablishapriorityforsafetyinvest-mentbasedonrisk.
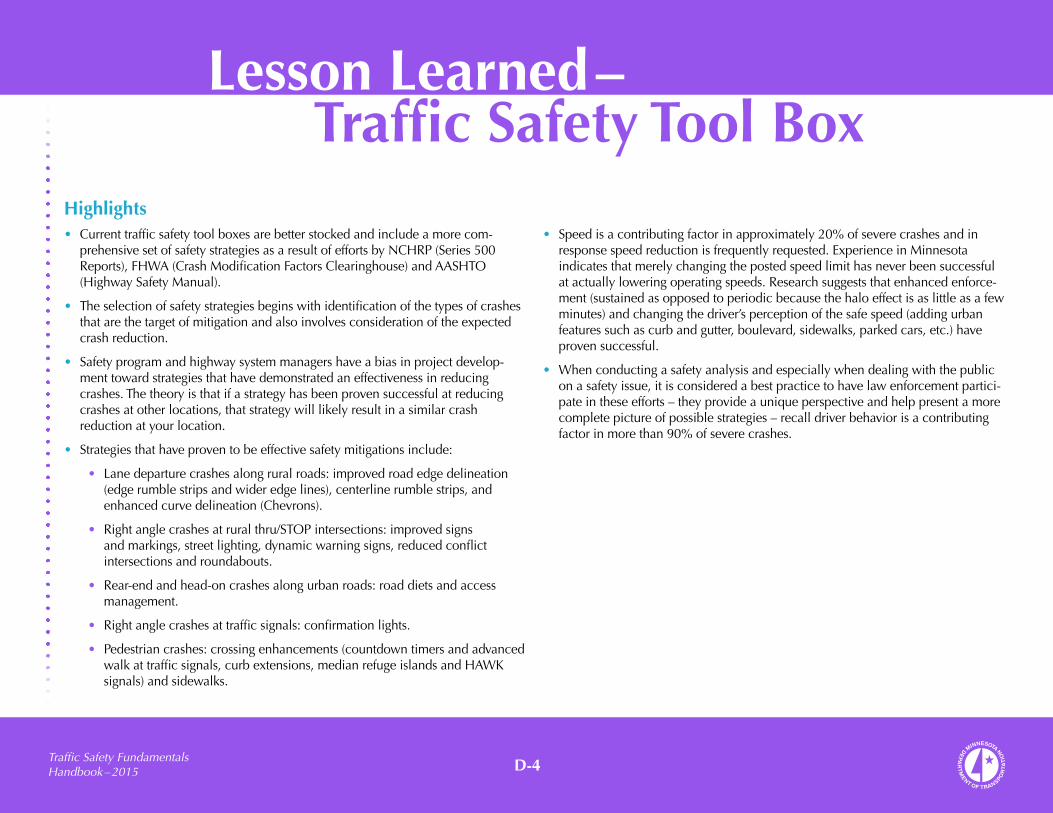
D-4Traffic Safety Fundamentals Handbook – 2015
Lesson Learned – Traffic Safety Tool Box
Highlights• Currenttrafficsafetytoolboxesarebetterstockedandincludeamorecom-
prehensivesetofsafetystrategiesasaresultofeffortsbyNCHRP(Series500Reports),FHWA(CrashModificationFactorsClearinghouse)andAASHTO(HighwaySafetyManual).
• Theselectionofsafetystrategiesbeginswithidentificationofthetypesofcrashesthatarethetargetofmitigationandalsoinvolvesconsiderationoftheexpectedcrashreduction.
• Safetyprogramandhighwaysystemmanagershaveabiasinprojectdevelop-menttowardstrategiesthathavedemonstratedaneffectivenessinreducingcrashes.Thetheoryisthatifastrategyhasbeenprovensuccessfulatreducingcrashesatotherlocations,thatstrategywilllikelyresultinasimilarcrashreductionatyourlocation.
• Strategiesthathaveproventobeeffectivesafetymitigationsinclude:
• Lanedeparturecrashesalongruralroads:improvedroadedgedelineation(edgerumblestripsandwideredgelines),centerlinerumblestrips,andenhancedcurvedelineation(Chevrons).
• Rightanglecrashesatruralthru/STOPintersections:improvedsignsandmarkings,streetlighting,dynamicwarningsigns,reducedconflictintersectionsandroundabouts.
• Rear-endandhead-oncrashesalongurbanroads:roaddietsandaccessmanagement.
• Rightanglecrashesattrafficsignals:confirmationlights.
• Pedestriancrashes:crossingenhancements(countdowntimersandadvancedwalkattrafficsignals,curbextensions,medianrefugeislandsandHAWKsignals)andsidewalks.
• Speedisacontributingfactorinapproximately20%ofseverecrashesandinresponsespeedreductionisfrequentlyrequested.ExperienceinMinnesotaindicatesthatmerelychangingthepostedspeedlimithasneverbeensuccessfulatactuallyloweringoperatingspeeds.Researchsuggeststhatenhancedenforce-ment(sustainedasopposedtoperiodicbecausethehaloeffectisaslittleasafewminutes)andchangingthedriver’sperceptionofthesafespeed(addingurbanfeaturessuchascurbandgutter,boulevard,sidewalks,parkedcars,etc.)haveprovensuccessful.
• Whenconductingasafetyanalysisandespeciallywhendealingwiththepubliconasafetyissue,itisconsideredabestpracticetohavelawenforcementpartici-pateintheseefforts–theyprovideauniqueperspectiveandhelppresentamorecompletepictureofpossiblestrategies–recalldriverbehaviorisacontributingfactorinmorethan90%ofseverecrashes.