![The Effect of Dominion Irrigation Project on Environmental ... · communities whose livelihoods depend solely on the exploitation of these resources [2]. Community irrigation projects](https://static.fdocuments.us/doc/165x107/5fb2d427f736536fdd306f3c/the-effect-of-dominion-irrigation-project-on-environmental-communities-whose.jpg)
TRADITIONAL IRRIGATION SYSTEMS AND LIVELIHOODS OF ...
112
TRADITIONAL IRRIGATION SYSTEMS AND LIVELIHOODS OF SMALLHOLDER FARMERS IN SAME DISTRCT, KILIMANJARO, TANZANIA BY MUSA AKIDA MNYENYELWA A DISSERTATION SUBMITTED IN PARTIAL FULFILMENT OF THE REQUIREMENTS FOR THE DEGREE OF MASTER OF SCIENCE IN AGRICULTURAL ECONOMICS OF SOKOINE UNIVERSITY OF AGRICULTURE. MOROGORO, TANZANIA. 2008
Transcript of TRADITIONAL IRRIGATION SYSTEMS AND LIVELIHOODS OF ...

TRADITIONAL IRRIGATION SYSTEMS AND LIVELIHOODS OF
SMALLHOLDER FARMERS IN SAME DISTRCT, KILIMANJARO,
TANZANIA
BY
MUSA AKIDA MNYENYELWA
A DISSERTATION SUBMITTED IN PARTIAL FULFILMENT OF THE
REQUIREMENTS FOR THE DEGREE OF MASTER OF SCIENCE IN
AGRICULTURAL ECONOMICS OF SOKOINE UNIVERSITY OF
AGRICULTURE. MOROGORO, TANZANIA.
2008

ABSTRACT
This study presents the impact of traditional irrigation on the household livelihood
in Same district, Kilimanjaro region. The overall objective of this study was to
assess the contribution of traditional irrigation systems to the well-being of
smallholder farmers. The specific objective was to examine the contribution of
traditional irrigation in improving household food security and income; determine
the profitability of crop production enterprises with and without traditional
irrigation systems. Both secondary and primary data were collected and the main
instruments for data collection as structured questionnaire. Data were summarized
and analysed statistically using descriptive statistics. Indicators of livelihood that
were used in assessing the impact of traditional irrigation; were household income
and food security. The results show that farmers adopt traditional irrigation system
due to high crop productivity, and possibility of multiple productions. Multiple
cropping of up to three times per year was possible under traditional irrigation
system. This contributes to ensuring households food security throughout the year.
The difference in income from crop under traditional irrigation and rainfed system
was significant. However, in years with reliable rainfall there was no significant
different in crop yields between traditional irrigation and rain fed system. Based on
the findings of this study it is concluded that, traditional irrigation system contribute
significantly to household food security and reduction of household income
poverty. This is because irrigated area provides possibilities for cultivation of high
value crops and multiple cropping. The main purpose of this study was to explore
the economic issues associated with traditional irrigation farming practice and
develop sustainable management strategies. Infrastructures available in the area and
ii

marketing potentials are important factors for enhanced productivity from
traditional irrigation for food security and income.
iii

DECLARATION
I, MUSA AKIDA MNYENYELWA, do hereby declare to the senate of Sokoine
University of Agriculture that this dissertation is my own original work and that it
has not concurrently being submitted for a higher degree award in any other
university.
____________________ ________________
Musa Akida Mnyenyelwa Date
(MSc Candicate)
The declaration is confirmed.
_________________ __________________
Dr. Evelne, .A. Lazaro (PhD) Date
(Supervisor)
iv

COPYRIGHT
No part of this dissertation may be reproduced, stored in any retrieval system, or
transmitted in any form or by any means; electronic, mechanical, photocopying,
recording or otherwise without prior written permission of the author or Sokoine
University of Agriculture in that behalf.
v

ACKNOWLEDGEMENTS
I wish to acknowledge with deep appreciation the tireless, constant and consistent
guidance and encouragement of my supervisor Dr. Evelyne.A. Lazaro of the
Department of Agricultural Economics and Agribusiness, Sokoine University of
Agriculture.
I am sincerely indebted to BTC whose financial assistance has enabled me to
complete the study of Master Degree in Agricultural Economics and Agribusiness
I believe without their financial support the situation could have been very difficult.
I owe a deep gratitude to all field assistants, TIP staffs Moshi headquarter, Same
and Chome office. I wish also to acknowledge village leaders of Mpirani, and
Maore villages in Maore ward, Mhero and Marieni villages in Chome ward, District
Executive Director and Agriculture office Same district, all together made data
collection possible.
My heartfelt appreciations also go to my beloved wife Safiness Mnyenyelwa who
took care of my family in my absence and for her encouragement, support and help
during the entire period of my study. I also obligated to mention my appreciation to
my children Aloyce and Stephen for the tolerance to the hardship they encountered
while I was away for my studies.
I am grateful to my loving parents, whom I shall always remain greatly indebted to
for their untiring moral support, love, advice, material support and for laying down
vi

concrete foundation of my education, I say “thank you mum and dad” Moreover I
thank my sister Amelina, Brother Barnabas and My young brothers Kilian, Pius and
Godian whose prayers, love an care have always been a source of aspiration, my
strength and encouragement. May the Almighty God bless you always.
I am thankful to all staff and postgraduate students of Agricultural Economics for
their constructive criticism and ideas, company and assistance throughout my study.
Lastly, I wish to thank the Almighty God for allowing me to successfully complete
this study in good health, peace and harmony.
vii

DEDICATION
This dissertation is dedicated to my parents, Regina and Severine Mnyenyelwa who
laid down the foundation for my education and to my dear wife Safiness Simon
Mnyenyelwa for her tireless support, prayers and encouragement.
viii

TABLE OF CONTENTS
ABSTRACT...............................................................................................................ii
DECLARATION.......................................................................................................iv
COPYRIGHT..............................................................................................................v
ACKNOWLEDGEMENTS.......................................................................................vi
DEDICATION.........................................................................................................viii
TABLE OF CONTENTS..........................................................................................ix
LIST OF TABLES....................................................................................................xii
LIST OF FIGURES.................................................................................................xiii
LIST OF PLATES...................................................................................................xiv
LIST OF APPENDICES...........................................................................................xv
LIST OF ABBREVIATION AND SYMBOLS......................................................xvi
CHAPTER ONE.........................................................................................................1
INTRODUCTION......................................................................................................1
1.1 Background information.......................................................................................11.2 Irrigation ..............................................................................................................21.3 Traditional irrigation.............................................................................................21.4 Traditional irrigation and rural livelihood...........................................................31.5 Irrigation potential in Tanzania............................................................................41.6 Problem statement and justification .....................................................................51.7 Objectives.............................................................................................................7
1.7.1 General objective of the study..................................................................71.7.1.1 Specific objectives of the study.................................................81.7.1.2 Hypotheses to be tested..............................................................8
LITERATURE REVIEW...........................................................................................9
2.1Overview of global irrigation.................................................................................92.2 Traditional irrigation and food security..............................................................102.3 Importance of irrigation to livelihood of smallholder farmers...........................112.4 Impact of traditional irrigation on productivity.................................................122.5 Output level.........................................................................................................132.6 Contribution of irrigation to the national economy............................................13
2.7.1 Food security...........................................................................................152.7.1.1 Household food security.........................................................16
ix

2.7.1.2 Food security indicators...........................................................182.7.2 Food insecurity........................................................................................192.7.3 Food availability adequate......................................................................19
2.8 Income of crops from traditional irrigation........................................................202.8.1 Commercialization of products from traditional irrigation.....................20
2.8.1.1 Market of crops produced under tradition irrigation................212.9 Gross margin analysis of agricultural products..................................................22
Gross margin of an enterprise is not necessarily an indication of profitability, but it is only one aspect of enterprise profitability (Young, 1996). Many other items and factors are involved before the ultimate profitability is known. Increasing the intensity of enterprises on a farm may increase the total farm Gross Margin but will not necessarily increase the farm profit since the fixed cost may also rise in greater proportional to gross margin. A higher gross margin may be achieved on a farm but this could lead to a lower profit if the resultant increase in fixed costs were greater than the increase in Gross Margin (Mutero, 1998). Gross margin analysis was used in the comparative study of traditional and modern irrigation systems in Bauchi State of Nigeria. The study revealed that, with the exception of onion, the gross margin for all crops were higher for modern irrigation than in traditional irrigation. ....................................23
2.9.1 Potato production in Europe, a gross margin analysis............................232.9.2 Gross margins analysis for potatoes .....................................................24
2.10 National irrigation development plan..............................................................252.10.1 Factors affecting traditional irrigation.................................................262.10.2 Soil water management in highland......................................................28
2.11 Conceptual framework of the study..................................................................292.12 Traditional irrigation and their benefits............................................................312.13Conclusion.........................................................................................................32CHAPTER THREE..................................................................................................32
RESEARCH METHODOLOGY..............................................................................33
3.1 Overview............................................................................................................333.2 Description of the study area.............................................................................33
3.2.1 Location..................................................................................................333.2.2 Agro-ecological zones...........................................................................353.2.3Climate.....................................................................................................353.2.4Population, ethic groups and social economic activities.........................36
3.3Types and sources of data....................................................................................363.4Sampling methods................................................................................................363.5Data analysis........................................................................................................37
3.5.1 Profitability of crop production enterprises...........................................38CHAPTER FOUR.....................................................................................................39
RESULTS AND DISCUSSION...............................................................................39
4.1Overview .............................................................................................................394.2Demographic characteristics................................................................................39
x

4.2.1 Gender of respondents............................................................................404.2.2 Household age composition....................................................................414.2.3 Marital status of respondents..................................................................414.2.4 Household size........................................................................................414.2.5 Education Level......................................................................................42
4.3Cropping systems.................................................................................................424.3.1Traditional irrigation................................................................................44
4.3.1.1 Sources of water for traditional irrigation................................454.3.1.2 Micro dam technology (Ndiva)................................................454.3.1.3Rivers........................................................................................46
4.3.2 Rain fed ..................................................................................................474.4 Land use management and traditional irrigation................................................484.5 Crops produced...................................................................................................49
4.5.1 Maize.......................................................................................................504.5.2 Beans.......................................................................................................514.5.3 Paddy.......................................................................................................524.5.4 Vegetables ..............................................................................................53
4.6 Contribution of traditional irrigation in improving food security.......................534.6.1 Household food security situation ........................................................534.6.2Crops stored for food...............................................................................54
4.7 Contribution of traditional irrigation to households income ..............................564.7.1 Sources of income from livestock...........................................................564.7.2Crops income under traditional irrigation and rain fed............................574.7.3Income from off-farm activities ..............................................................58
4.8Profitability of crop enterprises...........................................................................594.8.2Crops yield ..............................................................................................604.8.3Crop production costs .............................................................................614.8.4Gross margin of crops from traditional irrigation and rain fed................624.8.5 Profitability of crops produced under traditional irrigation....................64
CHAPTER FIVE......................................................................................................65
CONLUSION AND RECOMENDETIONS............................................................65
5.1Conclusion...........................................................................................................65REFERENCES.........................................................................................................67
APPENDICES..........................................................................................................85
APPENDIX 1: QUESTIONNAIRE FOR SURVEY ON ........................................85
xi

LIST OF TABLES
Table 1: Demographic Characteristics......................................................................40
Table3: Cultivated area and crop yields under traditional irrigation........................49
Table 4: Cultivated area and crop yields under rainfed system................................51
Table5: Households food security situation..............................................................54
Table 6: Crops stored for food in kg.........................................................................55
Table 7: Households income from livestock............................................................56
..................................................................................................................................56
Variable.....................................................................................................................56
No of respondents.....................................................................................................56
Percent.......................................................................................................................56
xii

Mean income.............................................................................................................56
194,946.2...................................................................................................................56
Table 8: Households income from crops..................................................................57
Table 10: Income from off-farm activities................................................................59
Table 11: Crop yields from traditional irrigation and rainfed farming in kg............60
Table 12: GM analysis of crops enterprises from traditional irrigation per acre......62
Table 13: GM analysis of crops enterprises from rainfed per acre ..........................63
LIST OF FIGURES
Figure1: Interrelationship of factors that affect traditional irrigation, modified from
Majule and Mwalyosi, (2003)...................................................................................27
Figure 2: Conceptual framework for the study adopted and modified from ..........31
CARE, (1995)...........................................................................................31
...................................................................................................................................34
xiii

Figure3: A Map of Same district showing location of study wards.........................34
LIST OF PLATES
Plate 1: Micro dam technology (Ndiva), Mhero, Chome ward...........................46
Plate 2: Stone terraces at Mhero (WUGS) in Chome ward.................................46
xiv

LIST OF APPENDICES
APPENDIX 1: QUESTIONNAIRE FOR SURVEY ON Error: Reference source not
found
xv

LIST OF ABBREVIATION AND SYMBOLS
ADSP - Agricultural Sector Development Program
ASD - Agricultural Development Support Program
xvi

ASR - Agricultural Sector Reform
BTC - Belgium Technical Cooperation
CARE - Cooperative for Assistance and Relief Everywhere
DFID - Department for International Development
FAO - Food Agriculture Organization
FNPP - FAO-Netherlands Partnership Programme
GDP - Gross Domestic Product
GM - Gross Margin
IFAD - International Food Agriculture Development
IWMI - International Water Management Institute
JICA - Japan International Cooperative Agency
MAFS - Ministry of Agriculture and Food Security
MAFSC - Ministry of Agriculture Food Security and Cooperative
MALD - Ministry of Agriculture and Livestock Development
MOA - Ministry of Agriculture
NIMP - National Irrigation Master Plan
SNAL - Sokoine National Agricultural Library
SPSS - Statistical Package for Social Sciences
SSA - Sub-Saharan Africa
SUA - Sokoine University of Agriculture
SWMRG - Soil and Water Management Research Group
TIP - Traditional Irrigation Project
TNBS - Tanzania National Bureau Statistics
TR - Total Revenue
xvii

TVC - Total Variable Cost
UNCSD - United Nations Commission on Sustainable Development
URT - United Republic of Tanzania
VECO-TANZANIA - Vre desellanden Country Office-Tanzania
WUG - Water User Groups
xviii

CHAPTER ONE
INTRODUCTION
1.1 Background information
In Tanzania food production largely depends on rain fed agriculture (URT, 2001).
However, food production fluctuates from year to year, due to erratic and unreliable
rainfall (URT, 2001). Traditional irrigation will assume an important role towards
transforming the predominantly traditional subsistence rain-fed agricultural into
profitable and commercial agriculture (URT, 2006). According to the National
Irrigation Master Plan (2002), when rainfall decreases, food production also
decreases. Producing food by rain fed will not reduce food insecurity and income
poverty, since rain is unpredictable in many parts of our country (Adams et al.
1994). Traditional irrigation has been reported to supplement food and income
generation from rain-fed farming (TIP, 2004).
Tanzania’s economy is dependent mainly on agriculture. More than 80 percent of
the population is engaged in agriculture activities for their livelihood and it
contribute to an average of 43.4 percent of Gross Domestic Product (GDP), (URT,
2006; World fact book, 2007). Agriculture in Tanzania is mainly rain fed and this is
undertaken by farmers, sometimes in semi-arid areas, with less than 800 mm of
rainfall (Baba, 1993; Kangalawe and Liwenga, 2004). This kind of agriculture is
severely constrained by drought, which significantly reduces crop yields
(Kaswamila and Masuruli 2004). Irrigation development is an effective way to
increase crop production and productivity that may result into food self-sufficient
and income poverty reduction in the country (URT, 2005). The government of
Tanzania well thought-out irrigation to be the most important aspects in attaining
1

agricultural development, as a result brought the question of irrigation to be the
forefront in their agricultural priorities (Soil Water Management Research Group,
2005).
1.2 Irrigation
The term irrigation has been defined under different perspectives and contexts.
Generally however the term irrigation is associated with the artificial application of
water to the soil for the purpose of improving crop productivity. Ojungu (1992)
defined irrigation as a practice in which people, deliberately supply water and store
surplus water in a controlled manner, so as to supplement rain or ground water and
sustain or improve crop production in a cultivated field. Ojungu (1992) also
reported that irrigation has mainly been practiced in the arid and semi-arid climates
where rainfall is scarce.
1.3 Traditional irrigation
Nhkoma (1998) defined traditional irrigation as application of water to crop land
using indigenous water harvesting techniques which are not based on scientific
understanding but locally handed down.
Mrema (1984) defined traditional irrigation as an attempt to harness the available
water from rivers, springs and flood plains for irrigation, it covers relatively small
and scattered areas, also they employ traditional methods and their intake structures
are often temporary, having to be replaced from time to time.
Mintesinot et al. (2004) defined traditional irrigation are mainly gravity flow of
water in which the systems is constructed by villages that use local materials to
2

divert water from a river into a system of canal for irrigation. This study define
traditional irrigation as an attempt to harness the available water from rivers,
springs and flood plains for irrigation, it covers relatively small and scattered areas,
also they employ traditional methods and their intake structures are often
temporary, having to be replaced from time to time Mrema (1984).
1.4 Traditional irrigation and rural livelihood
Most traditional irrigation schemes are found in the homelands in the villages,
where there is incidence of food insecurity (May, 2000; Aliber, 2003). In these
particular socio-economic environments traditional irrigation schemes present an
attractive opportunity for the development of local livelihoods. According to
Chambers and Conway (1992) for example defined livelihoods as comprising
people and their livelihood capabilities; assets, including both the tangible
(resources and stores) and intangible (claims and access), which provide the
material and social means that are used to construct livelihoods; activities, i.e. what
people do; and a living, which refers to the outcomes of what people do. When
viewed from this livelihood perspective, traditional irrigation schemes are assets.
They can be used to increase and diversify the livelihood activity of crop
production, resulting in improved livelihood outcomes, either directly in the form of
food or income for farmers, or indirectly by providing full or partial livelihoods to
people who provide goods and services in support of irrigated agriculture on these
schemes. Livelihood outcomes include conventional indicators such as income,
food security and sustainable use of natural resources. Outcomes can also include a
strengthened asset base, reduce vulnerability and improvement in other aspect of
3

well-being such as health, self-esteem, sense of control, even maintenance of
cultural asset and thus have a feedback effect on the vulnerability status and asset
base.
1.5 Irrigation potential in Tanzania
Using a rigorous mult-parameter analytical process, it is estimated that 2.3 million,
4.8 million and 22.3 million hectares(ha) of land in Tanzania is high, medium and
low irrigation development potential out of the estimated 43 million ha of suitable
land for agriculture in Tanzania (NIMP and JICA, 2002). Currently state year area
under irrigation is only 200 000 hectares (NIMP and JICA, 2002). This area is
dominated by paddy, followed by sugarcane, tea and horticultural crops (NIMP and
JICA, 2002; URT, 2001). In Kilimanjaro region area under irrigation is estimated to
be 27 148 ha, improved irrigation constitute of 16 647 ha, and traditional irrigation
is 10 501 ha (URT, 2002).
There are two major categories of irrigation systems dominant in developing
countries. These are large and small-scale irrigation systems (FAO, 1986). As the
names indicate, the difference between the two is scale. Scale is not only
determined by the spatial coverage of the project but also by the investments
required in terms of capital and technology (Maganga and Juma, 2000). Several
other terms have been used to refer to small scale irrigation systems over time.
These include terms, such as traditional irrigation, indigenous irrigation and local
irrigation (Adam et al, 1994; FAO, 1995). Smallholder farmers use simple and
affordable technology to practice these kinds of irrigation.
4

According to FAO (1997) traditional irrigation is defined as irrigation on small
plots, which are owned and controlled by farmers and the level of technology used
is simple, which farmers can effectively operate and maintain. In this category
much of the diverted water is lost due to seepage before reaching the field. In the
field the irrigation efficiency is normally very low (Kaswamila and Masuruli,
2004). This category covers more than 79 percent of the total irrigated land in
Tanzania (Kaswamila and Masuruli, 2004). Traditional irrigation farming systems
practiced by smallholder farmers in Same district is divided into three types. Sub-
irrigation (valley bottom) also sometimes called seepage irrigation has been used
for many years in field crops in areas with high water tables. It is a method of
artificially raising the water table to allow the soil to be moistened from below the
plants root zone. It is mostly practiced in high lands, characteristically moist for a
long period of the year, allowing the cultivation of multiple annual crops (Region
Agriculture office Moshi, 2001). Surface irrigation is a system which smallholder
farmers distribute water by lined and unlined canals is mostly practiced in lowlands.
Micro dam technology (Ndiva) is the irrigation to impound runoff water by digging
and constructing a wall of stone in earth to keep water bank (embankment) (Soil
Water Management Research Group, 2005).
1.6 Problem statement and justification
Tanzania is endowed with an abundance of natural resource that is yet to be
exploited adequately to contribute towards the improvement of the welfare of the
people and the revitalization of the economy (MAFS, 2003). Water being the
essential resource, irrigation development is one of the effective approaches to
5

increase and stabilize food production thus to contribute towards attaining food
security and self-sufficiency (IWMI, 2001). It seems irrigation is the only option to
boost up and sustain overall agricultural productivity to required level (MAFSC,
2007). Improving performance of irrigation farming would have a stern impact on
poverty reduction through improving incomes, food security, reducing food imports
and increase employment (Lema, 1996).
Since 1980s there had been a number of efforts in Tanzania to promote irrigation
farming in order to increase food security (Mwalyosi and Majule, 2005).These
efforts concentrated on large-scale irrigation schemes, which were often too
mechanized and expensive for most Tanzanian farmers (MAFS, 2004). To mention
few Mbalali, Dakawa, Madibira, Mtibwa, Ruvu, Kapunga, Lower Moshi and
Kilombero (MAFS, 2004). There is ample evidence that most of these schemes or
projects failed partly due to their poor management and environmental degradation
such as sedimentation and salinization (Mwalyosi and Majule, 2005). However,
traditional irrigation that utilizes natural moisture or water from either natural
springs or river diversions has been increasingly practiced as a means of ensuring
food security and income generation to smallholder farmers Adams et al., (1994).
Its contribution has not been met to make farmers become food secured and raise
their income Adams et al., (1994). It is due to this background which necessitated
the study to be undertaken.
The irregular and unreliable rainfall in Same district has caused the smallholder
farmers to intensify the traditional irrigation farming systems as a strategy to cope
with food shortage and income poverty. Studies done on irrigation focused on
6

evaluation, assessment, performance, operation, socio-economic and financial
analysis of large scale irrigation (Maregesi, 1993; Tarimo at el., (2004); Orota,
1993; Balirwa, 1990; Kiagho, 2003). Evaluation of livelihoods and economic
benefit of water utilization has also been done (Kadigi, 2006).There also
considerable work on experiences with micro agricultural water management
technology SWMRG (2005) and studies on Assessment of water resource for food
security in Tanzania (Kasambala, 2004). All these studies have not direct mentioned
the contribution of traditional irrigation to food security and income generation.
Traditional irrigation farming if well practiced can reduce food insecurity and
income poverty, hence improves the well-being of the smallholder farmers (TIP,
2004). Despite all the efforts done by many stakeholders, but still smallholder
farmers are facing the problem of food insecurity and income poverty, the reason
which needs to be studied. The study will also help policy maker and other
stakeholders realize the importance of traditional irrigation to the livelihood of
smallholder farmers.
1.7 Objectives
1.7.1 General objective of the study
The main objective of this study was to assess the contribution of traditional
irrigation systems to well-being of smallholder farmers in Same district
7

1.7.1.1 Specific objectives of the study
i) To examine the contribution of traditional irrigation in improving food
security
ii) To determine the contribution of traditional irrigation to the household
income.
iii) To determine the profitability of crop production enterprises with and
without traditional irrigation systems in Same District
1.7.1.2 Hypotheses to be tested
i) Traditional irrigation farming has no significant impact on smallholder
farmers’ food security.
ii) Traditional irrigation farming has no significant impact on smallholder
farmers’ income.
iii) There is no significant different in profitability between crop production
enterprises with and without traditional irrigation systems in Same
District
8

CHAPTER TWO
LITERATURE REVIEW
2.1 Overview of global irrigation
Agriculture is by far the largest water use sector, accounting for about 70 percent
of all water withdrawn worldwide from rivers and aquifers for agricultural,
domestic and industrial purposes (Shiklomanov, 2000). In many developing
countries more than 90 percent of the water withdrawals are for irrigation (FAO
AQUASTAT, 2005). In arid regions, traditional irrigation is the prerequisite for
crop production (Bruinsma, 2003). In semi-arid and humid areas, irrigation serves
to increase yields, to attenuate the effects of droughts or, in the case of rice
production, to minimize weed growth Faures et al., (2002). Average yields are
generally higher under irrigated conditions as compared to rainfed agriculture
(Bruinsma, 2003). In the United States, for example, average crop yields of irrigated
farms exceeded, in 2003, the corresponding yields of dryland farms by 15% for
soybeans, 30% for maize, 99% for barley, and by 118% for wheat Veneman et al.
(2004). Although globally only 18% of the cultivated area is irrigated (FAO, 2005),
40% of the global food production comes from irrigated agriculture (UNCSD,
1997). Both the water scarcity caused by using large amounts of water in irrigated
agriculture and the importance of irrigation for crop production and food security
induced several studies to quantify the different elements of the global water
balance in space and time Alcomo et a., l.(2003). Others focused on the importance
of irrigated food production in general Faures et al., (2002), and the impact of
irrigated agriculture on global (regional) climate or on the impact of climate change
and climate variability on global irrigation water requirements (Doll, 2002).
9
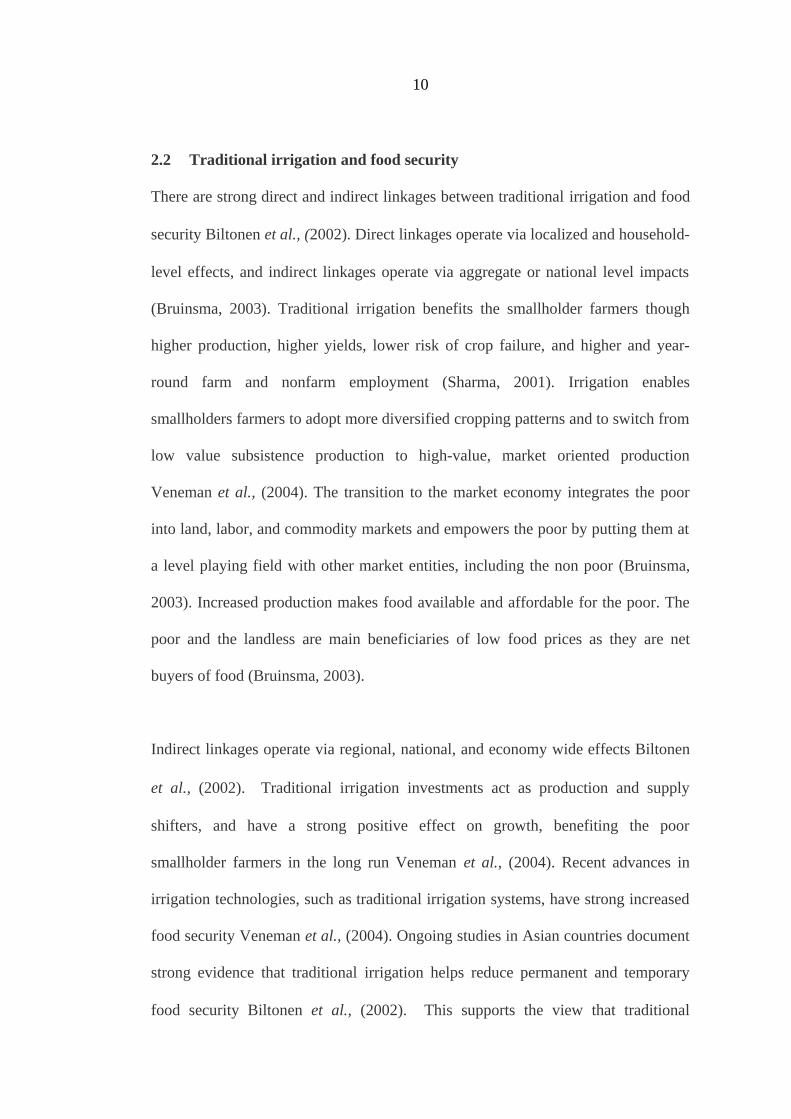
2.2 Traditional irrigation and food security
There are strong direct and indirect linkages between traditional irrigation and food
security Biltonen et al., (2002). Direct linkages operate via localized and household-
level effects, and indirect linkages operate via aggregate or national level impacts
(Bruinsma, 2003). Traditional irrigation benefits the smallholder farmers though
higher production, higher yields, lower risk of crop failure, and higher and year-
round farm and nonfarm employment (Sharma, 2001). Irrigation enables
smallholders farmers to adopt more diversified cropping patterns and to switch from
low value subsistence production to high-value, market oriented production
Veneman et al., (2004). The transition to the market economy integrates the poor
into land, labor, and commodity markets and empowers the poor by putting them at
a level playing field with other market entities, including the non poor (Bruinsma,
2003). Increased production makes food available and affordable for the poor. The
poor and the landless are main beneficiaries of low food prices as they are net
buyers of food (Bruinsma, 2003).
Indirect linkages operate via regional, national, and economy wide effects Biltonen
et al., (2002). Traditional irrigation investments act as production and supply
shifters, and have a strong positive effect on growth, benefiting the poor
smallholder farmers in the long run Veneman et al., (2004). Recent advances in
irrigation technologies, such as traditional irrigation systems, have strong increased
food security Veneman et al., (2004). Ongoing studies in Asian countries document
strong evidence that traditional irrigation helps reduce permanent and temporary
food security Biltonen et al., (2002). This supports the view that traditional
10

irrigation is productivity enhancing food security Veneman et al., (2004).
Interventions should focus on reaching out to the poor smallholder farmers through
improved economic, policy, institutional, and governance measures. Generating a
knowledge base through multi country studies on constraints to productivity in
irrigated agriculture is the first step to help identify the opportunities to serve the
poor (Sharma, 2001).
2.3 Importance of irrigation to livelihood of smallholder farmers
Irrigation increases the extent of cultivated area and the harvest frequencies to two
or more per year (URT, 2001).Reliable sources of water for irrigation especially in
arid and semi-arid areas reduce risks and stabilize production levels of individual’s
farms (Majule and Mwalyosi, 2005). The consequences of irrigation on livelihood
of smallholder farmers can be perceived through three different routes
(Narayanamoorthy, 2001). Firstly, enhance local availability of food. Secondly,
increase labour absorption and the consequent rise in wage rates and income.
Thirdly, irrigation increases service opportunities leading to better quality of life
and industrialization which increases economic activities, consequently improves
the well-being of farmers (Narayanamoorthy, 2001). Traditional irrigation if well
developed can perform an important role towards transforming the predominantly
subsistence rain-fed agriculture into profitable, commercial agriculture system (Soil
Water Management Research Group, 2005).
11

2.4 Impact of traditional irrigation on productivity
There is ample evidence to show that the individual crop yields are considerably
higher under irrigated than under rainfed, and that irrigated areas grow more of high
value crops which cannot be raised well under rainfed conditions (Satpathy, 1984;
FAO, 2003). Increased mean yields can mean increased food surplus, high calorie
intake and better nutrition levels. There are also stability effects because of reduced
reliance on rainfall hence irrigation lowers the variance output, increase
employment, yields, and helps to reduce adverse consequences of drought
(Dhawan, 1991).
Agricultural performance in irrigation and that of rainfed in the same area, also
show that land is used more intensively in irrigation, both in terms of the extent
fallowing and of multiple cropping (Satpathy, 1984; Adhvaryu at el., 1983); that
irrigated lands grows more of higher productivity, high value crops; and that the
average yields of practically all crops are substantially higher in irrigated areas. The
empirical evidence; for example, in the Dantiwada project of Gujarat in India, the
output per hectare in irrigated is estimated to produce nearly twice per hectare of
gross crop area compared to rainfed Adhvaryu at el., (1983), and another survey in
Karnataka reported even larger differences, more than twice percent between
irrigated and rainfed agriculture (Hatibu at el., 2002). It has also been shown that
differences in output per gross acre as well as crop intensity across space are
significantly and positively in irrigation than in rain fed (Andrew, 1993).
12

2.5 Output level
Irrigation boosts farm output and hence increases food security, with high prices
raises farmer income (MAFS, 2003). It improves yields through reduced crop loss
due to erratic, unreliable or insufficient rain water supply. Also irrigation allows for
the possibility of multiple cropping, increase annual output and enables a greater
area of land to be used for crops in areas where rain fed production is impossible or
marginal (Ward and Michelsen, 2002).
2.6 Contribution of irrigation to the national economy
Irrigation and rain fed agriculture are complementary and not mutually exclusive
(Ogomber, 2000). Irrigation assists agriculture diversification, enhance food self-
sufficiency, increases income, generate foreign exchange and provide employment
opportunities when and where water is not a constraint (Kimenye, 2000). In low
income countries irrigated agriculture can reduce the risks to farming allowing
families to increase their food security and nutrition. (FAO, 1996; OASIS and
DFID, 2003). Irrigated agriculture provides 40 percent of the world’s food
production from 17percent of the cultivated land (FAO, 1996; MAFS, 2003). The
World Food Summit in 1996 estimated that 60 percent of extra food required to
sustain the world in future must come from irrigated agriculture which needs more
investments and sustained efforts at expansion and improvement levels. Irrigation
also allows farmers to reap the economic benefit of growing high value cash crops
(Ogomber, 2000). Irrigation contributes much in grain crop production in Asia. For
example in Pakistan irrigation makes the greatest contributions to food security, it
13

accounts for about 80 percent of food production, China 70 percent and over 50
percent in India and Indonesia (DFID and OASIS, 2003).
Traditional irrigation systems have sustained small scale farmers not only in
Tanzania, but elsewhere in Africa. Howard (1996) reported that “the traditional
irrigation techniques locally known Fadima has enabled farmers of Jos plateau in
Northern Nigeria to generate income in the slack period from rain fed cultivation.
The technique is sustainable for the production of wide range of vegetables as well
as other crops such as sugarcane, wheat, maize, and barley (Howard, 1996).
In India, traditional irrigation has been marketed for more than three decades
(Narayanamoorthy, 2001). Traditional irrigation can improve productivity; raise
incomes through crop yields and outputs, and enhance food security of households.
The main vehicle of Indian government policies is to promote traditional irrigation
systems and product subsidies in certain cases up to 90 percent (Narayanamoorthy,
2001). Numerous studies have established the gains from traditional irrigation
adoption and several government and non-government organizations are engaged in
actively promoting irrigation (Sharma, 2001).
Ethiopia, traditional irrigation is essential for meeting subsistence needs of the rural
poor and for livelihood activity in the Betmera Hiwane, (Tafesse, 2003). In
particular, traditional irrigation is substantial for the rural poor in order to; diversify
farming and non-farming activities and cope with seasonality of income, food
security of the rural population, make savings, get benefits and salary from
14

employment (Tafesse, 2003). Therefore a lot of problems of the rural food
insecurity could be removed due to improved traditional irrigation.
Smallholder farmers in Same district irrigate a wide range of high-valued
horticultural crops, mainly vegetables for sale in the domestic market and maize for
food (Mkavidanda and Kaswamila, 2001). The observed increased in smallholder
commercial irrigation and adoption of new irrigation technologies in Tanzania,
provide new opportunities for increasing agricultural productivity and income
especially in semi-arid areas (SWMRG, 2005). Irrigation can lead to a reduction in
production risk and therefore, provides greater incentive to increase input use,
increase crop yields, intensify crop production and diversify into high-value crops
(SWMRG, 2005). The resulting increase in marketable surplus and commercial
activities has potential to generate and increased incomes to smallholder farmers
(Arharya and Barbier, 1999).
2.7.1 Food security
FAO (2003), defined food security exists when all people, at all time, have physical
social and economic access to sufficient, safe and nutritious food which meets the
dietary needs and food preferences for an active and healthy life. (Rukuni and
Eicher, 1987), food security was mostly concerned with food supply, usually in the
form of grain stock and was being applied at regional or district level. (World Bank,
2003) defined as the access by all people at all times to enough food for an active
and healthy life.
15

The definition encompasses many issues; it deals with production in relation to food
availability, it address distribution that all should access the produce; it covers
consumption in the sense that individual to be active and healthy (FAO, 2003). The
availability and accessibility of the food to meet individual food needs should also
be sustainable. This implies that early warning systems of food insecurity should
monitor indicators related to food production, distribution, and consumption
(Maxwell and Frankenberg, 1992). The performance of these indicators, therefore,
will detect whether a certain place or population is food secured or insecure in
relation to the spirit of the above definition. This is now a convectional concept of
food security (CARE, 1995; FAO, 2003).
2.7.1.1 Household food security
Household food security refers to the ability of the household to secure food, either
from own production or through purchase of adequate food for meeting dietary
needs of its members (Nyange, 2001). When analyzing food security at household
level we have to look at food supply and distribution, effective access of food by
household and effective consumption by individuals (World Bank, 2003).
Household food security implies that each member of the household in general has
access to food. Although food availability at the household level is a key issue,
there are intra-household factors that may affect equitable and adequate access to
food by all members (Maxwell and Frankenberger, 1992).
Household food security in developing countries is determined by what a household
is able to produce, process, store, prepare and buy from the market. In turn these are
16

determined by the agricultural resource availability to that household such as
climate and ecology, the amount and quality of land, the level and type of
technology, the availability of production assets as well as the amount and division
of labour. According to (Maxwell and Frankenberg, 1992), household food security
has social linkages including access to health services and good healthy
environment, education and adequate care of children and women. These non-food
linkages influence households’ decisions regarding livelihood resources, such as
income and labour which are direct determinant of household food security.
The Study conducted by Government of Ethiopia/IFAD addressed challenges
encapsulated in Special Country Programme phase II, aimed to increase production
of food and incomes through improvements and expansion of traditional irrigation
schemes (IFAD, 2005). Special Country Programme aimed to directly benefit 23
600 farm families in 5 900ha of improved and expanded traditional irrigation
schemes (IFAD, 2005). It was designed to benefit a further 10,000 families outside
of irrigation command areas and 2,400 women farmers in or close to irrigation
command areas would benefit directly through the development of irrigated
vegetable gardens (IFAD, 2005).
In South Africa the term traditional irrigation or small-scale irrigation is mainly
used when referring to irrigated agriculture practiced by black people. South Africa
has about 1.3 million ha under irrigation, of which 0.1 million ha is in the hands of
traditional irrigation (Backeberg, 2006). Backeberg (2006), estimated the number of
South African smallholder irrigators to range between 200 000 and 250 000, but
17

most of these were farming very small plots, primarily to provide food for home
consumption.
2.7.1.2 Food security indicators
According to Nyborg and Haugh (1994), food security indicators are divided into
two types normally the process indicators and outcome indicators. Process
indicators are used to measure the changing status of food security they are central
in the effect of development activities on food security. Process indicator offers the
type of information necessary in planning and adjustment of development efforts
during the life of the project. Process indicator is also categorized into two types.
Supply indicators and access indicators (Riely et al., 1995).
Supply indicators have to do with food availability including famine early warning
systems mainly used in regional and national levels (Nyborg and Haugh, 1994).
Access indicators are to do with people’s access to entitlement to food, through own
production, purchase or transfer/gift. Access indicators reflect to a large extent
peoples’ responses to worsening conditions often intended copping strategies,
include the meteorological data, agricultural production data, food balance sheet
information on pest damage, market information and regional conflict (FAO, 2001).
Food security outcome indictors measures the status of food at a given point in
time, they are mainly used to evaluate the food security, status before and after
intervention. The outcome indicator is also divided into two, the direct and indirect
indicators.
18

The direct indicator is more close to the actual food consumption such as food
frequency assessment (FAO, 2001). Indirect indicator include storage estimate,
subsistence potential ratio such as ability of the household to produce its own food
that is given by dividing own food by food required and nutritional assessment
(Nyborg, and Haugh, 1994). Moreover, indirect indicator may also include
household size and composition, land use and ownership and assets liquidity owned
by household (IFAD, 1999). This study used food security outcome indicator to
assess the status of food security to smallholder farmers.
2.7.2 Food insecurity
Food insecurity is the situation of not having enough food for all people at all times
(Wisconsin, 2002). Food insecurity is among major problem to the population of
Tanzania. This has persisted in spite of government’s effort to improve production
in agriculture from irrigation. Food insecurity not only causes much suffering to
human being, but also results into substantial productivity losses due to reduced
work performance, lowering cognitive ability and school performance to children as
well as reduced income earning. In addition, improved food security and increased
income at household level ultimately culminate into healthy national income
(Wisconsin, 2002).
2.7.3 Food availability adequate
The key elements to determine food security at any time are; availability of enough
food for active and healthy life, the access to food stability of supply, that is the
guarantee that one has access to it at any given time (Max well and Frankenberg,
1996). Food availability is a measure of food that is, and will be, physically
19

available in the relevant vicinity of population during the given period through a
combination of domestic production.
2.8 Income of crops from traditional irrigation
2.8.1 Commercialization of products from traditional irrigation
Irrigation can lead to reduction of crop production risk and, therefore, provides
greater incentives to increase input use, increase crop yields, intensify crop
production and diversify into high- valued crops (Blank, 2002).The return from
traditional irrigation are the foremost incentive to invest and improve it (Kimenye,
2000) . The main markets for products from traditional irrigation in Same district
urban market and small domestic markets within the districts. However, these
markets can not consumer all the products from different parts of the district. On the
other hand, in Same district, infrastructure such as roads are poorly developed
especially in highland making it difficult to transport the products to other urban
markets (VECO-Tanzania, 2006). Thus, lack of markets for vegetables and other
products is one of the major hindrances to traditional irrigation development
(Anthony, 2000).
Market intermediaries, rarely knew or provided important information such as price
trend, seasonal requirements, market products specification or quality standard
(MAFS, 2004). The cost of acquiring such information was high, precluding many
smallholder farmers from using such information to make production and
investment decision (Tiep, 2002).
20

2.8.1.1 Market of crops produced under tradition irrigation
The main crops sold in domestic markets at Same district were maize, bean,
paddy/rice cabbage, onions, and tomatoes (VECO-Tanzania, 2005). Most farmers
sold their crops at the farm gate price to rural traders within the village or to traders,
who came from other places to avoid transport costs from the farm to the market.
Rural assemblers sold the produce to large traders in local markets or large traders
in local markets who, in turn, sold it to other traders in region market or large urban
markets, such as Dar es salaam (TIP, 2004). Rural traders collected and assembled
small quantities of produce from many farmers scattered all over the rural areas
(VECO-Tanzania, 2005). However few farmers, especially those who were located
close to market centers, sold directly in local markets because they could get better
prices. Crops were mostly packed in bags except for tomatoes, that were packed in
cartons and all transaction in local markets were in cash (TIP, 2004).
In Kenya marketing of fresh horticultural produce has been a persistent problem for
smallholder farmers (Ngigi, 1999). This could be attributed to reasons such as the
inaccessibility of some irrigated farms due to bad roads, coupled with flooding the
market with produce due to lack of diversification and uncontrolled of production
(Ngigi, 1999). Middlemen are also accused of manipulating the market and
exploiting the poor farmers. Lack of an organized marketing system, season
fluctuation in demand, quality concern and perishability of produce aggravate this
situation (Sharma, 2001).
21

2.9 Gross margin analysis of agricultural products
Gross margins are determined by deducting total variable costs from the gross farm
income of a crop. Young (1996) defined that Gross Margin is the different between
the values of gross sale and the value of gross variable costs. It provides a useful
tool in terms of farm budgeting and estimating the likely returns or losses of a
particular crop. In order to estimate/calculate gross margin, production costs and
income is calculated per acre basis and multiplied by the number of acres of planted
crops to produce farm total costs and income. Income per acre is the on farm price
received per unit sold (tins, kilograms or bags) multiplied by unit number produced
per acre. On-farm price is calculated by deducting transport and levies per unit from
the market price. Market price can vary significantly depending on season,
generally decreasing as supply increases and vice versa. Therefore if the gross
margin is used as a predictor, attempt should be made to estimate if harvests
coincide with a peak or a trough in a supply i.e. dry and wet season price. The item
considered were: labour cost, fertilizer and pesticides. However, Scott (1995) noted
that the technique has several disadvantages including not accounting variation of
fixed cost and failure to make allowance for supplementary and complimentary
relationship between variables
22
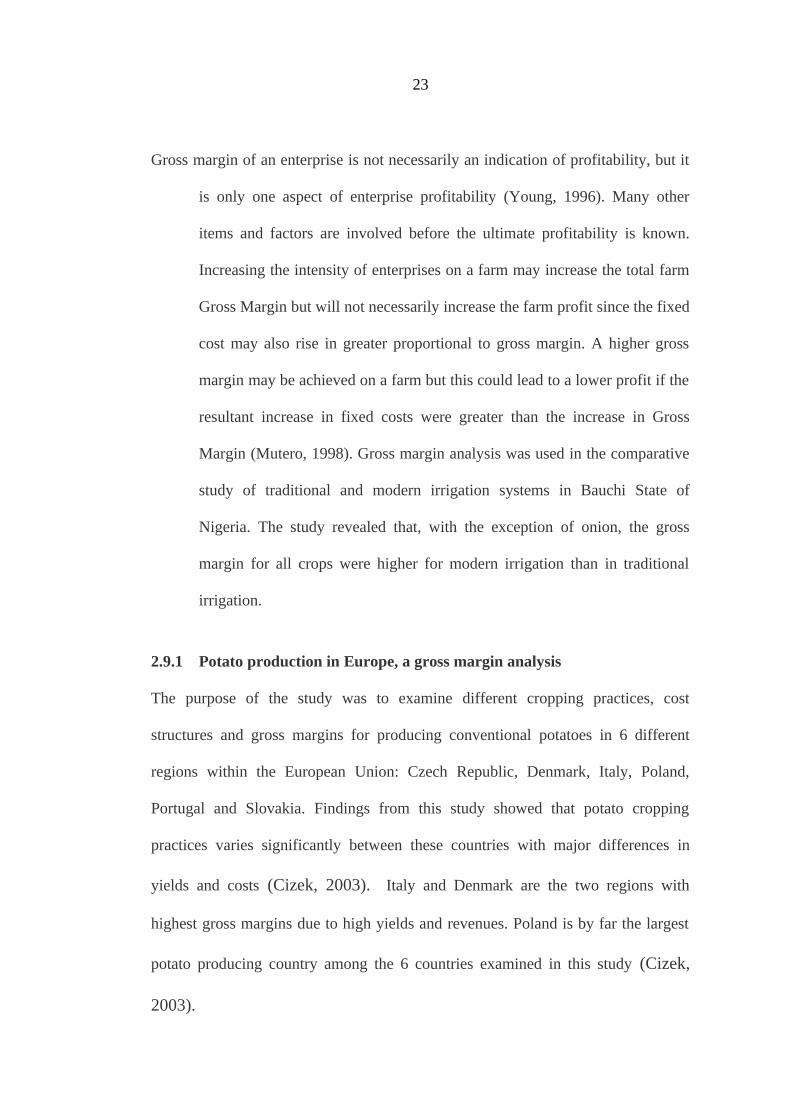
Gross margin of an enterprise is not necessarily an indication of profitability, but it
is only one aspect of enterprise profitability (Young, 1996). Many other
items and factors are involved before the ultimate profitability is known.
Increasing the intensity of enterprises on a farm may increase the total farm
Gross Margin but will not necessarily increase the farm profit since the fixed
cost may also rise in greater proportional to gross margin. A higher gross
margin may be achieved on a farm but this could lead to a lower profit if the
resultant increase in fixed costs were greater than the increase in Gross
Margin (Mutero, 1998). Gross margin analysis was used in the comparative
study of traditional and modern irrigation systems in Bauchi State of
Nigeria. The study revealed that, with the exception of onion, the gross
margin for all crops were higher for modern irrigation than in traditional
irrigation.
2.9.1 Potato production in Europe, a gross margin analysis
The purpose of the study was to examine different cropping practices, cost
structures and gross margins for producing conventional potatoes in 6 different
regions within the European Union: Czech Republic, Denmark, Italy, Poland,
Portugal and Slovakia. Findings from this study showed that potato cropping
practices varies significantly between these countries with major differences in
yields and costs (Cizek, 2003). Italy and Denmark are the two regions with
highest gross margins due to high yields and revenues. Poland is by far the largest
potato producing country among the 6 countries examined in this study (Cizek,
2003).
23

2.9.2 Gross margins analysis for potatoes
The gross margin analysis is based on data provided by project participants from
each country. Various regions differ in terms of farm structure, soil conditions and
climatic conditions Hamouz et al. (2005). In this respect the costs may be regarded
as reasonable estimates for common potato practices in the various regions.
Nevertheless, the cost structure and gross margin studies for each area should be
regarded as case studies for that particular region rather than average figures for the
entire country (Ponte, 2002). This approach may involve some uncertainties and a
direct comparison between the countries should be regarded with reservations.
Market prices may vary significantly during cropping season and access to
irrigation as well as soil conditions may also have a large impact on the economic
revenue (Ponte, 2002). Moreover, for some countries pests and insects may have
been abnormal for that particular year with excessive application of pesticides. In
Czech Republic the region is divided between the highlands without irrigation and
lowland areas with irrigation. In Denmark, the gross margin analysis may represent
all regions in Denmark with sandy loam soils. Most potatoes are grown on the
peninsula of Jutland on Sealand as well as the islands south of Sealand Hamouz et
al.(2005). Despite the differences in cropping practices and climatic conditions this
analysis might nevertheless give an indication of the cost levels for various
cultivation practices between the individual countries (Scott, 1995). The revenue
from potato production consists of a first quality and a secondary quality. By
subtracting the variable costs from the yearly revenue we obtain gross margin
(Debertin, 1992). Here variable costs relates to the costs of using a particular
24

variable input that may vary within a particular year (e.g. the use of nitrogen and
pesticides). Cost of machinery and labour is based on average annual contracting
prices. In this respect it is assumed that these costs (price per unit) include capital
costs (depreciation and cost of capital) and labour costs (Debertin, 1992).
2.10 National irrigation development plan
In Tanzania irrigation has shown little success for many years despite of substantial
effort of government and donors investing in irrigation. However, some of the
countries have taken it seriously, for example Sri Lanka during the twelve century
reported that in the country, no even a single drop of water obtained from rain
should be permitted to flow to the ocean without having given its full benefit to
people (Moormann and van Bremen, 1978). To day this country is producing a lot
of cereals and vegetables for export and domestic use.
Definitely, it is well known that food production in the world is increasingly
depending on irrigated agriculture, which ensures increased agricultural production
and productivity. According to a National Irrigation Master Plan (2002), study
carried out by the Ministry of Agriculture and Food Security (MAFS) staff in
collaboration with Japan International Cooperation Agency (JICA) team, estimated
2.3 million, 4.8 million and 22.3 million hectares is high, medium and low irrigation
development potential out of the estimated 43million ha of suitable land for
agriculture in Tanzania. These estimates outweigh the erstwhile figure of one
million hectares of land suitable for irrigation (MAFS and JICA, 2003). Through
Agriculture Development Support Program (ADSP), the government aim, to boost
crop production through improving irrigation. This can be done when water is made
25

available for achieving food self-sufficient; it also leads to improvement of rural
well being and sustainable livelihoods. This being the case, irrigation is no longer
optional but fulfills the core needs of society as well ensuring protection of the
environment.
2.10.1 Factors affecting traditional irrigation
Theoretically, it is generally accepted that the development of a farmer is
constrained by a number of social, political and environmental factors (Chiza,
2005). Favorable conditions are essential for ensuring profitable and sustainable
agricultural production (Dixon and Wood, 2003). In this study, a traditional
irrigation farmer is trying to maximize cereals and vegetables production in order to
achieve large profit. Traditional irrigation farming is faced by a number of problems
due to intensive cultivation; these are depletion of land resources, intensive
application of chemical fertilizers and pesticides, conflicts in water use/distribution
(Karukulasuriya and Mendelson, 2007). Land and water degradation is also a
serious problem in wetland farming due to poor management of these resources. A
sustainable production and profits from traditional irrigation, therefore depends on
how different factors are integrated together (Majule and Mwalyosi, 2003).
26

Figure1: Interrelationship of factors that affect traditional irrigation, modified
from Majule and Mwalyosi, (2003)
In South Africa traditional irrigation schemes have generated public interest, mainly
because their establishment and revitalization were made possible through the
investment of public resources (Bembridge, 2000). Recent assessments of the sector
concur that the success of traditional irrigation has been limited Crosby et al.,
(2000). Factors that contributed to their modest performance were poor
infrastructure, limited knowledge of crop production among smallholders, limited
Rainfall
Traditional irrigation farming
Poor marketing and communication systems
Poor water managementExcessive use of chemicalsDestruction of water sources
Improved terracesSustainable use of waterProtection of water sourcesSustainable agronomic practices
Low and unsustainable crop yield
High and sustainable crop yield
Well established marketing system/information
27

farmer participation in the management of water, ineffective extension and
mechanisation services and lack of reliable markets and effective credit services
Crosby et al. (2000).
2.10.2 Soil water management in highland.
Investigation made on traditional irrigation fields showed that, areas in steep slopes
or river banks, where farming activities are dominant soil erosion also existed (TIP,
2006). This happens during rain season when river floods and rain water from up
hills flowing in cultivated plots, which causes soil to be carried away. This occurs
due to poor agriculture method and land management that had been practiced by
farmers. Soil erosion is a serious problem in highland area where there are gentle
slopes. This has been noticed more in areas where traditional irrigation farming is
practiced along rivers banks, when it rains abrasion takes place. Sustainability and
productivity of traditional irrigation farming systems is now a big concern due to
associated land degradation (Mtatifikolo and Comoro, 1999). Deforestation and soil
degradation has been reported to threaten traditional irrigation schemes in
Kilimanjaro (Banzi et al., 1992). Also Kaswamila and Tenge (1997) reported that
over-cultivation around water sources is a threat to traditional irrigation practiced in
Lushoto District. It is feared that the increase in traditional irrigation, farming
practices is likely to aggravate the soil degradation process due to excessive
utilization of chemicals aimed at increasing crop production. In highland soil water
management is highly practiced, smallholder farmers apply different methods to
prevent soil erosion; these are stone and grass terraces, contour farming and tree
28

planting in the sources of water. These methods are helpful to reduce effect of
erosion.
2.11 Conceptual framework of the study
The study focuses on the contribution of traditional irrigation to livelihoods of
smallholder farmers in terms of food security and household income in Same
district.
Livelihoods analysis of irrigation water is essential. Firstly, it builds on better
understanding of multiple perspectives and values of water as economic capital
(agricultural input, domestic needs), physical capital (irrigation infrastructure),
managerial and institutional capital (water organizations), social capital (collective
action) as well as political capital (Nicol, 2000). It helps to identify what options
have better potential to reduce food insecurity within the given context and what
enabling conditions, policies and incentives are needed for the poor to increase the
range of better livelihood options (Ellis, 2000; Moriarty et a., 2004; Lankford,
2005). The approach is a relationship between the assets or resources that people
own or can access to, including land, irrigation water, skill and education levels of
family members, which are categorised as natural, human, social, financial and
political capitals (Scoones, 1998; Nicol, 2000; Ellis and Freeman, 2005). The
households utilise these assets in their productive activities in order to create food
and income and satisfy their consumption needs, maintain their asset levels and
invest in their future activities. The access to the assets is strongly influenced by the
vulnerability context, policies and institutions.
29

The impact of improved smallholder farmers’ livelihood is reflected in the changes
of income and food security. Efficiency agricultural production increases crop
yields; such efficiency is influenced by other factors of agricultural production such
as inputs availability, market for the produce, education, age of the individual,
extension services, financial services and improved infrastructures. Traditional
irrigation, apart from normal irrigation, also plays a significant role in
supplementing rain fed agriculture when there is a shortage of rainfall which in turn
increases crops yields and hence it improves food security and income. The
outcomes of effective utilization of traditional irrigation are expected to increase
crop yields, hence increasing household income, food security, employment and
investments all of which improve livelihood of smallholder farmers as an ultimate
goal.
30

Figure 2: Conceptual framework for the study adopted and modified from
CARE, (1995)
2.12 Traditional irrigation and their benefits
It is important to realize that there are important benefits to smallholder farmers
practicing traditional irrigation and that these extend to health (FAO, 2003). It is
often undertaken so that farmers can have a more secure food supply and that they
can enrich their diet with fresh food throughout the year (Mutero, 1998).
Consequently there are important nutritional benefits, besides the more generalized
Traditional irrigation farmingMicro dam (Ndiva)Valley bottomsRivers
Factors of agricultural productionInput availabilityMarket of the produceExtension servicesFinancial servicesEducationImproved infrastructure
Increased crops yields
Outcomes of traditional irrigationIncreased of household incomeFood securityEmployment More investments
31

health benefits which a higher income usually brings. Many farmers initiated
traditional irrigation focuses on food crops and high value crops such as fruits and
vegetables, which earn a considerable income (Mutero, 1998).
2.13 Conclusion
It has also been shown that different crops and vegetables grown under traditional
irrigation contribute to food security and income generation. Infrastructures
available in the area and marketing potentials are also important factors for
enhanced productivity of traditional irrigation and they needs to be considered for
more profit from cereals and vegetables. Maximum profit in most areas can be
achieved when different crops are grown in a mixture and then followed by
vegetables cultivation particularly during the dry season. Based on research findings
done by Majule (2003), it is recommended that traditional irrigation farming should
be encouraged and developed further to maximize profits. However appropriate
crop mixtures and sequential cropping patterns should be further explored.
CHAPTER THREE
32

RESEARCH METHODOLOGY3.1 Overview
This chapter presents the methodology used in this study. It covers; the conceptual
framework governing the study; description of the study area; types and sources of
data used; sampling methods and tools of the data analysis.
3.2 Description of the study area
The study was conducted in Same district in Kilimanjaro region. The district is
selected as the study area for the reason that it has a total of 52 traditional irrigation
canals, with 58 water user groups, male 4963 and female 4399, total irrigated area
is 4500 ha, (TIP,2004; Region Agriculture office, 2001). Also TIP has been
working in the district since 1988 for the purpose of improving this farming in order
to increase food security and income. The study area was divided into two main
features lowlands and high lands. The highlands inlude Chome wards and study
villages were Mhero and Marieni. In the lowland involved Maore wards and study
villages include Mpirani and Maore.
3.2.1 Location
Same district is one of the administrative districts in Kilimanjoro region covering a
total of 5152 Sq km, located in the North East of Tanzania. The district borders
Kenya in the North East, Mwanga district in the North-west, Tanga region in the
Sourth-East and Manyara region in the South- West. Same district is divided into
six administrative divisions, 25 wards and 83 villages.
33

Figure3: A Map of Same district showing location of study wards
34

3.2.2 Agro-ecological zones
Same district is subdivided into two Agro-ecological zones, the highland and the
lowland. The highlands cover 60 percent of the total area of Same district including
Pare mountain ranges (VECO-Tanzania, 2005). The highlands enjoy a more
frequent and reliable rainfall which makes the highland areas generally better off in
terms of development and wealth. The highlanders practice both agriculture and
livestock keeping. They keep few improved variety of cattle in zero grazing.
The lowlands cover 40 percent of the total area of district. The area is typically
characterized by a low rainfall, lack of water and low development and wealth for
the people (VECO-Tanzania, 2005). Although the drought allows the growing of
resistant crops, the people still concentrate much on maize production which fails to
yield anything from year to year. Livestock is therefore much practiced as an
alternative to maize production; the residents keep herds of cattle and goats to fulfill
the daily family requirements.
3.2.3 Climate
The district annual rainfall is bimodal from October to January is the short rain
period (vuli), and from March to June the long rain (Masika). The two seasons are
separated by the dry season from June to October. The highlands receive more
rainfall (600 – 2000mm), than the lowlands (300 – 600mm). The main source of
income in the study area is agriculture, including livestock keeping. The type of
agriculture is mostly rain fed with only 15% being under irrigation (VECO-
Tanzania, 2005; TIP, 2006).
35

3.2.4 Population, ethic groups and social economic activities
According to national census (2002), the total population of Same district is 212
325 people, 103 520males and 108 805 females’ (URT, 2002). The indigenous tribe
in the district is Pare the majority of who are subsistent farmers; the other tribe is
the Masai who are pastoralists. The economic activities in the area are agriculture
and livestock keeping. The district has Mkomazi national park which also
contributes much to the district economy.
3.3 Types and sources of data
The study used both primary and secondary data; the primary data were collected
through structured questionnaire from smallholder farmers who are practicing in
traditional irrigation and rain fed agriculture. To ensure validity and reliability of
the data the questionnaire was pre-tested. The necessary changes were made on the
basis of the pre-testing results, before administering the questionnaire.
The secondary data were collected from various reports, published papers, and
conference proceedings. Other types of information were obtained from electronic
sources in the Internet; also, among others, the following offices were visited TIP –
Traditional Irrigation Project, Moshi and Same, VECO_ Tanzania, Same
programme and Agricutural department in Same district.
3.4 Sampling methods
The target population for the study was smallholder farmers who are practicing
traditional irrigation and rain fed agriculture in Same district. The study employed a
36

multistage sampling technique. Multistage technique was used involving three
stages for the Chome Suji and Ndungu divisions. Due to the heterogeneous socio-
economic characteristics across wards within the divisions it was necessary from
each division, to sample two wards, which were involved in crop production with
and without traditional irrigation. Therefore in the first stage two wards were
selected, these are Maore ward from Ndungu division and Chome from Chome-Suji
division. In the second stage, for each selected two wards two villages were
purposively selected from each ward to make a total of four villages, these are
Mhero and Marieni in Chome and Maore and mpirani in Maore wards. Finally
from each village a random sampling was used to select smallholder farmers; 25
households from each village in Chome ward were selected to make a total of 50
respondents; and 35 households were selected from each village in Maore ward to
make a total of 70 respondents. Therefore the total sample of 120 household was
available for the study. Fewer respondents were selected in Chome ward than in
Maore ward because the population in the former is smaller than is the case in the
latter ward.
3.5 Data analysis
Data collected were coded and analyzed using SPSS computer program. This
includes cross-tabulation to make a comparison of crop yields, frequencies and
percentages. Non- parametric test used in this study was a student’s t-test. This was
used to test the significant difference of means of income and yields of crops
produced from traditional irrigation and rain fed agriculture.
37

3.5.1 Profitability of crop production enterprises
Gross margin was employed in this study as measure of profitability of each of the
enterprises. This technique is very useful in this study because of the low level of
fixed costs, which suggests that the gross margin is very close to net farm income.
Gross Margin analysis was calculated by;
GM = TRi – TVCi
Where: GM = Gross margin per acre,
TR = total revenue per acre,
TVC = Total Variable Cost per acre,
i= ith crop.
Revenue was considered from the value of crops produced from traditional
irrigation and rain fed agriculture, which was practiced by smallholder farmers. The
prices, which were considered, were the average market price within the area. The
total variable costs included were the costs of labour, fertilizers, pesticides,
insecticides and seeds.
38

CHAPTER FOUR
RESULTS AND DISCUSSION
4.1 Overview
This chapter presents the empirical findings, discussion, and observation of the
study on the contribution of traditional irrigation to food security and household
income; profitability of crop production with and without traditional irrigation. In
addition, the chapter also presents the demographic characteristics of the surveyed
households, cropping systems and the impact of traditional irrigation to the
livelihood of smallholder farmers in Same district.
4.2 Demographic characteristics
The characteristics of a given household have important social and economic
implications to the production of crops under traditional irrigation. The composition
of household usually influences the decisions on production, consumption and even
storage of food. Therefore this section describes the characteristics of sampled
households, focusing mainly on marital status, education level of respondents,
household size and age composition.
39

Table 1: Demographic Characteristics
Variable estimatedGender of the respondent Frequency Percent MeanMale 72 60Female 48 40Total 120 100
Age distribution18-45 85 71.746-60 21 17.5 42Above 60 13 10.8Total 120 100
Marital statusMarried 96 80Single 16 13.3Divorced 3 2.5Widow 5 4.5Total 120 100
Household size 51-5 67 55.86-10 47 39.2Above10 6 5Total 120 100
Education levelNo formal education 12 10Primary education 79 65.8Secondary education 28 23.3Tertiary education 1 0.8Total 120 100
4.2.1 Gender of respondents
The findings in Table 1 show the proportion of female farmers in the sample is 40%
of the entire sample. This situation can be attributed to the fact that irrigated
agriculture is the capital and energy intensive activity which is not convenience to
the majority of female farmers.
40

4.2.2 Household age composition
The age of an individual has influence in food production and consumption. Table 1
indicates that 71.7% of the respondents were aged 18-45 years; this implies that
most of the sampled farmers fall in the economically active age group. The average
years of the age across the study area was 42, which is slightly close to the National
average figure, which is 39.9 years of age (TNBS, 2002). The implication of this is
that most of the farmers can be fully engaged in productive activities. The survey
findings show that only 10.8% of the respondents were aged above 60 years, this is
the group of old people, who are likely to be less productive than those in the active
age.
4.2.3 Marital status of respondents
In this study, marital status is categorized as married, single, widow or divorced;
marriage included both formal and informal unions. The result in table 1 shows that,
80% of the respondents were married. This implies that these respondents have their
own settlement and are independent in obtaining daily family requirements. While
2.5% and 4.2% of the respondents were divorced and widowed respectively, these
figures constitute small proportion of the sampled households.
4.2.4 Household size
The household composition considered in the study area were groups in residential
households whose members live together and share resources held in common such
as accommodation, farm land and foodstuffs. The results in Table 1 indicate that
55.8% of the sampled households had 1-5 people; this is the reasonable number of
41

people in the households for getting family requirements. The results also revealed
that the average household size for the entire sample was 5, which is the same to the
National average of 5 people per household (TNBS, 2002). While 5% of the
respondents had more than 11 people. Through observation it was revealed that the
families with large population sizes involved mostly dependents who are orphaned
or otherwise from among the relatives.
4.2.5 Education Level
The farmers’ levels of education are presented in Table1, which indicates that
65.8% of the respondents had a primary education. This literacy level is useful for
smallholder farmers to learn, use and adopt new and appropriate agricultural
technologies. On the other hand 23% of the respondents have attained secondary
education. This education level may be attributed to the deliberate efforts by the
government in extending secondary education at community level. The results
imply that more than 89.1% of the respondents had formal education. Education of
the households is important in the production of food crops and income from
traditional irrigation for the well being of their families.
4.3 Cropping systems
The study area is divided into two geographical features, highlands and lowlands.
The cropping systems are rain fed and traditional irrigation based. The rainfall is
bimodal from October to January, is the short rain (Vuli) season which is however
not much reliable; and from March to June is the long rain (Masika) season, which
is more reliable. These rain seasons are separated by dry season from June to
42

October sometimes the dry season extends up to December. The rainfall is much
higher in the highland than in the lowland. During rains, the rain water flows to the
lowland enabling smallholder farmers to practice traditional irrigation.
There are slight differences in crops cultivated during the different rain seasons.
During the short rain season (Vuli), the main crop produced in the highland is maize
with other crops such as cassava, round potatoes and banana. In the lowland rainfall
in this season is not reliable, but farmers depend much on the water from the
highlands for irrigation, which enable them to cultivate paddy and maize by using
traditional irrigation. Vegetables are not grown during the short rain season because
of high temperatures that affect the production.
During the long rain season (Masika), main crop produced in the highland is bean;
other crops are sweet and round potatoes and some varieties of vegetables. Maize is
not grown during this season due to the cold weather condition. In the lowlands,
when rainfall is reliable, crops produced include maize, bean, groundnuts,
sunflowers and some variety of vegetables. However farms near the irrigation
systems are supplemented by traditional irrigation in order to help crops to grow
well in case of drought.
43

Table 2: Cropping System and sources of water
Variable estimated No of respondents PercentFarm size for irrigation in acre ≤0.5 28 23.30.6-1 44 36.7>1 48 40Total 120 100
Sources of water for irrigationMicro dam technology (Ndiva) 37 30.8River 83 69.2Total 120 100
Cropping systemTraditional irrigation 67 55.8Rain Fed N/A N/A Rain fed and Traditional Irrigation 53 44.2Total 120 100N/A: No households depend only on rain fed
4.3.1 Traditional irrigation
Traditional irrigation is practiced in small plots of less than 0.5 acres owed by
individual households. These plots are mainly along rivers and around natural wells.
It is characterized by having temporary intake (which is constantly replaced), poor
soil and water conservation techniques leading to water loss though leakage and soil
loss through erosion (Maganga, 1998). Vegetables are the main crops irrigated; the
products from irrigation are both for domestic consumption and sale in the market
(Anthony, 2000). Traditional irrigation is practiced in both the highland and the
lowland during dry season. In the highlands, crops produced under traditional
irrigation include onions, maize, beans, potatoes, carrots and vegetables, while in
the lowland the crops produced include maize, paddy, beans, ginger and vegetables.
Traditional irrigation practiced in the lowland depends on the water from highlands.
44

4.3.1.1 Sources of water for traditional irrigation
The main sources of water used for traditional irrigation in the study area are from
rivers and micro dam technology (Ndiva). Micro dam technology is mostly used in
the highlands due to climatic condition of having small water springs. Water from
these small springs is collected first into the micro dam (Ndiva) before being used
for irrigation. Rivers are used mostly in the lowlands, however sources of rivers for
traditional irrigation is from the highlands.
4.3.1.2 Micro dam technology (Ndiva)
Micro dam technology (Ndiva) involves impounding runoff water for traditional
irrigation by digging and constructing earth embankment (Soil Water Management
Research Group, 2005). Water from springs or small rivers is collected first to
micro dam before being used for irrigation. Chome ward is the study area is in the
highland where 37% of the respondents practice traditional irrigation by using this
technology (Table 2). In the highland the purpose of micro dam technology (Ndiva)
is to increase more pressure by impounding water from small streams so as to make
the water flow easily during irrigation.
45

Plate 1: Micro dam technology (Ndiva) Mhero, Chome ward
Plate 2: Stone terraces at Mhero (WUGS) in Chome ward
4.3.1.3 Rivers
Rivers are another source of water for traditional irrigation in the study area. River
water is mostly used in the lowlands. In the lowland areas, traditional irrigation
depends on water from rivers. Hingilili River in Mkomazi basin is the major source
of water for traditional irrigation in Maore ward. The catchment lies in the eastern
46

part of south Pare mountain ranges in Same district. Table 2 shows that 83% of the
respondents use water for traditional irrigation directly from river. Hingilili river
has six traditional irrigation furrows namely; Mariranga, Maya, Chemchem,
Kalinga, Rushoto and Kikongo.
Reliable rainfall in the highland enables smallholder farmers in the lowlands to
produce more crops. There are some conflicts during dry seasons, where highland
irrigation groups extract almost all the water from the sources into their canals and
do not adhere to the by laws of using water in the day time, and allow it to flow to
the lowland in the night. If the by law is not observed by the highland water users,
then water conflicts become inevitable.
4.3.2 Rain fed
Rain fed agriculture relies only on direct rainfall and this is sometimes referred to as
dry land farming (MALD, 1997). In the highland areas, rainfall is more reliable than
in the lowland. Crops produced in the highland include maize, beans, cassava,
potatoes, sweet potatoes, and bananas. In the lowland areas rainfall is not reliable,
smallholder farmers sometimes produce nothing due to lack of rainfall. However
when rainfall is reliable crops produced are maize, groundnuts, sunflower and
beans. The findings of this study show that none of the respondents practiced rain
fed agriculture only Table 2; this is because rainfall is inadequate and erratic
causing persistent drought that makes crops grow poorly. Thus irrigated agriculture
becomes the main viable option in ensuring food security.
47

4.4 Land use management and traditional irrigation
Table 3 shows the distribution of the respondents according to farm size. The
smallholder farmers practice both traditional irrigation and rain fed farming. The
fields cultivated in the highland range from 0.5 to 1 acre; this is due to sharply
rising landscape of the area. A large area in the highland is not suitable for crop
production due to its rough topography of sharp dropping slope land. In the lowland
farm size for traditional irrigation and rain fed farming range from 0.25 to 2 acres,
this is due to the flatness of the land surface that the areas under cultivation become
large enough for both traditional irrigation and rain fed farming. Maize and paddy
are crops cultivated over large areas as opposed to vegetables which are cultivated
in small farm plots. The average farm size is of fields 1.4 acres in traditional
irrigation; this implies that the land under cultivation is small. These results also
indicate that farmers practicing traditional irrigation cultivate small plots of land
than in the rain fed system. It is practiced in small scale due to the following
reasons;
Water scarcity and poor water quality especially as related to sediment
concentration; land degradation as a result of poor operation management activities,
this is partly related to inefficient water management resulting in water wastage and
water logging. Lack of know-how in, and access to the opportunities of irrigation
technology, weak economic base of most smallholder farmers and the relatively
high development costs involved in developing irrigation schemes. Limited priority
given to irrigation development during national and local planning and budgeting,
poor management structures in place to support farmers and promote irrigation
48

development. For example, the infrastructure to facilitate irrigated agriculture
development is underdeveloped. Land tenure system that does not encourage
farmers to invest in permanent improvements on their plots and make
improvements which can be used to obtain credits for further development; unclear
water rights and their enforcement.
4.5 Crops produced
A total of five crops were selected for the analysis three in the highlands and the
other three in the lowlands; however some of the crops are cultivated both in the
highland and in the lowland. The discussion considered crops produced for food
security and at least one crop for income generation. These crops are maize, paddy,
beans, tomatoes, and onions.
Table3: Cultivated area and crop yields under traditional irrigationVariable estimated Traditional irrigation Cultivated area(acres)
MaizeN=120
OnionN=120
BeanN=120
Tomatoes
N=120
PaddyN=120
Mean field
Do not cultivate 16(13.3) 83(69.2) 32(26.7) 84(70) 52(43.3) ≤0.5 49(40.8) 28(23.3) 28(23.3) 31(25.5) 22(18.3)0.6-1 38(31.7) 8(6.7) 27(22.5) 4(3.3) 32(26.7) 1.4> 1 17(14.2) 1(0.8) 11(9.2) 1(0.8) 14(11.7)Total 120(100) 120(100) 120(100) 120(100) 120(100)
Crops yield kg per acreDo not harvest 16(13.3) 83(69.2) 32(26.7) 84(70) 49(40.8)10-100 3(2.5) N/A 17(14.2) N/A N/A101-500 40(33.5) 1(0.8) 58(48.3) 3(2.5) 1(0.8)501-1000 36(30) N/A 10(8.3) 1(0.8) 1(0.8)>1000 25(20.8) 36(30) 3(2.5) 32(26.7) 69(57.5)Total 120(100) 120(100) 120(100) 120(100) 120(100)
Mean yield from irrigation in kg/acre 1077 5028. 33 322.65 3929 1948Figure in parenthesis are %N= Number of respondentsN/A: Not applicable (Farmers do not produce crops in that cropping system)
49

4.5.1 Maize
Maize is cultivated in the highlands and the lowlands, in both rain fed and
traditional irrigation cropping systems. Table 3 shows 40.8% of the respondents
cultivate maize form traditional irrigation with field size of ≤ 0.5 acre. While 21.7%
of the respondents cultivate maize from rainfed farming (Table 4), with field size of
≤ 0.5 acres. This implies that in the highland smallholder farmers produce maize by
traditional irrigation in small plots of farms than they do in rain fed farming due to
steepness of the slopes which makes impossible to own large areas of land. In the
lowland, shortage of water for irrigation forces farmers to cultivate small plots. The
average yield of maize is estimated to be 1077 per acre from traditional irrigation
and 1042 kg per acre for rain fed farming especially when the rainfall is reliable.
Table 4 shows that 58.3% of the respondents were not producing maize from rain
fed agriculture. This is due to unreliable rainfall and that smallholder farmers
depend much on traditional irrigation to produce maize for food and income
generation. They normally cultivate fields which can be irrigated in case of
droughts, so that it becomes easy to have maize supplemented by irrigation
especially in the lowland; this also reduces the number of the farmers who produce
maize by rain fed agriculture.
50

Table 4: Cultivated area and crop yields under rainfed system
Variable estimated RainfedCultivated area(acres) Maize Bean PaddyDo not cultivate 70(58.3) 100(83.3) 117(97.5)≤ 0.5 26(21.7) 14(11.7) 1(0.8)0.6-1 18(15) 4(3.3) 2(1.7)>1 6(5) 2(1.7) N/ATotal 120(100) 120(100) 120(100)
Crop yield kg per acre Do not harvest 70(58.3) 100(83.3) 117(97.5)10-100 2(1.7) 8(6.7) N/A101-500 22(18.3) 11(9.2) N/A501-1000 13(10.8) 1(0.8) 1(0.8)>1000 13(10.8) N/A 2(1.7)Total 120(100) 120(100) 120(100)Mean yield rainfed kg/acre 1042 247.6 1386.66Figure in parenthesis are %
N= Number of respondents
N/A: Not applicable (Farmers do not produce crops in that cropping system)
4.5.2 Beans
Beans also are cultivated both in the highlands and the lowland, using traditional
irrigation and rain fed farming. In the study area beans are used as cash and food
crop. The results presented in Table 3 reveals that 26.7% of respondents were not
producing beans from traditional irrigation and Table 4 show that 83.3% of the
respondents also were not producing beans from rain fed farming. This implies that
more beans are produced by traditional irrigation than rain fed agriculture.
Unreliable rainfall in the lowland forces more farmers to produce beans by
traditional irrigation. Some beans are intercropped with maize in the traditional
irrigation farming and sometimes beans are produced solely during the rain season
especially in the highland.
51

In Andean highland of Colombia and Peru, common bean, Phaseolus Vulgalris is
intercropped with maize in traditional irrigation farming. Multiple cropping systems
are essential for development of productive and sustainable irrigated agriculture for
the Andean smallholder farmers. In other areas of Colombia beans are produced
under sole cropping while on-farm trials are conducted under the target multiple
cropping system.
4.5.3 Paddy
Paddy is cultivated in the lowlands only because of its flatness terrain of the land;
soil which impounds water, and high temperatures. In the highland paddy can not
grow well because of the cold weather condition and of being geographically so
hilly that the water can not be impounded. In the lowland paddy is produced by
traditional irrigation, the production of the crop depends much on the water which
flows from the highland. The results on Table 3 reveals that 56.7% of the
respondents had access to irrigated paddy fields. Majority of the smallholder
farmers’ posses a farm size of 0.5 to 1 acres and few farmers’ posses a farm size of
more than 1 acre. Small scale farm size is caused by water scarcity in Maore ward,
compared to the number of population available. The yields of paddy in the study
area are estimated to be 20 to 25 bags of paddy per acre.
52

4.5.4 Vegetables
Vegetables are cultivated for food and cash crop in both highland and lowland. A
variety of vegetables is produced seasonally by traditional irrigation, mostly in the
dry season from June to November. The most common vegetables cultivated in the
highland include onions, cabbage, tomatoes, chinese cabbage and amaranths. In the
highland the production of onions is very expensive, smallholder farmers are
required to have many inputs including insecticides, fungicides and fertilizers for
the onion to grow well. The majority of smallholder farmers fail to manage these
costs leading to low production. Onions have high yield and return as compared to
other crops, Table 3 indicate that 30% of the respondents were getting yields of
more than 1000kgs, this is due to high application of inputs and access of market. In
the lowland areas, vegetables produced are okra, cabbage, tomatoes, chinese
cabbage, amaranths and black night shade. Tomatoes, onions and cabbages
production is done in larger scales than those for other vegetables with the field size
ranging from 0.5 to 1 acre. The remaining vegetables production is done in small
scale with the field size between 0.25 to 0.5 acres. This is because tomatoes, onions
and cabbage fetch high market demand compared to other vegetables.
4.6 Contribution of traditional irrigation in improving food security
4.6.1 Household food security situation
Based on the study by Majule and Mwalyosi (2003) traditional irrigation farming
plays a significant role in food security and income generation as well as proving
buffer to the local communities during drought periods which are currently
frequent. Table 5 indicates that 64% of the respondents stated that crops harvested
53

for food was not enough to sustain their lives throughout the year; they have to find
alternatives to get food for their families, like buying food and practicing casual
labour to get food.
Table5: Households food security situation
Variables No of respondents PercentMeals taken per dayOnce N/A N/ATwice 21 17.5Thrice 99 82.5Total 120 100
Crop harvested Enough for food 43 36Not enough for food 77 64Total 120 100
Food shortage(own production)Experienced food shortage 84 70Did not experienced food shortage 36 30Total 120 100
Cereals purchased for foodPurchased food 80 67Did not purchased food 40 33Total 120 100
Despite the quantity of food crops harvested, it was revealed that 67% of the
respondents purchased food from traders who collect maize from other regions
(Table 5). The main reasons were early sales and poor storage methods of food
crops produced, maize and rice were the most crops purchased for food.
4.6.2 Crops stored for food
In the study area maize was the most important food crops (staple food) in both
highland and lowland, followed by paddy especially in the lowland. Table 5
indicates that 64% and 41% of the respondents stored maize and paddy respectively
for food. The stored crops are mostly produced from traditional irrigation systems.
54

The quantity of crops harvested and stored for food was very small; the majority of
farmers were vulnerable to food insecurity. This is also in agreement with Makundi
(1996) studies that the amounts of food stored are one of the factors, contributing to
household food insecurity. Food insecurity sometimes is caused by poor post
harvest and storage methods; this also contributes to food insecurity in the
community. A reasonable and durable communal storage structure could be
constructed for the village’s food storage. The storage could be used during the food
scarcity period for the respective families.
Table 6: Crops stored for food in kg
Variable to be estimated
Traditional irrigation Rain fed
Crop storage N=120 N=53Stored crops 116(96.7) 50(94.3)Did not stored crops
4 (3.3) 3(5.7)
Total 120(100) 120(100)
Crops produced and stored kg
Maize Bean Paddy Maize Bean Paddy
Not producing food crops 11(10) 34(28.2) 52(43.3) 76(63.3)
106(88.3) 197(97.5)
Qty food produced and stored kg<50 3(2.5) 35(29.2) 1(0.8) 3(2.5) 6(5) N/A51<200 1(25.8) 46(38.3) 13(10.8) 19(15.8) 6(5) 3(2.5)201-500 64(53.3) 4(3.3) 41(34.2) 16(13.3) 2(1.7) N/A>500 10(8.3) 1(0.8) 13(10.8) 6(5) N/A N/ATotal 108(90) 86(71.7) 68(56.7) 44(36.7) 14(11.7) 3(2.5)Figure in parenthesis are percentage
The crops produced was very low due to different reasons including water shortage
for irrigation and persistence drought in rain fed agriculture, making farmers food
insecure. In the rural areas, household was assumed food secured if they have more
maize than is the case with any other crop. The results in Table 6 also reveal that
90% of the respondents produced maize for food from traditional irrigation and
55

stored as food for future use. 10% of the respondents were not producing maize
from traditional irrigation (Table 6). This implies that traditional irrigation farming
if well practiced together with different stake holders in assisting smallholder
farmers to access production inputs, markets of the produce, extension and financial
services can help to improve food security and income among smallholder farmers
of Same district.
4.7 Contribution of traditional irrigation to households income
4.7.1 Sources of income from livestock
The analysis of sources of income for the sample household showed that
smallholder farmers rely heavily on crop farming as a source of income.
Smallholder farmers are also engaged in non farm activities to generate income that
supplements income from agriculture to fulfill family requirements. Table 7 shows
that 17.5% of the respondents possessed livestock used for food only and 43.3% of
the respondents were generating income from livestock and their products.
Table 7: Households income from livestock Variable No of respondents Percent Mean incomeLivestock possessionDo not possess livestock 47 39.2Possess livestock for food only 21 17.5Livestock for food and income 52 43.3 194,946.2Total 120 100Livestock are more important as source of income and food for smallholder
farmers. This is due to the relatively high income generated by livestock, which
make the impact on the smallholder budget more significant. The main parts of
these sources of income related to livestock keeping for households are income
derived from cattle and smaller livestock such as chicken and shoats (sheep and
56

goats). In Same district small holder farmers of lowland keep livestock in big
number by grazing, while in the highland they keep few livestock in intensive
farming. The study revealed that there was no much difference between farmers
who are keeping livestock in lowland and highland.
4.7.2 Crops income under traditional irrigation and rain fed
The assessment of income from crop produced from traditional irrigation indicate
that 8.3% of the respondents did not sell of their crops produced from the farm
(Table 8), this is due to small size of plots cultivated and lack of farm production
inputs. Table 8 also shows that income obtained from traditional irrigation were
higher than the income from rain fed farming. High income of crops produced from
traditional irrigation were probably a results of high yield of the crops cultivated
especially vegetables. Table 8 indicates that 39.6% of the respondents were not
generating income from rain fed farming. This situation was caused by low rainfall
per year leading to persistence drought especially in the lowland, hence the low
crops yield. Crop produced under this system were mostly cereals which were used
for food. Results from (Table 8) also revealed that 29.2% of the respondents from
traditional irrigation were earning high crop incomes of more than one million per
year, this is due to the production of high value crops mainly vegetables, for
example mean income from onion and tomatoes were 1,771,867 and 961,380Tsh
per season respectively (Table 12).
Table 8: Households income from crops
Annual income from crops(Tsh) Traditional irrigation Rain fedFrequency percent Frequenc
yPercent
Did not sell 10 8.3 21 39.6
57

10000-100000 5 4.2 14 26.4100001-500000 34 28.3 17 32.1500001-1000000 36 30 1 1.9> 1000000 35 29.2 N/A N/ATotal 120 100 53 100
The results in Table 9 is the output from paired t-test which indicate P<0.05
implying that there was a significant difference between the income obtained from
traditional irrigation and that obtained from rain fed farming. This implies low
production of crops from rain fed farming due to shortage of rainfall. As a result,
farmers producing crops from traditional irrigation earn more income. The high
income of crops from traditional irrigation is due to production of vegetables, which
fetch high price in the domestic market. In the highland, farmers who produced
onions in the season of 2006/07 generated high income, because the price of onions
was high, while those who produced onions in the next season of 2007/08 did not
generate high income due to low price. Generally the prices of agricultural products
are not static, as they keep on changing with time depending on the market demand
and supply.
Table 9: Annual crops income from traditional irrigation and rainfed
Variable
Crops mean income T-Value Sig.(2tailed)Traditional
irrigation
Rainfed 95%CI of the
DifferenceIncome 1066090 167677 1632329-164496.7 2.504* 0.018
Note * Means significant at p<0.05
4.7.3 Income from off-farm activities
58

In the lowland which is semi arid, the observation that the poor rely more on off-
farm activities for their livelihood Morris (2002), is in line with other studies in
semi arid areas in Tanzania. Off-farm activities were mentioned as another
important livelihood strategy. For example Sepala (1996) observed that
diversification to off-farm activities provide an element of flexibility that allows
household to distribute risk better. Table 10 indicates that 33.3% of the respondents
were participating in off-farm activities to generate income. It was observed during
the survey that males and females have strategies as far as off-farm involvement is
concerned. In Same district, men and women are involved in different activities
such as running shops, cereal trading, casual labour, selling local brew and food
vending.
Table 10: Income from off-farm activities
Variable No of respondents Percent MeanIncome from off-farm activities< 50000 8 6.750001-200000 18 15 228,225> 200000 14 11.7Total 40 33.3
4.8 Profitability of crop enterprises
The output market prices and variable costs are presented in Table 10. Variable cost
in traditional irrigation dominated the production cost. A large proportion of the
variable cost is attributable to inputs used in production. The distribution of the
respondents according to the level of inputs used is presented in Table 10 which
shows that traditional irrigation employed significantly a higher amount of inputs
than is the case in the ran fed farming. For example, inputs cost in maize production
59

by traditional irrigation is Tsh 51 000 per acre and Tsh 29 000 per acre for rain fed
farming. The cost of inputs is high in traditional irrigation due intensive farming
throughout the year, which leads to a decrease of soil fertility. Rain fed farming
does not involve intensive utilization of soil, once the rain season ends; the field is
not used for any cultivation until next season. This situation helps to retain the soil
fertility in rain fed system for the plant growth.
4.8.2 Crops yield
There were slight differences in yields of all crops produced in both traditional
irrigation and rain fed systems, however traditional irrigation exceeded the yields of
the rain fed system. The results in Table 11 show the output of paired t-test of the
crop yields from both traditional irrigation and rain fed system were almost equal.
The insignificant difference between yields from traditional irrigation and rain fed
system implies that when rainfall is reliable in rainfed farming the yields from
cereals crops produced in both systems is not significantly different.
Table 11: Crop yields from traditional irrigation and rainfed farming in kg
Crops
Crops mean yields T-Value Sig.(2tailed)Traditional
irrigation Rainfed
95% CI of the
DifferenceMaize 1199.4 1085.7857 1295-1068 0.194** 0.847Bean 191.33 151.78 137.565-58.454 0.931** 0.379Paddy 1306.666 1386 1026.49-1186.49 0.311** 0.785Note **Means insignificant at p<0.05
60

Vegetable was not frequently grown during rain season (Table13); this is due to the
weather condition which does not favour the production of vegetables. In the study
area, onions and tomatoes employ high cost of inputs under traditional irrigation;
but also its average yields were high compared to that of the other crops. The yields
were 5028 and 3924 kg per acre of onions and tomatoes respectively; this is due to
more application of inputs. The price of each crop from traditional irrigation and
rain fed was also imputed; (Table 12) indicates the price and gross return of crops
produced.
4.8.3 Crop production costs
Crops production involves the use of a number of inputs including seeds,
insecticide, herbicides, fungicide, tools/instruments, labour, fertilizers/manure and
water. Farmers in the study area use seeds of improved varieties but these are
relatively expensive; furthermore new seeds need to be purchased at the beginning
of each season when farmers have little cash with them. Most farmers keep a small
proportion of each year’s harvest as next year seed, so that improved seeds do not
need to be purchased at the beginning of the season.
The use of fertilizers, pesticides, herbicides and fungicide is rare used in the
production of cereal crops, but it is used highly in the production of vegetables.
Table 10 shows different costs of buying inputs of one acre field. Majority of
smallholder farmers do not use artificial inputs, because of the problem of liquidity
in that the farmers can not afford these expensive inputs considering the higher
yields expected because often the farmers do not have enough cash at the right time
to make these purchases. The use of manure is common in the highland than in the
61

lowland, because soil fertility in the lowland is good compared to that in the
highland; also rainfall is not as reliable as causing erosion and soil reaching.
4.8.4 Gross margin of crops from traditional irrigation and rain fed
Farmers in Same district grow various food and cash crops. For the purpose of this
study, five major crop enterprises were selected for discussion. These were maize,
onions, tomatoes, paddy and beans. The gross margins for the crops produced were
established; Table 12 also shows the gross margins for the different enterprises
produced under traditional irrigation and Table 13 shows the gross margin of rain
fed systems. Gross margin in this study, is defined as the difference between the
gross return and variable cost of each enterprise. Gross margin was employed in this
study as a measure of profitability of each enterprise, instead of the net income, to
avoid the difficulty of sharing the fixed costs among the enterprises. Furthermore,
this technique is very useful in this study, because of the low level of fixed cost,
which suggests that the gross margin is very close to the net farm income. The cost
of family labour, was not imputed because most of the farm operations were worked
by family members.
Table 12: GM analysis of crops enterprises from traditional irrigation per
acre.
Variable Traditional irrigationMaize Onions Paddy Tomatoes Bean
Output (Yields) in kg acre 1077 5028 1947 3924 322
Market price per kg 208.20 352.40 234.50 245 585Gross income (Tsh) 245051.4 1771867 456571 961380 188370
Operation cost (Tsh)
62

seed 0 80000 0 16000 12000 Fertilizers 0 0 0 0 0 Urea 28000 60000 40000 0 0 NPK 42000 0 42000 0 Manure 15000 30000 15000 15000
Insecticides 0 0 0 0 0 Theonex 0 0 0 18000 0 Selecron 0 30000 0 0 0
Fungicide 0 0 0 0 0 Dithane 0 28000 0 21000 0
Labour cost
67000 182000 208000 56000 8000
Total variable cost (Tsh) 110000 452000 248000 168000 35000Gross margin 135051.4 1319867 228571 793380 153370
The results Table 12 also indicate that crops from traditional irrigation had high
gross margin. Onion is the most profitable enterprises with the gross margin per
acre of Tsh 1 319 867, from the survey maize, paddy, bean and tomatoes had gross
margin of Tsh 135 051.40, 228 667, 153 370 and 793 380 respectively from
traditional irrigation systems. While Table 13 show that the rain fed farming, paddy
had high gross margin of Tsh 198 017, followed by maize Tsh 117 944 and beans
Tsh 115 495. Gross margin is not static it tends to change with time. The gross
margin for agriculture products change when the supply of the commodity increases
the price becomes low. For example during harvesting period, the supply of the
commodity is high; this tends to lower the price of the commodity and therefore the
gross margin become low; but when the supply is low the price tends to rise and the
gross margin become high (Debertin, 1992).
Table 13: GM analysis of crops enterprises from rainfed per acre
63

Varible RainfedMaize Bean Paddy
Output (Yields) in kg acre 1042 247 247
Market price per kg 208.20 585 585Gross income (Tsh) 216944 144495 144495
Operation cost (Tsh) seed 0 0 0 Fertilizers 0 0 0 Urea 0 0 0 NPK 0 0 0 Manure 35000 20000 20000
Insecticides 0 0 0 Theonex 0 9000 9000 Selecron 0 0 0
Fungicide 0 0 0 Dithane 0 0 0
Labour cost
64000 0 0
Total variable cost (Tsh)99000 29000 29000
Gross margin 117944 115495 115495
4.8.5 Profitability of crops produced under traditional irrigation
Results from (Table 12), revealed that smallholder farmers producing horticultural
crops from traditional irrigation is highly profitable compared to alternative
investment options that farmers can undertake in other crops. For example, gross
margin of selected crops, onions is the most profitable enterprise in traditional
irrigation it is about 10 percent higher than that of maize. This raises the question as
why every farmer in the area is not jumping on this band wagon, there are several
64

explain along. One important factor is that the enterprise budget value does not
explicitly include transaction and production costs that are explicitly measured
(Freeman and Salim, 2001). Because such costs are not included as monetary costs
in enterprise budget it is likely that these budget erroneously overestimate the actual
profitability of price of farm outputs. Consequently, the enterprise budget makes
horticultural crop enterprises more, profitable than they actually are, especially in
the study areas where poor rural infrastructure, risk and other market imperfections
lead to high transaction costs. These consideration need explicitly considered when
designing technology intervention for farmers in these areas (Kimenye, 2000).
CHAPTER FIVE
CONLUSION AND RECOMENDETIONS
5.1 Conclusion
Based on the findings of this study, the following conclusion was drawn;
i) Traditional irrigation farming system contributed significantly to the
food security and householders’ income of smallholder farmers which
made their life better than those practicing rain fed system.
65

ii) The main occupation of the households in the study area was farming
(crops cultivation), however their production from traditional irrigation
is constrained by water shortage.
iii) Food insecurity among households in the area was mainly due to
persistent drought, shortage of water for irrigation, low rate of using the
new agricultural techniques, high price of inputs, immediately sell of
crops after harvest.
iv) Despite the positive contribution of traditional irrigation to households’
food security and income, the practice is limited by; inadequate water
sources, poor irrigation infrastructure, poor plot borders in the field,
especially in the irrigated lowland areas causing water losses.
5.2 Recommendations
a) Traditional irrigation should be encouraged and developed by all
stakeholders in order to maximize crops output and profits. This can
done through provision of adequate extension services, input
availability, marketing, financial services, and improved
infrastructures.
66

b) Suitable water management is the key important factor for the
country to achieve sufficient food production. From the study area,
farmers were complaining about the issue of water shortage for
irrigation. The government and other stakeholders should assist the
rehabilitation of irrigation infrastructure which can help to reduce the
problem.
c) As long as water from micro dam (Ndiva) is very little, participatory
building of irrigation canals with cement or transferring water by
pipes can reduce water losses through leakages. Furthermore, the
introduction of drip or/and sprinkler irrigation methods, especially in
the highlands can make crop production more efficient.
d) Water harvesting is another good strategy in making irrigation more
efficient for crop production through water reservoir. This will
reduce the problem of water shortage.
REFERENCES
Adams, W.M., Potkanski,T., and L.G. Sutton. (1994). Indigenous Farmer-Managed
Irrigation in Sonjo, Tanzania. The Geographical Journal 160(1): 17-32.
Adhavaryu, J.H., Tisdell, C.A., and Smith, R.W. (1983). Irrigation and agricultural
growth. India Journal of agricultural economics 42: 22-33.
67

Alcamo, J., Doll, P., Henrichs, T., Kaspar, F., Lehner, B., Rosch, T., and Siebert, S.
(2003). Global estimates of water withdrawals and availability under
current and future. Hydrological Sciences Journal 48(3): 339–348.
Aliber, M. (2003). Chronic poverty in South Africa: incidence, causes and policies.
World Development 31 (3): 473-490.
Andrew, W.S. (1993). A guide to marketing costs and how to calculate them.
Marketing and Rural Finance Service, FAO, Rome. 33pp.
Anthony, D. (2000). The effects of Gender Relation on Water Resource
Management: A case study of Serengeti District, Tanzania. Dissertation for
award of MSc Degree at University of Dar es salaam, Tanzania. 13pp.
Arharya, G.and Barbier, E.B. (1999). Valuing groundwater through agricultural
production in the Hadejia-Nguru wetlands in northern Nigeria. Journal
of Agricultural Economics 22: 247-259.
Baba, K.M. (1993). Irrigation development strategies in Sub-Saharan Africa:
Comparative study of traditional and modern irrigation systems in Bauchi
State of Nigeria. Journal of Agriculture, Ecosystems and Environment 45:
47-58.
68

Balirwa, E. K. (1990). An economic analysis of large scale irrigation scheme:
Dissertation for Award of Msc Degree at Sokoine University of Agriculture,
Morogoro, Tanzania.15pp.
Banzi, F.M., Kips, P.H.A., Kimaro, D.N., and Mbogoni, J.D.J. (1992). Soil
Appraisals of Four Village Irrigation Schemes in Mwanga District,
Kilimanjaro Region National Soil Service (NSS). Report. Tanga, Tanzania.
25pp.
Backeberg, G.R. (2006). Agricultural Water Research. Water Research
Commission Report, Rietfontein, Pretoria, 26 October 2006. 7pp.
Bembridge, T.J. (2000). Guidelines for rehabilitation of small-scale farmer
irrigation schemes in South Africa. Water Research Commission Report,
Pretoria. 163pp.
Biltonen, E., Tuan, D., and Wang, J. (2002). Making Irrigation Management Pro-
Poor: Lessons from China and Vietnam. Workshop on Asian Irrigation in
Transition, Bangkok, Thailand, 18 June 2002. 22pp.
Blank, H.G. (2002). The changing face of irrigation in Kenya: Opportunities for
anticipating changes in Eastern and Southern Africa. Nairobi
International Water Management Institute, Kenya. 20pp.
Bruinsma, J. (Ed.)(2003). World agriculture towards 2015/2030. FAO perspective.
FAO and Earth-scan Publ., Rome, London. 10pp.
69

CARE International in Tanzania (1995). Rapid food security and livelihood
assessment in Shinyanga, Mara, and Mwanza regions. Dar es salaam
University press, Dar es salaam. 152pp.
Chambers,R and Conway, G. (1992) Sustainable rural livelihoods: practical
concepts for the 21st century. IDS Discussion Paper 296. Institute of
Development Studies, University of Sussex, Brighton. 28pp.
Chiza, C.K. (2005). The Role of Irrigation in Agriculture, Food Security and
Poverty Reduction. Proceedings Annual Engineer’s workshop, Dar es
salaam, Tanzania. March 14-15 2005, 8-11pp.
Cizek, M. (2003). Economics of profitability of early potato production. Clarendon
Press, Uroda, Czech. 14pp.
Crosby, C.T., De Lange, M., Stimie, C.M. and Van Der Stoep, I. (2000). A review
of planning and design procedures applicable to small-scale farmer
irrigation projects. Water Research Commission, Pretoria. 241pp.
Debertin, D.L. (1992). Agricultural production Economics, second Edition
University of Kentucky. 44pp.
Dhawan, B.D. (1991). Role of Irrigation Raising Intensity of Cropping, Journal of
Indian School of Political Economy. 3(4) 632-671.
70

Dixon, A.B. and Wood, A.P. (2003). Wetland cultivation and hydrological
management in eastern Africa: Matching community and hydrological
needs through sustainable wetland use. Journal of Natural Resources
Forum 27: 117-129.
Doll, P. (2002). Impact of Climate Change and Variability on Irrigation
Requirements: Journal on Global Perspective Climate Change 54(3):
269–293.
Ellis, F. (2000). Rural Livelihoods and Diversity in Developing Countries. Oxford:
Oxford University Press Inc. 42pp.
FAO (1986). Irrigation in Africa South of the Sahara. Investment Centre Technical
Paper 5. Rome, Italy. 16pp.
FAO (1995). Assessment of the world food security situation. Technical paper 5.
Rome-Italy. 21pp.
FAO (1996). Fighting Hunger and Malnutrition. World Food Summit. Rome-Italy
13-17 November 1996. Roma-Italy. 14pp.
FAO (1997). Irrigation Technology transfer in support of food security.Water
Report 14. Rome- Italy 10pp.
71

FAO (2003). Water and food security- World food summit, Rome-Italy
[http://www.world.food summit] site visited 26/07/2007
FAO AQOSTAT, (October 2005). Review of agricultural water use per country.
[http://www.fao.org/ag/agl/aglw/aquastat/water] site visited 10/28/2008
Faures, J. M., Hoogeveen, J., and Bruinsma, J. (2002). The FAO irrigated area
forecast for 2030, FAO, Rome, Italy. 12pp.
Freeman, A.H. and Salim, S.S. (2001). Commercialization of smallholder
Irrigation: Economic and Social Implication in Semi-arid Areas of
Eastern Lino Printers, Nairobi, Kenya. 265pp.
Freeman, H. and Ellis, F. (2005). Rural Livelihoods and Poverty Reduction
Polices. Routledge Ltd, New York. 15pp.
Hamouz, K., Dvorak., P., Pivec, J., Cepl, J., (2005): Un woven fabric speeds up the
harvest of early potatoes. Uroda, Czech, 14-15pp.
Hatibu, N,, Mahoo, H.F., and Mziray, O.B. (2002). Relevance of Kenyan Irrigation
to Earsten and Southern African. International Water Management
Institute. Sokoine University of Agriculture. 33pp
72

Howard, P.K. (1996). The Rapid Evolution of Small- Basin Irrigation on Jos
Plateau Nigeria. Indigenous Soil and Water Conservation in Africa,
Earthscan Publication Ltd, London 65pp
IFAD (1999). Food Security and Vulnerability to Food Insecurity. The Concepts
[www.ifad.org/Householld] site visited on 20/03/2008
IFAD (2008). Ethiopia Special Country Project PhaseII. Project evaluation report.
Via del Serafico, Rome Italy. 2pp.
IWMI (2001). Improving Water and Land Resources Management for Food,
Livestock and Nature Annual Report Dar es salaam, Tanzania. 5pp.
Kadigi. R.M.J. (2006). Evaluation of livelihoods and economic benefit of water
utilization. Dessertation for Award of PhD at Sokoine University of
Agriculture, Morogoro, Tanzania. 113pp.
Kangalawe, R.Y.M and Liwenga, E.T. (2004). Sustainable Development and
Management of Wetland in Tanzania. Study of Kilimanjaro Valley.
Final Consultancy Report Submitted to FNPP. 15pp.
Karukulasuriya, P and Mendelson, F. (January 2007). Indigenous irrigation: The
impact of climate change on farmers in Africa. Policy Research Working
Paper Series from World Bank. [http://www.econpapers.repec.org] site
visited on 9/15/2007.
73

Kasambala, S.P. (2004). Assessment of water resource for food security in
Tanzania. Dissertation for Award of Msc Degree at Sokoine University
of Agriculture, Morogoro, Tanzania. 4pp.
Kaswamila, A.L and Masuruli, B.M (2004). The Role of Traditional Systems in
Poverty Alleviation in Semi-Arid Areas; The case of Chamazi in Lushoto
District, Tanzania. Mkuki and Nyota Publishers Ltd, Dar es salaam,
Tanzania. 14pp.
Kiagho, E. Y (2003). Policy instruments in integrated water resources management
and sustainable livelihoods in the great Ruaha River Basin. Dissertation
for Award of Msc Degree at Sokoine University of Agriculture,
Morogoro, Tanzania. 23pp.
Kimenye, L.N. (2000). Case study of factors affecting horticultural production and
marketing in Kibwezi division, Mkueni district, Kenya. Cooperative for
assistance and relief every where (CARE). 19pp.
Lankford, B. (2005) ’Irrigation, Livelihoods and River Basins: Rural Livelihoods
and Poverty Reduction Polices, Routledge Ltd, New York. 274pp.
74

Lema, A.J. (1996). Cultivating the valleys: vinyungu farming in Tanzania:
Sustaining the Soil. Journal on Indigenous Soil and Water
Conservation in Africa 13(3): 9-14.
MAFS and JICA (2003). The National Irrigation Master Plan: Action Plan Report.
Government Printer, Dar es salaam, Tanzania. 3pp.
Maganga, F.P and Juma, H.I. (2000). Changes in Land and Water Management in
Irrigated Areas of Tanzania. A study of Local Resource Management
Systems in Usangu plains. A Report Submitted to ENRECA, University
of Dar es salaam, Dar es salaam, Tanzania. 18pp.
Maganga, F.P. (1998). Indigenous Knowledge and Irrigation Development in
Tanzania. Experience from Msanzi, Nyeregete and Musa Mwijanga
Farmer-Managed Irrigation Schemes: African Perspective on Policies
and Practices Supporting Sustainable Development. University Dar es
salaam Press. Dar es salaam, Tanzania. 36pp.
Majule, A.E. and Mwalyosi, R.B.B. (2003). Enhancing agricultural productivity
through Sustainable irrigation: A case of vinyungu farming system in
selected zones of Iringa. Research Report Submitted to ENRECA,
University of Dar es Salaam Press, Dar es salaam, Tanzania. 4pp.
Makundi, F.K. (1996). Household Food security in Rural Tanzania. Dissertation for
Award of Msc Degree at Sokoine University of Agriculture, Morogoro,
Tanzania. 138pp.
75

Maregesi, G. (1993). Water Management Study in Farmer Managed Irrigation
Scheme of Lower Moshi. Dissertation for Award of Msc Degree at
Sokoine University of Agriculture, Morogoro, Tanzania. 94pp.
Maxwell, S and Frankenberg, T.R (1992). Household food security concepts,
indicators and measurements. A technical review. Blackwell science
ltd, New York and Rome. 274pp.
May, J. (2000). The structure and composition of rural poverty and livelihoods in
South Africa. In: Cousins B (ed.) At the crossroads: Land and agrarian
reform in South Africa into the 21st century. PLAAS, University of the
Western Cape, Belville. 21-34.
MALD (1997). Review of Tanzania Food and Agriculture Situation: A focus on
food security and poverty alleviation and influence bottleneck for food
security. Government printer, Dar es salaam, Tanzania. 85 pp.
MAFS (2003). The study on The National Irrigation Master Plan Reports.
Government Printer. Dar es salaam, Tanzania. 23pp.
MAFS (2004) Economic importance of traditional Irrigation in Tanzania
[http://www.icid.org/v_tanzania] sited visited 11/5/2007
76

MAFSC (2007). National Irrigation Policy Strategy report. Government Printer,
Dar es salaam, Tanzania. 23pp
Mkavidanda, T. and Kaswamila, A. (2001). The Role of Traditional Irrigation
Systems (Vinyungu) in Alleviating Poverty in Iringa Rural Districts:
Presented at the Fifth REPOA Workshops held at the White Sands
Hotel. April 18-19 April 2000, Dar es Salaam, Tanzania 10-20pp
Mintesinot, B., Verplancke, H., van Ranst, E., and Mitiku, H. (2004). Examining
Traditional Irrigation Methods: Irrigation Scheduling and Alternative
Furrows Irrigation on Vertisoils in Northern Ethiopia. Journal of
Agricultural Water Management. 5:17-30.
Moormann, F.R and van Breemen, N. (1978). Soil, Water and Land. International
Rice Research Institute. Los Banos Laguna, Philippines. 55pp.
Moriarty, P., Butterworth, J., van Koppen, B. and Soussan, J. (2004). ‘Water,
Poverty and Productive Uses of Water at the Household Level’
International Water and Sanitation Centre. Earthscan Publication ltd,
London. 49pp
Morris, J. (2002). Irrigation as a privileged Solution in African Development.
Development Policy Review 5: 99-123
77

Mrema, C.G. (1984). Development of Smallholder Irrigation in Tanzania. Problem
and Prospect. African Region Symposium on Smallholder Irrigation.
Harare, University, Zimbabwe. 70pp
Mtatifikolo, F. and Comoro, C. (1999). Population Dynamics and Poverty.
Study of the “Tomato culture Zone” Farming System in Iringa; Tanzania. A
Final Report Submitted to ENRECA, Economics Research Bureau
(ERB). University of Dar es Salaam, Tanzania. 28pp
Mutero, C.M. (1998). The Sustainable Use of Wetland Resources. Proceedings of
the Third International Wetlands Conference, Rennes, France, 19-23
September 1998. 13pp.
Mwalyosi,R.B.B and Majule, A.E. (March 2005). The Role of Traditional Irrigation
on Small Scale Agriculture in semi arid Environment, southern Highland
Tanzania [http://www.iwmi.cgiar.org/africa/files/riparwin] site visited
on 1/ 5/ 2007
Narayanamoorthy, A. (2001). Irrigation and rural poverty Nexus. Indian journal of
Agriculture Economics. 56(1): 15-19.
Ngigi, S.N (1999). Evaluation of irrigation research and development activities in
Kenyan: Towards promoting small-scale Irrigation Technologies.
University of Nairobi,Kenya. 20pp
78

Ngigi, S.N, (2005) Agricultural Water Management Kenyan irrigation Journal
73: 21–41
Nhkoma, O.S. (1998). Modeling of Field to Field Irrigation Method in Paddy Basin
for Efficient Water Management. Dissertation for Award of Msc Degree
at Sokoine University of Agriculture, Morogoro, Tanzania. 140pp.
Nicol, A. (2000) ‘Adopting a Sustainable Livelihoods Approach to Water projects:
Implications for Policy and Practice, Overseas Development Institute
(ODI), London. 43pp.
NIMP and JICA (2002). Government Policies on Irrigation in Tanzania:
Implementation Success and Challenges. Kishanda Holding Company,
Dar es salaam, Tanzania. 35pp.
Nyange, D. (Ed.)(2001). Natural Resource Management and food security.
Proceedings of the SADCC. Food Training Program on Agriculture and
Natural Resources Development Unit, Morogoro, Tanzania. 70pp
Nyborg, I. and Hang, R. (19994). Food indicators for development activities by
Norwegian NGOs in Mali, Ethiopia and Eritrea. Blackwell Publishers,
London. 38 pp.
79

OASIS and DFID (August 2003). Water for food security
[http;//www.Iboro.ac.uk/water done-fact-sheet/food security1. pdf ] site
visited on 15/08/2007
Ogomber, J.O. (2000). Potential Irrigated agriculture in Kenyan: Implication for
investment strategy: Preceeding on Investment Opportunity and
Challenges in Irrigated Agriculture for National and Household Food
Security. 17 May 2000 at Grant Regency Hotel Nairobi, Nairobi,
Kenya. 12-18pp.
Ojungu, O.P.H. (1992). Resource Management in Developing Countries. Longman,
John Wiley and Sons, New York. 29pp.
Orota, G.C.L.(1993). A socio- Economic analysis of modern irrigation project
under Small-scale farming. Dissertation for Award of Msc Degree at
Sokoine University of Agriculture, Morogoro, Tanzania.
Ponte, S. (2002). Agricultural crop Markets in East Africa: Local Responses to
Global Challenges. Working Paper Center for Development Research.
Copenhagen. 15pp.
Riely, F., Nacy, M., Bruce, C., Laura, B., and Kenefick, M. (1995). Food Indicator
and Framework for Use in Monitoring and Evaluation of Food aid
Programs. USAID, Washngton DC. 37pp.
80

Rukuni, M and Eicher, C. K (1987). Food Security for Southern Africa. University
of Zimbabwe/ Michigan State University, Food Security Project.
University of Harare, Zimbabwe. 406pp
Satpathy, T. (1984). Irrigation and Economic Development. Ashish publishing
house, New Delhi, India. 21pp.
Scott, G.J. (Ed) (1995). Prices, Products, People: Analyzing Agricultural Markets
in Developing Countries. Lyenne Reinner Publishers, USA. 267pp.
Sepela, M. (1996). Rural livelihoods and diversity in developing countries. Oxford
university press, London. 76pp.
Sharma, U.C. (2001). Water resources and their management for food security.
National Agriculture Technology Project (NATP), P.I.U.L.B and
Sharma Center [http://www.ensmp.fr/iash/maastrich/si/ SHARMA] site
visited on 29/12/2007
Shiklomanov, I. A (2000). Appraisal and Assessment of World Water Resources.
United States Geological Survey (USGS). Journal for Water
International 25(1): 11-32.
Soil Water Management Research Group (2005). Experiences with Micro
Agricultural Water Management Technologies: Tanzania.
[http://www.sarpn.org.za/documents/Tanzania_AWM report] site visited
on 11/ 5 / 2007.
81

TNBS (November 2002). Household Budget Survey, 2000/2002.
[http//www.tanzania.go.tz/hbs/factsheet.htm] site visited on 15/02/2008
Tarimo, A.K.P.R., Kihupi, N., Mkoga, Z.J., Berhott,J. (2004a). Irrigation water
management in farm managed irrigation systems. A Guide for Farmer
and Extension officers. TARP II- SUA Project. Morogoro. 10pp.
Tafesse, M. (2003). Small-scale irrigation for food security in sub- Saharan Africa.
Report and recommendations of a CTA. [http://www.cta] sited visited on
21/10/2008.
Tiep, N.X. (2002). Water Resource and Food Security in Vietnam. Paper Presented
at the National Workshop on Water, Food and Environment. Hanoi,
Vietnam. 13pp.
TIP (2004). Community Participation in Traditional Irrigation Scheme
Rehabilitation Project in Tanzania. Report of Collaborative Research
Project, Moshi, Tanzania. 8pp.
TIP (2006). TIP Achievements in Partner Districts. Monitiring and Evaluation
report Unit. Moshi, Tanzania. 8pp.
82

UNCSD (1997). Comprehensive assessment of the freshwater resources of the
world, Report. [http://www.un.org/esa/sustdev/sdissues/water/water
documents.htm] site visited on 6/15/2008.
URT (2001). Poverty Reduction Strategy Paper. Government Printer, Dar es
salaam, Tanzania. 63pp.
URT (2001). Agricultural and Sector Development Strategy. Dar es salaam,
Tanzania.16pp.
URT (2002). National water Policy. Government Printer, Dar es salaam, Tanzania.
38pp.
URT (2002). Kilimanjaro Region Socio-Economic Profile. National Printing
Company, Dar ea salaam, Tanzania. 212pp.
URT (2005). Agriculture Sector Development Strategy. Dar es salaam, Tanzania.
30pp.
URT (2006). National Strategy for Growth and Reduction of Poverty. Government
Printer, Dar es salaam, Tanzania. 18pp.
VECO-Tanzania (2005). Same Local Governance for Sustainable and Economic
Development Programme Report. Kishanda Holding Ltd, Dar es salaam,
Tanzania. 16pp.
83

VECO-Tanzania (2006). Marketing system of Agriculture Products in Same
District Report. Kishanda Holding Ltd. 10pp.
Veneman, A. M.; Jen, J. J.; and Bosecker, R. R. (April 2004). Census of Agriculture
Farm and Ranch Irrigation Survey. United States Department of
Agriculture (USDA), National Agricultural Statistics Survey (NASS).
[http://www.usda.gov/nass] site visited on 10/27/2008
Ward, F.A and Michelsen, A. (2002). The economic value of water in agriculture:
concepts and policy applications. Water policy 4(5): 423-446
Wisconsin University (March 2002). Food Security Project.
[http://www.uwx.edu/ces] site visited on 02/04/2008
World Bank (2003). Agricultural change and food security: World Development
Report. Kluwer Academic Publishers, Washington D.C. 145 pp.
Word Fact Book (October 2007) Central Intelligence Agency (CIA), GDP -
composition by sector- Tanzania [F:\CIA The world fact book
tanzania.htm] site visited 15/ 10/ 2007
Young, R. (1996). Measuring Economic Benefits for Water and Investment
Policies: World Bank Technical Report Paper. Kluwer Academic
Publishers, Washington D.C. 23pp.
84

APPENDICES
APPENDIX 1: QUESTIONNAIRE FOR SURVEY ON
TRADITIONAL IRRIGATION SYSTEMS AND LIVELIHOODS OF
85

SMALLHOLDER FARMERS
A1: Basic household informationA1.1 Questionnaire number A1.2 Date of interview A1.3 Village/subvillage
names
A1.4 Ward A1.5 Division A1.6 Respondent’s name
A1.7 Respondent’s age A1.8 Respondent’s gender
A1.9.Marital status A1.10 Education level1) Married2) Single3) Divorced4) Widow
1) Informal education
2) Primary3) Secondary4) Post secondary
A2 Household compositionHousehold characteristics NumberChildren under 15 yearsAdult above 14 yearsElder above 65 yearsTotal household size
A3 What is the status of your house?
Wall construction Roof construction Electricity Piped water1 = Concrete 2 = Bricks3 = Wood4 = Mud
1 = Tiled2 = Corrugated iron3 = Thatch
1 = Yes2 = No
1 = Yes2 = No
A4.1 Do you possess livestock? 1= Yes 2= No
A4.2 If yes, what income earned from livestock per year? Type of livestock Total income per year Tshs1 Sales of cattle2 Sales of goats3 Sales of pig4 Sales of chickens
86
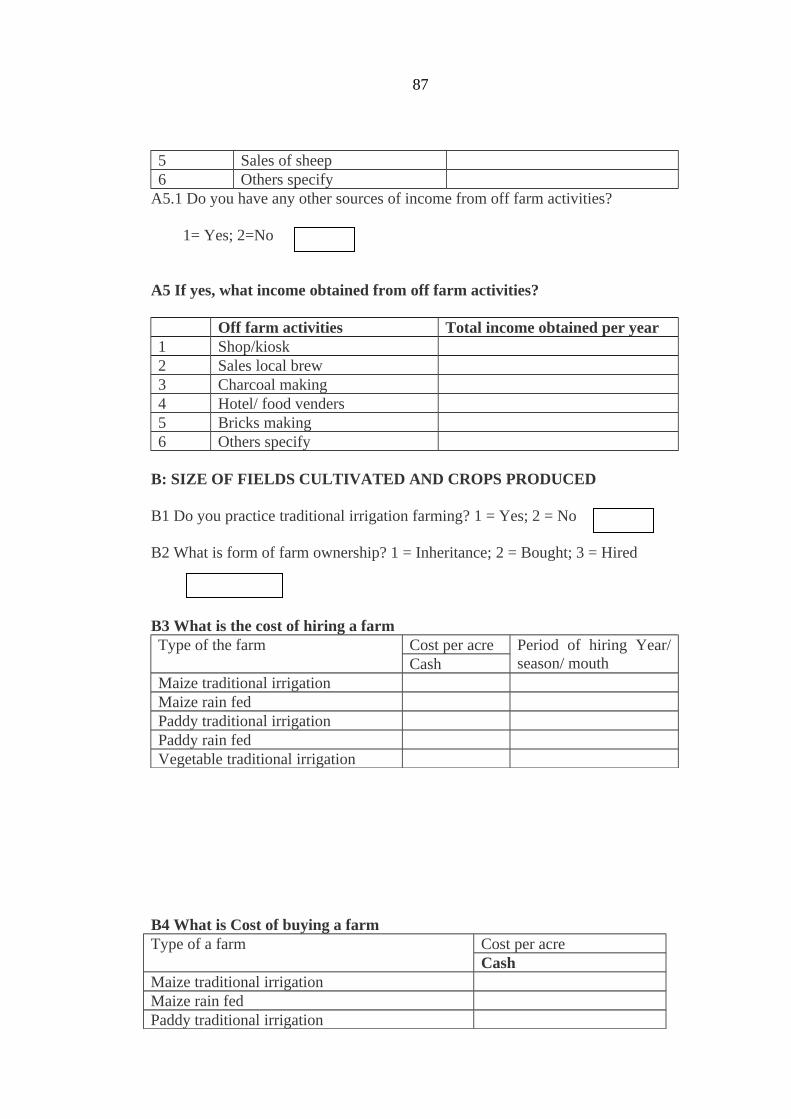
5 Sales of sheep6 Others specify
A5.1 Do you have any other sources of income from off farm activities?
1= Yes; 2=No
A5 If yes, what income obtained from off farm activities?
Off farm activities Total income obtained per year1 Shop/kiosk2 Sales local brew3 Charcoal making4 Hotel/ food venders5 Bricks making6 Others specify
B: SIZE OF FIELDS CULTIVATED AND CROPS PRODUCED
B1 Do you practice traditional irrigation farming? 1 = Yes; 2 = No B2 What is form of farm ownership? 1 = Inheritance; 2 = Bought; 3 = Hired
B3 What is the cost of hiring a farmType of the farm Cost per acre Period of hiring Year/
season/ mouth CashMaize traditional irrigationMaize rain fedPaddy traditional irrigationPaddy rain fedVegetable traditional irrigation
B4 What is Cost of buying a farmType of a farm Cost per acre
CashMaize traditional irrigationMaize rain fedPaddy traditional irrigation
87

Paddy rain fedVegetable traditional irrigation
B5 What is the farm size in each crop?
Crop cultivated Area per acreMain rain season(Mach-June)
Dry season (June-October)
Short rain season (October-January)
MaizePaddyBeanRound potatoesOthers specifyVegetables
• Tomatoes• Cabbage• Onions• Chinese• Others
specify
C: EVALUATION OF TRADITIONAL IRRIGATION MANAGEMENT
C1 Which sources of water do you use for traditional irrigation?
C2 How is the furrow managed? 1 = Water user group; 2 = Farmers association; 3 = No management
C3 Does this furrow have an official statutory water right issued by the water office? 1 = Yes; 2 = No
C4 If yes when statutory water right was granted?
C5 Do you pay for the water you are irrigating from this source? 1 = Yes; 2 =No C6 If yes how much do you pay?
C7 How often do you pay? 1 = Per year
88

2 = Once per year3 = Once per mouth4 = After irrigation5 = Others specify
C8 What is the use of the money you pay?
D: CONTRIBUTION OF TRADITIONAL IRRIGATION TO FOOD SECURITY
D1 Which crops is cultivated for food security from traditional irrigation?
D2 Do your crop harvested sustains the household up to the next harvest? 1 = Yes; 2 = No
D3 How frequent do you take your meals? 1 = One; 2 = twice; 3 = Thrice; 4 = irregularly D4 Have you ever experience food deficit since 2004 to date? 1=Yes 2=No
D5 Do you purchase crops for food 1= Yes; 2 = No
D6 Comment how traditional irrigation contribute to your household food security ………………………………………………………………………………… ………………………………………………………………………………………. ……………………………………………………………………………………….
E: INCOME AND FOOD OBTAINED FROM TRADITIONAL
IRRIGATION AND RAIN FED E1 Food and income obtained from traditional irrigation per year
89

E1.1 Which crop is produced and farm size per acre? Crop Area per acre1234
E1.2 How much quantity of harvest obtained per acre? Crop Quantity of harvest in Kg1234
E1.3 Do you store your crops for food from traditional irrigation 1= Yes; 2= No E1.4 If yes, what quantity of crops harvested were stored for food?
Crop Quantity stored in Kg1234
E1.5 What quantity of crop produced were sold? Crop Crops sold in Kg1234
E1.6 What is average price of crops sold? Crop Average price in Kg1234
E1.7 What income obtained in each crop were obtained per year? Crop Total income obtained in Tshs1234
90

E2 Food and income obtained from rain fed per year
E2.1 What is the crop produced and farm size per acre?
Crop Area per acre1234
E2.2How much quantity of harvest obtained per acre?
Crop Quantity of harvest in Kg 1234
E2.3 Do you store crops for food from traditional irrigation1= Yes; 2= No
E2.4 If yes, what amount of crops harvested were stored for food?
Crop Quantity stored in Kg1234
E2.5 What quantity of crop produced were sold?
Crop Crops sold in Kg1234
E2.6 What is average price of crops in kg? Crop Average price in Kg1234
91

E2.7 What income in each crop obtained per year?
Crop Total income obtained in Tshs1234
E3 Cost of inputs used in crop production
E3.1 What type of inputs used, cost and quantity in each crop produced under traditional irrigation Crop Type and quantity of inputs used in each crop1 Type of input
Quantity usedCost
2 Type of inputQuantity usedCost
3 Type of inputQuantity usedCost
4 Type of inputQuantity usedCost
E3.2 What type of inputs used, cost and quantity in each crop produced under rain fed Crop Type and quantity of inputs used in each crop1 Type of input
Quantity usedCost
2 Type of inputQuantity usedCost
3 Type of inputQuantity usedCost
E4 Labour cost in crop production
E4.1 Which activities is performed by family labor ……….………………………………………………………………………………………
92

………………………………………………………………………………………………………………………………………………………………………
E4.1 What activities is performed and costs of labour from traditional irrigation
Crop Activities performed Cost inTshsPaddy
Maize
Bean
Vegetables
E4.2 What activities is performed and costs of labour from rain fed
Crop Activities performed Cost inTshsPaddy
Maize
Bean
Others specify
E5 What challenges or problems do you face in traditional irrigation farming? .………………………………………………………………………………… …………………………………………………………………………………….. ………………………………………………………………………………………
93

E6 How do you solve these challenges you face? ……………………………………………………………………………………… …………………………………………………………………………………………..E7 Do you have any comments on traditional irrigation farming? ……………………………………………………………………………………… ……………………………………………………………………………………… …………………………………………………………………………………….
THANK YOU FOR YOUR COOPERATION
94