Trading Central R Platform Help - icmcapital.co.uk CENTRAL RESEARCH PLATFORM HELP GUIDE ... O ur te...
21
Trading Central Research Platform Help
Transcript of Trading Central R Platform Help - icmcapital.co.uk CENTRAL RESEARCH PLATFORM HELP GUIDE ... O ur te...
Trading CentralResearch Platform Help
1
TRADING CENTRAL RESEARCH PLATFORM
HELP GUIDE
Welcome to the TRADING Central Research Platform Help Guide. This Help Guide aims to explain the key features of the platform, how to search for the research you require and how to interpret the research TRADING Central publishes.
CONTENTS
1. INTRODUCTION TO TRADING CENTRAL 2
2. THE RESEARCH PLATFORM 3
3. THE TECHNICAL ANALYSIS SECTION 4
4. THE TECHNICAL ANALYSIS REPORT 12
5. THE TECHNICAL ALERTS SECTION 15
6. THE JAPANESE ALERTS SECTION 16
7. THE SETTINGS SECTION 17
8. TRADING CENTRAL DISCLAIMER 19

2
INTRODUCTION TO TRADING CENTRAL
TRADING CENTRAL is a leading investment research provider to financial marketprofessionals. Our technical strategies cover equity, index, forex, commoditiesand fixed-income markets. Our market depth and knowledge are attributed to ouracquired experience on trading floors of many banking institutions.
Technical analysis is our core business. Our award-winning methodology isbacked by time-tested indicators. Our chartist and mathematical approachesmatch requirements of various investment styles, from intraday trading to swingtrading and long term investments. Leading financial institutions rely upon our expertise and added value:100+leading global financial institutions in 30 countries trust TRADING CENTRAL
TRADING CENTRAL is a Certified Member of three Independent ResearchProviders (IRP) Associations : Investorside, Euro IRP and Asia IRP. Financialresearch produced by TRADING CENTRAL is independent, aligned with investors’interests and free from investment banking conflicts.
TRADING CENTRAL is compliant with and regulated by three leading market
authorities:
In Europe, TRADING CENTRAL SA is compliant with the AMF (Autorité desMarchés Financiers), the French regulatory body.
In the United States, TRADING CENTRAL AMERICAS, INC. is a RegisteredInvestment Adviser (RIA) with the U.S. Securities and Exchange Commission(SEC) under IARD/CRD number 801-67210.
In Asia, TRADING CENTRAL ASIA LTD has received a license (number AWI815)from the Hong Kong-based Securities and Futures Commission (SFC) to conduct“Type 4” and “Type 5” regulated activities (Advising on Securities and Futures).

3
THE RESEARCH PLATFORM
QUICK REFERENCE
1. Select the language in which you would like to receive the research 2. Select which asset class you require 3. The Technical Analysis reports section 4. The Technical Alerts signals section 5. The Japanese Candlesticks signals section 6. This search box allows you to search for any instrument listed on the platform 7. Allows you to access your personal Portfolio or Watch List (see Technical Analysis reports section for further details)
The first time you login into the TRADING Central Research Platform, you will by
default arrive at the Indices Research Index Page (See the Settings Section tochange). This landing page will be your gateway to accessing research on over7,000 global instruments issued by TRADING Central.

4
You are able to navigate to the Index Page of any asset class (i.e. Indices,Sectors, Stocks, Forex, Bonds, Commodities and Portfolio) by clicking on one of
the titled links at the top of the page.
The Index Page for each of the asset classes is divided into three main sections:
- The Technical Analysis reports section (under the red bar)
- The Technical Alerts signals section (under the yellow bar)
- The Japanese Candlesticks signals section (under the purple bar)
A more detailed explanation is available on each of these areas further on in theHelp Guide (See Contents Page).
For a quick search on any instrument within TRADING Central’s universe ofcovered instruments, you can use the search box located under the TRADINGCentral logo. Just enter the Ticker code or partial name within this search box andpress Enter or click on the green magnifying glass to start the search.
A pop-up window will appear with all instruments relating to your search, toaccess the Technical Analysis Report, click on the Ticker or Name of thedesired instrument. You can also Add/Delete instrument to your Portfolio or
Watch List from this window.
Finally, you are able to access TRADING Central’s research in 8 languages byclicking on one of the flags near the top of the page. Should a particular researchpiece not be available in the language of your choice, it will be listed in English.
5
THE TECHNICAL ANALYSIS SECTION
QUICK REFERENCE
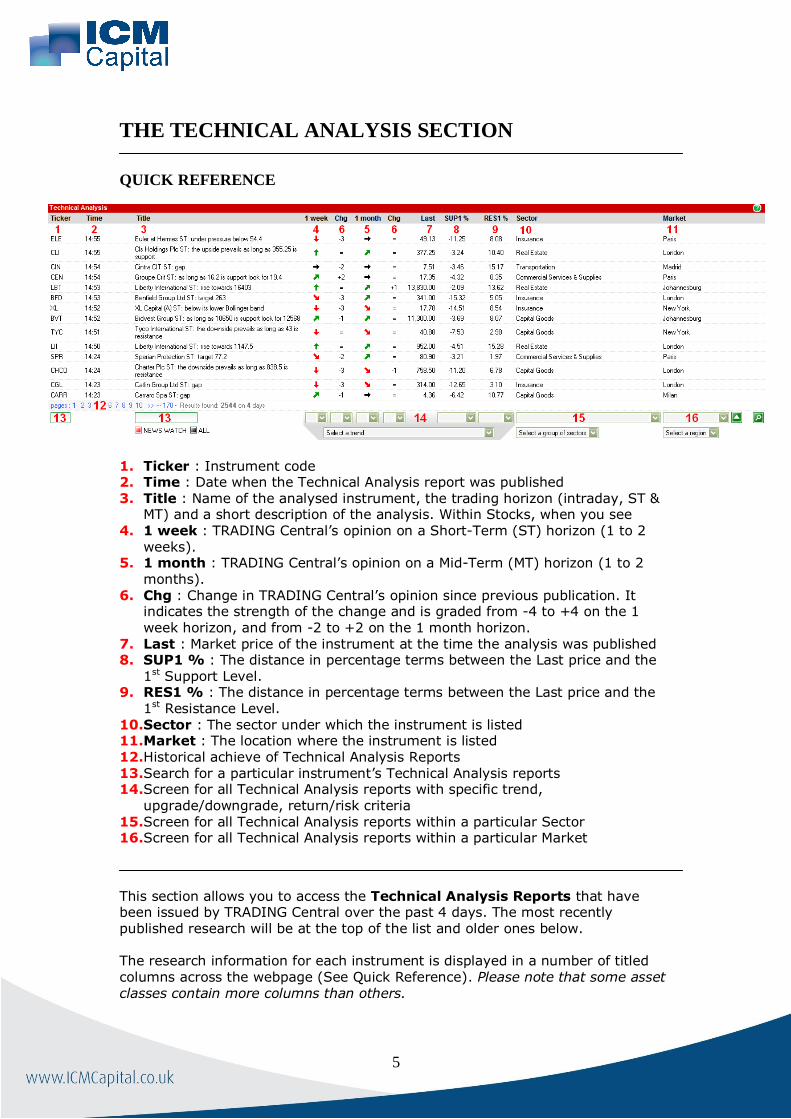
1. Ticker : Instrument code 2. Time : Date when the Technical Analysis report was published 3. Title : Name of the analysed instrument, the trading horizon (intraday, ST &
MT) and a short description of the analysis. Within Stocks, when you see 4. 1 week : TRADING Central’s opinion on a Short-Term (ST) horizon (1 to 2
weeks). 5. 1 month : TRADING Central’s opinion on a Mid-Term (MT) horizon (1 to 2
months).
6. Chg : Change in TRADING Central’s opinion since previous publication. It indicates the strength of the change and is graded from -4 to +4 on the 1 week horizon, and from -2 to +2 on the 1 month horizon.
7. Last : Market price of the instrument at the time the analysis was published 8. SUP1 % : The distance in percentage terms between the Last price and the
1st Support Level. 9. RES1 % : The distance in percentage terms between the Last price and the
1st Resistance Level. 10. Sector : The sector under which the instrument is listed 11. Market : The location where the instrument is listed 12. Historical achieve of Technical Analysis Reports 13. Search for a particular instrument’s Technical Analysis reports 14. Screen for all Technical Analysis reports with specific trend,
upgrade/downgrade, return/risk criteria 15. Screen for all Technical Analysis reports within a particular Sector 16. Screen for all Technical Analysis reports within a particular Market
This section allows you to access the Technical Analysis Reports that have been issued by TRADING Central over the past 4 days. The most recently published research will be at the top of the list and older ones below.
The research information for each instrument is displayed in a number of titled columns across the webpage (See Quick Reference). Please note that some asset classes contain more columns than others.

6
The Ticker and Title columns contain the unique ticker symbol and name of theinstrument. The Title column will also detail the investment horizon of the
Technical Analysis Report: Intraday, ST (Short-Term, 1-2 Weeks) and MT (Mid-Term, 1-2 months). In addition, when you see NEWSWATCH, it refers to acorporate announcement being expected on the instrument that day.
The 1 Week column details what TRADING Central’s Short-Term Trend Opinion isfor that instrument for the coming 1-2 weeks. There are 5 possible trendsoptions:
Bullish, Limited Upside, Consolidation, Limited Downside, Bearish
The 1 Month column details what TRADING Central’s Mid-Term Trend Opinion isfor that instrument for the coming 1-2 months. There are only 3 possible trendsoptions:
Bullish, Consolidation, Bearish
After both the 1 Week and 1 Month columns there is a Chg column that detailsthe change in TRADING Central’s Trend Opinion since the last Technical AnalysisReport was published.
The Last column details the Last Market Price at the time the Technical AnalysisReport was published.
Within the Stocks Index Page, the SUP1 % column details the distance of thenearest support level in percentage terms based on the Last Market Price. Itindicates the potential risk in a bullish scenario and the potential return in abearish scenario.
The RES1 % column details the distance of the nearest resistance level inpercentage terms based on the Last Market Price. It indicates the potential risk ina bearish scenario and the potential return in a bullish scenario.
The Sector column details the relevant sector for a stock, while the Marketcolumn details the location of the exchange for that stock.
Towards the bottom of the Technical Analysis Section there are a number of
Search Tools that allow you to screen for Technical Analysis Reports that meetyour search criteria. Please note that some asset classes contain more searchboxes than others due to the number of columns available.
The Pages links allow you to access a historical achieve of Technical AnalysisReports over the past 4 days.
The search boxes outlined in green below the Ticker and Title columns allow youto search for a particular instrument’s Technical Analysis reports within that assetclass. Just enter the Ticker code or partial name within this search box and pressEnter or click on the green magnifying glass to start the search.
Example: If in the 1 Week column displayed a Bullish Short-Term Trend Opinion
and the correlating Chg column displayed a +3 change. This would inform you thatTRADING Central’s Short-Term Trend Opinion displayed Limited Downside on thepreviously published Technical Analysis Report for that instrument.

7
The drop-down search boxes under the 1 Week and 1 month columns allow youto screen for TRADING Central’s trend opinion on that horizon. The 1 week search
box ranges from +2 to -2 due to the five trend options available, while the 1month search box only ranges from +1 to -1 due to the 3 available trend options.
The drop-down search boxes under each of the Chg columns allow you to screenfor upgrades or downgrades in TRADING Central’s trend opinion since the lastTechnical Analysis Report on an instrument was published. The 1 week Chgsearch box ranges from +4 to -4 to represent the maximum upgrade/downgradein TRADING Central’s trend opinion, while the 1 month Chg search box onlyranges from +2 to -2.
Within the Stocks Index Page, the drop-down search boxes under the SUP1 %and RES1 % columns allow you to screen for potential returns and risks whentrading the strategies within the Technical Analysis Reports. The options available
should be interpreted as ranges for a particular level or return/risk, so 0-3%, 3-6%, 6-9%, 9-12% and over 12%.
There is also an additional Select a Trend drop-down search box that allows youto choose a preset trend or you can create your own trends (See Advanced Toolsbelow)
The drop-down search boxes under the Sector and Market columns allow you toscreen for stocks within a sector or exchange.
There is also an additional Select a Group of Sectors and Select a Region drop-down search boxes that allow you to choose a preset region or create your owngroup of sectors/exchanges (See Advanced Tools below).
Example: To search for a Bullish Short-Term Trend Opinion on the 1 Weekhorizon, you would select +2 from the search box under the 1 week column.
To search for a Limited Downside Trend Opinion on the 1 Month horizon, youwould select -1 from the search box under the 1 month column.
Example: To screen for all stocks within an asset class with a potential return ofover 12% and a risk of 0-3%, you would select -3<x<0 for SUP1 % and x<12 forRES1 %

8
ADVANCED TOOLS
Customize Select a Trend
Create personalised filters based on a range of parameters: To create your own trend screening filters, select Customize from the list shown in the Select a Trend drop-down search box.
A popup window will open allowing you to create your own desired filters. In addition, this popup window allows you to modify or erase any existing personal filters you have created.
To create a new trend, enter the name you wish to assign the trend in the Name box, then select which parameters you wish to screen for and finally click on Add.
Click on Close the Window to save changes and exit, it will now also appear in the Select a Trend search box highlighted in purple:
Amend personalised filters: To amend any previously created trends, open the Customize popup window, select the trend from the Create a new trend window, change the name (if required), enter the new parameters you wish to search and click Update.
Click on Close the window to save changes and exit.
9
Delete personalised filters: To delete a trend, open the Customize popup window, select the trend from the
Create a new trend window and click on Delete. Click on Close the window to savechanges and exit.
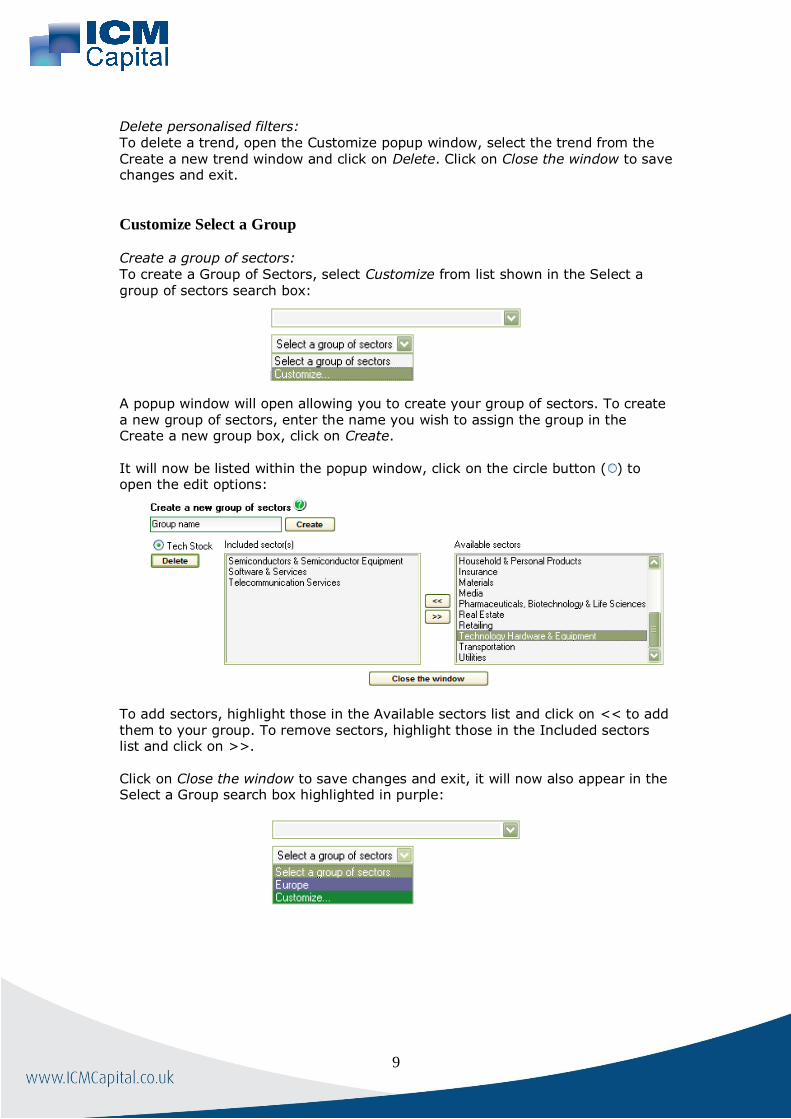
Customize Select a Group
Create a group of sectors:
To create a Group of Sectors, select Customize from list shown in the Select agroup of sectors search box:
A popup window will open allowing you to create your group of sectors. To createa new group of sectors, enter the name you wish to assign the group in theCreate a new group box, click on Create.
It will now be listed within the popup window, click on the circle button ( ) toopen the edit options:
To add sectors, highlight those in the Available sectors list and click on << to addthem to your group. To remove sectors, highlight those in the Included sectorslist and click on >>.
Click on Close the window to save changes and exit, it will now also appear in theSelect a Group search box highlighted in purple:

10
Amend a group of sectors: To amend any previously created group of sectors, open the Customize popup
window, select the group of sectors you wish to amend by clicking on the circlebutton ( ), then follow the instructions above for adding or removing sectors.Click on Close the window to save changes and exit.
Delete personalised filters: To delete any previously created group of sectors, open the Customize popupwindow, select the group of sectors you wish to delete by clicking on the circle
button ( ) and click on Delete. Click on Close the window to save changes andexit.
Customize Select a Group
Create a Region: To create a Region, select Customize from list shown in the Select a group ofsectors search box:
A popup window will open allowing you to create your Region. To create a newRegion, enter the name you wish to assign the Region in the Create a new regionbox, click on Create.
It will now be listed within the popup window, click on the circle button ( ) toopen the edit options:
To add markets, highlight those in the right-hand list and click on << to add
them to your Region. To remove markets, highlight those in the left-hand list andclick on >>.
11
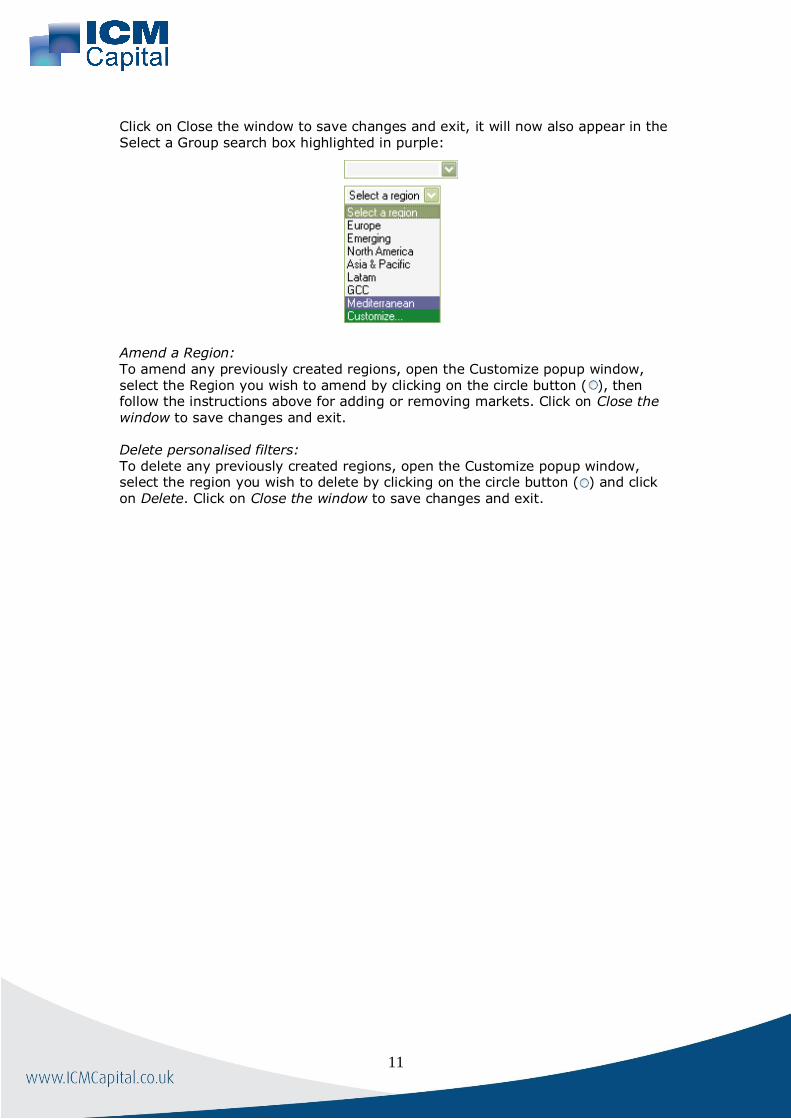
Click on Close the window to save changes and exit, it will now also appear in theSelect a Group search box highlighted in purple:
Amend a Region:
To amend any previously created regions, open the Customize popup window,select the Region you wish to amend by clicking on the circle button ( ), thenfollow the instructions above for adding or removing markets. Click on Close thewindow to save changes and exit.
Delete personalised filters: To delete any previously created regions, open the Customize popup window,select the region you wish to delete by clicking on the circle button ( ) and clickon Delete. Click on Close the window to save changes and exit.
12
THE TECHNICAL ANALYSIS REPORT
QUICK REFERENCE
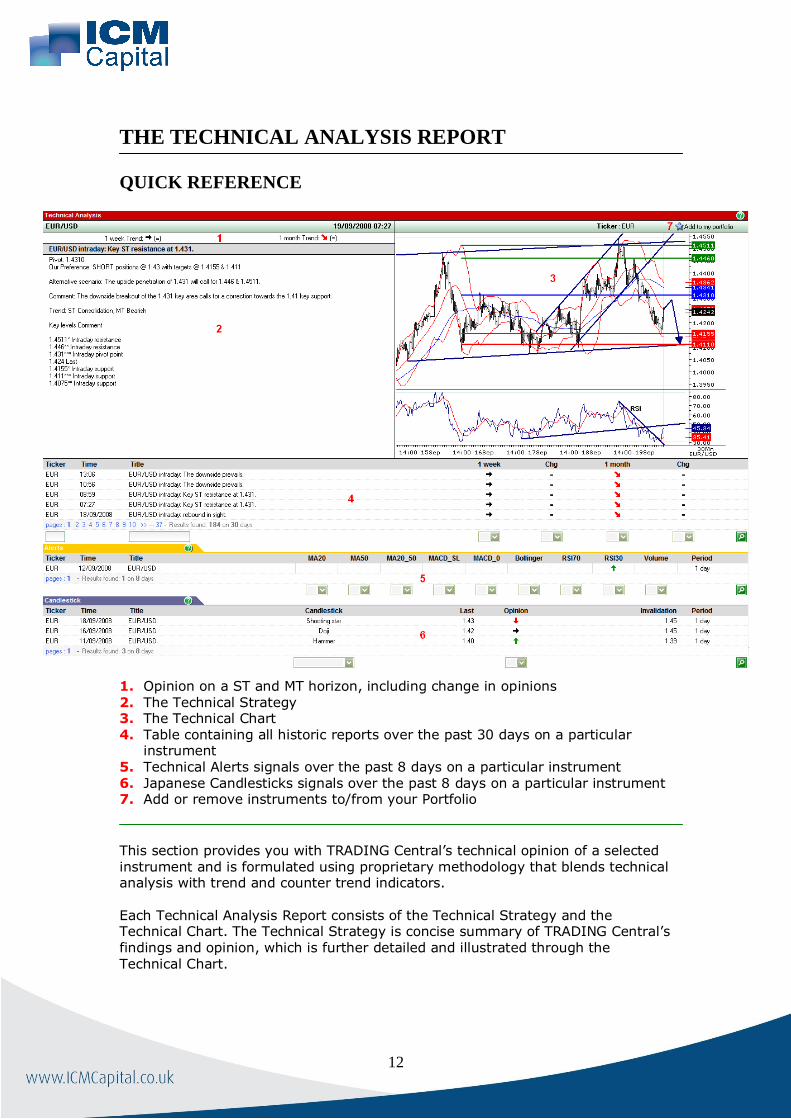
1. Opinion on a ST and MT horizon, including change in opinions
2. The Technical Strategy 3. The Technical Chart 4. Table containing all historic reports over the past 30 days on a particular
instrument 5. Technical Alerts signals over the past 8 days on a particular instrument 6. Japanese Candlesticks signals over the past 8 days on a particular instrument 7. Add or remove instruments to/from your Portfolio
This section provides you with TRADING Central’s technical opinion of a selectedinstrument and is formulated using proprietary methodology that blends technicalanalysis with trend and counter trend indicators.
Each Technical Analysis Report consists of the Technical Strategy and theTechnical Chart. The Technical Strategy is concise summary of TRADING Central’sfindings and opinion, which is further detailed and illustrated through theTechnical Chart.
13
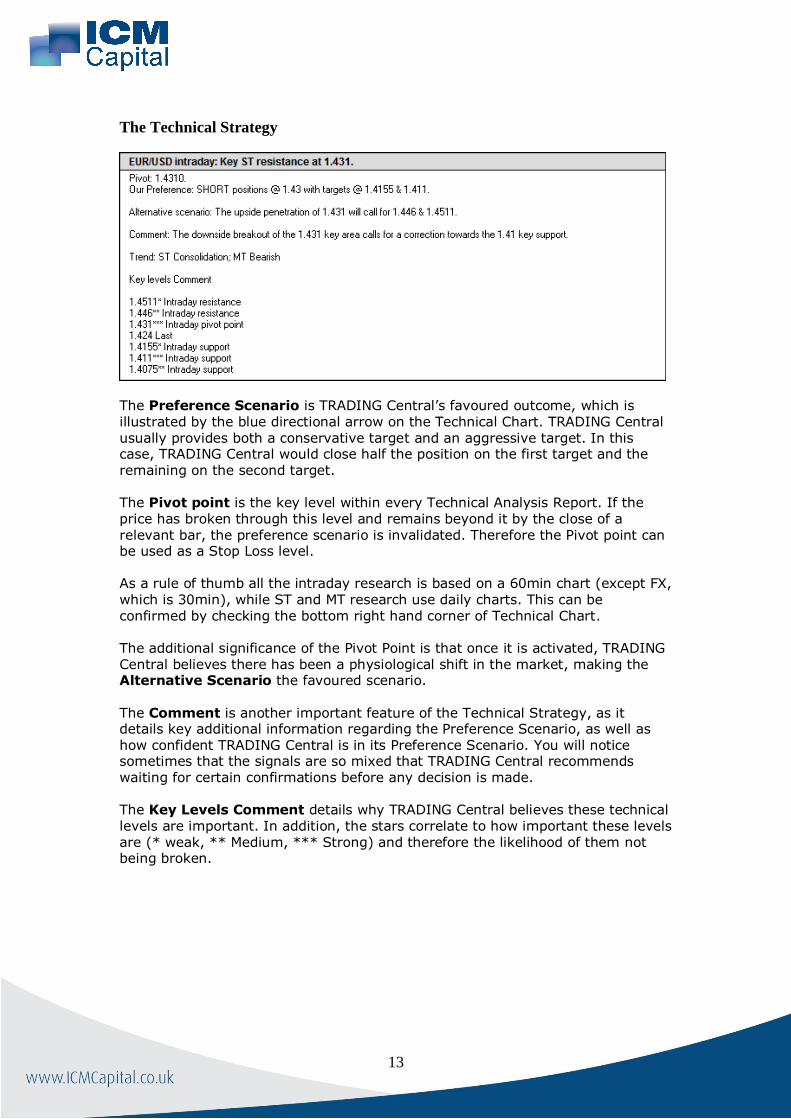
The Technical Strategy
The Preference Scenario is TRADING Central’s favoured outcome, which isillustrated by the blue directional arrow on the Technical Chart. TRADING Centralusually provides both a conservative target and an aggressive target. In thiscase, TRADING Central would close half the position on the first target and theremaining on the second target.
The Pivot point is the key level within every Technical Analysis Report. If theprice has broken through this level and remains beyond it by the close of arelevant bar, the preference scenario is invalidated. Therefore the Pivot point canbe used as a Stop Loss level.
As a rule of thumb all the intraday research is based on a 60min chart (except FX,
which is 30min), while ST and MT research use daily charts. This can beconfirmed by checking the bottom right hand corner of Technical Chart.
The additional significance of the Pivot Point is that once it is activated, TRADINGCentral believes there has been a physiological shift in the market, making theAlternative Scenario the favoured scenario.
The Comment is another important feature of the Technical Strategy, as itdetails key additional information regarding the Preference Scenario, as well ashow confident TRADING Central is in its Preference Scenario. You will noticesometimes that the signals are so mixed that TRADING Central recommendswaiting for certain confirmations before any decision is made.
The Key Levels Comment details why TRADING Central believes these technicallevels are important. In addition, the stars correlate to how important these levelsare (* weak, ** Medium, *** Strong) and therefore the likelihood of them notbeing broken.

14
The Technical Chart
Superimposed on the Technical Chart, the following may appear:
1. An arrow showing the direction of Preference Scenario (dark blue arrow) 2. The Pivot point (light blue horizontal line) 3. At least one support level (red horizontal lines) 4. At least one resistance level (green horizontal lines) 5. Key trading channels, price patterns and trend lines on the both the
Barchart and RSI (dark blue lines) 6. A 50-period moving average (light blue) 7. A 20-period moving average with 2 Bollinger bands either side (in red) 8. A 14-period RSI (under the Barchart)
In addition, occasionally there will be a 26,12,9-period MACD (under the RSI)
Below the Technical Strategy and Technical Chart is a table similar to the one inshown in the Technical Analysis section (See Technical Analysis Section). Itwill contain a historical achieve of Technical Analysis Reports over the past 30
days for the instrument are viewing.
Below this table are the Technical Alerts signals and Japanese candlestickssignals (See Technical Alerts Signals Section and Japanese Candlesticks SignalsSection). Similar to the table above, it contains a historical achieve of TechnicalAlerts signals and Japanese Candlesticks signals over the past 8 days.
15
THE TECHNICAL ALERTS SECTION
QUICK REFERENCE
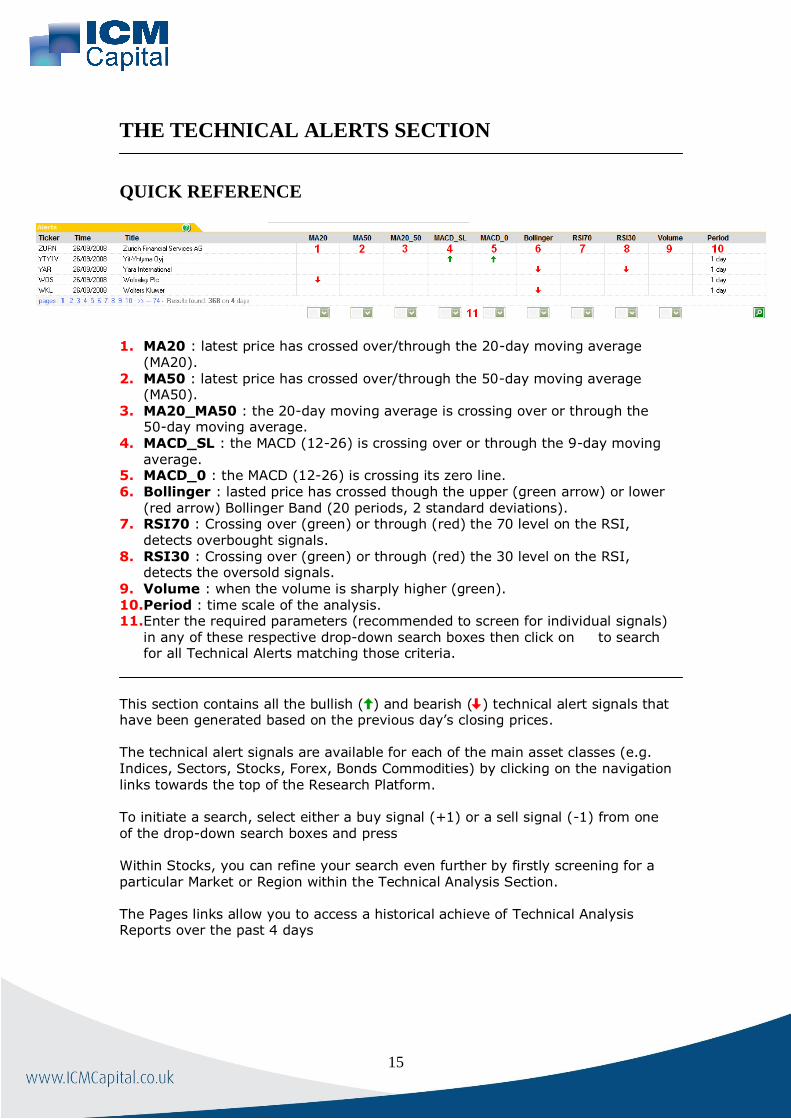
1. MA20 : latest price has crossed over/through the 20-day moving average(MA20).
2. MA50 : latest price has crossed over/through the 50-day moving average(MA50).
3. MA20_MA50 : the 20-day moving average is crossing over or through the50-day moving average.
4. MACD_SL : the MACD (12-26) is crossing over or through the 9-day movingaverage.
5. MACD_0 : the MACD (12-26) is crossing its zero line.
6. Bollinger : lasted price has crossed though the upper (green arrow) or lower(red arrow) Bollinger Band (20 periods, 2 standard deviations).
7. RSI70 : Crossing over (green) or through (red) the 70 level on the RSI,detects overbought signals.
8. RSI30 : Crossing over (green) or through (red) the 30 level on the RSI,detects the oversold signals.
9. Volume : when the volume is sharply higher (green). 10. Period : time scale of the analysis. 11. Enter the required parameters (recommended to screen for individual signals)
in any of these respective drop-down search boxes then click on to searchfor all Technical Alerts matching those criteria.
This section contains all the bullish ( ) and bearish ( ) technical alert signals thathave been generated based on the previous day’s closing prices.
The technical alert signals are available for each of the main asset classes (e.g.Indices, Sectors, Stocks, Forex, Bonds Commodities) by clicking on the navigationlinks towards the top of the Research Platform.
To initiate a search, select either a buy signal (+1) or a sell signal (-1) from oneof the drop-down search boxes and press
Within Stocks, you can refine your search even further by firstly screening for aparticular Market or Region within the Technical Analysis Section.
The Pages links allow you to access a historical achieve of Technical AnalysisReports over the past 4 days

16
THE JAPANESE CANDLESTICK SECTION
QUICK REFERENCE
1. Candlestick : The Japanese Candlestick pattern that has been identified. 2. Last : Market price of the instrument at the time the analysis was published. 3. Opinion : The bullish , bearish or end of current trend (bullish or bearish)
signal that correlates to a particular Japanese Candlestick pattern 4. Invalidation : If the market price of the instrument reaches this level then
the signal is invalidated 5. Period : time scale of the analysis 6. Enter the required parameters (recommended to screen for individual signals)
in any of these respective search boxes then click on to search for all
Japanese Candlestick Alerts matching those criteria.
This section contains all the bullish ( ) and bearish ( ) and reversal of trend ( ) Japanese Candlestick signals that have been generated based on the previous day’s closing prices.
The Japanese Candlestick signals are available for each of the main asset classes (e.g. Indices, Sectors, Stocks, Forex, Bonds Commodities) by clicking on the link towards the top of the Research Platform.
To initiate a search, select either a buy signal (+1) or a sell signal (-1) from one
of the drop-down search boxes and press
Within Stocks, you can refine your search even further by screening for a particular Market or Region within the Technical Analysis Section.
The Pages links allow you to access a historical achieve of Technical Analysis Reports over the past 4 days

17
THE SETTINGS SECTION
QUICK REFERENCE
1. Customize Your Access : The basic settlings to the TRADING CentralResearch Platform
2. Customize Your Search Engine : Add or change any multi-criteria searchfilters
3. Portfolio : Select whether to receive Pop-up and Email alerts This section allows you to customise your personal settings within the TRADINGCentral Research Platform. It is opened by clicking on the Customize my accesslink within the Profile box at the top of the Trading Central Research Platform.
The first area allows you to change your time zone, so all the research publishingtimes will be adjusted to your time zone. You can also change the Start Page to

18
an asset class that you most frequently trade, or even the Region of the Stockspage.
The next area allows you to add or modify any Multi-Criteria Search FiltersWithin the Technical Analysis Section (See Advanced Tools in Technical AnalysisSection).
The final area allows you to choose whether to receive Pop-up (active by default)and Email alerts for each of the instruments in your Portfolio. In addition, you can
delete the instruments you no longer require within your Portfolio from here.

19
TRADING CENTRAL DISCLAIMER
Copyright TRADING CENTRAL The information contained in this publication is not intended as an offer orsolicitation for the purchase or sale of any financial instrument. Any opinionoffered herein reflects TRADING Central current judgment and may changewithout notice. Users acknowledge and agree to the fact that, by its very nature,any investment in shares, stock options and similar and assimilated products ischaracterised by a certain degree of uncertainty and that, consequently, anyinvestment of this nature involves risks for which the user is solely responsibleand liable.
Services in the U.S. are offered through TRADING Central Americas, Inc.
TRADING Central is not registered in France as an Investment Services Providerbut complies with the following rules and directives, including: - General Regulation Handbook of the AMF, Book III, Title III, Chapter VII"Investment Analysts Not Associated with an Investment Services Provider" - EU Commission Directive 2006/73 dated 10 August 2006, Articles 24 and 25 - EU Commission Directive 2004/39 dated 21 April 2004 - EU Commission Directive 2003/125 dated 22 December 2003
This message is intended for recipient only and not for further distribution withoutthe consent of TRADING Central. Although TRADING Central attempts to sweep e-mail and attachments for viruses, it does not guarantee that either are virus-freeand accepts no liability for any damage sustained as a result of viruses.

www.ICMCapital.co.uk
Europe Middle East North Africa Asia
facebook.com/ICMCapital @ICMCapital ICM Capital ICMCapital ICMCapital
CFDs and Spot FX are leveraged products. Trading CFD's or Spot FX carries a high risk to your capital and can result in losses that exceed your deposits. You should not engage in this form of investing unless you understand the nature of the transactions you are entering into and the true extent of your exposure to the risk of loss. Your profit and loss will vary according to the extent of the fluctuations in the price of the underlying markets on which the trade is based.
ICM Capital Limited is authorised and regulated by the Financial Conduct Authority (FCA) Register Number: 520965. ICM Capital Limited is a wholly owned subsidiary of ICM Holding SARL, Registered address: 121, Avenue De La Faïencerie, L-1511 Luxembourg. ICM Capital Limited is a company registered in England and Wales, registered number: 07101360. Registered address: Dauntsey House, 4B Frederick's Place, London, EC2R 8AB, United Kingdom.
© Copyright ICM Capital Ltd 2011-2017 - All rights reserved.
Tel: +44 207 634 9770Fax: +44 207 516 9137
UK HeadquartersDauntsey House,
4B Frederick's Place, London, EC2R 8AB,United Kingdom
2016
BESTInstitutionalForex Broker
2015
BESTForex ECN
Broker
2014
BESTAffiliate
Programme
2013
BESTTechnology
Provider
2012
BESTCustomer
Service Provider
2011
BESTBest Forex
Broker
Sponsors of theEngland Polo Teamat Chestertons Poloin the Park 2017