trade while the African and Middle Eastern shares have ...
20
and production of rice by the Soviets increased rapidly between 1960 and 1980. However, consumption peaked at almost 3 million tons in 1980 and has remained below 2 million tons since then. Imports of rice by the Soviet Union have declined in response to declining consumption in the country. Although a net exporter of rice, China has increased its imports of rice since 1985 and imports may exceed 1 million metric tons in 1989. Chinese policy sets rice retail prices below world levels to provide low-cost food to urban workers. Yet this policy discourages farmers from producing rice and puts pressure on Chinese foreign exchange earnings. China may have difficulty meeting domestic demand unless its policies are changed. Developing countries import about 70 percent of world rice imports. While the share of this group of countries in total has remained relatively constant, there have been major changes in market shares by individual countries and regions. Since the early 1960's, the African and Middle Eastern countries have increased their shares of world imports, while the shares of Asian countries have fallen. Several factors are responsible for these changes. In the 1970's, rapid income growth and increased urbanization caused the demand for rice in many African and Middle Eastern countries to expand sharply. Increased urbanization shifted consumption patterns away from traditional staples, such as cassava in Africa, toward rice and wheat. Increased urban populations also prompted many governments to institute cheap food policies subsidizing politically active and vocal urban consumers while taxing farmers. These low prices for rice further stimulated consumption and dampened production increases, adding to large imports. From 1962 to 1971, milled rice imports by Middle Eastern countries annually averaged 373,000 metric tons. But in the next 10 years, total rice imports tripled to an annual average of 1.3 million tons each year. In 1987, the Middle East imported a record 2.8 million tons of rice. African rice imports followed a similar pattern, averaging about 635,000 tons from 1962 to 1971, then doubling to nearly 1.5 million tons (average annual basis) in the following decade. Africa imported a record 3 million tons of rice in 1982. These imports were paid for by earnings on oil exports (Middle Eastern countries and Nigeria), through increased borrowing in international financial markets, and additional food aid from rice exporters, particularly the United States. Rice imports by Africa have declined since 1982 due to declining food aid and lower national incomes. Iran, Iraq, and the EC have consistently been among the largest importers of rice, although countries such as Bangladesh, India, and, in 1989, China occasionally made sizable purchases. Saudi Arabia is also a large importer of rice, importing about 500,000 tons each year. Iraq and Saudi Arabia constitute important markets for U.S. rice exporters. Whether the Middle East will continue to grow as a rice market is unclear. Iran has attempted to increase domestic production since the war with Iraq ended. Many of the same demand factors that contributed to the growth in imports-by Middle Eastern countries, such as rising incomes and increasing populations, are at work in Asia. But these countries have generally reduced their shares of world trade. Asia's share of world imports declined from almost two-thirds in 1961 to less than one-third in the 1980's. Income growth, increased urbanization, oil exports by Indonesia, and low-cost credit in the 1970's expanded import demand. However, two factors have worked to reduce the Asian countries' share of world 21
Transcript of trade while the African and Middle Eastern shares have ...

and production of rice by the Soviets increased rapidly between 1960 and 1980.However, consumption peaked at almost 3 million tons in 1980 and has remainedbelow 2 million tons since then. Imports of rice by the Soviet Union havedeclined in response to declining consumption in the country.
Although a net exporter of rice, China has increased its imports of rice since1985 and imports may exceed 1 million metric tons in 1989. Chinese policy setsrice retail prices below world levels to provide low-cost food to urban workers.Yet this policy discourages farmers from producing rice and puts pressure onChinese foreign exchange earnings. China may have difficulty meeting domesticdemand unless its policies are changed.
Developing countries import about 70 percent of world rice imports. While theshare of this group of countries in total has remained relatively constant, therehave been major changes in market shares by individual countries and regions.Since the early 1960's, the African and Middle Eastern countries have increasedtheir shares of world imports, while the shares of Asian countries have fallen.
Several factors are responsible for these changes. In the 1970's, rapid incomegrowth and increased urbanization caused the demand for rice in many African andMiddle Eastern countries to expand sharply. Increased urbanization shiftedconsumption patterns away from traditional staples, such as cassava in Africa,toward rice and wheat. Increased urban populations also prompted many governmentsto institute cheap food policies subsidizing politically active and vocal urbanconsumers while taxing farmers. These low prices for rice further stimulatedconsumption and dampened production increases, adding to large imports.
From 1962 to 1971, milled rice imports by Middle Eastern countries annuallyaveraged 373,000 metric tons. But in the next 10 years, total rice importstripled to an annual average of 1.3 million tons each year. In 1987, the MiddleEast imported a record 2.8 million tons of rice. African rice imports followed asimilar pattern, averaging about 635,000 tons from 1962 to 1971, then doubling tonearly 1.5 million tons (average annual basis) in the following decade. Africaimported a record 3 million tons of rice in 1982. These imports were paid for byearnings on oil exports (Middle Eastern countries and Nigeria), through increasedborrowing in international financial markets, and additional food aid from riceexporters, particularly the United States. Rice imports by Africa have declinedsince 1982 due to declining food aid and lower national incomes.
Iran, Iraq, and the EC have consistently been among the largest importers of rice,although countries such as Bangladesh, India, and, in 1989, China occasionallymade sizable purchases. Saudi Arabia is also a large importer of rice, importingabout 500,000 tons each year. Iraq and Saudi Arabia constitute important marketsfor U.S. rice exporters. Whether the Middle East will continue to grow as a ricemarket is unclear. Iran has attempted to increase domestic production since thewar with Iraq ended.
Many of the same demand factors that contributed to the growth in imports-byMiddle Eastern countries, such as rising incomes and increasing populations, areat work in Asia. But these countries have generally reduced their shares of worldtrade. Asia's share of world imports declined from almost two-thirds in 1961 toless than one-third in the 1980's. Income growth, increased urbanization, oilexports by Indonesia, and low-cost credit in the 1970's expanded import demand.However, two factors have worked to reduce the Asian countries' share of world
21
trade while the African and Middle Eastern shares have increased. First, unlikethe African countries, most importing Asian countries did not tax producers anddiscourage production. Also, nominal rates of producer protection for riceimporters in East Asia have been rising, supporting higher domestic prices andstronger production incentives. India pursued policies designed to encourageproduction and stocks, and from 1976 to 1988 was a small net exporter. One reasonthat former large importers of rice--such as Indonesia, Malaysia, and South Korea--have become almost self-sufficient is that their governments have raised supportprices and other producer supports, investment in irrigation, and technologicalassistance.
The second important factor in reducing the Asian share of world imports has beenthe successful adoption of high-yielding varieties of rice in many Asiancountries. Yields in Africa have stagnated or declined, but yields in many Asiancountries have risen dramatically. Adoption of high-yielding varieties has beenmuch more widespread in the importing countries of Asia than in the traditionalexporting countries (Burma and Thailand). This has been true because thesevarieties are generally successful only when grown on irrigated rice land usingfertilizer. This type of farming predominates in most former large rice-importing countries such as South Korea, India, China, and Indonesia. Burmainstead relies more on natural rainwater, uses little fertilizer, and producesmostly in river deltas. Although Thailand's dry season crop is irrigated, much ofThailand's production is rainfed. Even the newer varieties of the 1970's and1980's have not been successful on nonirrigated rice farms.
Thus, the Asian countries have been better able to expand production to meetconsumption growth than the African countries that have been forced to rely moreon area expansion. The International Rice Research Institute, located in thePhilippines, has not been successful at finding high-yielding varieties suitablefor Africa. This problem is due to the sensitivity of high-yielding varieties tofertilizer and moisture levels. High-yielding varieties tend to perform best withabundant fertilizer and moisture. Since water is scarce and irrigation expensivein much of Africa, high-yielding varieties may not be economical. In addition,consumers have been slow to accept these varieties, a problem being overcome inAsia.
The total volume of rice imported by Asia peaked in 1972 and basically declineduntil 1987. Imports by South Vietnam and Kampuchea dropped off in large partbecause of the end of Vietnam War. South Korea was the largest importer of ricein 1981, importing almost 2.3 million tons, yet was self-sufficient after 1983.Indonesia was the largest importer of rice in 1980, importing over 2 million tons.But by 1986, Indonesia was almost self-sufficient in rice. Sri Lanka annuallyimported almost 500,000 tons in the 1960's and about 400,000 tons in the early1970's. Yet, since 1981, Sri Lanka has averaged annual imports of only 166,000tons. However, imports of rice by some Asian countries increased in 1987 and1988, especially by China (although a net exporter), Indonesia, and India.Although India's increase in imports was weather related and not a new trend,Indonesia is debating reducing its goal of 100-percent self-sufficiency in ricebecause of budget constraints. China has experienced difficulty in meetingdomestic demand in recent years.
22

Developments in Exporting Countries
There have been several developments in the major rice exporting countries in the1970's and 1980's that have dramatically shifted market shares and sources ofsupply. Positions have also changed among the smaller exporters. Thailand'sshare of world exports increased from about 20 percent in the 1970's to roughly 40percent in 1988 in response to large-scale domestic policy reform. Australiaentered the world market as a major exporter in the mid-1970's due to yield and
quality gains and competitive pricing. Price policies designed to promote riceproduction in India and Pakistan resulted in India becoming a small net exporterand Pakistan becoming a major exporter in the 1970's. But price ceilings inBrazil enacted in the early 1960's and an overvalued currency in the 1970's and1980's resulted in that country becoming a net importer.
In the early 1960's, the volume of rice exports was 6-7 million tons, comparedwith current levels of 11-13 million tons. More than two-thirds of the world'srice exports were supplied by four countries. Thailand and Burma supplied over 3million tons, or about half of the world's rice exports in the 1960's. The United
States shipped 15-16 percent, or a little over 1 million tons of rice, and Chinaexported 7-9 percent of all rice exports. But by 1972, just three countries weresupplying 63 percent of the 8.7 million tons traded in the world rice market:Thailand (2.1 million tons), the United States (1.9 million), and China (1.4million). Policy and political turmoil had hindered Burma's ability to export.The United States and Thailand became the major exporters of rice in the mid- and
late-1970's (table 13).
In 1981, world rice exports grew to 13.1 million metric tons, a record not brokenuntil 1989. The leading exporter was Thailand with 3.05 million tons, followed bythe United States with 3 million tons of rice exports. Pakistan was the thirdlargest exporter, supplying almost 1.1 million tons. Thailand is currently thelargest rice exporting country, with almost 40 percent of the market. The U.S.share has returned to almost 20 percent after declining to less than 17 percent in1984. Pakistan ranks third with 8-9 percent. Both China's and Burma's sharesdeclined during most of the 1980's.
As recently as the late 1970's, the United States and Thailand both exported about22 percent of world trade. During that period, Thailand imposed special taxes anddomestic sales quotas on exporters to generate revenue and assure adequatedomestic supplies. This combination translated into a restrictive export policy.U.S. rice exports expanded rapidly during the 1970's while world prices were abovethe U.S. loan rate. The United States also provided aid to several Asian marketsin the 1970's--South Vietnam, South Korea, Kampuchea, and Indonesia--and targetedmarket development activities to Iran. Also, the OPEC countries were flush withcash and at the time the United States was the only source of consistently high-quality milled and parboiled rice. Much of the U.S. commercial exports went toOPEC countries. U.S. parboiling capacity doubled, but Thailand was to soonrecognize the importance of these markets and increase its production andprocessing to cash in on these marketing opportunities.
By the 1980's, several factors had emerged which hurt the U.S. market position.Thailand lowered its export taxes in response to lower world prices and expandedits market share in the early 1980's. Global recession, falling OPEC revenues,self-sufficiency policies in Indonesia and Korea, and government changes inSoutheast Asia and Iran all worked to weaken demand for U.S. rice and U.S. prices
23
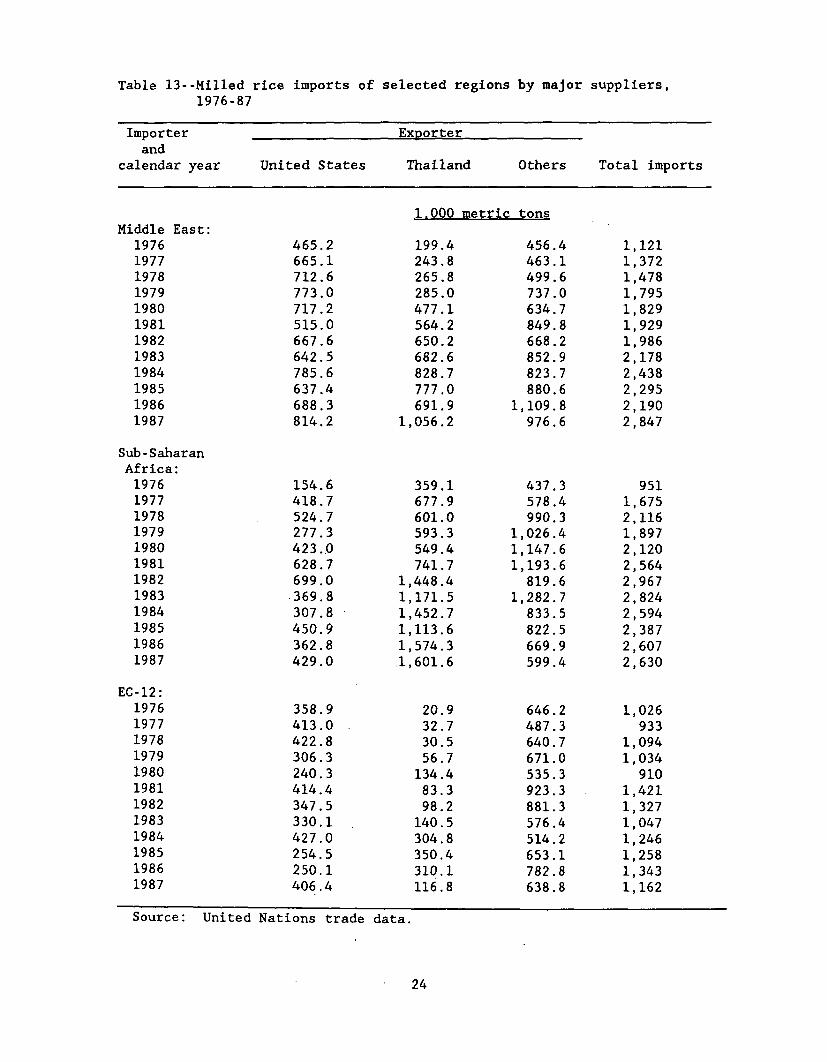
Table 13--Milled rice imports of selected regions by major suppliers,1976-87
Importer Exporterand
calendar year United States Thailand Others Total imports
1.000 metric tonsMiddle East:
1976 465.2 199.4 456.4 1,1211977 665.1 243.8 463.1 1,3721978 712.6 265.8 499.6 1,4781979 773.0 285.0 737.0 1,7951980 717.2 477.1 634.7 1,8291981 515.0 564.2 849.8 1,9291982 667.6 650.2 668.2 1,9861983 642.5 682.6 852.9 2,1781984 785.6 828.7 823.7 2,4381985 637.4 777.0 880.6 2,2951986 688.3 691.9 1,109.8 2,1901987 814.2 1,056.2 976.6 2,847
Sub-SaharanAfrica:1976 154.6 359.1 437.3 9511977 418.7 677.9 578.4 1,6751978 524.7 601.0 990.3 2,1161979 277.3 593.3 1,026.4 1,8971980 423.0 549.4 1,147.6 2,1201981 628.7 741.7 1,193.6 2,5641982 699.0 1,448.4 819.6 2,9671983 369.8 1,171.5 1,282.7 2,8241984 307.8 1,452.7 833.5 2,5941985 450.9 1,113.6 822.5 2,3871986 362.8 1,574.3 669.9 2,6071987 429.0 1,601.6 599.4 2,630
EC-12:1976 358.9 20.9 646.2 1,0261977 413.0 32.7 487.3 9331978 422.8 30.5 640.7 1,0941979 306.3 56.7 671.0 1,0341980 240.3 134.4 535.3 9101981 414.4 83.3 923.3 1,4211982 347.5 98.2 881.3 1,3271983 330.1 140.5 576.4 1,0471984 427.0 304.8 514.2 1,2461985 254.5 350.4 653.1 1,2581986 250.1 310.1 782.8 1,3431987 406.4 116.8 638.8 1,162
Source: United Nations trade data.
24
fell to loan levels. The loan rate acted as a price floor for U.S. rice andallowed other exporters to undercut U.S. exporters. As a result, the U.S. marketshare declined from over 23 percent in 1980 to less than 17 percent in 1985. Themarketing loan provision of the Food Security Act of 1985 freed up U.S. exportprices from the loan rate and enabled the United States to regain some of its lostmarket shares.
The U.S. Role in the World Rice Market
The United States normally produces about 2 percent of the world rice crop. In1983/84, because of a 30-percent decline in production induced by the payment-in-kind program, the U.S. crop accounted for just 1 percent of the world'sproduction. However, the United States still accounted for almost 20 percent ofworld exports that year. Thus, while the U.S. rice crop is insignificantcompared with world production, its impact on trade is large. Moreover, U.S. riceis a source of production stability in an often volatile, unreliable world ricemarket. The entire U.S. crop is irrigated, assuring more stable yields and, whencombined with large stocks, more stable supplies. Production capacity isresilient and far outweighs domestic requirements. Hence, large increases inoutput are possible in a relatively short period of time. These factors make theUnited States a more important player in the world market than its production oreven its export share suggest.
The mix of countries buying U.S. rice have changed several times over the past 40years. Changes in political relations, improved production in foreign countries,and protectionist policies shifted many countries from net importers to self-sufficient countries or even net exporters. In the 1950's, Cuba, India, Pakistan,and Indonesia were the biggest markets for U.S. rice. In the next decade, India,Pakistan, and Indonesia remained strong markets, but demand for U.S. rice alsogrew in Western Europe, South Korea, South Vietnam, and South Africa. Japan was asignificant importer of rice through 1966. But by the end of the 1960's, Indiaceased importing U.S. rice and Pakistan became a major exporter. Relations weresevered with Cuba ending rice trade, but markets began to open in the Middle Eastand Africa.
Asia, primarily South Korea, South Vietnam, and Indonesia, was the principalmarket for U.S. rice in the early 1970's. However, successful policies aimed atself-sufficiency in South Korea and Indonesia and Vietnam's reunification underthe Communist regime were responsible for the decline of the Asian market afterthe mid-1970's. Only Indonesia remained a strong market until the end of thedecade. Asia's share of U.S. exports declined from almost 70 percent in 1970 toless than 21 percent in 1980.
By 1980, the Middle East and Africa had developed into the two strongest marketsfor U.S. rice. Exports to these regions were growing. Iran, Iraq, Saudi Arabia,South Africa, and Nigeria became the largest buyers of U.S. rice (table 14).
South Korea briefly returned as a strong market for U.S. rice in the late 1970'sand early 1980's, but vanished after 1983 as domestic production expanded to meetdomestic demand. The United States lost its Nigeria sales because the countrybanned rice imports due to foreign exchange shortages and increased reliance onsmuggled Thai rice. The European Community and Canada remained stable but smallmarkets for U.S. rice throughout the 1970's and 1980's. Together, they accountfor 15-20 percent of total shipments. Large sales of rough rice to Brazil in
25
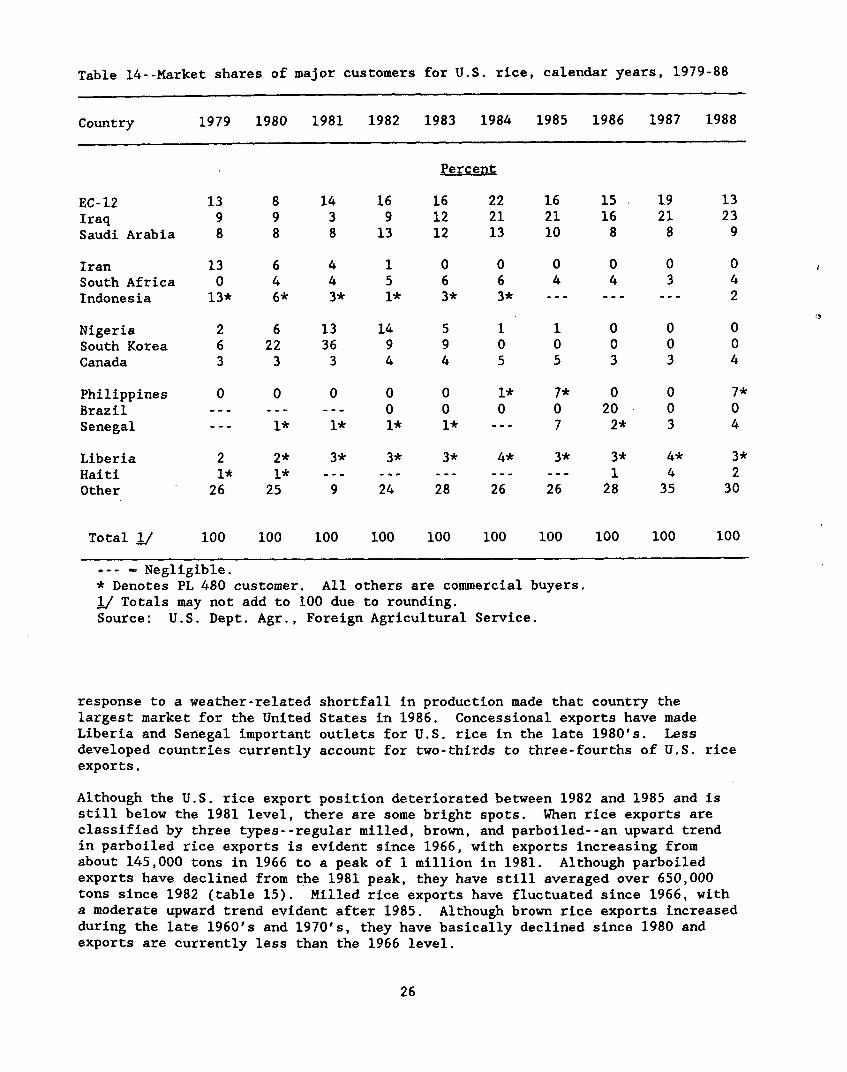
Table 14--Market shares of major customers for U.S. rice, calendar years, 1979-88
Country 1979 1980 1981 1982 1983 1984 1985 1986 1987 1988
Percent
EC-12 13 8 14 16 16 22 16 15 19 13Iraq 9 9 3 9 12 21 21 16 21 23Saudi Arabia 8 8 8 13 12 13 10 8 8 9
Iran 13 6 4 1 0 0 0 0 0 0South Africa 0 4 4 5 6 6 4 4 3 4Indonesia 13* 6* 3* 1* 3* 3* --- --- --- 2
Nigeria 2 6 13 14 5 1 1 0 0 0South Korea 6 22 36 9 9 0 0 0 0 0Canada 3 3 3 4 4 5 5 3 3 4
Philippines 0 0 0 0 0 1* 7* 0 0 7*Brazil --- --- --- 0 0 0 0 20 0 0Senegal --- 1* 1* 1* 1* --- 7 2* 3 4
Liberia 2 2* 3* 3* 3* 4* 3* 3* 4* 3*Haiti 1* 1* --- --- --- --- --- 1 4 2Other 26 25 9 24 28 26 26 28 35 30
Total 1/ 100 100 100 100 100 100 100 100 100 100
-- - Negligible.* Denotes PL 480 customer. All others are commercial buyers.1/ Totals may not add to 100 due to rounding.Source: U.S. Dept. Agr., Foreign Agricultural Service.
response to a weather-related shortfall in production made that country thelargest market for the United States in 1986. Concessional exports have madeLiberia and Senegal important outlets for U.S. rice in the late 1980's. Lessdeveloped countries currently account for two-thirds to three-fourths of U.S. riceexports.
Although the U.S. rice export position deteriorated between 1982 and 1985 and isstill below the 1981 level, there are some bright spots. When rice exports areclassified by three types--regular milled, brown, and parboiled--an upward trendin parboiled rice exports is evident since 1966, with exports increasing fromabout 145,000 tons in 1966 to a peak of 1 million in 1981. Although parboiledexports have declined from the 1981 peak, they have still averaged over 650,000tons since 1982 (table 15). Milled rice exports have fluctuated since 1966, witha moderate upward trend evident after 1985. Although brown rice exports increasedduring the late 1960's and 1970's, they have basically declined since 1980 andexports are currently less than the 1966 level.
26
The United States has lost market share in some countries, notably the regularmilled and brown rice markets. This segment of growing import demand for rice hasshifted to Thailand on the basis of more attractive prices for comparable qualityrice. In 1984, the United States lost a premium market in Nigeria, a previouslylarge buyer of U.S. long-grain parboiled rice, to Thailand. Thailand is alsogaining market shares in Western Europe, South Africa, and Saudi Arabia throughimproved quality and more competitive pricing. Thailand exported over 100,000metric tons to the United States in 1988/89.
The Role of PL 480 in U.S. Rice Exports
Government-assisted exports authorized under PL 480 have played an important rolein expanding U.S. rice exports. The total volume of rice exports moving throughGovernment programs peaked in the early 1970's and Government-assisted exports asa share of total exports have declined since. Government exports as a percentageof all rice exports ranged from almost 80'percent in 1957 to less than 20 percentin the 1980's (app. table 12). In the 1950's, Japan, Pakistan, India, andIndonesia were key markets for Government rice exports. In the 1960's, India andIndonesia were the major recipients. South Vietnam, Kampuchea, and South Koreareceived most of the PL 480 rice in the early 1970's. Although Indonesia was thelargest recipient of PL 480 shipments in the late 1970's, most assistance wastargeted to African countries after 1975.
Table 15--U.S. milled rice exports by type, selected years 1/
PL 480 and AIDCrop year Brown Milled Parboiled Total V/ share of total _/
- - - - - - - 1.000 metric tons - - - -- - - ' Percent
1966/67 217.7 1,347.2 145.1 1,719.0 46.61970/71 626.0 630.5 263.1 1,473.7 64.01974/75 546.5 1,388.3 242.5 2,194.4 27.91979/80 475.4 1,461.9 598.4 2,705.9 17.9
1980/81 1,202..7 957.7 781-7 3',027.6 17.81981/82 502.6 941.8 1,000.9 2,681.9 13.41982/83 354.3 954.1 846.5 2,218.7 16'.81983/84 334.3 882.4 821.8 2,270.2 20.91984/85 166.2 927.7 630.8 1,954.2 23.7
1985/86 - 309.6 891.6 523.8 1,918.6 30.11986/87 278.5 1,484.0 596.4 2,679.8 16.31987/88 178.1 1,289.6 652.9' 2,290.3 21.2
/ All rice is''reported on a milled-equivalent basis.2_ Numbers may not not add due to rounding.* _/ PL 480 and AID shipments are on fiscal year of first year.Source: U.S. Dept. Commerce, Bureau of the Census.
27
The largest recipient of PL 480 rice shipments in the 1980's has been Bangladesh.Other consistently large recipients in this decade have been Guinea, Liberia,Sierra Leone, Somalia, Madagascar, and Yemen. In addition, Peru received large PL480 shipments in the late 1970's and early 1980's. The Philippines received over150,000 tons of rice in 1985, making the country the largest recipient of PL 480rice that year. In the 1980's, PL 480 rice shipments have been about evenly splitbetween long and medium grain.
Future Developments in Rice Trade
There are three critical issues likely to shape the U.S. role in the world ricemarket ahead. The first is growth in total world demand. World rice productionhas been increasing at an annual average rate of 3 percent for the past decadewhile growth in use has been marginally slower. Although world exports increasedrapidly from about 8.6 million tons in 1971 to 13.1 million in 1981, world tradehas stagnated at 11-13 million tons since 1979. If world exports continue tostagnate at this level and production in exporting countries continues toincrease, the distribution of world trade--the sources of supply and demand--willbecome more important. Competition among exporters could intensify.
The historical data suggest that growth in the market will depend heavily ondevelopments in Africa and the Middle East. Their increased role has been aresult of income growth, growth in urban population, policies which stimulateconsumption and dampen production increases, and limited production capacity. Asthe cost of consumer subsidies in these nations rises, some governments may chooseto raise consumer prices. And if self-sufficiency policies were adopted or ifsuitable high-yielding varieties are developed for nonirrigated rice, the growthin world import demand could weaken further. Finally, a slowdown in income growthin the Middle East as a result of lower oil prices could encourage these countriesto consume less rice and more lower priced wheat.
The second issue is the U.S. policy response to developments in world rice marketsand policies in the other exporters, notably Thailand. Thailand moved toward morecompetitive marketing practices by removing the last of its export taxes in 1986.When the gap between U.S. and Thai prices for milled rice widened in the mid-1980's, U.S. exports declined as buyers switched to Thailand's rice. Provisionsof the Food Security Act of 1985, including declining loan rates and the marketingloan provision, restored some of the U.S. competitiveness in the world market.
Finally, any multilateral trade liberalization resulting from negotiations couldsubstantially affect the world rice market and the U.S. position. Domesticsupport and trade policies in the United States, Japan, and, to a lesser extent,the EC depress world prices and reduce trade volumes. The removal of importbarriers by Japan could open a huge japonica market for the United States andother suppliers. The world indica market could increase somewhat also if the ECeliminated its protection of domestic producers. The United States would likelygain market share in the japonica trade but could lose markets to lower costindica producers such as Thailand in the long run. Much uncertainty surroundsthis issue and depends on the pace and extent of liberalization and the extent ofthe countries participating.
28

Prices and Returns
Historical movements in producer prices for rice were limited until the 1970's buthave moved dramatically since. U.S. season average farm prices remained fairlystable until the 1970's due in large part to acreage and marketing restrictionsthat constrained production. Output tended to have the market near support priceswith limited government intervention. Gross returns grew despite the stableprices because average yields per acre increased.
However, farm prices for rice hit an all-time high during the 1973/74 season,reaching $17.50 per cwt in June 1973, more than double current prices (fig. 2).Prices fell the next season, hitting $6.17 in March 1976. They then began anupward trend that continued through the early months of 1981, peaking at nearly$14 in April of that year. On an overall decline through marketing year 1986/87,prices fell below the loan rate by August 1982, and the 1982/83 season was usheredin with prices that remained below the loan rate for all but 3 months of themarketing year. The payment-in-kind program in 1983/84 allowed U.S. farm pricesto remain above the loan rate throughout the marketing year, although prices begana steady decline after February 1984.
Without the continued powerful effect of the payment-in-kind program, farm pricescontinued to tumble in 1984/85 and were below the loan rate in 4 of the last 6months of the marketing year. Although the loan rate declined each crop yearafter 1983/84, farm prices remained below the loan rate throughout 1985/86 and1986/87. The marketing loan provision of the Food Security Act of 1985 allowed
Fgure 2
U.S. farm prices of rough rice
Dollars per cwt14 .
1279 82 85 88
10
8
6
4
1970 . 73 76 79 82 85 88Crop year beginning August
29

U.S. farm prices to drop close to the world price after April 15, 1986. The 1987drought, resulting in a poor harvest in much of Asia in 1988, began pushing pricesup in August 1987 and the U.S. farm price finally exceeded the loan rate inNovember 1987. U.S. farm prices remained above the loan rate until December 1988.U.S. farm prices for April 1989 averaged the loan rate of $6.63 per cwt.
Focusing on these historical farm price trends above can result in misleadingconclusions about producers' economic welfare. The effects of deficiencypayments, participation rates, and cash expenses must also be included whenanalyzing producer welfare. For example, farm prices during August-December 1986averaged $3.87 per cwt, $3.33 below the national average loan rate andsubstantially below the $11.90 target price. Yet, 95 percent of the 1986 ricebase acreage was enrolled in the 1986 rice program, assuring producers an averageprice of $10.51 per cwt (including deficiency payments, marketing loan payment,and market sales) for virtually all their rice. Hence, although the market valueof rice production and marketing loan payments in 1986/87 was $907 million, downfrom $1.12 billion in 1984/85, deficiency payments added $495 million to producerreturns, bringing total returns to an estimated $1.4 billion. Yet, this is only 6percent less than the total returns earned during 1984/85 when the season averagemarket price was $8.04 per cwt,'over twice the season average price in 1986/87 of$3.75. Thus, farm prices alone, particularly during years of acreage programs, donot provide an accurate assessment of producers' welfare (table 16).
History of Rice Programs
Programs of the 1920's
Proposals for government intervention in the rice market date back to the early1900's but did not become law until the 1930's. The end of World War I brought asharp drop in U.S. farm exports and began a period of sustained low returns tofarming. Rice farm prices averaged $3.34 per cwt during 1914-20 and fell to $2.10by 1922. Widespread support emerged for Government help in raising farm returns.A leading proposal was the McNary-Haugen Plan, which was debated in Congressduring much of the 1920's. The plan proposed a two-price market: crops would besold at a high enough price on the domestic market to support incomes andsurpluses would be sold abroad at world prices. Rice was one of the eightcommodities that the legislation would have covered. Vetoed by the Presidenttwice, the plan never became law.
Limited Government involvement was provided for in the Agricultural Marketing Actof 1929. This act set up a federally funded corporation to make loans tomarketing cooperatives that would purchase surplus crops. However, the onset ofthe Depression and resulting buildup of surpluses led to the failure of theprogram by 1932. Rice prices fell to an all-time low of $0.93 per cwt in thatseason and added rice producer support to calls for large-scale governmentintervention.
Programs of the 1930's .
The farm programs of the 1930's ultimately shaped the rice sector into the 1980's.The objective of the decade's first Agricultural Adjustment Act -(AAA) of 1933 wasto restore the purchasing power of farm commodities to their 1910-14 level, aconcept referred to as parity. Rice was designated as one of the original: seven
30

Table 16--Rice sector costs and returns, 1975-88
Returns above cash
Total expenses 4/Crop Farm Direct Total cash Per cwtyear value 1/ payments 2/ income expenses V/ Total Nominal 1982$
- - - - - - - - - Million dollars - - - - - - - - - Dollars
1975 1,072 0 1,072 758 314 2.45 4.121976 811 129 940 656 284 2.46 3.891977 941 4 945 565 380 3.83 5.691978 1,087 59 1,146 796 350 2.63 3.641979 1,384 1 1,385 849 536 4.06 5.17
1980 1,873 2 1,875 1,132 743 5.08 5.931981 1,654 22 1,676 1,360 316 1.73 1.841982 1,246 267 1,513 1,200 313 2.04 2.041983 876 618 1,494 769 725 7.27 7.001984 1,119 380 1,499 977 522 3.76 3.49
1985 1,203 468 1,671 912 759 5.63 5.071986 907 495 1,402 768 634 4.75 4.171987 1,038 545 1,583 735 848 6.54 5.561988 5/ 1,137 570 1,707 941 6/ 766 4.80 3.90
1/ Production times average farm price, including marketing loan gains: $322million in 1985, $407 million in 1986, $96 million in 1987, and $60 million in1988.g/ The sum of deficiency, diversion, disaster payments, and in 1983, the value
of payment-in-kind.3/ Cash expenses per planted acre times acreage planted.4/ The difference between total income and total cash expenses; this difference
was divided by the quantity produced, and then deflated (1982 - 1.0).
_/ Preliminary._/ Calculated from a forecast cash expense of $321 per acre.Sources: U.S. Dept. Agr., Agricultural Stabilization and Conservation Service,
and Costs of Production for Major U.S. Crops. 1975-87, U.S. Dept. Agr., EconomicResearch Service, May 1989.
commodities covered in the act. This was to be accomplished through a mix ofsupply controls and processing taxes.
Supply control was administered through contracts negotiated between theGovernment and rice millers. Contracts with producers were introduced with theDeRouen Rice Act of 1935 and were financed with a processing tax. The SupremeCourt ruled against processing taxes and declared the AAA production controlfeatures unconstitutional in January 1936.
The Agricultural Adjustment Act of 1938 introduced many of the provisions found intoday's programs. It provided nonrecourse loans for rice, referendums for
31
marketing quotas, acreage allotments, and direct payments to bring producer pricesup to parity, if funds were appropriated. However, loans for rice were notoffered until a subsequent act made them mandatory for farmers harvesting withintheir acreage allotment beginning with the 1941 crop. Marketing quotas, operatingthrough rice acreage allotments, were to be proclaimed if total supply wasestimated to exceed normal supply by 10 percent. Normal supply was defined asexpected exports, plus the previous year's domestic use, plus 10 percent to allowfor carryover stocks. With stocks beginning to build in the late 1930's, USDAproposed rice quotas for 1939/40. But less than the required two-thirds of theproducers voting supported them in the referendum, so they were not put intoeffect.
Program Adjustments from World War II Through the 1960's
Rice was added to the list of basic commodities eligible for nonrecourse loans in1941 and the first loan program for rice was initiated. Rice acreage allotmentswere removed during the war and most of the subsequent decade, but were put intoeffect in 1950. Marketing quotas and acreage allotments were in place during1955-73.
Swing from Shortages to Surpluses
There was a sharp increase in rice exports during World War II--from 5.7 millioncwt in 1940 to 11.5 million cwt by 1945--which lowered stocks and pulled riceprices well above support levels. Because of high prices and strong demand, riceacreage allotments were lifted entirely and in some years price support levelswere not even announced.
The Agricultural Acts of 1948 and 1949 revised the method used to calculate parityin order to account for productivity and other changes since the base period of1910-14. Mandatory price support at 90 percent of parity, a level first setduring the war, was continued in the 1948 Act, but the 1949 Act introducedflexibility, allowing a range for parity prices. However, because of the Koreanconflict, subsequent legislation retained parity at 90 percent. Provision formarketing quotas continued. The provisions of the 1949 Act had little immediateeffect on the rice market, as prices averaged above support levels in every yearfrom 1941 to 1953, except for 1951.
In 1954, rice production reached a record 64 million cwt--over twice the averageduring World War II. However, domestic and export demand weakened, and carryoverstocks amounted to 27 million cwt, seven times greater than the average of theprevious 3 years. Commodity Credit Corporation loan activity for rice wassignificant for the first time and the CCC wound up owning 60 percent of the totalcarryover.
The Agricultural Act of 1954 attempted to deal with these surpluses by moving toflexible support prices, 82.5-90 percent of parity for 1955 and 75-90 percentthereafter. In addition, marketing quotas were proclaimed and voted in for the1955 crop.
Marketing Ouotas and Allotments: 1955-73
Marketing quotas and acreage allotments were in effect every year from 1955through 1973. They were effective in reducing CCC-owned rice stocks from 27
32
million cwt at the end of 1955/56 to near 300,000 cwt by the end of 1961/62 and inpreventing stocks from rebuilding in the 1960's. The pace of the stockreduction was limited by a legislated minimum national acreage allotment of 1.65million acres from 1956 through 1961.
Another method used to reduce rice acreage was the soil bank program provided forin the Agricultural Act of 1956. It had two components: an acreage reserveprogram that paid farmers to annually divert rice land and a conservation reservethat paid farmers to retire land under long-term contracts that lasted from 3 to10 years. Neither program was considered very effective. As such, the acreagereserve program ended in 1958 and the conservation reserve ended in 1961.
Starting with the 1961 crop, marketing quotas were announced and voted on whentotal supply exceeded normal supply. Prior to that, quotas were announced onlywhen total supply exceeded normal supply by 10 percent. Marketing quotas were
operated through acreage allotments. Normal supply less beginning stocks
determined needed production, which was then converted to a national allotmentbased on U.S. average yields. The allotments were then apportioned to farms. All
production from allotted acreage was eligible for price support, but production
from acreage in excess of the allotment was subject to a penalty.
With the 1962 crop, rice allotments gradually increased, reaching 2.8 millionacres by 1968. But, stocks began to build that year, and allotments were reduced
below the 1968 level during 1969-73. Much of the agricultural legislation passedduring the mid-1960's through the early 1970's made major changes in programs for
other grains, but had little effect on rice. For example, the following
provisions did not apply to rice: the marketing certificate program for wheat,
introduced in 1964; the set-aside provisions for wheat, feed grains, and cotton,introduced in 1970; and the separation of target prices from support prices forwheat, feed grains, and cotton, introduced in 1973. But throughout this period of
change elsewhere in commodity programs, the rice program continued in essentially
its 1961 form.
Legislation of the 1970's
Given a surge in export demand related to crop shortfalls abroad, rice marketing
quotas were suspended for the 1974 and 1975 crops. Acreage allotments were set at
2.1 million acres in 1974 and at 1.8 million in 1975. Allotments through 1981were used for payment purposes only. Producers were not restricted on the acreage
planted. However, they could receive program benefits only on allotment acres.
Exports grew sharply in the early 1970's, raising prices well above supportprices. In 1973, the average farm price was $13.80 per cwt, compared with a
support level of $6.07. The Rice Production Act of 1975 reflected these changedconditions and shifted rice production control from quotas and allotments togreater market orientation along the lines of the programs in place for the othergrains. Acreage allotments were set at 2.1 million acres in 1974 and at 1.8million in 1975. Allotments through 1981 were used for payment purposes only. Atarget price was established and direct (deficiency) payments were provided basedon the difference between the August-December average farm price and the target
price. The allotments became the payment base. Farmers could now plant in excessof their allotment, but eligibility for loans and deficiency payments was
restricted to producers planting within their allotted acres. Target prices and
loan rates were to be adjusted annually on the basis of the index of prices paid
33

and changes in yields. The act provided for annual set asides and set a limit of$55,000 on the payments a person could receive under the rice program. Unlikeprograms for other grains, disaster payments counted against the payment limit forrice.
Disaster payments could be made to cover losses due to natural causes that eitherprevented the crop from being planted or resulted in abnormally low yields. Anallotment carried with it eligibility for disaster protection and no premium wasrequired. The payment rate was a percentage of the target price and coveredallotment production. The disaster payment program was replaced by the all-riskcrop insurance program provided by the Federal Crop Insurance Act of 1980.Growers have been reluctant to pay the premiums required for coverage under thisprogram, even though the Government also pays a significant portion. In 1983,only 110,000 rice acres were insured at an average premium of $10.34 an acre.This coverage was only 5 percent of the potentially insurable rice acreage.
The first deficiency payments, $128 million, were paid on the 1976 crop, which wasalso the first crop produced under the 1975 Act. These were the first directGovernment payments for rice since 1957, when payments were made under the soilbank act.
The Food and Agriculture Act of 1977 contained provisions very similar to the 1975Act. Rice production costs, rather than the index of prices paid, became thebasis for adjusting the target price, with the loan rate adjusted by the samepercentage as the target price. The loan rate could be lowered, but not below$6.31 per cwt.
The set-aside provision was continued, although one has never been in effect forrice, and a cash payment for diverting land was authorized. The limit on riceprogram payments was $55,000 per person in 1977; this was lowered to $52,250 in1978 and $50,000 in 1979. Beginning in 1980, payments were limited to a combinedtotal of $50,000 from the wheat, feed grains, upland cotton, and rice programs.Disaster protection continued with a separate payment limit. Rice prices stayedwell above the loan rate during the life of the 1977 Act. With exports runninghigh, acreage passed the 3-million mark for the first time in 1980 and reached arecord 3.8 million in 1981.
Legislation of the 1980's
The Agricultural and Food Act of 1981
The Agricultural and Food Act of 1981 eliminated acreage allotments and marketingquotas for rice and made the rice program analogous to those for other grains.Rice farmers previously received deficiency payments on allotment production,regardless of actual production. However, allotments no longer reflected actualplanting patterns. In disposing of allotments, the 1981 Act based deficiencypayments on production from permitted plantings. Target prices were no longeradjusted by the formula based on rice production costs, but minimum target levelswere established. The loan rate was to be adjusted by the same percentage as thetarget price, but could be lowered to a minimum of $8.00 per cwt if rice stockswere excessive or exports discouraged.
The acreage reduction program was introduced as a more specific acreage controlmethod than the set-aside provision. When in effect, an acreage reduction program
34
required land to be diverted from a farm's rice base acreage and put into approvedconservation uses. Compliance was required for eligibility for loans anddeficiency payments.
The large acreage expansion in 1981, along with a decline in exports, precipitateda sharp rise in carryover stocks. This resulted in a 15-percent acreage reductionprogram for the 1982 rice crop. Program compliance was high, 78 percent of the4-million-acre U.S. rice base. But a continued plunge in U.S. rice exports duringthe 1982/83 crop year caused rice stocks to bulge further to almost 72 millioncwt. In 1983, there was a 15-percent acreage reduction program, a 5-percent paidland diversion, and an additional 10- to 30-percent payment-in-kind program forrice. Prospects for a large deficiency payment rate and the attractive payment-in-kind program, under which payments did not count against the payment limit,helped boost program enrollment to 98 percent of the 4.1-million-acre rice base.U.S. production declined by 50 million cwt and stocks declined 25 million cwt. Atthe same time, world rice production increased. Without acreage control, supplieswould likely return to excessive levels again in 1984/85, so a 25-percent acreagereduction program was announced for 1984 rice. Farm prices were substantiallybelow the target price during 1983/84, encouraging a high program enrollment rateof 87 percent in the 1984 program, despite the large acreage reduction requirementand the lack of a paid diversion.
The Food Security Act of 1985
The Food Security Act of 1985 was enacted under the general feeling that farmprograms cost too much, nearly $18 billion in fiscal year 1985, and must bebrought under control. There was a consensus that the health of U.S. agriculturedepended upon its ability to become more competitive in world markets and thatprice support levels should be set more in line with market-clearing prices,instead of being rigidly legislated by Congress as in the 1981 Act.
But, these considerations were tempered by concerns about the financial distressfacing many farmers that would be compounded by the short-term price-depressingeffects of a market-oriented farm policy in the short run. Many farmers expandedtheir farming operations in the late 1970's by obtaining large loans. The onsetof declining commodity prices soon after 1980 when export markets weakened causedthe value of farmland to fall. As a result, many farmers developed cash-flowproblems and some even had their farms foreclosed. Farmers' net cash-flow reacheda record low $30.2 billion in 1985, compared with $43.8 billion in 1979.
The 1985 Act was a compromise between a desire to make U.S. agriculture morecompetitive in world markets through lower loan rates in general--and the lowermarketing loans for rice and cotton in particular--and an immediate need tocontinue farm income protection via frozen target prices and larger deficiencypayments.
Unlike the 1981 Act in which minimum loan rates were rigidly legislated byCongress, the 1985 Act contained provisions for lowering the loan rate for rice to$7.20 per cwt, a 10-percent decline from $8.00 in 1985. For the 1987-90 ricecrops, minimum loan rates were to be the higher of: (1) 85 percent of a 5-yearmoving average marketing prices, excluding the highest and lowest prices; or (2)$6.50 per cwt. However, loan rates could be reduced by no more than 5 percentfrom the preceding year.
35
A new marketing loan was also provided for in the 1985 Act. The Secretary wasgranted authority to implement marketing loans for grains, upland cotton, andsoybeans but was required to implement them for rice and cotton if the world pricewere below the announced loan rate. For rice, the 1985 Act permitted producers torepay Commodity Credit Corporation loans at the lesser of the loan rate or worldmarket price, but not less than a specified portion of the loan rate. For the1986 and 1987 programs, rice producers were permitted to repay loans at the worldmarket price, but not below 50 percent of the loan rate. The minimum loanrepayment rate was set at 60 percent of the loan rate for 1988 and 70 percent for1989 and 1990.
Section 1005 of the Food Security Act of 1985 authorized the Secretary ofAgriculture to make in-kind payments in the form of generic certificates tofarmers as payment for participation in numerous Government programs. Theseprograms included the acreage reduction, paid land diversion, and conservationreserve programs as well as the rice marketing loans, disaster, and emergency feedprograms. In addition, grain merchants and commodity groups have been issuedcertificates through the export enhancement program and the targeted exportenhancement program. Generic certificates were also made available under the 1985Act to producers selling rice or repaying price support loans when the world pricefor rice was below the current loan repayment rate. The payment rate was setequal to the difference between the loan repayment rate and the world price.
The 1985 Act also froze the 1986 minimum target price at the 1985 level, $11.90per cwt, and set the minimum 1987 through 1990 target prices at declining levels.The target prices provide a basis from which direct payments are made to eligibleproducers if the national weighted average market price received by farmers forthe first 5 months of the market year (August through December) falls below thetarget level.
A deficiency payment is a Government payment made to farmers who participate inwheat, feed grain, rice, or cotton programs. The payment rate for rice is per cwtand is based on the difference between the price level established by law '(targetprice) and the higher of the market price during the first 5 months of the marketyear or the price per unit at which the Government will provide loans to farmersto enable them to hold their crops for later sale (loan rate). The totaldeficiency payment is equal to the payment rate multiplied by the acreage plantedfor harvest and then by the program yield established for the particular farm.The payment acreage is the acreage actually planted to rice, but it cannot exceedthe permitted acreage. However, growers who underplant their permitted acreage byplanting between 50 and 92 percent of the permitted acreage (the 50/92 provision)and devote the remaining permitted acres to a conserving use would receivepayments on 92 percent of the permitted acreage.
Limited cross compliance was required for participants to be eligible for programbenefits in the late 1970's and remains in effect under the Food Security Act of1985. In a limited cross-compliance program, a producer participating in onecommodity program must not plant in excess of the crop acreage base on that farmany of the other program commodities for which an acreage reduction program is ineffect.
The Secretary of Agriculture could not reduce the loan rate for 1988 rice crop bymore than 3 percent from the 1987 level according to the'Budget Reconciliation Act
36

of 1987. The 1987 Act also slightly reduced minimum target prices for the 1988rice crop to $11.15 per cwt and the 1989 crop to $10.80.
Program Costs
A summary of payments made directly to farmers for rice crops of recent years isshown in table 17. A longer and more detailed accounting of fiscal year costs isfound in appendix table 6. As table 17 indicates, deficiency payments have madeup the bulk of direct payments to rice producers since 1981. The marketing loangains were also an important source of income in 1985 and 1986 when world priceswere low. The marketing loan gain has been a less important source of income forrice producers after 1986 because U.S. and world prices converged.
The 1977 Act imposed payment limits on producers for the first time. Paymentlimits were initially set at $52,250 for one or more crops but, by 1980, paymentscould not exceed $50,000 per person for total payments received under the grainand cotton programs.
During the 1983/84 crop year, a program featuring acreage reduction, paid landdiversion, and payment-in-kind was in effect. Payment limitations applied only tothe acreage reduction and paid land diversion provisions. For programparticipants not in payment-in-kind, it would have taken a base acreage ofapproximately 450 acres and permitted plantings (payment acreage) would have tohave been 360 acres (450 X .8) to reach the payment limit, based on the estimatednational average program yield of 4,867 pounds per acre, a diversion payment rateof $2.70 per cwt, and a deficiency payment rate of $2.77 per cwt. A participantputting 30 percent of the base into the payment-in-kind program would need a baseof 720 acres (and permitted plantings of 360 acres, or 50 percent of the base) toreach the payment limit. Thus, payment-in-kind permitted larger sized farms toparticipate fully in the 1983 program.
Table 17--Direct payments to rice producers, crop years 1981-88
Payments 1981 1982 1983 1984 1985 1986 1987 1988
Million dollars
Deficiency 21 267 233 380 375 495 545 570Diversion --- --- 23 --- 93 --- --- ---Disaster --- - - - - --- - - - . -. --Payment -in-kind --- --- 1/ 362 --- -- --- -- -
Marketingloan gains --- --- --- - --- 322 407 :96 60
Total 21 267 618 380 790 902 641 630
--- - No payment.1/ 42.3 million cwt valued at the estimated average farm price of $8.65
per cwt for 1983/84.Source: U.S. Dept. Agr., Agricultural Stabilization and Conservation Service.
37

In 1978, under the allotment system, approximately $58 million was paid indeficiency payments and about 27 percent of the payments made were in excess of$52,250 at that time (prior to enactment of the payment limitation). During the1987/88 crop year, deficiency payments totaled $545 million. Maximum permittedplantings by participants indicate total payments could have reached $583 million.The payment limit probably accounts for actual payments falling short of thislevel. Arkansas, Louisiana, and Texas received nearly three-quarters of the totalpayments issued through Government programs. In addition, marketing loan gainstotaled $122 million. Government payments and marketing loan gains totaled $887million in 1986/87 and $667 million in 1987/88.
Program Effects
The rice programs has both direct and indirect effects on farmers, consumers, andtaxpayers. The rice program affects:
o Prices received by farmers and paid by domestic andforeign consumers of rice.
o Incomes of farmers.o Resources (specifically, land and other inputs used to
produce rice).o Consumption. By affecting prices, the rice program also
affects the quantity of rice demanded in the UnitedStates and abroad.
o Foreign production and exports.
Farmers
The U.S. rice program affects prices received by rice producers, their incomes,the costs and value of resources used in rice production, and rice growers'production planning processes. Rice producers have also benefited fromGovernment-assisted exports (app. table 6). When rice is exported throughGovernment programs such as PL 480, prices are supported by expanding exportmarket demand. Between fiscal years 1980 and 1987, net Government expenditures onthe rice price support program, including those for PL 480, have totaled over $5billion. The total value of rice production over the crop years 1980-87 totaled$9.09 billion.
Since the inauguration of target prices, direct Government payments have made upan increasing share of producer incomes. Direct payments bolster farm income,contrasted to raising prices. During fiscal years 1982-87, rice producersreceived $1.91 billion in direct payments under deficiency, diversion, anddisaster program provisions. In 1982, Government payments comprised 17 percent ofrice growers' gross incomes. By 1987, Government payments rose to 40 percent ofgrowers' gross incomes. The data in table 18 demonstrate the difference inreturns above cash costs made by direct payments. The benefits of participatingin the rice program are clearly evident in comparing returns in 1987 and 1988,even though producers were required to idle land in both years in order to receiveprogram benefits.
When program benefits are tied to acreage reduction provisions, the net effect canbe a gain to producers, and an equal cost to society, particularly taxpayers. Agood example of this situation occurred in 1987. Farmers idled 1.32 million acres
38
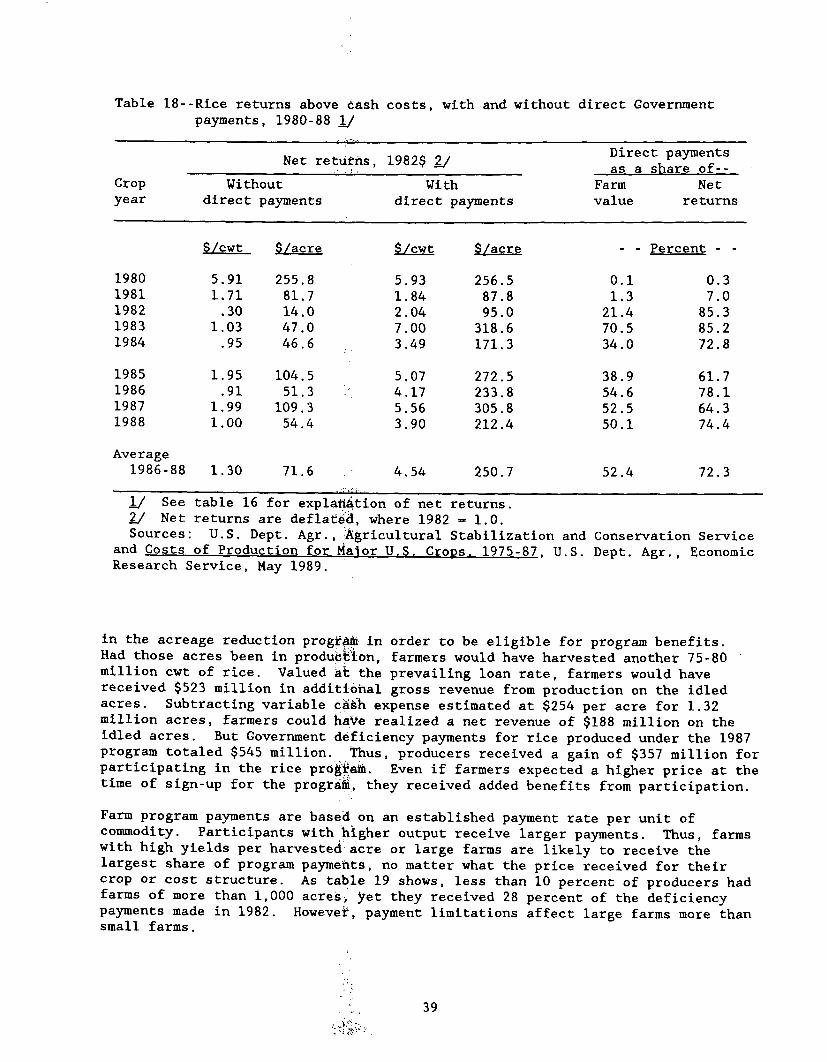
Table 18--Rice returns above cash costs, with and without direct Governmentpayments, 1980-88 1/
Direct paymentsNet retutns, 1982$ 2/
_ ~ 'as a share of--Crop Without With Farm Netyear direct payments direct payments value returns
$/cwt S/acre S/cwt S/acre - - Percent -
1980 5.91 255.8 5.93 256.5 0.1 0.31981 1.71 81.7 1.84 87.8 1.3 7.01982 .30 14.0 2.04 95.0 21.4 85.31983 1.03 47.0 7.00 318.6 70.5 85.21984 .95 46.6 3.49 171.3 34.0 72.8
1985 1.95 104.5 5.07 272.5 38.9 61.71986 .91 51.3 ' 4.17 233.8 54.6 78.11987 1.99 109.3 5.56 305.8 52.5 64.31988 1.00 54.4 3.90 212.4 50.1 74.4
Average1986-88 1.30 71.6 4.54 250.7 52.4 72.3
1/ See table 16 for explatiation of net returns.2/ Net returns are deflated, where 1982 - 1.0.Sources: U.S. Dept. Agr., Agricultural Stabilization and Conservation Service
and Costs of Production for Major U.S. Crops. 1975-87, U.S. Dept. Agr., EconomicResearch Service, May 1989.
in the acreage reduction prograi in order to be eligible for program benefits.Had those acres been in production, farmers would have harvested another 75-80million cwt of rice. Valued at the prevailing loan rate, farmers would havereceived $523 million in additional gross revenue from production on the idledacres. Subtracting variable cash expense estimated at $254 per acre for 1.32million acres, farmers could haVe realized a net revenue of $188 million on theidled acres. But Government deficiency payments for rice produced under the 1987program totaled $545 million. Thus, producers received a gain of $357 million forparticipating in the rice prog'ra. Even if farmers expected a higher price at thetime of sign-up for the prograi, they received added benefits from participation.
Farm program payments are based on an established payment rate per unit ofcommodity. Participants with higher output receive larger payments. Thus, farmswith high yields per harvested-acre or large farms are likely to receive thelargest share of program payments, no matter what the price received for theircrop or cost structure. As table 19 shows, less than 10 percent of producers hadfarms of more than 1,000 acres-, yet they received 28 percent of the deficiencypayments made in 1982. However, payment limitations affect large farms more thansmall farms.
39
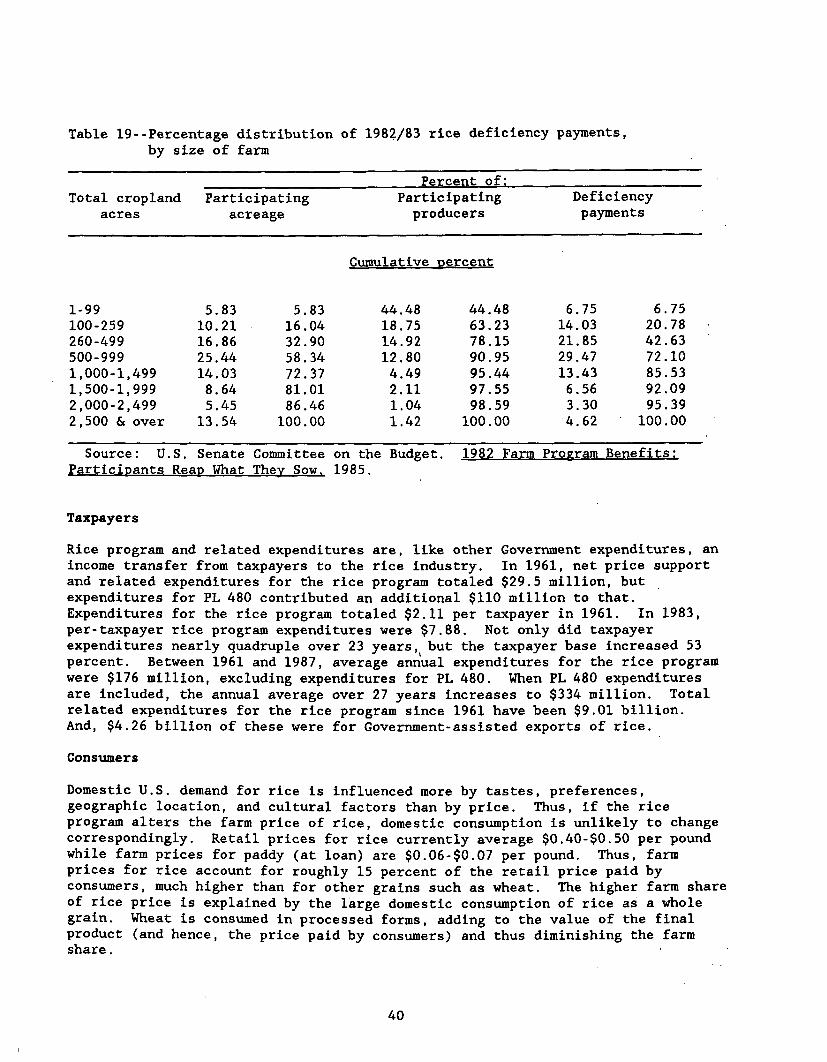
Table 19--Percentage distribution of 1982/83 rice deficiency payments,by size of farm
Percent of:Total cropland Participating Participating Deficiency
acres acreage producers payments
Cumulative percent
1-99 5.83 5.83 44.48 44.48 6.75 6.75100-259 10.21 16.04 18.75 63.23 14.03 20.78260-499 16.86 32.90 14.92 78.15 21.85 42.63500-999 25.44 58.34 12.80 90.95 29.47 72.101,000-1,499 14.03 72.37 4.49 95.44 13.43 85.531,500-1,999 8.64 81.01 2.11 97.55 6.56 92.092,000-2,499 5.45 86.46 1.04 98.59 3.30 95.392,500 & over 13.54 100.00 1.42 100.00 4.62 100.00
Source: U.S. Senate Committee on the Budget. 1982 Farm Program Benefits:Participants Reap What They Sow, 1985.
Taxpayers
Rice program and related expenditures are, like other Government expenditures, anincome transfer from taxpayers to the rice industry. In 1961, net price supportand related expenditures for the rice program totaled $29.5 million, butexpenditures for PL 480 contributed an additional $110 million to that.Expenditures for the rice program totaled $2.11 per taxpayer in 1961. In 1983,per-taxpayer rice program expenditures were $7.88. Not only did taxpayerexpenditures nearly quadruple over 23 years, but the taxpayer base increased 53percent. Between 1961 and 1987, average annual expenditures for the rice programwere $176 million, excluding expenditures for PL 480. When PL 480 expendituresare included, the annual average over 27 years increases to $334 million. Totalrelated expenditures for the rice program since 1961 have been $9.01 billion.And, $4.26 billion of these were for Government-assisted exports of rice.
Consumers
Domestic U.S. demand for rice is influenced more by tastes, preferences,geographic location, and cultural factors than by price. Thus, if the riceprogram alters the farm price of rice, domestic consumption is unlikely to changecorrespondingly. Retail prices for rice currently average $0.40-$0.50 per poundwhile farm prices for paddy (at loan) are $0.06-$0.07 per pound. Thus, farmprices for rice account for roughly 15 percent of the retail price paid byconsumers, much higher than for other grains such as wheat. The higher farm shareof rice price is explained by the large domestic consumption of rice as a wholegrain. Wheat is consumed in processed forms, adding to the value of the finalproduct (and hence, the price paid by consumers) and thus diminishing the farmshare.
40