TRADE PREFERENCES FOR APPAREL AND THE...
24
TRADE PREFERENCES FOR APPAREL AND THE ROLE OF RULES OF ORIGIN – THE CASE OF AFRICA Paul Brenton and Çağlar Özden * The World Bank Abstract This paper examines the nature of trade preferences for apparel and the evolution of apparel trade from developing country beneficiaries to conclude that preferences have been an important factor in stimulating diversification into manufactures for certain developing countries. For example, AGOA has led to substantial increases in imports from a number of Sub-Saharan Africa countries. Nevertheless, for most African countries the value of EU, US and Japanese preferences are very low or negligible. However, the scope for preferences to facilitate diversification into the apparel sector is limited by the lack of consistency across the different preference schemes. Typically, an apparel product from Africa that can enter under one country’s preference scheme will not be able enter under another due to differences in the rules of origin. Allowing an African apparel product the same access to all preferential markets would help to alleviate any impact from preference erosion. More generally, there is the issue of how to assist the majority of countries in Africa as preference erosion removes a route for future export diversification. * PREM Trade and Development Research Group (DECRG), The World Bank, 1818 H Street, NW, Washington, DC 20433; Email: [email protected] and [email protected] , respectively. The views expressed here are those of the authors and should not be attributed to the World Bank. 1
Transcript of TRADE PREFERENCES FOR APPAREL AND THE...
TRADE PREFERENCES FOR APPAREL AND
THE ROLE OF RULES OF ORIGIN –
THE CASE OF AFRICA
Paul Brenton and Çağlar Özden*
The World Bank
Abstract This paper examines the nature of trade preferences for apparel and the evolution of apparel trade from developing country beneficiaries to conclude that preferences have been an important factor in stimulating diversification into manufactures for certain developing countries. For example, AGOA has led to substantial increases in imports from a number of Sub-Saharan Africa countries. Nevertheless, for most African countries the value of EU, US and Japanese preferences are very low or negligible. However, the scope for preferences to facilitate diversification into the apparel sector is limited by the lack of consistency across the different preference schemes. Typically, an apparel product from Africa that can enter under one country’s preference scheme will not be able enter under another due to differences in the rules of origin. Allowing an African apparel product the same access to all preferential markets would help to alleviate any impact from preference erosion. More generally, there is the issue of how to assist the majority of countries in Africa as preference erosion removes a route for future export diversification.
* PREM Trade and Development Research Group (DECRG), The World Bank, 1818 H Street, NW, Washington, DC 20433; Email: [email protected] and [email protected], respectively. The views expressed here are those of the authors and should not be attributed to the World Bank.
1

1. Introduction
Many developing countries receive unilateral or reciprocal preferential access to the
markets of developed countries. These preferences are most pronounced for LDCs and
Sub-Saharan African countries. The broad support of these countries for multilateral trade
liberalization appears to have been tempered by their fear that lower MFN tariffs in
developed countries will erode their advantages and undermine their export performance.
On the face of it, such a common fear of preference erosion is difficult to interpret when
the total share of the preference receiving developing countries in global trade has fallen
over the years. A careful analysis actually reveals that the majority of preference-
receiving countries obtain very little benefit from existing preference schemes and, as a
result, would not appear to lose much from MFN trade liberalization.
There are a number of reasons why most developing countries do not benefit from
existing preferential market access programs. First, in many cases, exports are dominated
by primary products and raw materials that are already subject to very low, often zero,
MFN tariffs. Second, even in the case of products where MFN tariffs are considerable
(such as agricultural products and textiles & apparel), the main unilateral preference
programs, such as the GSP, may completely exclude them. Finally, there are many
reciprocal programs (customs unions or free trade areas) that include almost all products
as a matter of rule and unilateral programs (CBI, AGOA, EBA or Cotonou Agreement)1
that are more comprehensive in their coverage. However such programs tend to impose
rather strict rules of origin requirements. As a result, compliance with these “generous”
preferences requires significant burdens in terms of additional input costs and
bureaucratic paperwork that decrease their utilization and benefits considerably. The
rules of origin vary considerably across the different preference schemes. The available
evidence suggests that in the case of apparel, there has been a substantial supply response
to preferences in a number of developing countries when rules of origin have been non-
restrictive.
1 CBI: Caribbean Basin Initiative; AGOA: African Growth and Opportunity Act; EBA: Everything But Arms;
2
The aim of this paper is to address the preference utilization and erosion issue and the
importance of the rules of origin in the context of the apparel sector. Apparel provides a
unique opportunity since both the US and the EU imposed rather strict protectionist
measures on their apparel imports in recent decades within the framework of the Multi-
fiber Agreement (MFA). Even though the MFA quotas were completely removed as of
January 1, 2005, MFN tariffs of around 20% in the US and 12% in the EU are still in
place. As a result of these trade barriers, the preferences granted by the US and the EU to
apparel exports of many developing countries are potentially among the most valuable.
These preferences have been implemented either through reciprocal arrangements (such
as NAFTA or EU-Turkey customs union) or unilateral programs (such as the Caribbean,
Andean or the African Preferences of the US and the Cotonou Agreement and the EBA
of the EU.) A number of developing countries have managed to substantially increase
their exports of apparel, which, in most likelihood, would have been rather unlikely if
they had faced the same barriers as most South and East Asian exporters such as China.
Thus, if one were to expect to see the effects of preferential access and the rules of origin
requirements on the exporters from developing countries, it would be most transparent in
the apparel sector.
The desire to extend preferential market access or, at least, to avoid preference erosion
due to multilateral liberalization may reflect a perception that trade preferences can
stimulate diversification into a broad range of export categories with higher value added
compared to traditional agricultural exports. As a matter of fact, when the Generalized
System of Preferences (GSP) was first implemented more than three decades ago as part
of infant-industry promotion policies, the goal was to “increase the export earnings,
…promote industrialization and accelerate economic growth” in developing countries by
expanding their exports into industrial products. However, there is very scant evidence of
such export portfolio “upgrading” as a result of preferences. For example, Özden and
Reinhardt (2005) find no positive effect of GSP preferences on various export
performance measures of the beneficiary countries.
3
Apparel seems to be the main, and possibly the only, exception where developing
countries have been able to significantly increase exports. Stevens and Kennan (2004)
note that, within the manufacturing sector, effective preferences for Africa are
concentrated on a single category of exports, apparel. Indeed, apparel is a key sector for
many developing countries since they can exploit their comparative advantage in low
labor cost operations whilst many apparel products remain subject to relatively high tariff
barriers in the EU and the US. In addition, technology is relatively simple, start-up costs
are comparatively small and scale economies are not as important as for other industries,
all of which favors production in low labour cost locations.
The next critical issue from a development perspective becomes whether this export
performance is a temporary phenomenon purely based on the preference margin or
whether underlying the preferences are sustainable sources of comparative advantage
which can be exploited when the preference margin eventually contracts. Nevertheless, a
large number of developing countries, particularly in Africa, have not yet been able to
exploit the opportunities created by preferences in the main industrialised markets
because they currently lack the necessary infrastructure and the business climate.
However, they might be able to take advantage of preferences at a future point in time
when these constraints have been removed. Thus, preference erosion will limit such
future prospects and limit future diversification for these countries. If countries which
currently receive preferences are to be compensated for their erosion, should we not also
compensate those countries that might benefit from preferences in the future?
This paper focuses first on the situation with regard to apparel preferences in the US,
where there are a range of preference schemes affecting imports of apparel and recently
there has been a substantial impact on the exports of a small group of Sub-Saharan
African countries under AGOA. The US case is particularly interesting because the
different preferences schemes have different rules of origin. We then look specifically at
Sub-Saharan African countries, which have been targeted in recent preference initiatives
by the EU and the US (EBA and AGOA). We highlight the importance of apparel
preferences under the different country schemes in relation to the overall value of
4

preferences and then discuss differences in the rules of origin across the schemes and
how they might explain the different supply responses that have been observed.
2. Apparel Preferences of the US
(i) Caribbean and Andean preferences
The Caribbean and Central American countries were among the first group to receive
preferences from the US and the overall program is generally referred to as the Caribbean
Basin Initiative (CBI). The goal has been to promote economic development through
expansion of foreign and domestic investment, diversifying CBI country economies and
expanding their exports. CBI refers to the Caribbean Basin Economic Recovery Act of
1983 (CBERA), the Caribbean Basin Economic Recovery Expansion Act of 1990
(CBERA Expansion Act), and the U.S.-Caribbean Basin Trade Partnership Act of 2000
(CBTPA), collectively.
Articles covered by the MFA were initially excluded from CBERA but the CBERA
beneficiary countries could receive certain preferences for their apparel exports under the
Special Access Program (SAP) implemented in 1986. First, countries could receive
quotas in excess of their MFA quotas which meant the latter ceased to be binding in most
cases. More importantly, the US made components of articles assembled abroad in
beneficiaries were exempted from duties. As a result, fabric and textiles formed and cut
in the US, were exported to CBI countries for assembly and then shipped back to the US.
In other words, tariffs were only imposed on the fabrics and inputs that came from third
countries. This regime, as Krishna and Krueger (1995) argue, is identical to taxation of
third-party inputs. Among the main beneficiaries of apparel preferences are El Salvador,
Guatemala, Honduras, Costa Rica, Dominican Republic, Haiti, and Nicaragua.
The CBTPA was signed into law on May 18, 2000 as part of the Trade and Development
Act of 2000 and it considerably expanded the preferences received by the CBI countries
for their apparel exports. This was mainly a result of the intense lobbying by CBI
countries who had lost a considerable portion of their preference margin with the
5
implementation of NAFTA in 1994. The main modification was the extension of
preferential market access to apparel products that are
• assembled from U.S.-made and cut fabric, manufactured from U.S. yarn that are entered under HTS Chapter 61 and 62;
• cut and assembled from U.S. fabric made with U.S. Yarn, sewn in CBPTA countries with U.S. formed thread;
• knit to shape (other than certain socks) from U.S. yarns, and knit apparel cut and wholly assembled from fabric formed in one or more beneficiary countries or in the U.S., from U.S. yarns.
In short, the rules of origin for apparel require that articles need to be made from US
fabric which in turn has to be produced from US yarn in order to receive preferential
treatment.
(ii) NAFTA preferences
Special rules for trade in textiles and apparel goods between NAFTA countries are set out
in Annex 300-B and in the rules of origin applying to those products in Annex 401. Other
elements regarding trade in textiles and apparel goods are also found in the general
provisions of the Agreement, such as those on tariff elimination and technical standards.
Most textiles and apparel must be produced (cut and sewn) in a NAFTA country from
yarn made in a NAFTA country in order to qualify for preferential tariffs. In the case of
cotton and man-made fibre spun yarn, the fibre must originate in the NAFTA area.
NAFTA and CBTPA rules of origin are similar in spirit and implementation. Naturally,
the impact of these rules on Mexico is likely to be less restrictive since it has the
capability of producing more of the input domestically compared with much smaller CBI
beneficiary countries.
(iii) AGOA Preferences
On May 18, 2000, President Clinton signed into law the Trade and Development Act of
2000. The African Growth and Opportunity Act (AGOA) is title I of that law. On
October 2, 2000, 34 sub-Saharan countries were designated as eligible to participate,
subject to their ability to implement U.S. customs procedures and implement effective
6
visa systems to prevent illegal trans-shipment and use of counterfeit documentation, as
well as effective enforcement and verification procedures. The current number of
beneficiaries is 372. AGOA provides duty-free and quota-free treatment for eligible
apparel articles made in qualifying Sub-Saharan African countries through to 2015.
Qualifying articles include apparel made from US or sub-Saharan (regional) fabric or
yarn. However, compared to all other preference programs, AGOA grants special ROO
for countries that are designated as “lesser developed countries”. These countries may use
third country fabric and yarn and still qualify for AGOA preferences. 26 countries are
currently qualified for apparel preferences and all were designated as “lesser developed
countries,” with the exception of South Africa and Mauritius3. The special rule has been
extended until 2013 but can be renewed by Congress, as has happened in the past. Also,
AGOA limits imports of apparel made with regional or third country fabric to a fixed
percentage of the aggregate apparel imported into the United States. The cap is around
3.5% for 2006 which has never been binding since it was implemented.
3. Apparel Imports of the United States under Preferences
The US preference programs for apparel imports from developing countries, as
mentioned earlier, first started with the CBI program. The next big step was the extension
of duty-free access to Mexico under NAFTA which significantly eroded the preference
margins of the CBI countries. Under heavy lobbying by the CBI countries, the US
government implemented CBTPA which granted more generous preferences. As opposed
to CBERA, which granted duty-free treatment only on the portion of the value-added that
is due to US inputs, CBTPA grants complete duty-free treatment as long as rules of origin
are satisfied. The next step was the establishment of ATPA and AGOA which granted
preferences to Andean countries (as part of the war on drugs) and sub-Saharan African
2 Countries are deemed to be eligible for AGOA preferences if “they are determined to have established, or are making continual progress toward establishing the following: market-based economies; the rule of law and political pluralism; elimination of barriers to U.S. trade and investment; protection of intellectual property; efforts to combat corruption; policies to reduce poverty, increasing availability of health care and educational opportunities; protection of human rights and worker rights; and elimination of certain child labor practices” (source: www.agoa.gov.) A number of countries have been added and others have been removed over the years. For example, the US removed Eritrea and Central African Republic in 2004, Côte d'Ivoire in 2005, Mauritania in 2006. Mauritania, however, was reinstated in 2007. 3 Mauritius was temporarily declared eligible (until 2006) for this third country fabric rule after an amendment to the AGOA Acceleration Act of 2004 and following intense efforts by its government
7
countries respectively. Preferences for Andean countries are very similar to CBI
preferences in terms of rules of origin. However, AGOA is markedly different since it
allows the use of third-party fabric and other inputs as long as the countries are
considered less-developed (and subject to the aforementioned 2.5% cap).
Apparel products are divided into two main categories – Knitted (HTS 61) and not-
knitted (HTS 62). The rules of origin requirements have different implications for these
categories as it will become clear shortly.
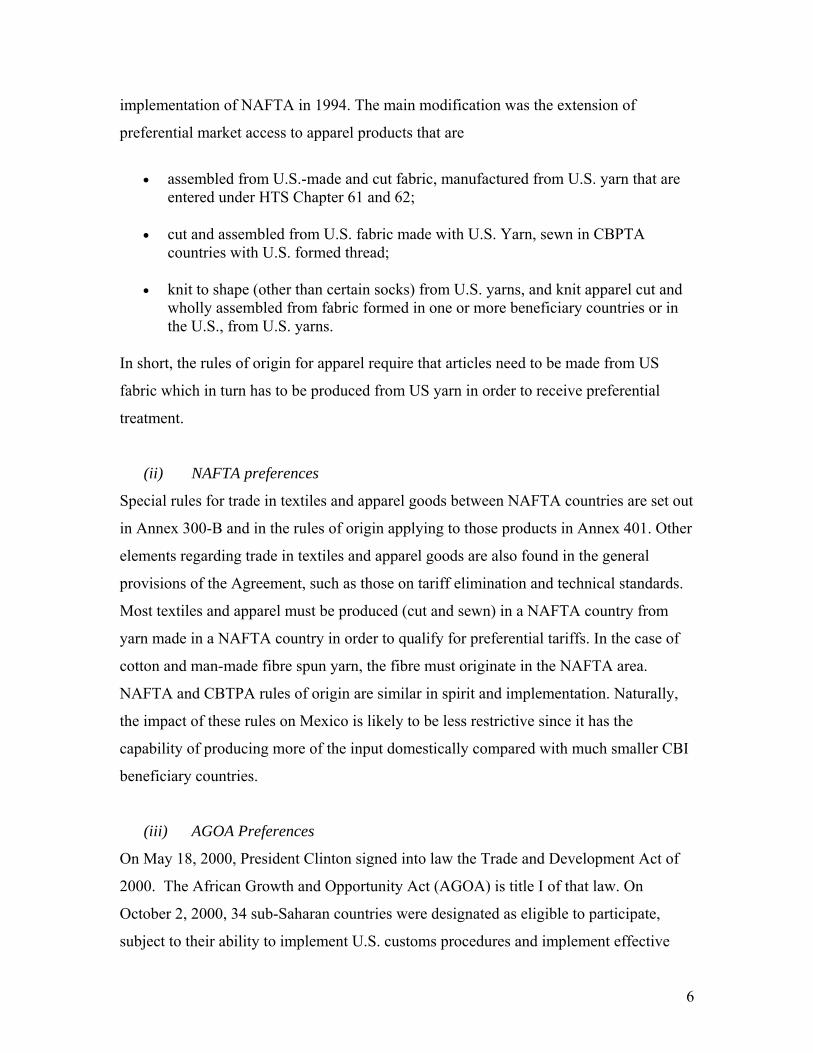
Figure 1: The Evolution of US Imports under the Different Preferential Programs
HTS 61 - KNITTED APPAREL IMPORTS OF US UNDER PREFERENCE PROGRAMS
0%5%
10%15%20%25%30%
2001 2002 2003 2004 2005
CBTPA NAFTA AGOA ANDEAN West Bank/Israel
HTS 62 - NOT-KNITTED APPAREL IMPORTS OF US UNDER PREFERENCE PROGRAMS
0%5%
10%15%20%25%30%
2001 2002 2003 2004 2005
CBTPA NAFTA AGOA ANDEAN West Bank/Israel
Figure 1 presents the share of apparel imports of the US under preference programs for
2001 and 2004. We included the first four months of 2005 for which the data are
available. For knitted items, close to 30% of total imports are entering under preference
programs. The combined share of CBTPA countries and Mexico is stable around 22%.
The increase after 2001 is mainly due to expansion of imports from Andean, AGOA
countries and under the terms of the US-Israel FTA (which allows goods wholly
produced by the Gaza Strip or West Bank enter the US duty free)). The key observation
is that the relaxation and eventual removal of MFA quotas (on January 1, 2005) did not
seem to have any immediate impact on the knitted apparel imports under the preference
programs. For not-knitted items (mainly made from fabric – such as shirts etc.), the
imports under preference programs peaks at 25% in 2002 and gradually declines
afterwards. The longer term impact of MFA removal is complicated by the re-imposition
8
of certain restrictions as well as concurrent changes in market access rules for some of
the other eligible countries. For example, the Central American countries all signed Free
Trade Area Agreements with the US.
The important point is the decline in the share of CBI countries and Mexico – their
combined market share drops from 23% in 2002 to 15% in 2005. First, the rules of origin
requirements are more costly for not-knitted items since they imply that both the fabric
and the yarn that the fabric is made from has to come from either the US or the
beneficiary country. For knitted items, since there is typically no fabric involved, this rule
is less costly to satisfy. Especially for CBI countries, which do not have a textiles
industry (i.e. they cannot produce the relevant inputs), the impact has been rather severe.
Their market share declined from 15% to 10% in the three years from 2002 to 2005? as
the MFA quotas were removed. The main effect of the removal of global trade barriers
for the apparel preference-recipients seems to be the market share decline in the not-
knitted categories. We should note that AGOA and Andean countries enjoy increasing
market share during the same period. There are several reasons for this performance. First
of all, they obtained the preferences in 2000. The increased market share is the entry
effect – especially as the firms master the market dynamics and preference rules.
Furthermore AGOA countries face less restrictive rules of origin than those faced by CBI
countries and Mexico. In the next section, we present the export performance under each
preference program – CBTPA, NAFTA, Andean and AGOA.
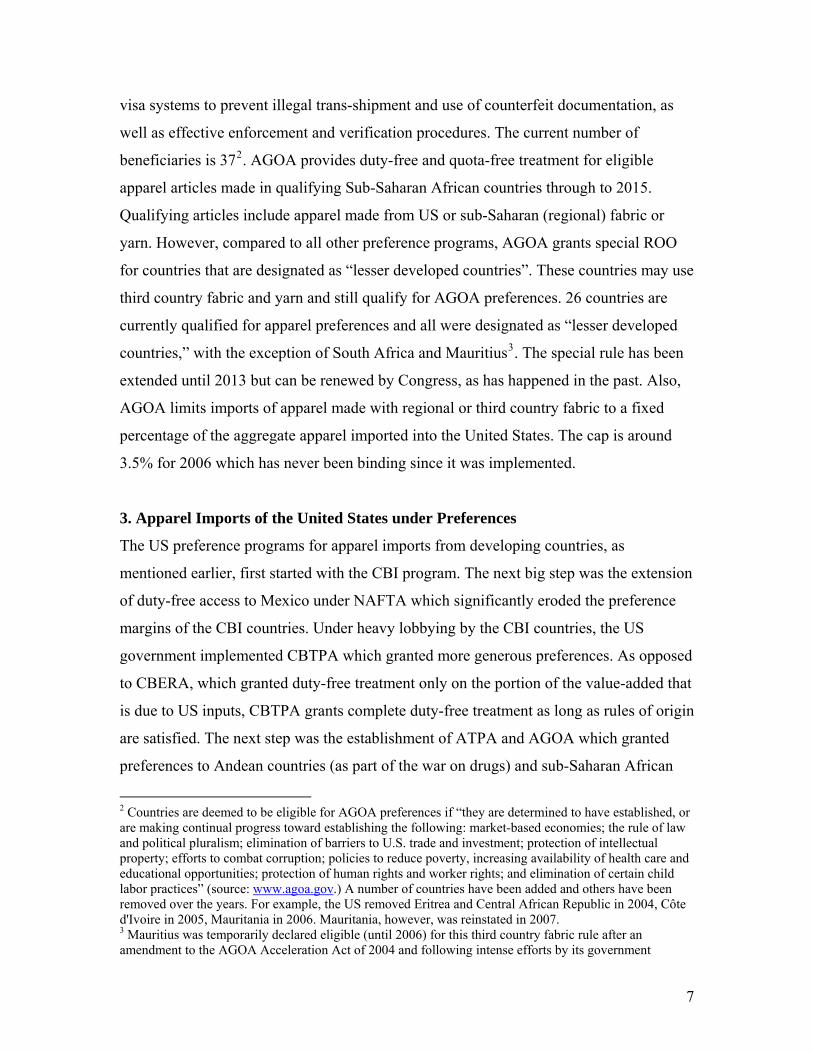
Figure 2. US Imports of Apparel from CBI countries
61 - KNITTED APPAREL EXPORTS TO THE US
01,0002,0003,0004,0005,0006,0007,000
1996 1997 1998 1999 2000 2001 2002 2003 2004
Mill
ions
$
TOTAL PREFERENCES
62 - NOT-KNITTED APPAREL EXPORTS TO THE US
01,0002,0003,0004,0005,0006,0007,000
1996 1997 1998 1999 2000 2001 2002 2003 2004
Mill
ions
$
TOTAL PREFERENCES
9

The figure above is the export performance of the CBI countries since 1996. The darker,
blue line shows total exports to the US of each category and the lighter, pink line beneath
it, presents the exports entering under preferences. Since CBTPA went into effect in
2001, the level is zero before that date. Although CBI exports enjoyed partial preferences
before 2001, this was not recorded separately by the US customs. As both graphs
indicate, a significant portion of exports from CBI countries (around 30%) still enter the
US without preferences and under full tariffs. This is indicative of the difficulty of
satisfying the rules of origin requirements. The graphs also indicate that the knitted-
items’ exports continue to increase rapidly. On the other hand, not-knitted items’ exports
are flat. Actually, the data indicate that the CBTPA had no effect on this category as
exports, not only failed to increase, they actually declined after 2001. However, this does
not imply that CBTPA is not valuable; the beneficiary countries’ exporters now capture a
portion of the tariff that was previously collected.
Figure 3. US Imports of Apparel from Mexico
61 - KNITTED APPAREL EXPORTS TO THE US
0
1,000
2,000
3,000
4,000
5,000
1996 1997 1998 1999 2000 2001 2002 2003 2004
Mill
ions
$
TOTAL PREFERENCES
62 - NOT-KNITTED APPAREL EXPORTS TO THE US
0
1,000
2,000
3,000
4,000
5,000
1996 1997 1998 1999 2000 2001 2002 2003 2004
Mill
ions
$
TOTAL PREFERENCES
Mexican apparel exports show a different pattern compared to the CBI countries. First,
the exports of both categories start to decline after 2000. The first reason for this pattern
is the implementation of the CBTPA, AGOA and Andean preferences. The new
preference programs naturally had an adverse effect on Mexican exports together with
gradually relaxed MFA quotas. Second, a considerable portion of Mexican exports also
enter the US without preferences. One interesting pattern is that over the last few years,
the utilization ratio has been increasing. This results from Mexican apparel manufacturers
10
re-designing their supply chains over the years to use US inputs in order to satisfy rules
of origin requirements. The utilization ratio is actually higher for not-knitted items for
Mexico for the latter years. This is due to a larger textiles industry and the proximity to
the US so that the production processes with the suppliers can be better integrated,
compared to the CBI countries.
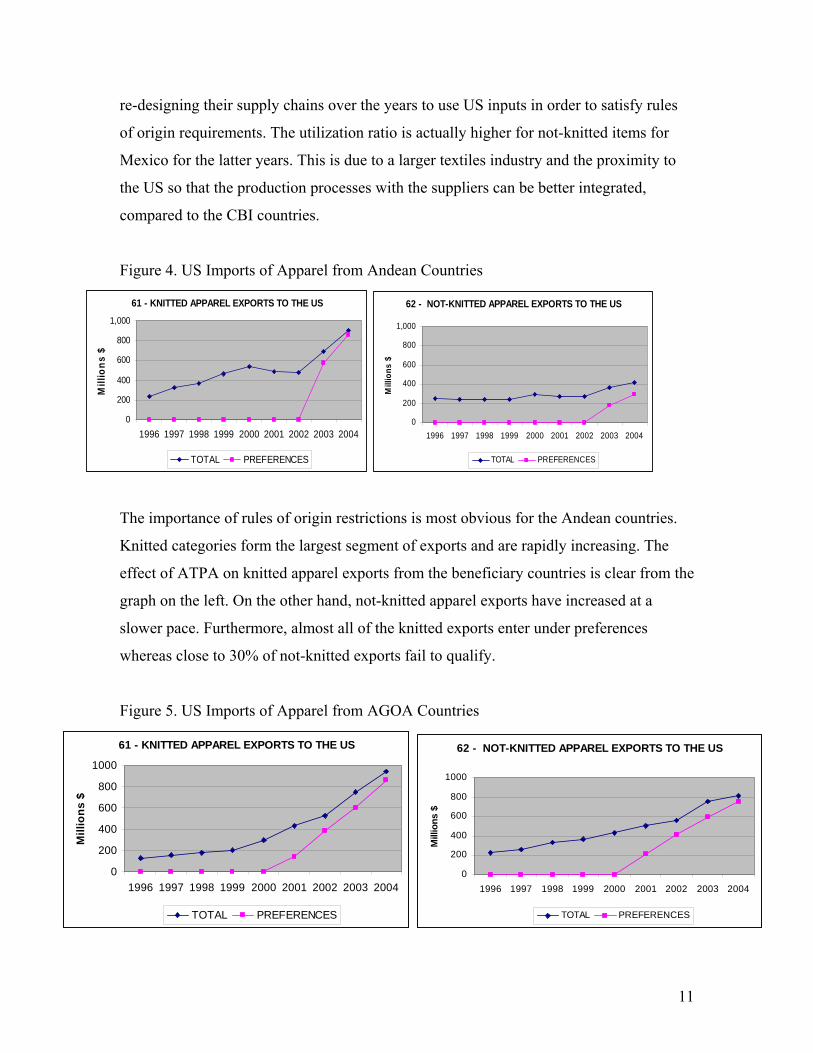
Figure 4. US Imports of Apparel from Andean Countries
61 - KNITTED APPAREL EXPORTS TO THE US
0
200
400
600
800
1,000
1996 1997 1998 1999 2000 2001 2002 2003 2004
Mill
ions
$
TOTAL PREFERENCES
62 - NOT-KNITTED APPAREL EXPORTS TO THE US
0
200
400
600
800
1,000
1996 1997 1998 1999 2000 2001 2002 2003 2004
Mill
ions
$
TOTAL PREFERENCES
The importance of rules of origin restrictions is most obvious for the Andean countries.
Knitted categories form the largest segment of exports and are rapidly increasing. The
effect of ATPA on knitted apparel exports from the beneficiary countries is clear from the
graph on the left. On the other hand, not-knitted apparel exports have increased at a
slower pace. Furthermore, almost all of the knitted exports enter under preferences
whereas close to 30% of not-knitted exports fail to qualify.
Figure 5. US Imports of Apparel from AGOA Countries
61 - KNITTED APPAREL EXPORTS TO THE US
0
200
400
600
800
1000
1996 1997 1998 1999 2000 2001 2002 2003 2004
Mill
ions
$
TOTAL PREFERENCES
62 - NOT-KNITTED APPAREL EXPORTS TO THE US
0
200
400
600
800
1000
1996 1997 1998 1999 2000 2001 2002 2003 2004
Mill
ions
$
TOTAL PREFERENCES
11
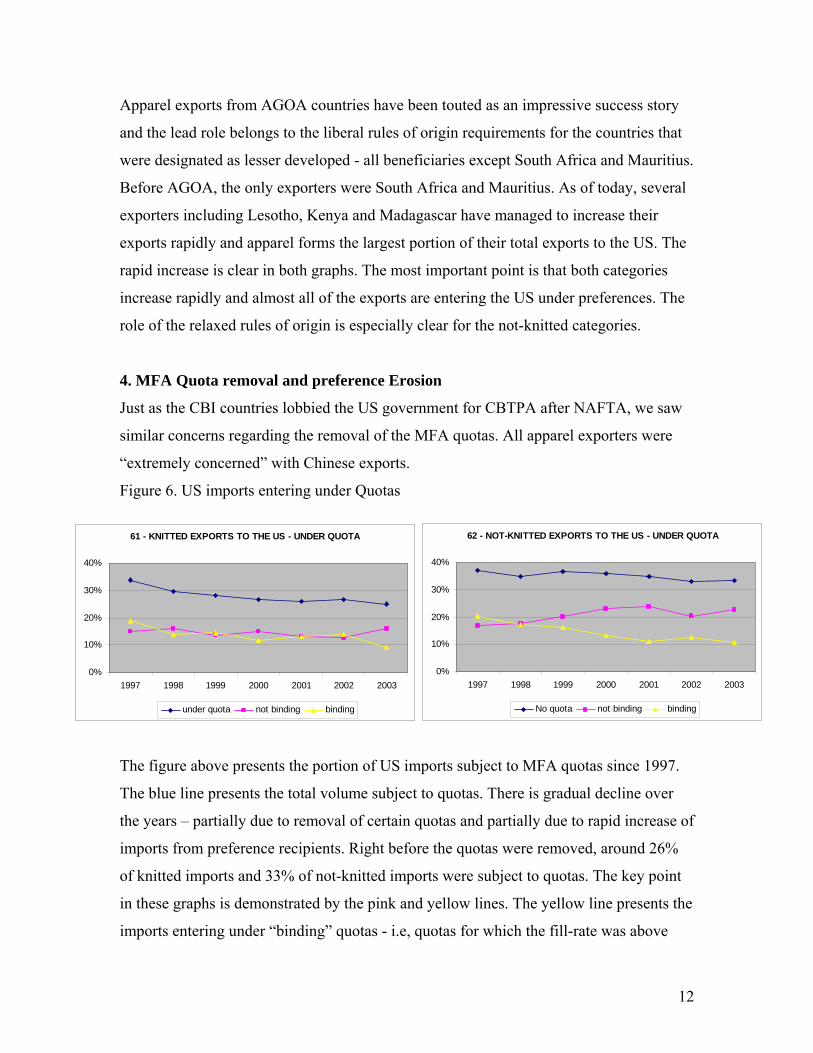
Apparel exports from AGOA countries have been touted as an impressive success story
and the lead role belongs to the liberal rules of origin requirements for the countries that
were designated as lesser developed - all beneficiaries except South Africa and Mauritius.
Before AGOA, the only exporters were South Africa and Mauritius. As of today, several
exporters including Lesotho, Kenya and Madagascar have managed to increase their
exports rapidly and apparel forms the largest portion of their total exports to the US. The
rapid increase is clear in both graphs. The most important point is that both categories
increase rapidly and almost all of the exports are entering the US under preferences. The
role of the relaxed rules of origin is especially clear for the not-knitted categories.
4. MFA Quota removal and preference Erosion
Just as the CBI countries lobbied the US government for CBTPA after NAFTA, we saw
similar concerns regarding the removal of the MFA quotas. All apparel exporters were
“extremely concerned” with Chinese exports.
Figure 6. US imports entering under Quotas
61 - KNITTED EXPORTS TO THE US - UNDER QUOTA
0%
10%
20%
30%
40%
1997 1998 1999 2000 2001 2002 2003
under quota not binding binding
62 - NOT-KNITTED EXPORTS TO THE US - UNDER QUOTA
0%
10%
20%
30%
40%
1997 1998 1999 2000 2001 2002 2003
No quota not binding binding
The figure above presents the portion of US imports subject to MFA quotas since 1997.
The blue line presents the total volume subject to quotas. There is gradual decline over
the years – partially due to removal of certain quotas and partially due to rapid increase of
imports from preference recipients. Right before the quotas were removed, around 26%
of knitted imports and 33% of not-knitted imports were subject to quotas. The key point
in these graphs is demonstrated by the pink and yellow lines. The yellow line presents the
imports entering under “binding” quotas - i.e, quotas for which the fill-rate was above
12
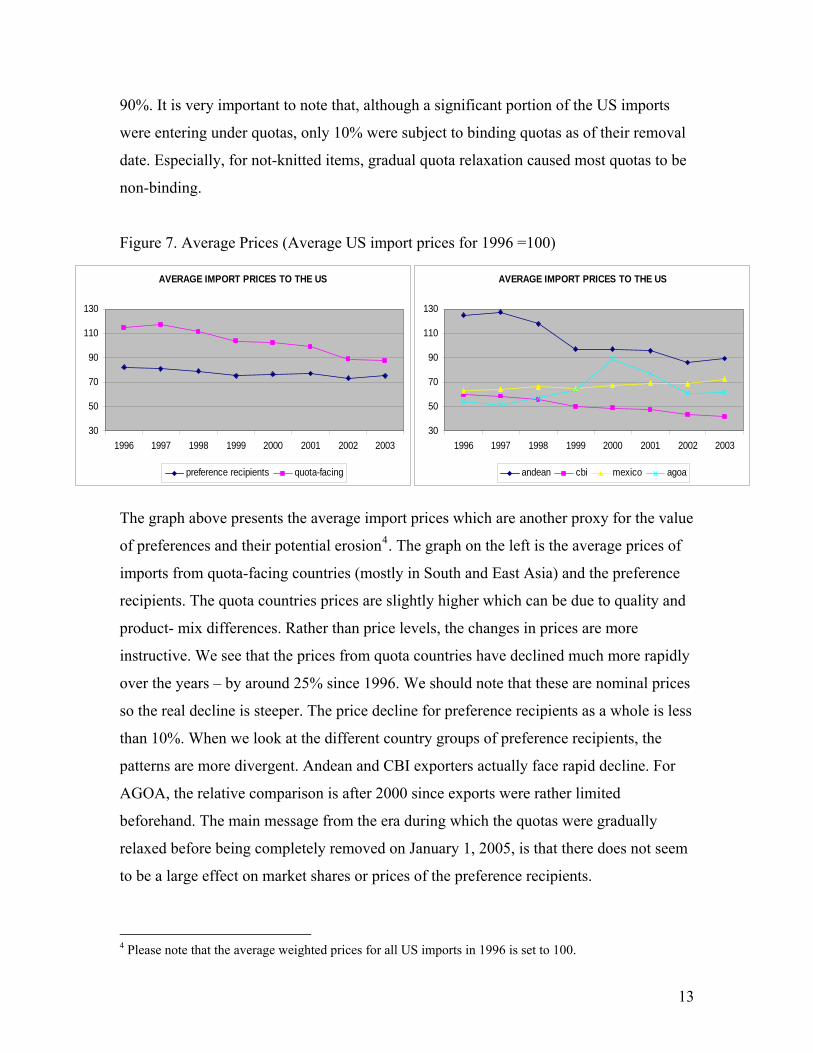
90%. It is very important to note that, although a significant portion of the US imports
were entering under quotas, only 10% were subject to binding quotas as of their removal
date. Especially, for not-knitted items, gradual quota relaxation caused most quotas to be
non-binding.
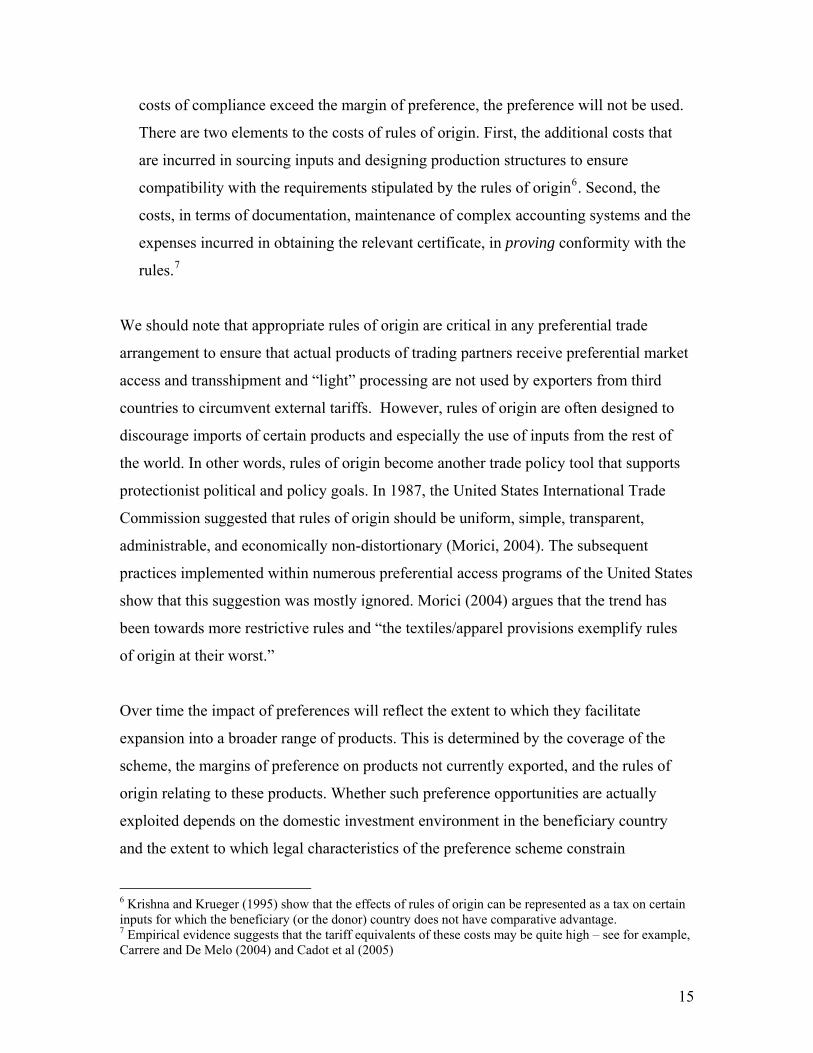
Figure 7. Average Prices (Average US import prices for 1996 =100)
AVERAGE IMPORT PRICES TO THE US
30
50
70
90
110
130
1996 1997 1998 1999 2000 2001 2002 2003
preference recipients quota-facing
AVERAGE IMPORT PRICES TO THE US
30
50
70
90
110
130
1996 1997 1998 1999 2000 2001 2002 2003
andean cbi mexico agoa
The graph above presents the average import prices which are another proxy for the value
of preferences and their potential erosion4. The graph on the left is the average prices of
imports from quota-facing countries (mostly in South and East Asia) and the preference
recipients. The quota countries prices are slightly higher which can be due to quality and
product- mix differences. Rather than price levels, the changes in prices are more
instructive. We see that the prices from quota countries have declined much more rapidly
over the years – by around 25% since 1996. We should note that these are nominal prices
so the real decline is steeper. The price decline for preference recipients as a whole is less
than 10%. When we look at the different country groups of preference recipients, the
patterns are more divergent. Andean and CBI exporters actually face rapid decline. For
AGOA, the relative comparison is after 2000 since exports were rather limited
beforehand. The main message from the era during which the quotas were gradually
relaxed before being completely removed on January 1, 2005, is that there does not seem
to be a large effect on market shares or prices of the preference recipients.
4 Please note that the average weighted prices for all US imports in 1996 is set to 100.
13

The above analysis has shown the important role that preferences have played in
explaining the growth of exports of apparel to the US of key preference-receiving
regions. We now proceed to look at how this translates into impacts on individual
countries and concentrate on Sub-Saharan African countries, the group of countries that
remain the most marginalized from the global economy. Assisting the integration of these
most-marginalised countries is a development priority and so preference schemes should
be designed to benefit Sub-Saharan African countries. In this context we also look at the
impact of the preferences granted by the EU and the US to Africa and especially those on
apparel, a key sector in establishing a manufacturing base. We start by briefly explaining
the main factors that determine what preferences are worth.
5. Apparel and Trade Preferences for Africa
Despite the intense discussion of preferences there is surprisingly very little information
on what these preferences are actually worth to developing countries. Sub-Saharan
African countries are eligible for significantly enhanced benefits, beyond those of the
standard GSP preference programs, in the US (under AGOA), in the EU (under the
Cotonou Agreement and the EBA for the LDCs) and Japan (deeper preferences for
LDCs).
The impact of a particular set of trade preferences on an individual beneficiary country at
a particular point in time is determined by:
• The importance of eligible products for preferences in the export and production
structure of the beneficiary country.
• The margin of preference, determined by the height of the MFN tariff other
restrictions faced by excluded countries and the size of the preference.
• The utilization of preferences, i.e. the extent to which exports that are eligible for
preferences actually receive preferential access. This, for the large part, reflects the
costs of satisfying the rules, mainly the rules of origin, governing preferences.5 If the
5 Note that utilization rates do not capture situations where the rules of origin are prohibitive, in that they prevent any preferential exports and there are no exports at the full duty. In other words, there may be cases where the beneficiaries can only export with preferences but the rules of origin constrain any take up of those preferences. In this sense the utilization rates understate the constraining impact of the rules of origin.
14
costs of compliance exceed the margin of preference, the preference will not be used.
There are two elements to the costs of rules of origin. First, the additional costs that
are incurred in sourcing inputs and designing production structures to ensure
compatibility with the requirements stipulated by the rules of origin6. Second, the
costs, in terms of documentation, maintenance of complex accounting systems and the
expenses incurred in obtaining the relevant certificate, in proving conformity with the
rules.7
We should note that appropriate rules of origin are critical in any preferential trade
arrangement to ensure that actual products of trading partners receive preferential market
access and transshipment and “light” processing are not used by exporters from third
countries to circumvent external tariffs. However, rules of origin are often designed to
discourage imports of certain products and especially the use of inputs from the rest of
the world. In other words, rules of origin become another trade policy tool that supports
protectionist political and policy goals. In 1987, the United States International Trade
Commission suggested that rules of origin should be uniform, simple, transparent,
administrable, and economically non-distortionary (Morici, 2004). The subsequent
practices implemented within numerous preferential access programs of the United States
show that this suggestion was mostly ignored. Morici (2004) argues that the trend has
been towards more restrictive rules and “the textiles/apparel provisions exemplify rules
of origin at their worst.”
Over time the impact of preferences will reflect the extent to which they facilitate
expansion into a broader range of products. This is determined by the coverage of the
scheme, the margins of preference on products not currently exported, and the rules of
origin relating to these products. Whether such preference opportunities are actually
exploited depends on the domestic investment environment in the beneficiary country
and the extent to which legal characteristics of the preference scheme constrain
6 Krishna and Krueger (1995) show that the effects of rules of origin can be represented as a tax on certain inputs for which the beneficiary (or the donor) country does not have comparative advantage. 7 Empirical evidence suggests that the tariff equivalents of these costs may be quite high – see for example, Carrere and De Melo (2004) and Cadot et al (2005)
15
investment decisions. Lack of permanence of schemes has often been quoted as a factor
limiting the supply response to trade preferences. In addition, and to an extent related to
supply capacities, are the abilities of developing country exporters to satisfy other
regulatory requirements for placing their products on developed country markets.
Probably of most importance are product health and safety standards.
Brenton and Ikezuki (2005) show that the overall value preferences for African countries
in the EU, US and Japan are rather small.8 In 2002, EU preferences to sub-Saharan
African countries amounted to 4 per cent of the value of those countries exports to the
EU. US preferences for these countries amounted to 1.3 per cent of the value of exports
to the US, whilst Japanese preferences amounted to 0.1 per cent of the value of exports.
However, these preferences are not evenly distributed across beneficiaries. Under the EU
schemes, 60 per cent of the benefits accrue to 5 countries. For the US, the top 5
beneficiaries account for almost three-quarters of the value of preferences, whilst for
Japan nearly 90 per cent of the preferences go to the top 5 countries. For the LDCs, the
top 10 beneficiaries account for 100 per cent of the benefits under the US and Japanese
schemes and more than 90 per cent of the benefits offered by the EU schemes. Thus, the
value of preferences for the remaining 37 countries (although they are not the same
countries in each case) is very small.
8 Previous studies of the impact of trade preferences have tended to be based on analysis of overall trade volumes using cross-country regression analysis to compare observed preference inclusive trade flows across a wide range of beneficiaries with a counterfactual situation without preferences. The utility of these approaches depends upon the extent to which the impact of trade preferences can be isolated from other explanatory variables of trade performance. Brenton and Ikezuki (2005) adopt a more direct approach and calculate (using detailed tariff line data on trade actually requesting preferences and the relevant tariff) the rents that preferences deliver at observed post-preferences trade volumes. Who gets these rents matters, nevertheless if the calculated rents are very small then there is unlikely to have been a significant impact on trade, employment or growth.
16
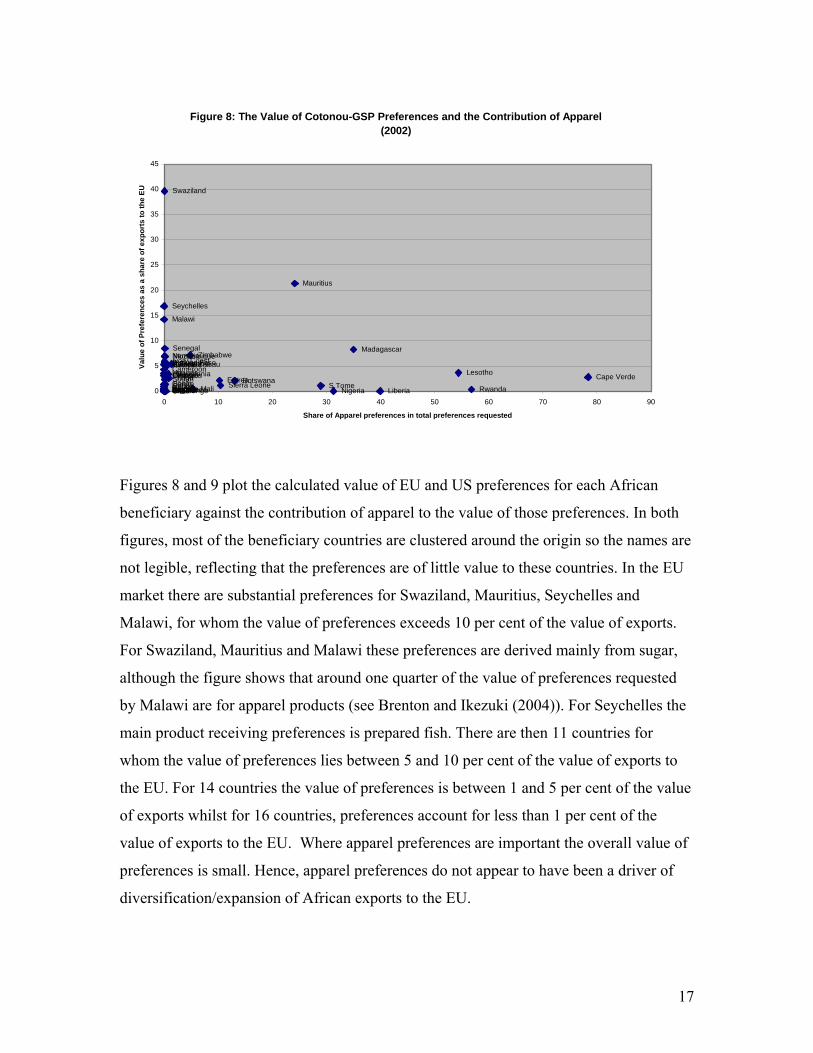
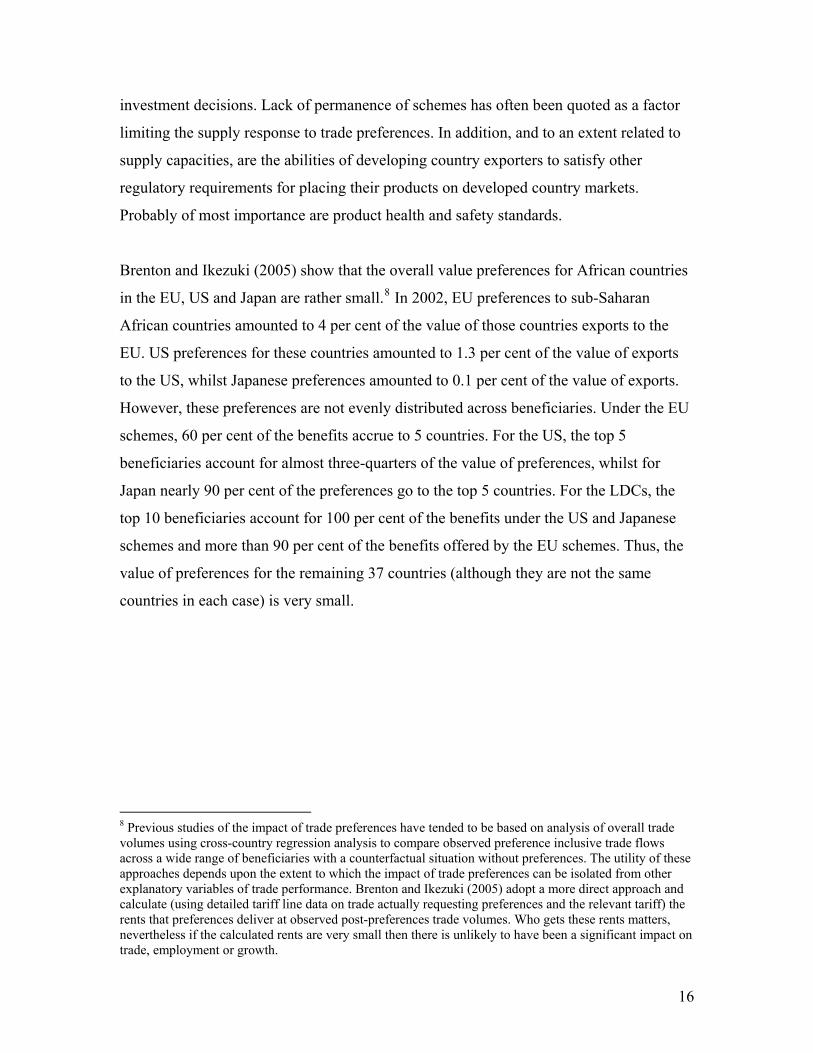
Figure 8: The Value of Cotonou-GSP Preferences and the Contribution of Apparel (2002)
ZimbabweZambiaUgandaTogo
Tanzania
Swaziland
SudanSomalia Sierra Leone
Seychelles
Senegal
S.Tome RwandaNigeria Nigeria
NamibiaMozambique
Mauritius
Mauritania
Mali
Malawi
Madagascar
Liberia
LesothoKenyaIvory CoastGuinea Bissau
GuineaGhanaGambia
GabonEthiopia
EritreaEq GuineaDR CongoDiboutiCongoComoros
ChadCAR
Cape VerdeCameroon
Burundi
Burkina Faso
BotswanaBeninAngola0
5
10
15
20
25
30
35
40
45
0 10 20 30 40 50 60 70 80 90
Share of Apparel preferences in total preferences requested
Valu
e of
Pre
fere
nces
as
a sh
are
of e
xpor
ts to
the
EU
Figures 8 and 9 plot the calculated value of EU and US preferences for each African
beneficiary against the contribution of apparel to the value of those preferences. In both
figures, most of the beneficiary countries are clustered around the origin so the names are
not legible, reflecting that the preferences are of little value to these countries. In the EU
market there are substantial preferences for Swaziland, Mauritius, Seychelles and
Malawi, for whom the value of preferences exceeds 10 per cent of the value of exports.
For Swaziland, Mauritius and Malawi these preferences are derived mainly from sugar,
although the figure shows that around one quarter of the value of preferences requested
by Malawi are for apparel products (see Brenton and Ikezuki (2004)). For Seychelles the
main product receiving preferences is prepared fish. There are then 11 countries for
whom the value of preferences lies between 5 and 10 per cent of the value of exports to
the EU. For 14 countries the value of preferences is between 1 and 5 per cent of the value
of exports whilst for 16 countries, preferences account for less than 1 per cent of the
value of exports to the EU. Where apparel preferences are important the overall value of
preferences is small. Hence, apparel preferences do not appear to have been a driver of
diversification/expansion of African exports to the EU.
17
Figure 9: The Value of AGOA-GSP Preferences and the Contribution of Clothing (2002)
Zambia Tanzania Uganda
Swaziland
South Africa Sierra LeoneSeychellesSenegalSap Tome and PrincipeRwanda Nigeria Niger Namibia
Mozambique
Mauritius
Mauritania Mali
Malawi
Madagascar
Lesotho
Kenya
Guinea-BissauGuineaGhana
GambiaGabon
Ethiopia
EritreaDjibouti Dem. Congo Cote d'Ivore Rep. CongoChadCentral Africa Rep.
Cape VerdeCameroon
Botswana
Benin 0
2
4
6
8
10
12
14
16
18
20
0 10 20 30 40 50 60 70 80 90 1
Share of clothing preferences in total preferences requested
Valu
e of
Pre
fere
nces
as
a sh
are
of e
xpor
ts o
t the
US
00
US preferences under AGOA and the GSP lead to substantial transfers, equivalent to
more than 10 per cent of exports to the US, for three countries: Lesotho, Kenya and
Swaziland. These preferences are almost entirely due to exports of apparel. Apparel
accounted for 100%, 99% and 99% respectively of the preferences for these 3 countries.
There are 3 countries for whom the value of preferences amounts to between 5 and 10 per
cent of the value of exports, for a further 3 countries preferences account for between 1
and 5 per cent of exports. For 37 countries the value of preferences amounts to less than 1
per cent of the value of exports to the US.
Hence, for many countries in Africa the preferences that are requested in the EU and the
US amount to a very small proportion of the value of exports. As such the impact of
preferences on these countries is likely to be very muted. Only a small number of
countries receive substantial transfers under current preference schemes. These are driven
mainly by preferences for sugar in the EU and for clothing in the US.
On the face of it, for the majority of countries, preferences have done little to stimulate
diversification of exports. If preferences were encouraging greater exports of new
18
products we should see a shift in beneficiaries exports to products with positive MFN
duties, which should then be reflected by more significant magnitudes for the value of
preferences. The fact that the value of preferences is very small for most countries
suggests that preferences have not led to a more diversified export structure for most
beneficiaries. Nevertheless, as is clear from the discussion of US preferences for apparel,
preferences can play a key role in stimulating exports of new products, if they are
consistent with underlying comparative advantages. Where significant, the preferences of
Sub-Saharan African countries have been driven by new export activities in the apparel
sector. Could preferences play a role in the future in diversifying other developing
countries exports away from agricultural products?
6. The Apparel Sector and Rules of Origin.
We now look in more detail at exports of clothing under the EU scheme and compare to
that of the US and discuss how the nature of the preferences and especially the rules of
origin can be crucial in determining the extent to which small developing countries are
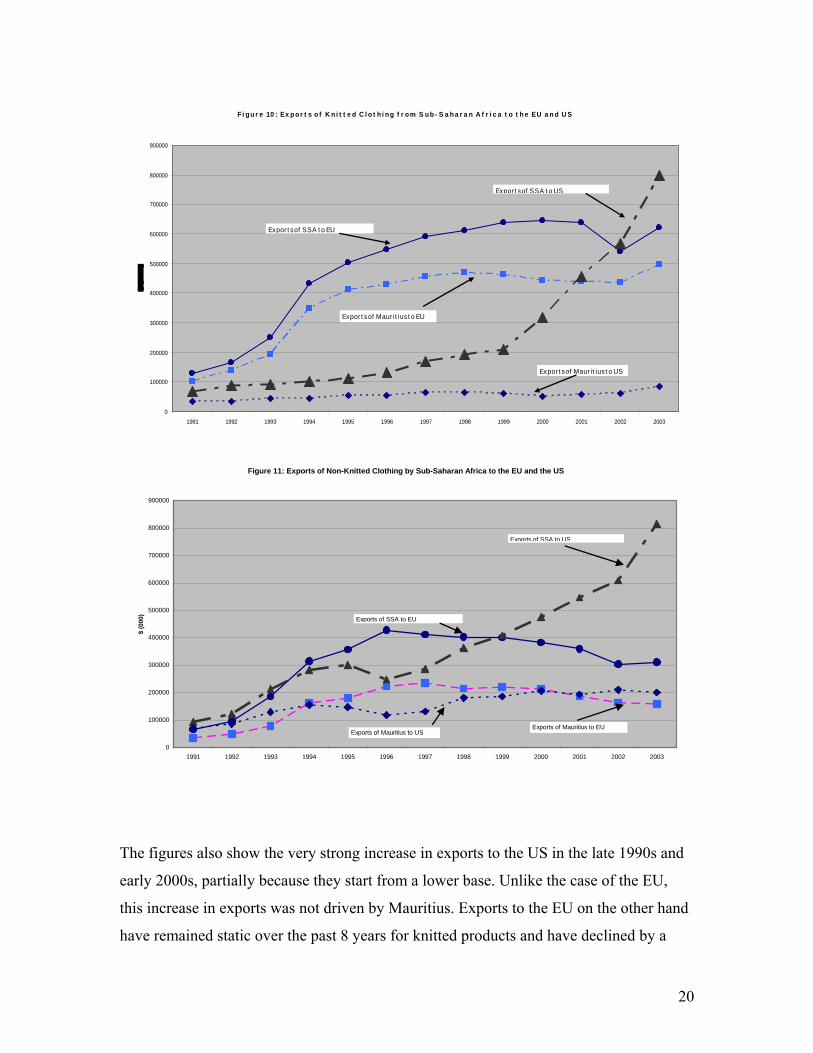
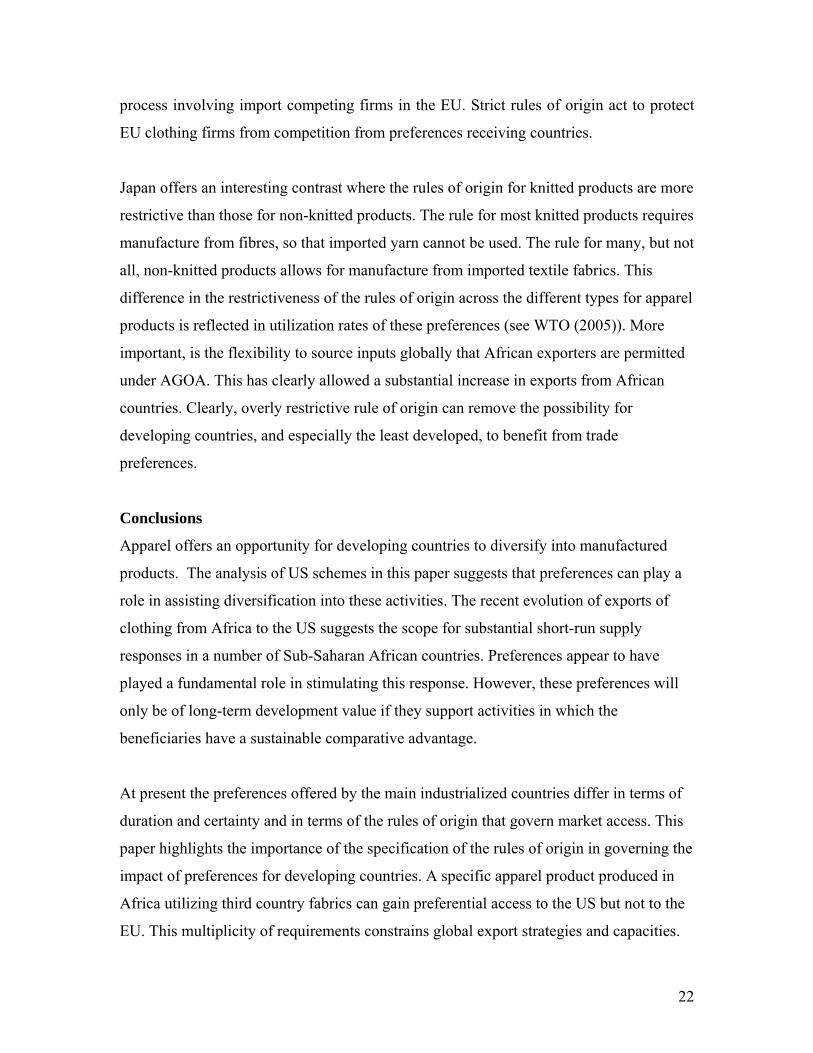
able to respond to the often substantial preferences that are on offer. Figures 10 and 11
show there are large increases in exports of knitted and non-knitted clothing products
from sub-Saharan African countries to both the EU and the US. The growth in exports to
the EU is concentrated in the early 1990s. Duties had already been removed under the
Lome convention in the 1980s. It is interesting that the supply response for knitted
products was stronger than that for non-knitted products, which may be a reflection that
the rules of origin for the latter products are more restrictive. The figures show that
African exports of apparel to the EU are dominated by the exports of Mauritius.
19
F i g u r e 10 : Ex p o r t s o f K n i t t e d C l o t h i n g f r o m S u b - S a h a r a n A f r i c a t o t h e EU a n d U S
0
100000
200000
300000
400000
500000
600000
700000
800000
900000
1991 1992 1993 1994 1995 1996 1997 1998 1999 2000 2001 2002 2003
Expor t sof SSA t o US
Expor t s of Maur it ius t o US
Expor t s of SSA t o EU
Expor t s of Maur it ius t o EU
Figure 11: Exports of Non-Knitted Clothing by Sub-Saharan Africa to the EU and the US
0
100000
200000
300000
400000
500000
600000
700000
800000
900000
1991 1992 1993 1994 1995 1996 1997 1998 1999 2000 2001 2002 2003
$ (0
00)
Exports of SSA to US
Exports of SSA to EU
Exports of Mauritius to USExports of Mauritius to EU
The figures also show the very strong increase in exports to the US in the late 1990s and
early 2000s, partially because they start from a lower base. Unlike the case of the EU,
this increase in exports was not driven by Mauritius. Exports to the EU on the other hand
have remained static over the past 8 years for knitted products and have declined by a
20

quarter for non-knitted products. Exports of non-knitted clothing products to the US now
exceed those to the EU by a factor of more than 2.6.We now proceed to briefly discuss
the nature of the preferences offered by the EU relative to those offered by the US.
EU rules of origin for clothing require production from yarn. This entails that a double
transformation process must take place in the beneficiary with the yarn being woven into
fabric and then the fabric cut and made-up into clothing. Countries cannot import fabrics
and make them up into clothing and receive preferential access, which constrains the
value of the scheme for countries which do not have an efficient textile industry. These
restrictive rules of origin are often supported by the argument that they are necessary to
encourage substantial value-added activities in developing countries and as a mechanism
for encouraging the development of integrated production structures within individual
developing countries, or within regional groups of countries through cumulation
mechanisms9, to maximize the impact on employment and to ensure that it is not just low
value-added activities that are undertaken in the developing countries.
However, there are important problems with this view. First, such rules discriminate
against small countries where the possibilities for local sourcing are limited or non-
existent. Since most developing countries are small countries they are particularly
disadvantaged by restrictive rules of origin relative to larger countries. Second, there is
no evidence that strict rules of origin over the past 30 years have done anything to
stimulate the development of integrated production structures in developing countries. In
fact such arguments have become redundant in the light of technological changes and
global trade liberalisation that have led to the fragmentation of production processes and
the development of global networks of sourcing. Strict rules of origin act to constrain the
ability of firms to integrate into these global and regional production networks and, as has
happened, to dampen the location of any new value-added activities in the clothing
sector. Finally, it should not be forgotten that these strict rules of origin are the result of a
9 The Cotonou agreement, but not the EBA, allows for cumulation amongst African countries, so that regional fabrics can be used without losing originating status. However, the difficulty is in finding efficient regional fabrics.
21
process involving import competing firms in the EU. Strict rules of origin act to protect
EU clothing firms from competition from preferences receiving countries.
Japan offers an interesting contrast where the rules of origin for knitted products are more
restrictive than those for non-knitted products. The rule for most knitted products requires
manufacture from fibres, so that imported yarn cannot be used. The rule for many, but not
all, non-knitted products allows for manufacture from imported textile fabrics. This
difference in the restrictiveness of the rules of origin across the different types for apparel
products is reflected in utilization rates of these preferences (see WTO (2005)). More
important, is the flexibility to source inputs globally that African exporters are permitted
under AGOA. This has clearly allowed a substantial increase in exports from African
countries. Clearly, overly restrictive rule of origin can remove the possibility for
developing countries, and especially the least developed, to benefit from trade
preferences.
Conclusions
Apparel offers an opportunity for developing countries to diversify into manufactured
products. The analysis of US schemes in this paper suggests that preferences can play a
role in assisting diversification into these activities. The recent evolution of exports of
clothing from Africa to the US suggests the scope for substantial short-run supply
responses in a number of Sub-Saharan African countries. Preferences appear to have
played a fundamental role in stimulating this response. However, these preferences will
only be of long-term development value if they support activities in which the
beneficiaries have a sustainable comparative advantage.
At present the preferences offered by the main industrialized countries differ in terms of
duration and certainty and in terms of the rules of origin that govern market access. This
paper highlights the importance of the specification of the rules of origin in governing the
impact of preferences for developing countries. A specific apparel product produced in
Africa utilizing third country fabrics can gain preferential access to the US but not to the
EU. This multiplicity of requirements constrains global export strategies and capacities.
22
Whilst the erosion of clothing preferences will directly affect only a relatively small
number of preference receiving countries in Africa, it may undermine the prospects for
diversification into clothing of a broader group of countries. In other words, current
preference erosion might hinder the emergence of a future “Lesotho”. Within the context
of discussions concerning compensation for preference erosion, this raises the question of
how to compensate for the erosion of potential future preferences and the removal of an
incentive to diversification. Obtaining a consensus estimate of the present value of future,
yet to be exploited preferences, is likely to be impossible. The priority should be to
alleviate the constraints to diversification in these countries, which preferences currently
help to mitigate, whilst at the same time the beneficiaries act to improve the environment
for business and investment. In many countries the principal constraints to diversification
include inadequate infrastructure, especially transport, telecommunications, energy and
water, lack of access to credit, and inefficient and costly customs procedures.
References
WTO (2005) ‘Options for Least-Developed Countries to Improve their Competitiveness in the Textiles and Clothing Business’, WT./COMTD/LDC/W/37 Brenton, P and T. Ikezuki (2004) ‘The Impact of Agricultural Trade Preferences, with Particular Attention to the Least Developed Countries’, A. Aksoy and J. Beghin (eds) Global Agricultural Trade and Developing Countries, World Bank, Washington D.C. Brenton, P and T.Ikezuki (2005) ‘The Initial and Potential Impact of Preferential Access to the U.S. Market under the African Growth and Opportunity Act’, World Bank Policy Research Working Paper No. 3262, World Bank, Washington DC. Cadot, O., C. Carrere, J. De Melo and B. Tumurchudur (2005) ‘Product Specific Rules of Origin in EU and US Preferential Trading Agreements: An Assessment’ CEPR Discussion Paper 4998 Carrere, C and J. De Melo (2004) Are Different Rules of Origin Equally Costly? Estimates from NAFTA, CEPR Discussion Paper 4437 Estevadeordal, A and K Suominen, (2005) “Rules of Origin: A World Map and Trade Effects”, in Estevadeordal, A, O. Cadot, A. Suwa-Eisenmann and T. Verdier (eds) The Origin of Goods: Rules of Origin in Preferential Trade Agreements, IADB and CEPR
23
24
Hoekman, B and C. Özden (2005) ‘Trade Preferences and Differential Treatment of Developing Countries: A Selective Survey’, Policy Research Working Paper 3566, World Bank. Inama, S (2004) ‘Rules of origin and development: the utilization of trade preferences under GSP schemes, AGOA and Cotonou Agreement’, paper presented at IDB conference on Rule of Origin in Regional Trade Agreements: Conceptual and Empirical Approaches, Washington Krishna, K. and A. Krueger (1995) ‘Implementing Free Trade Areas: Rules of Origin and Hidden Protection’, Working Paper 4983, NBER Mattoo, A, D. Roy and A. Subramanian (2002) ‘The Africa Growth and Opportunity Act and its Rules of Origin: Generosity Undermined?’ The World Economy, 26, 829-51 Morici (2004) ‘NAFTA Rules of Origin and Automotive Content Requirements’, The Fraser Institute, http://oldfraser.lexi.net/publications/books/assess_nafta/origin.html Özden, C and M. Olarreaga (2005) ‘AGOA and Apparel: Who Captures the Tariff Rent in the Presence of Preferential Market Access?’ World Economy, 28, 63-77 Ozden, C and E. Reinhardt (2005) “The Perversity of Preferences: GSP and Developing Country Trade Policies: 1976-2000,” Journal of Development Economics, 78, 1-21 Stevens, C and J. Kennan (2005) ‘Making Trade Preferences More Effective’, Trade Note, IDS, http://www.ids.ac.uk/IDS/global/pdfs/CSJKTradePreferences.pdf