Trade nivesh Equity Weekly Report 27 06 2016
8
10/1, 2nd Floor, Bharat Bhavan,Near Rani Sati Gate, Yashant Niwas Road Indore-452001 (M.P.) India Mobile :+91-9039261444 E-mail: [email protected] Telephone :+91-731-698.3000 Equity WEEKLY REPORT 27-JUNE-2016
-
Upload
tradenivesh-investment -
Category
Business
-
view
307 -
download
3
Transcript of Trade nivesh Equity Weekly Report 27 06 2016

10/1, 2nd Floor, Bharat Bhavan,Near Rani Sati Gate, Yashant Niwas Road
Indore-452001 (M.P.) India Mobile :+91-9039261444 E-mail: [email protected] Telephone :+91-731-698.3000
Equity WEEKLY REPORT
27-JUNE-2016
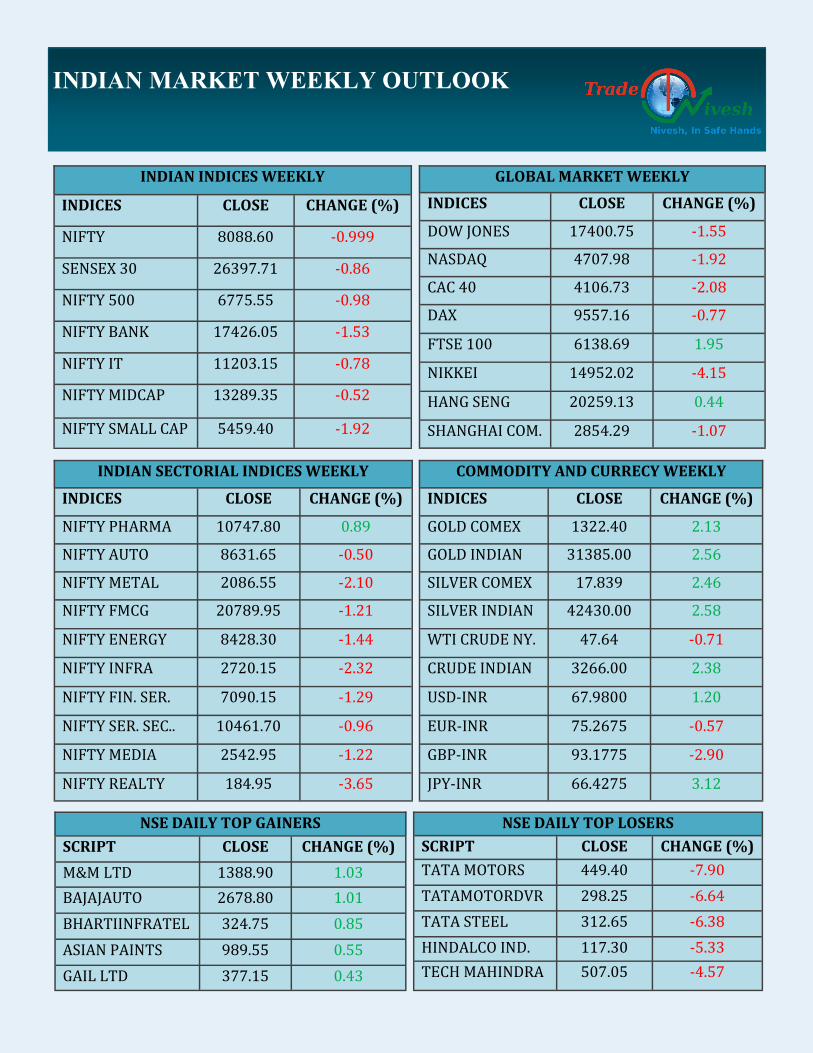
GLOBAL MARKET WEEKLY
INDICES CLOSE CHANGE (%)
DOW JONES 17400.75 -1.55
NASDAQ 4707.98 -1.92
CAC 40 4106.73 -2.08
DAX 9557.16 -0.77
FTSE 100 6138.69 1.95
NIKKEI 14952.02 -4.15
HANG SENG 20259.13 0.44
SHANGHAI COM. 2854.29 -1.07
NSE DAILY TOP GAINERS
SCRIPT CLOSE CHANGE (%)
M&M LTD 1388.90 1.03
BAJAJAUTO 2678.80 1.01
BHARTIINFRATEL 324.75 0.85
ASIAN PAINTS 989.55 0.55
GAIL LTD 377.15 0.43
NSE DAILY TOP LOSERS
SCRIPT CLOSE CHANGE (%)
TATA MOTORS 449.40 -7.90
TATAMOTORDVR 298.25 -6.64
TATA STEEL 312.65 -6.38
HINDALCO IND. 117.30 -5.33
TECH MAHINDRA 507.05 -4.57
INDIAN MARKET WEEKLY OUTLOOK
INDIAN INDICES WEEKLY
INDICES CLOSE CHANGE (%)
NIFTY 8088.60 -0.999
SENSEX 30 26397.71 -0.86
NIFTY 500 6775.55 -0.98
NIFTY BANK 17426.05 -1.53
NIFTY IT 11203.15 -0.78
NIFTY MIDCAP 13289.35 -0.52
NIFTY SMALL CAP 5459.40 -1.92
INDIAN SECTORIAL INDICES WEEKLY
INDICES CLOSE CHANGE (%)
NIFTY PHARMA 10747.80 0.89
NIFTY AUTO 8631.65 -0.50
NIFTY METAL 2086.55 -2.10
NIFTY FMCG 20789.95 -1.21
NIFTY ENERGY 8428.30 -1.44
NIFTY INFRA 2720.15 -2.32
NIFTY FIN. SER. 7090.15 -1.29
NIFTY SER. SEC.. 10461.70 -0.96
NIFTY MEDIA 2542.95 -1.22
NIFTY REALTY 184.95 -3.65
COMMODITY AND CURRECY WEEKLY
INDICES CLOSE CHANGE (%)
GOLD COMEX 1322.40 2.13
GOLD INDIAN 31385.00 2.56
SILVER COMEX 17.839 2.46
SILVER INDIAN 42430.00 2.58
WTI CRUDE NY. 47.64 -0.71
CRUDE INDIAN 3266.00 2.38
USD-INR 67.9800 1.20
EUR-INR 75.2675 -0.57
GBP-INR 93.1775 -2.90
JPY-INR 66.4275 3.12
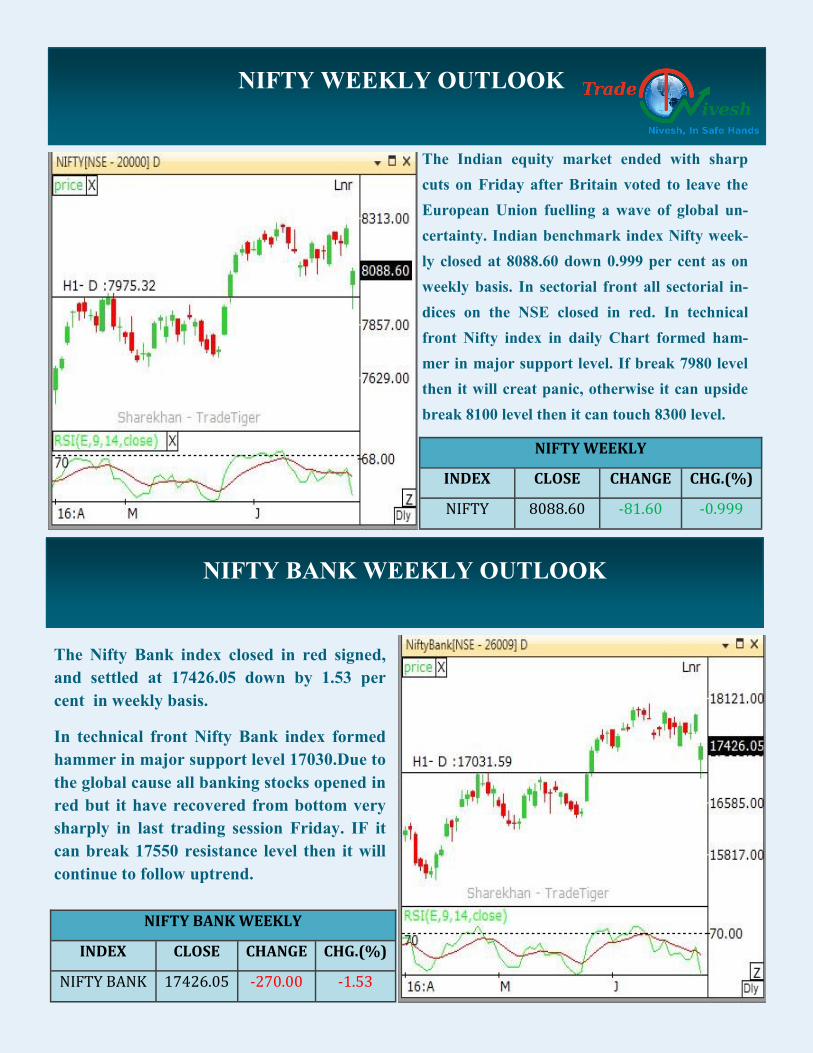
NIFTY WEEKLY OUTLOOK
The Indian equity market ended with sharp
cuts on Friday after Britain voted to leave the
European Union fuelling a wave of global un-
certainty. Indian benchmark index Nifty week-
ly closed at 8088.60 down 0.999 per cent as on
weekly basis. In sectorial front all sectorial in-
dices on the NSE closed in red. In technical
front Nifty index in daily Chart formed ham-
mer in major support level. If break 7980 level
then it will creat panic, otherwise it can upside
break 8100 level then it can touch 8300 level.
NIFTY WEEKLY
INDEX CLOSE CHANGE CHG.(%)
NIFTY 8088.60 -81.60 -0.999
The Nifty Bank index closed in red signed,
and settled at 17426.05 down by 1.53 per
cent in weekly basis.
In technical front Nifty Bank index formed
hammer in major support level 17030.Due to
the global cause all banking stocks opened in
red but it have recovered from bottom very
sharply in last trading session Friday. IF it
can break 17550 resistance level then it will
continue to follow uptrend.
NIFTY BANK WEEKLY
INDEX CLOSE CHANGE CHG.(%)
NIFTY BANK 17426.05 -270.00 -1.53
NIFTY BANK WEEKLY OUTLOOK
WEEKLY STOCK CASH RECOMMENDATION
WEEKLY STOCK RECOMMENDATION
WEEKLY STOCK FUTURE RECOMMENDATION
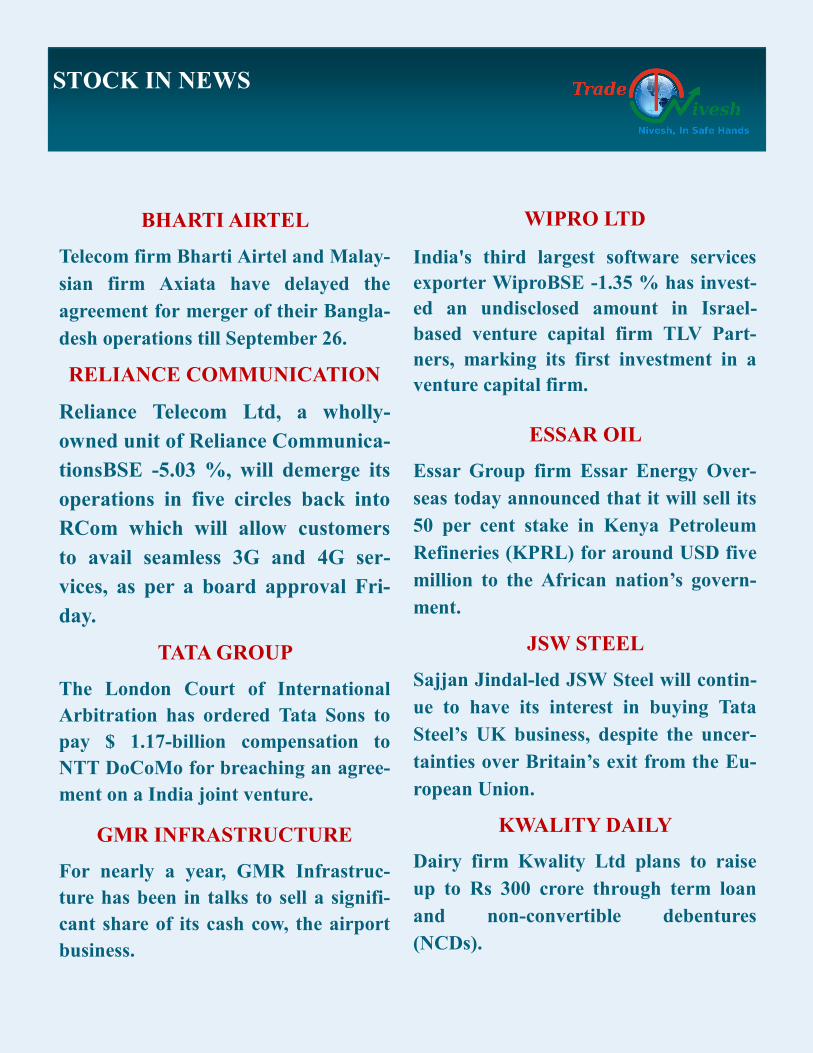
DRREDDY LAB. LTD. Has formed
bullish pattern in resistance level. It
can break the 3180 level then it can
touch the 3218 and 3250 level.
Buy DRREDDY LAB. LTD. above
Rs.3180 and the first target of Rs.3218
and second target of Rs.3250 with
maintain stop loss of Rs.3130.
DRREDDY LAB. LTD.
ENTRY TARGET STOPLOSS
3180 3218-3250 3130
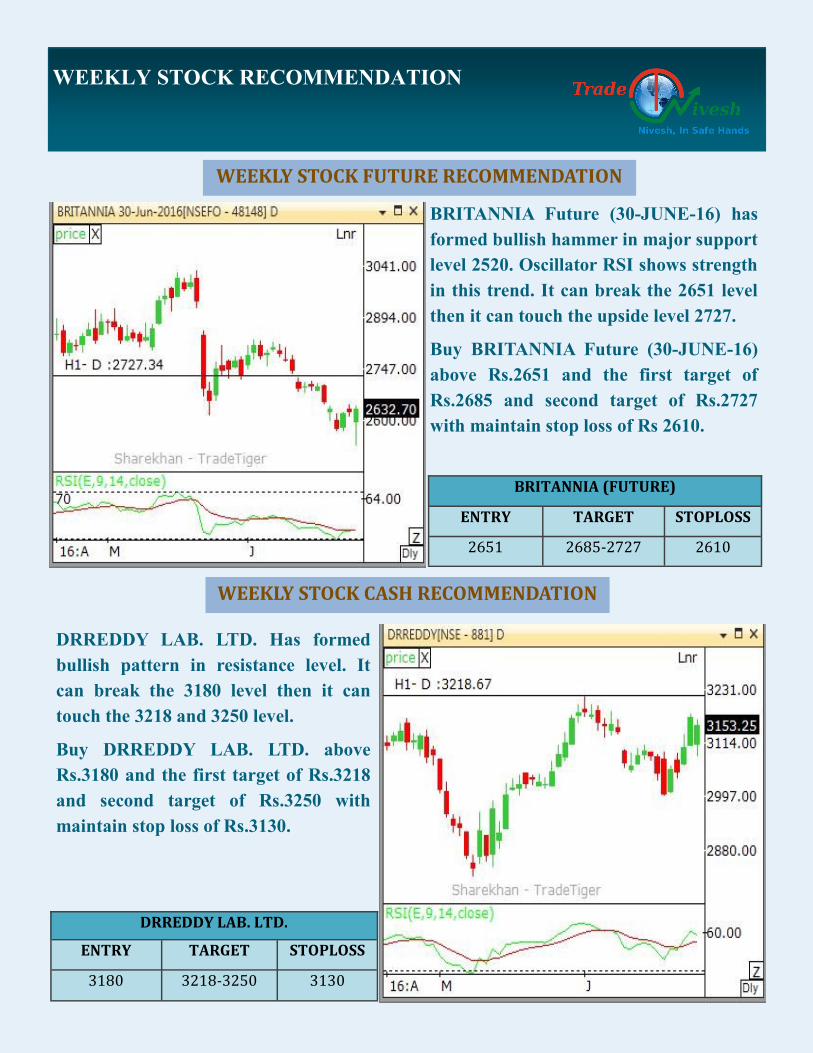
BRITANNIA Future (30-JUNE-16) has
formed bullish hammer in major support
level 2520. Oscillator RSI shows strength
in this trend. It can break the 2651 level
then it can touch the upside level 2727.
Buy BRITANNIA Future (30-JUNE-16)
above Rs.2651 and the first target of
Rs.2685 and second target of Rs.2727
with maintain stop loss of Rs 2610.
BRITANNIA (FUTURE)
ENTRY TARGET STOPLOSS
2651 2685-2727 2610
STOCK IN NEWS
BHARTI AIRTEL
Telecom firm Bharti Airtel and Malay-
sian firm Axiata have delayed the
agreement for merger of their Bangla-
desh operations till September 26.
RELIANCE COMMUNICATION
Reliance Telecom Ltd, a wholly-
owned unit of Reliance Communica-
tionsBSE -5.03 %, will demerge its
operations in five circles back into
RCom which will allow customers
to avail seamless 3G and 4G ser-
vices, as per a board approval Fri-
day.
TATA GROUP
The London Court of International
Arbitration has ordered Tata Sons to
pay $ 1.17-billion compensation to
NTT DoCoMo for breaching an agree-
ment on a India joint venture.
GMR INFRASTRUCTURE
For nearly a year, GMR Infrastruc-
ture has been in talks to sell a signifi-
cant share of its cash cow, the airport
business.
WIPRO LTD
India's third largest software services
exporter WiproBSE -1.35 % has invest-
ed an undisclosed amount in Israel-
based venture capital firm TLV Part-
ners, marking its first investment in a
venture capital firm.
ESSAR OIL
Essar Group firm Essar Energy Over-
seas today announced that it will sell its
50 per cent stake in Kenya Petroleum
Refineries (KPRL) for around USD five
million to the African nation’s govern-
ment.
JSW STEEL
Sajjan Jindal-led JSW Steel will contin-
ue to have its interest in buying Tata
Steel’s UK business, despite the uncer-
tainties over Britain’s exit from the Eu-
ropean Union.
KWALITY DAILY
Dairy firm Kwality Ltd plans to raise
up to Rs 300 crore through term loan
and non-convertible debentures
(NCDs).
NIFTY STOCKS WEEKLY PIVOT TABLE
Last week price Resistance Zone Pivot
Point
Support Zone
Stock Name Week
Close Res-3 Res-2 Res-1 Sup-1 Sup-2 Sup-3
NIFTY 8088.6 8632.3 8459 8273.8 8100.4 7915.2 7741.9 7556.7
BANKNIFTY 17426.1 18868.1 18387.8 17906.9 17426.6 16945.8 16465.5 15984.6
SENSEX 26397.7 28151.7 27606.3 27002 26456.7 25852.4 25307 24702.7
ACC 1569.3 1649.7 1614.7 1592 1557 1534.3 1499.3 1476.6
AMBUJACEM 248.2 271.1 261 254.6 244.5 238.1 228 221.6
ASIANPAINT 990 1036.9 1016.9 1003.5 983.5 970.1 950.1 936.7
AXISBANK 509 562.3 545.1 527.1 509.9 491.9 474.7 456.7
BAJAJ-AUTO 2662.5 2849.6 2767.2 2714.8 2632.4 2580.1 2497.7 2445.3
BANKBARODA 146.5 165.4 159.4 152.9 146.9 140.4 134.4 127.9
BHARTIARTL 354.5 383.1 375 364.8 356.7 346.5 338.4 328.2
BHEL 118.4 135.5 130.2 124.3 119 113.1 107.8 101.9
BPCL 1013.7 1067.9 1049.2 1031.5 1012.8 995 976.3 958.6
CAIRN 132.7 148.3 144 138.4 134.1 128.5 124.2 118.6
CIPLA 476.5 523 507 491.7 475.7 460.4 444.4 429.1
COALINDIA 311.3 331.6 325.3 318.3 311.9 304.9 298.6 291.6
DRREDDY 3142.1 3385 3282 3212 3109 3039.1 2936.1 2866.1
GAIL 378 423.4 407.7 392.9 377.2 362.4 346.7 331.9
GRASIM 4276 4430.7 4385.4 4330.7 4285.3 4230.6 4185.3 4130.6
HCLTECH 742 832.7 807.1 774.5 748.9 716.4 690.8 658.2
HDFC 1225 1297.8 1273.6 1249.3 1225.2 1200.9 1176.7 1152.4
HDFCBANK 1161 1231.1 1211.5 1186.2 1166.6 1141.4 1121.8 1096.5
HEROMOTOCO 3052 3248.6 3170.3 3111.2 3032.9 2973.7 2895.4 2836.3
HINDALCO 116.8 136.3 130.5 123.6 117.8 111 105.2 98.3
HINDUNILVR 857.8 913 897.7 877.7 862.4 842.5 827.2 807.2
ICICIBANK 231.4 263.4 252.9 242.1 231.6 220.9 210.4 199.6
IDEA 99.8 110.4 107 103.4 100 96.4 93 89.4
IDFC 47.8 55.3 53.4 50.6 48.6 45.8 43.9 41.1
INDUSINDBK 1090.6 1187.7 1150.4 1120.5 1083.1 1053.2 1015.9 986
INFY 1191.2 1272.2 1243.5 1217.4 1188.7 1162.5 1133.8 1107.7
ITC 353.4 371.1 366.3 359.8 355 348.5 343.7 337.2
KOTAKBANK 732.2 801.8 779.3 755.8 733.3 709.7 687.2 663.7
LT 1430.9 1600.7 1555 1492.9 1447.2 1385.1 1339.4 1277.3
LUPIN 1464 1554 1524.4 1494.2 1464.6 1434.4 1404.8 1374.6
M&M 1383 1498.3 1448.1 1415.5 1365.3 1332.7 1282.5 1249.9
MARUTI 4084 4534.7 4357.6 4220.8 4043.7 3906.9 3729.8 3593
NIFTY STOCKS WEEKLY PIVOT TABLE
SCRIP RECOM ENTRY TGT-1 TGT-2 STOPLOSS STATUS
TITAN (FUTURE) BUY 378.50 384.50 391 370 BOTH TGT ACHIEVED
AMARAJABAT (FUTURE) BUY 859 867 879 845 BOTH TGT ACHIEVED
GODREJIND (FUTURE) BUY 363 370 378 354 1ST TGT ACHIEVED
ITC LTD (FUTURE) BUY 340 348 359 330 BOTH TGT ACHIEVED
FEDERALBANK (CASH) BUY 52 55 59.25 47.90 OPEN POSITION
DRREDDY (CASH) BUY 2950 2990 3030 2900 BOTH TGT ACHIEVED
FEDERALBANK (FUTURE) BUY 49 52.20 55 45 1ST TGT ACHIEVED
GLENMARK (FUTURE) BUY 844 856 872 828 SL TRIGGERED
AMARAJA BATTERY(FUTURE) BUY 964 978 993 957 SL TRIGGERED
IBULHSGFIN (FUTURE) BUY 677.50 684.50 693.00 665.00 BOTH TGT ACHIEVED
UNION BANK (CASH) BUY 134.50 138.50 142.50 129.50 SL TRIGGERED
ORIENT BANK (FUTURE) BUY 93.50 97.00 102.00 88.50 BOTH TGT ACHIEVED
OUR MONTHLY RECOMMENDATIONS
Last week price Resistance Zone Pivot
Point
Support Zone
Stock Name Week
Close Res-3 Res-2 Res-1 Sup-1 Sup-2 Sup-3
NMDC 90.5 97.2 95.1 92.8 90.7 88.3 86.2 83.9
NTPC 148.5 166.3 160.6 154.6 148.9 142.9 137.2 131.2
ONGC 209.4 229.5 224.5 217 212 204.4 199.4 191.9
PNB 102.6 117.4 110.2 106.4 99.2 95.4 88.2 84.4
POWERGRID 155.2 165.8 161.8 158.5 154.6 151.3 147.3 144
RELIANCE 948.6 1044.8 1019.5 984 958.7 923.3 898 862.5
SBIN 211 234 226 218.5 210.5 203 195 187.5
SUNPHARMA 753.6 802.2 783.6 768.6 750 735 716.4 701.4
TATAMOTORS 447.7 553.3 521.6 484.7 453 416 384.3 347.4
TATAPOWER 72.7 82.6 79.2 76 72.6 69.4 66 62.8
TATASTEEL 312 375.7 356.7 334.3 315.3 292.9 273.9 251.5
TCS 2568 2822.6 2750.2 2659.1 2586.6 2495.5 2423.1 2332
TECHM 508 595.4 572.1 540.1 516.8 484.8 461.5 429.5
ULTRACEMCO 3300 3558.3 3466.7 3383.3 3291.7 3208.3 3116.7 3033.3
VEDANTA 117.2 145.7 137.7 127.5 119.5 109.3 101.3 91.1
WIPRO 555.8 585.2 575 565.4 555.3 545.7 535.5 525.9
YESBANK 1079 1188.3 1151.7 1115.3 1078.7 1042.3 1005.7 969.3
ZEEL 446 475.2 465 455.5 445.2 435.7 425.5 416
This document is solely for the personal information of the recipient, and must not be singular-
ly used as the basis of any investment decision. Nothing in this document should be construed
as investment or financial advice. Each recipient of this document should make such investiga-
tions as they deem necessary to arrive at an independent evaluation of an investment in the se-
curities of the companies referred to in this document including the merits and risks involved,
and should consult their own advisors to determine the merits and risks of such an investment.
Reports based on technical and derivative analysis center on studying charts of a stock's price
movement, outstanding positions and trading volume. The information in this document has
been printed on the basis of publicly available information, internal data and other reliable
sources believed to be true, but we do not represent that it is accurate or complete and it should
not be relied on as such, as this document is for general guidance only. Trade Nivesh shall not
be in any way responsible for any loss or damage that may arise to any person from any inad-
vertent error in the information contained in this report. Trade Nivesh has not independently
verified all the information contained within this document. Accordingly, we cannot testify, nor
make any representation or warranty, express or implied, to the accuracy, contents or data con-
tained within this document. While Trade Nivesh endeavors to update on a reasonable basis the
information discussed in this material, there may be regulatory, compliance, or other reasons
that prevent us from doing so.
Investment in equity & Commodity market has its own risks. We Trade Nivesh shall not be lia-
ble or responsible for any loss or damage that may arise from the use of this information.
DISCLAIMER