Trade Logistics and the 2030 Agenda for Sustainable...
22
Multi-year Expert Meeting on Transport, Trade Logistics and Trade Facilitation: Trade Logistics and the 2030 Agenda for Sustainable Development 23-24 October 2017 by Mr. Michael Dooms Professor, Solvay Business School Vrije University Brussels 24 October 2017 This expert paper is reproduced by the UNCTAD secretariat in the form and language in which it has been received. The views expressed are those of the author and do not necessarily reflect the view of the United Nations.
Transcript of Trade Logistics and the 2030 Agenda for Sustainable...
Multi-year Expert Meeting on Transport, Trade Logistics and Trade
Facilitation:
Trade Logistics and the 2030 Agenda for
Sustainable Development
23-24 October 2017
by
Mr. Michael Dooms Professor, Solvay Business School
Vrije University Brussels
24 October 2017
This expert paper is reproduced by the UNCTAD secretariat in the form and language in which it has been received. The views expressed are those of the author and do not necessarily reflect the view of the United Nations.
Monday, 30 October 2017
1
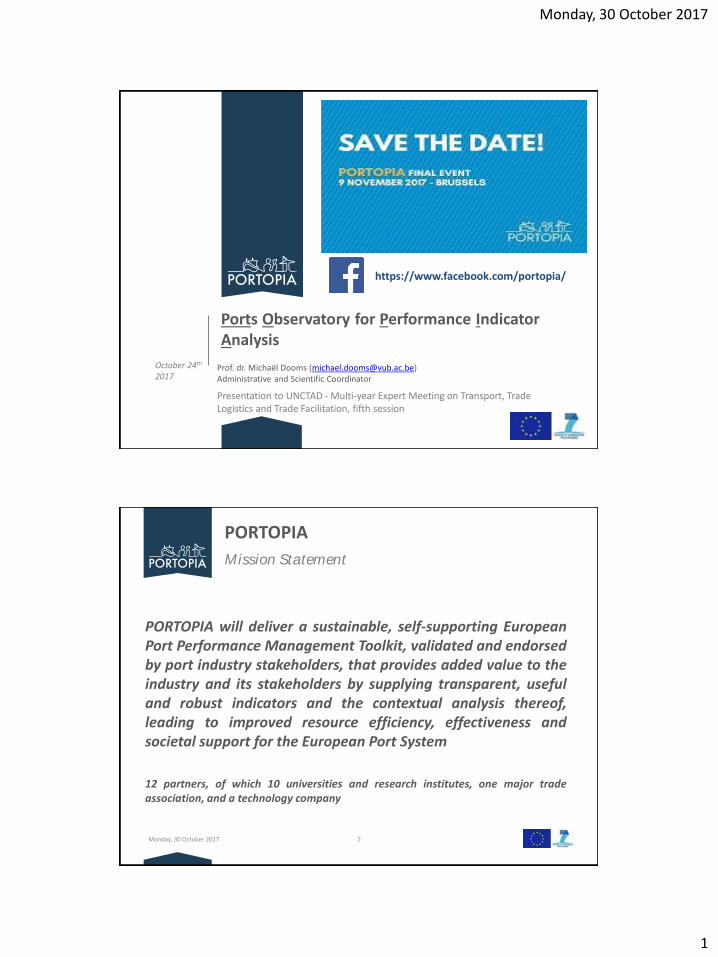
Ports Observatory for Performance Indicator Analysis
Prof. dr. Michaël Dooms ([email protected]) Administrative and Scientific Coordinator
Presentation to UNCTAD - Multi-year Expert Meeting on Transport, Trade Logistics and Trade Facilitation, fifth session
October 24th
2017
https://www.facebook.com/portopia/
Monday, 30 October 2017 2
PORTOPIA
PORTOPIA will deliver a sustainable, self-supporting EuropeanPort Performance Management Toolkit, validated and endorsedby port industry stakeholders, that provides added value to theindustry and its stakeholders by supplying transparent, usefuland robust indicators and the contextual analysis thereof,leading to improved resource efficiency, effectiveness andsocietal support for the European Port System
12 partners, of which 10 universities and research institutes, one major tradeassociation, and a technology company
Mission Statement
Monday, 30 October 2017
2
Monday, 30 October 2017 3
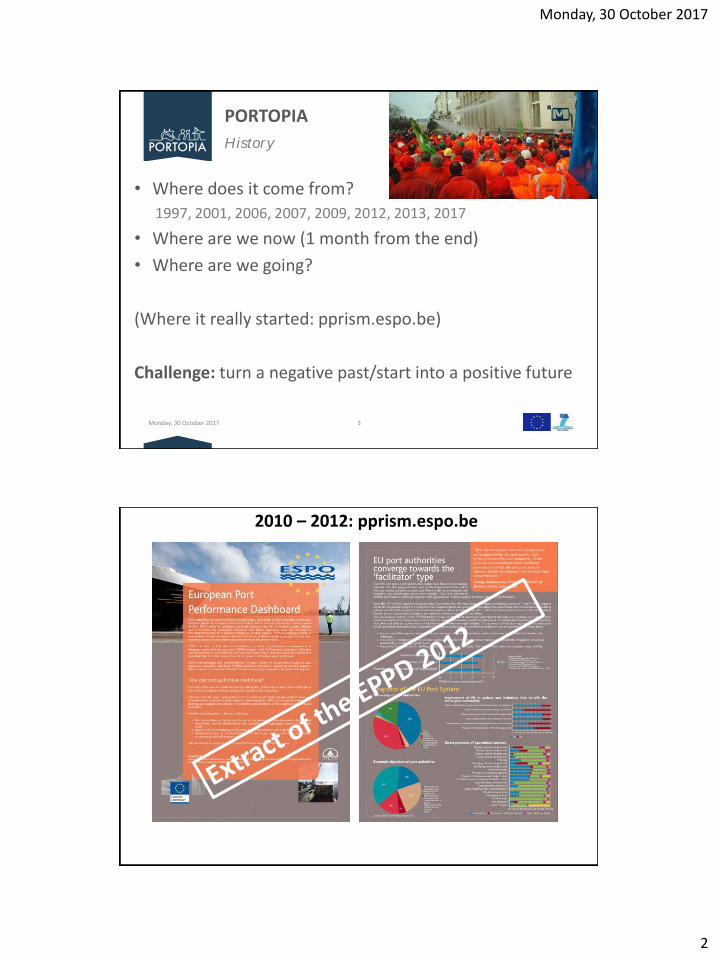
PORTOPIA
• Where does it come from?
1997, 2001, 2006, 2007, 2009, 2012, 2013, 2017
• Where are we now (1 month from the end)
• Where are we going?
(Where it really started: pprism.espo.be)
Challenge: turn a negative past/start into a positive future
History
Source: PPRISM project partners, 2012 (only first 2 pages presented here)
2010 – 2012: pprism.espo.be
Monday, 30 October 2017
3
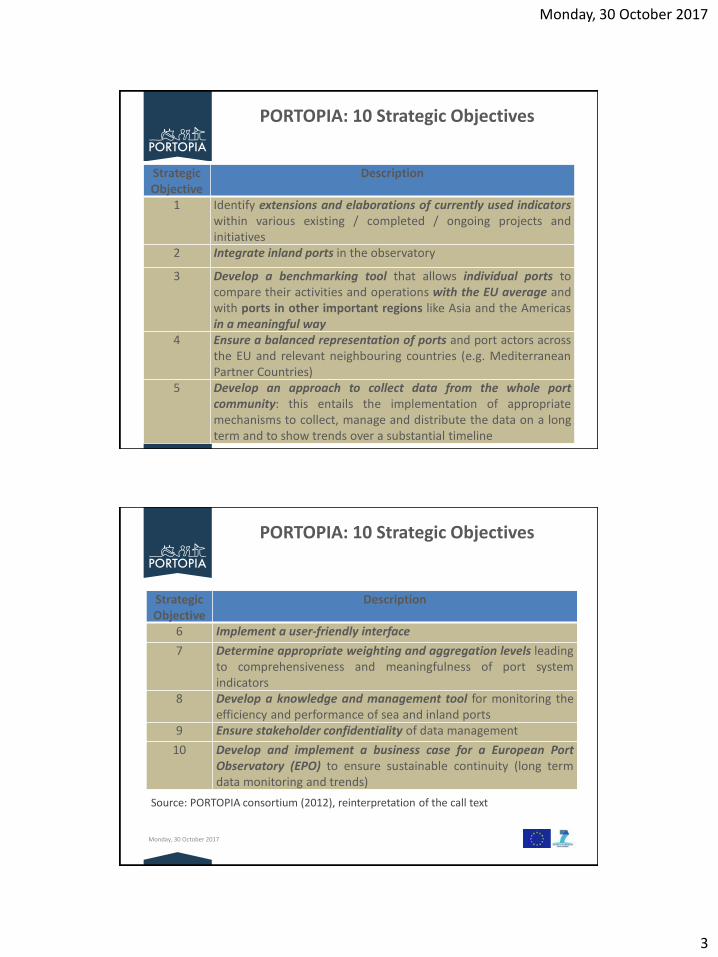
PORTOPIA: 10 Strategic Objectives
Strategic Objective
Description
1 Identify extensions and elaborations of currently used indicatorswithin various existing / completed / ongoing projects andinitiatives
2 Integrate inland ports in the observatory
3 Develop a benchmarking tool that allows individual ports tocompare their activities and operations with the EU average andwith ports in other important regions like Asia and the Americasin a meaningful way
4 Ensure a balanced representation of ports and port actors acrossthe EU and relevant neighbouring countries (e.g. MediterraneanPartner Countries)
5 Develop an approach to collect data from the whole portcommunity: this entails the implementation of appropriatemechanisms to collect, manage and distribute the data on a longterm and to show trends over a substantial timeline
PORTOPIA: 10 Strategic Objectives
Strategic Objective
Description
6 Implement a user-friendly interface
7 Determine appropriate weighting and aggregation levels leadingto comprehensiveness and meaningfulness of port systemindicators
8 Develop a knowledge and management tool for monitoring theefficiency and performance of sea and inland ports
9 Ensure stakeholder confidentiality of data management
10 Develop and implement a business case for a European PortObservatory (EPO) to ensure sustainable continuity (long termdata monitoring and trends)
Source: PORTOPIA consortium (2012), reinterpretation of the call text
Monday, 30 October 2017
Monday, 30 October 2017
4
Monday, 30 October 2017 7
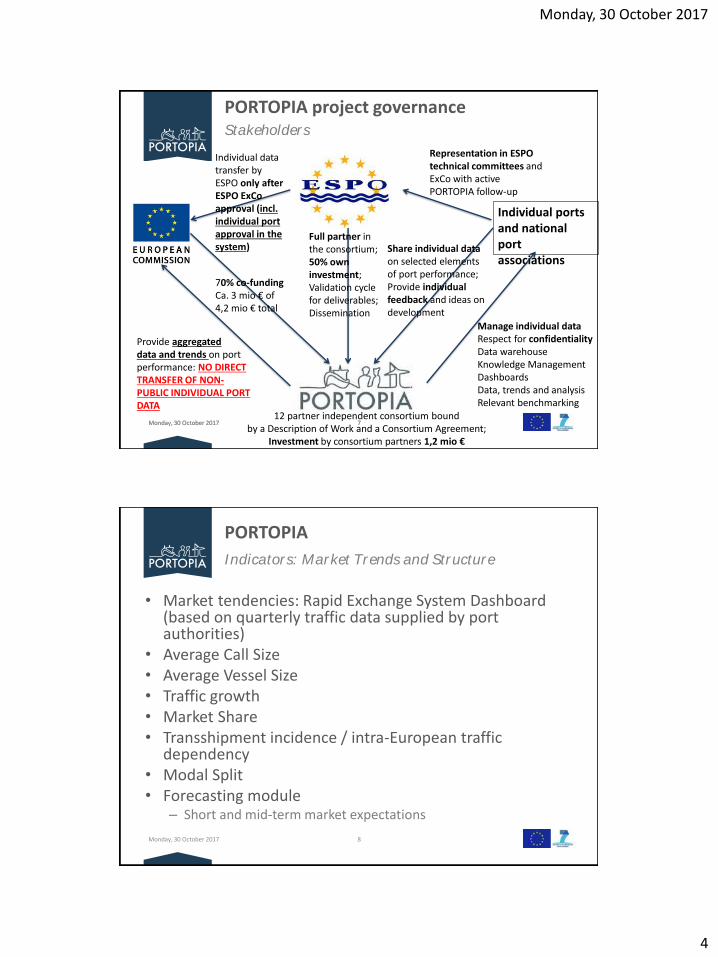
PORTOPIA project governanceStakeholders
Monday, 30 October 2017 7
Individual portsand national portassociations
Provide aggregated data and trends on port performance: NO DIRECT TRANSFER OF NON-PUBLIC INDIVIDUAL PORT DATA
Manage individual dataRespect for confidentialityData warehouseKnowledge ManagementDashboardsData, trends and analysisRelevant benchmarking
Share individual data on selected elements of port performance; Provide individual feedback and ideas on development
70% co-fundingCa. 3 mio € of 4,2 mio € total
Full partner in the consortium;50% own investment; Validation cyclefor deliverables;Dissemination
Individual data transfer by ESPO only after ESPO ExCoapproval (incl. individual port approval in the system)
Representation in ESPO technical committees and ExCo with active PORTOPIA follow-up
12 partner independent consortium boundby a Description of Work and a Consortium Agreement;
Investment by consortium partners 1,2 mio €
Monday, 30 October 2017 8
PORTOPIA
• Market tendencies: Rapid Exchange System Dashboard (based on quarterly traffic data supplied by port authorities)
• Average Call Size• Average Vessel Size• Traffic growth • Market Share• Transshipment incidence / intra-European traffic
dependency• Modal Split• Forecasting module
– Short and mid-term market expectations
Indicators: Market Trends and Structure
Monday, 30 October 2017
5
9
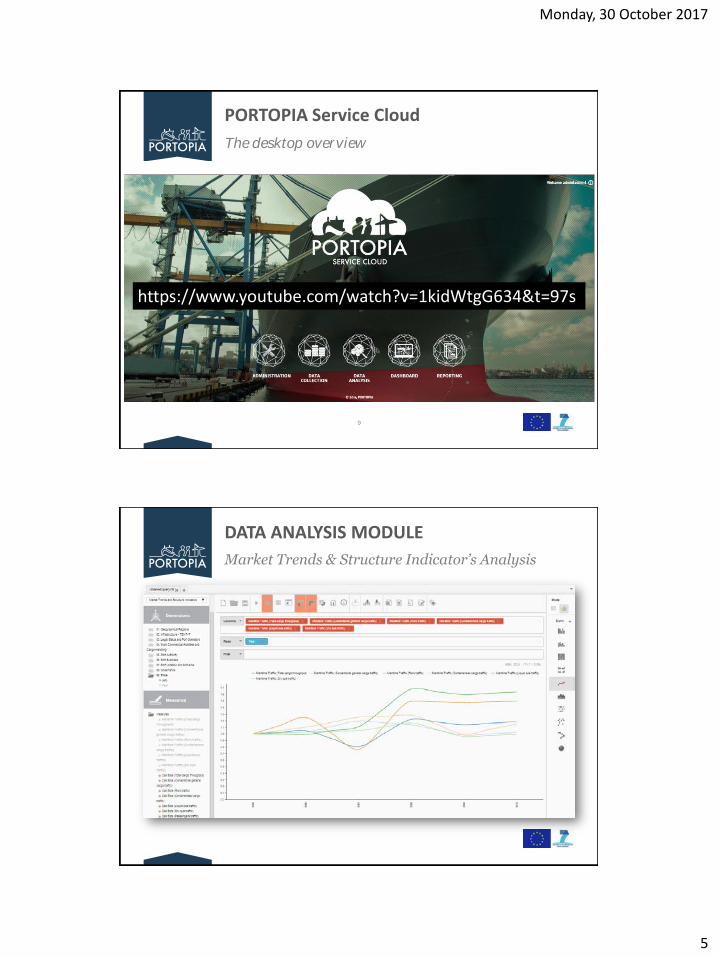
The desktop overview
PORTOPIA Service Cloud
https://www.youtube.com/watch?v=1kidWtgG634&t=97s
DATA ANALYSIS MODULE
Market Trends & Structure Indicator’s Analysis
Monday, 30 October 2017
6
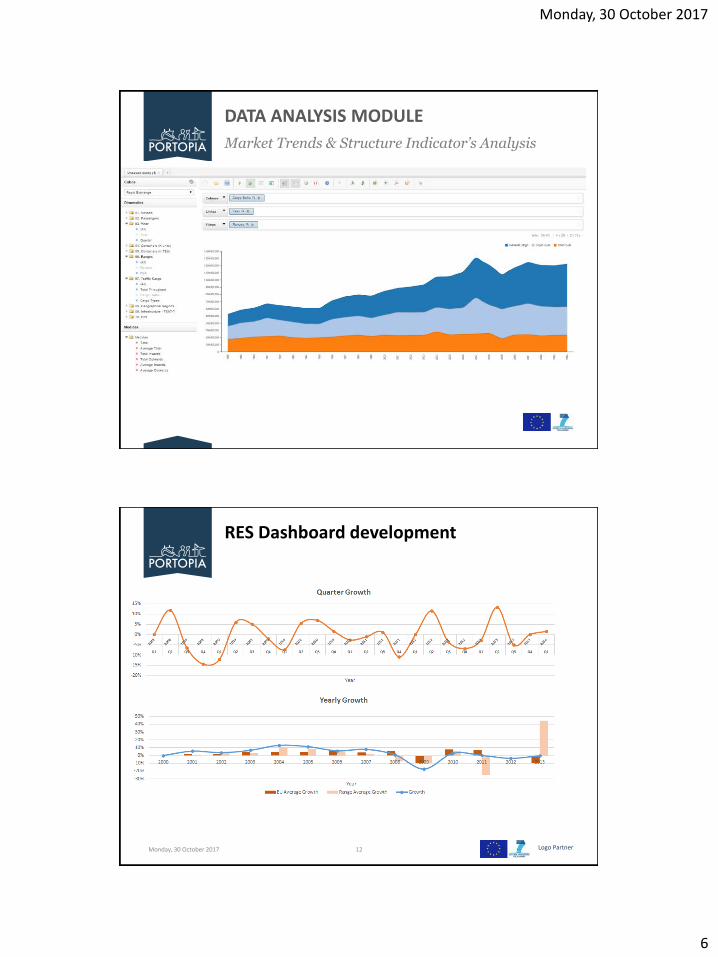
DATA ANALYSIS MODULE
Market Trends & Structure Indicator’s Analysis
Logo PartnerMonday, 30 October 2017 12
RES Dashboard development
Monday, 30 October 2017
7
Logo PartnerMonday, 30 October 2017 13
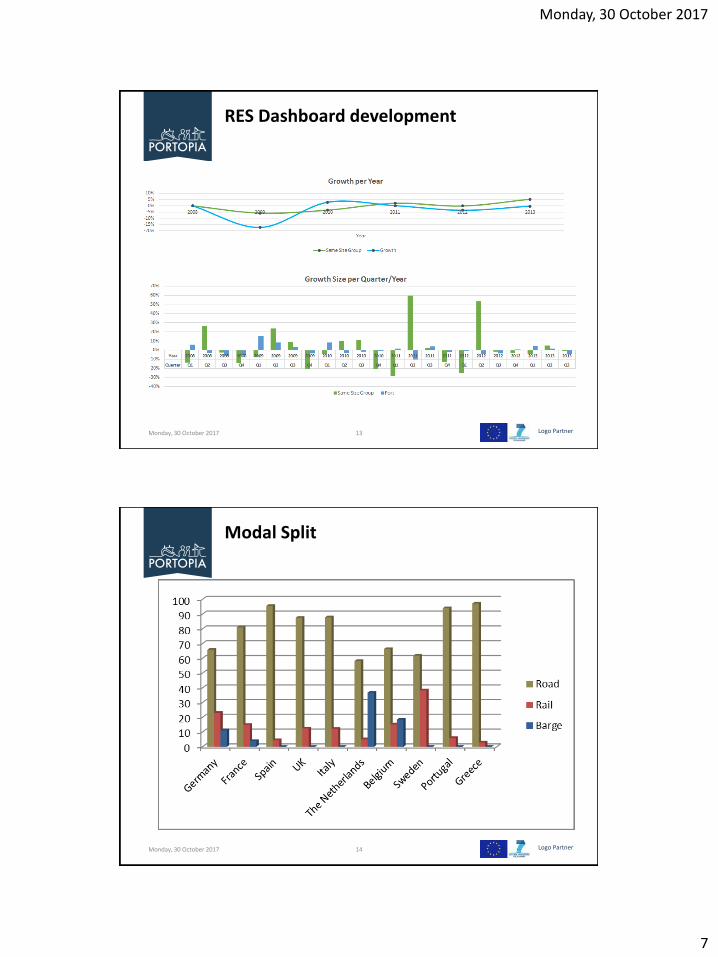
RES Dashboard development
Logo PartnerMonday, 30 October 2017 14
Modal Split
Monday, 30 October 2017
8
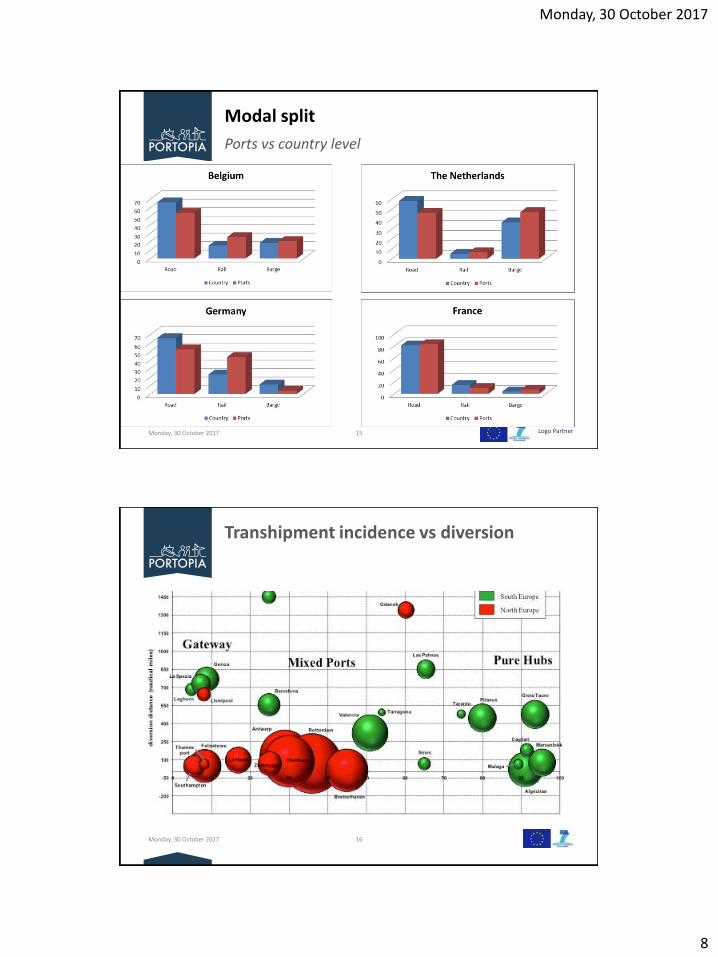
Logo PartnerMonday, 30 October 2017 15
Modal split
Ports vs country level
Monday, 30 October 2017 16
Transhipment incidence vs diversion
Monday, 30 October 2017
9
Monday, 30 October 2017 17
PORTOPIA
• Direct and indirect Employment (in FTE)
• Direct and indirect Gross Added Value (in €)
• Flowback to Treasury (in €)
• Private Investment (in €)
• Other indicators:
– Hrs of Training per FTE
– Gender (% of women)
Indicators: Socio-Economic Indicators
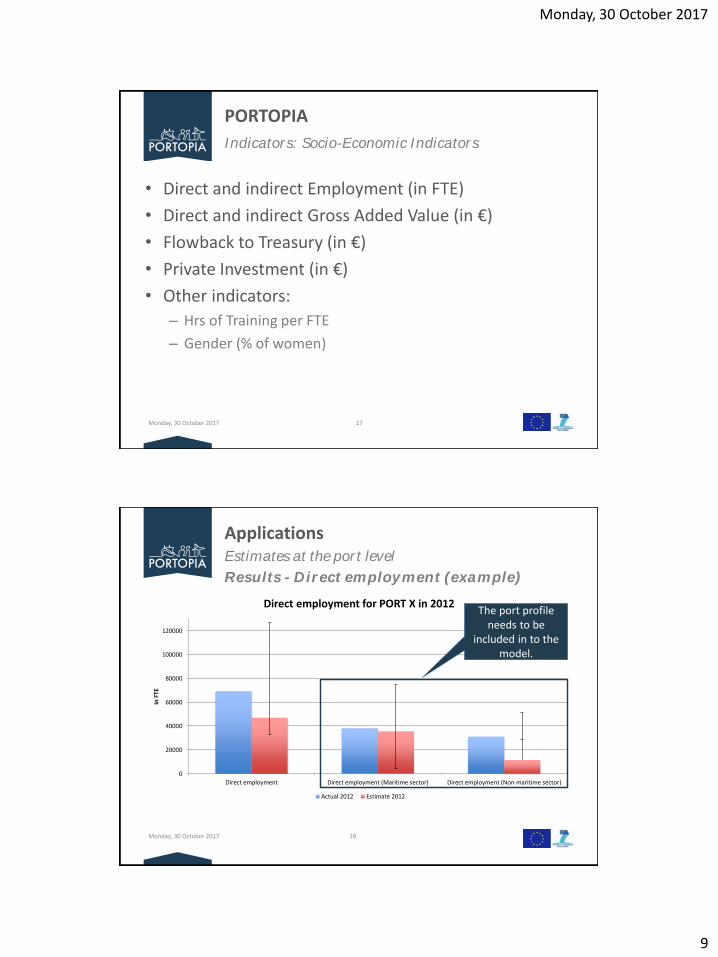
ApplicationsEstimates at the port level
Results - Direct employment (example)
Monday, 30 October 2017 18
0
20000
40000
60000
80000
100000
120000
Direct employment Direct employment (Maritime sector) Direct employment (Non-maritime sector)
in F
TE
Direct employment for PORT X in 2012
Actual 2012 Estimate 2012
The port profile needs to be
included in to the model.
Monday, 30 October 2017
10
Monday, 30 October 2017 19
PORTOPIA
• Dashboards based on ECOPORTS self-diagnosis method (environmental management index)
• CO2 footprint
• Water quality
• Waste production
• Nautical accidents
• Port security incidents
• Fatal accidents, work-related accidents, lost workdays
• Investments in protection
Indicators: Environment, Security and Health & Occupational Safety
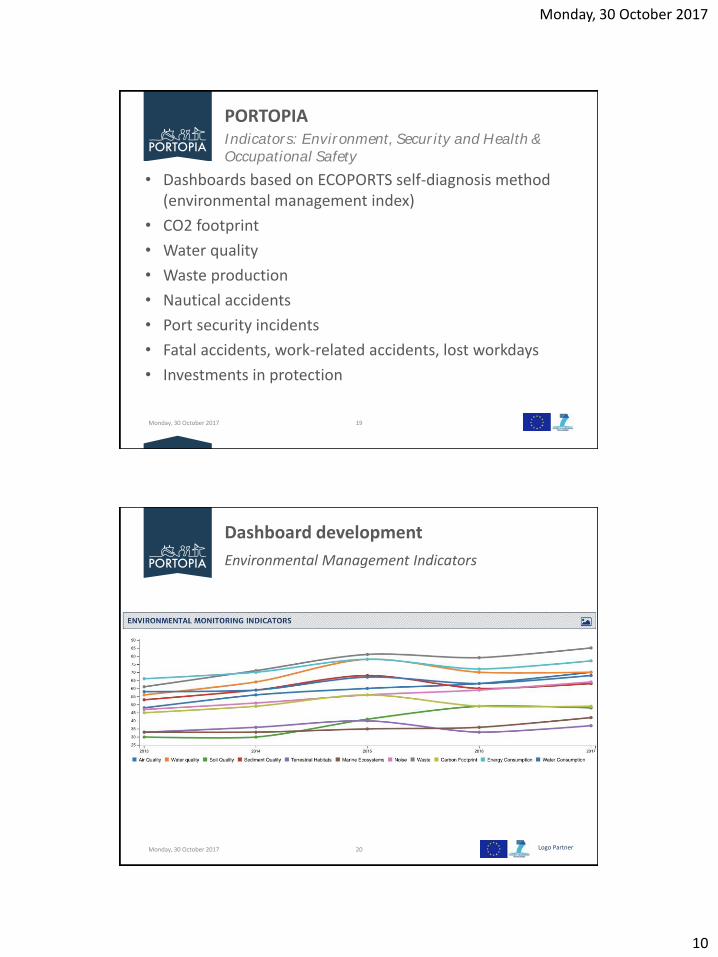
Logo PartnerMonday, 30 October 2017 20
Dashboard development
Environmental Management Indicators
Monday, 30 October 2017
11
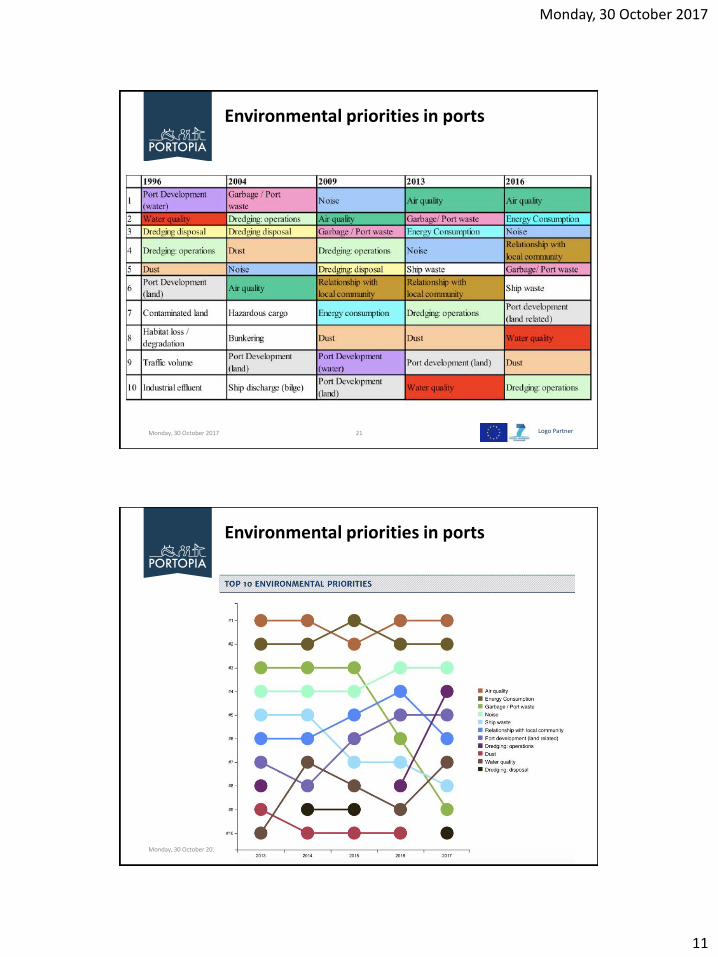
Logo PartnerMonday, 30 October 2017 21
Environmental priorities in ports
Logo PartnerMonday, 30 October 2017 22
Environmental priorities in ports
Monday, 30 October 2017
12
Logo PartnerMonday, 30 October 2017 23
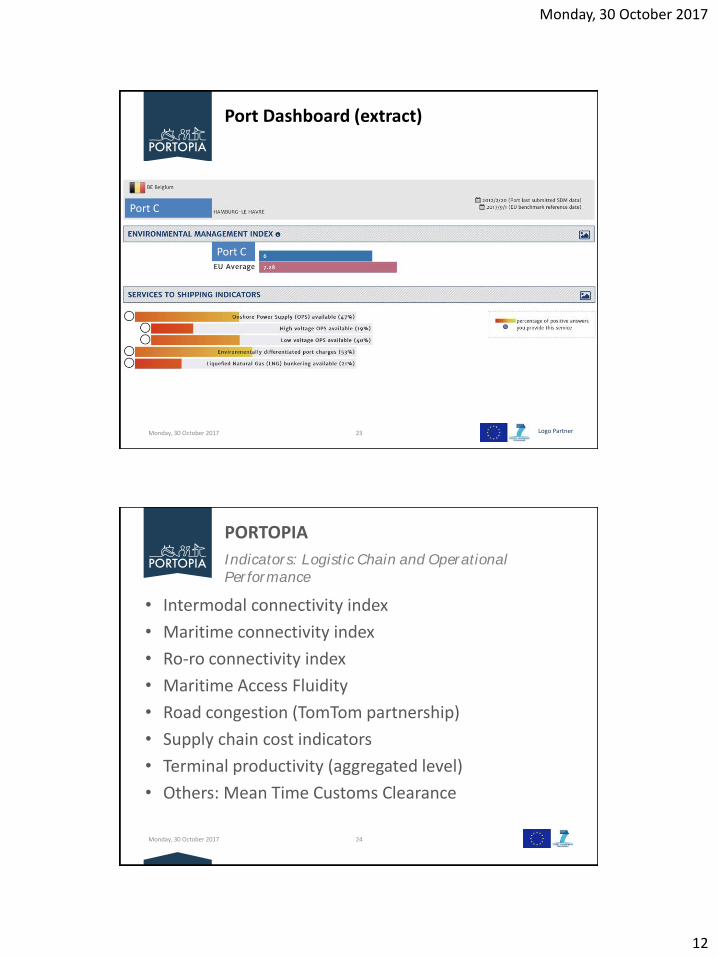
Port Dashboard (extract)
Port C
Port C
Monday, 30 October 2017 24
PORTOPIA
• Intermodal connectivity index
• Maritime connectivity index
• Ro-ro connectivity index
• Maritime Access Fluidity
• Road congestion (TomTom partnership)
• Supply chain cost indicators
• Terminal productivity (aggregated level)
• Others: Mean Time Customs Clearance
Indicators: Logistic Chain and Operational Performance
Monday, 30 October 2017
13
Monday, 30 October 2017 25
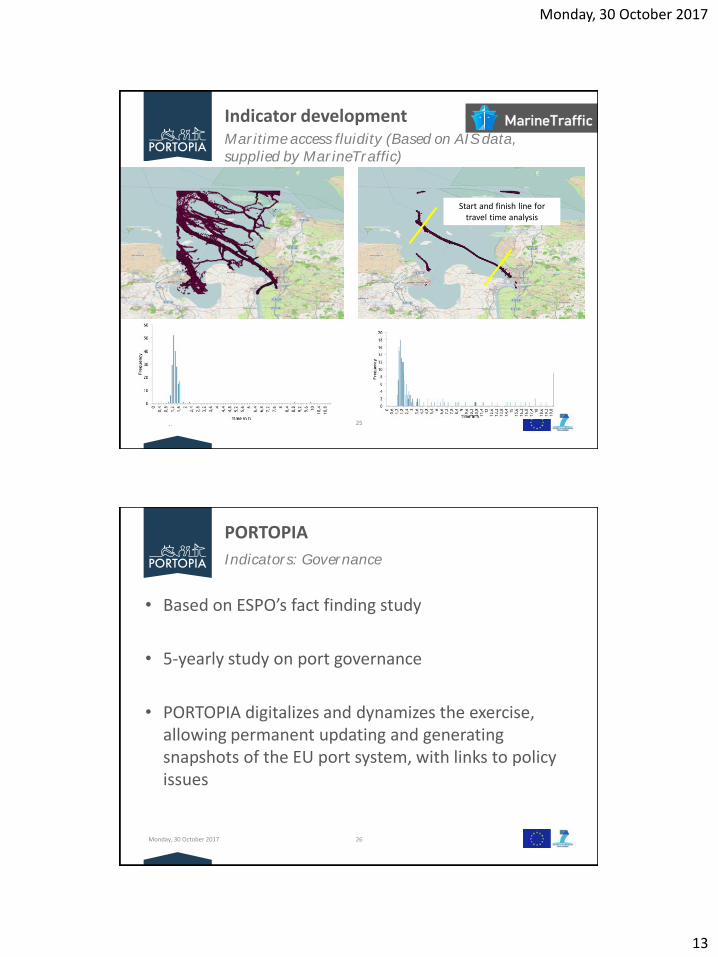
Indicator developmentMaritime access fluidity (Based on AIS data, supplied by MarineTraffic)
Start and finish line fortravel time analysis
Monday, 30 October 2017 26
PORTOPIA
• Based on ESPO’s fact finding study
• 5-yearly study on port governance
• PORTOPIA digitalizes and dynamizes the exercise, allowing permanent updating and generating snapshots of the EU port system, with links to policy issues
Indicators: Governance
Monday, 30 October 2017
14
Monday, 30 October 2017 27
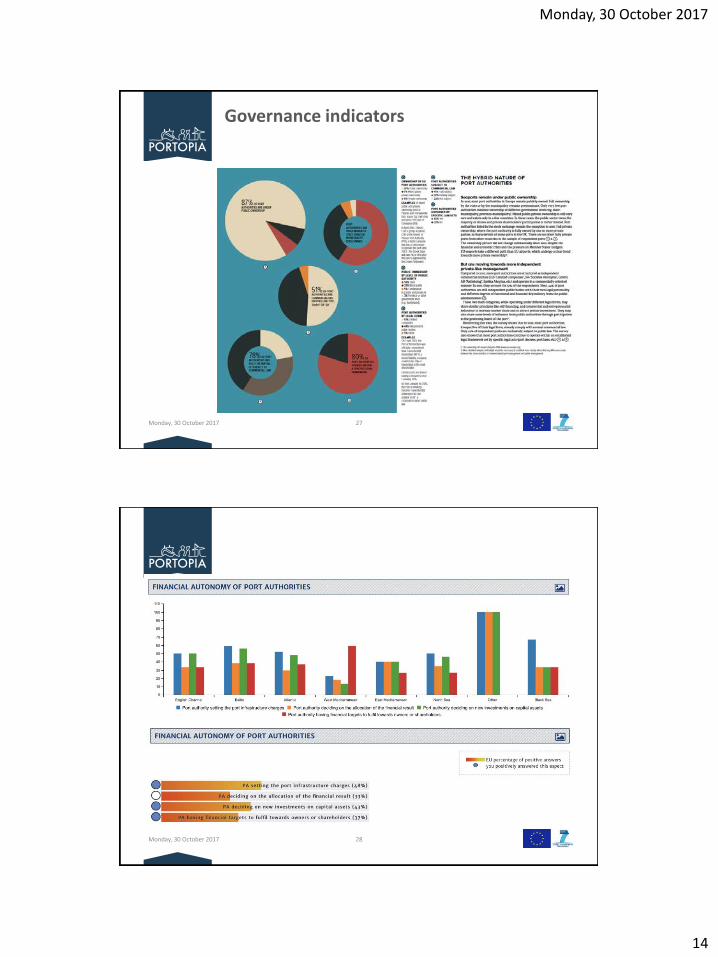
Governance indicators
Monday, 30 October 2017 28
Monday, 30 October 2017
15
Monday, 30 October 2017 29
Monday, 30 October 2017 30
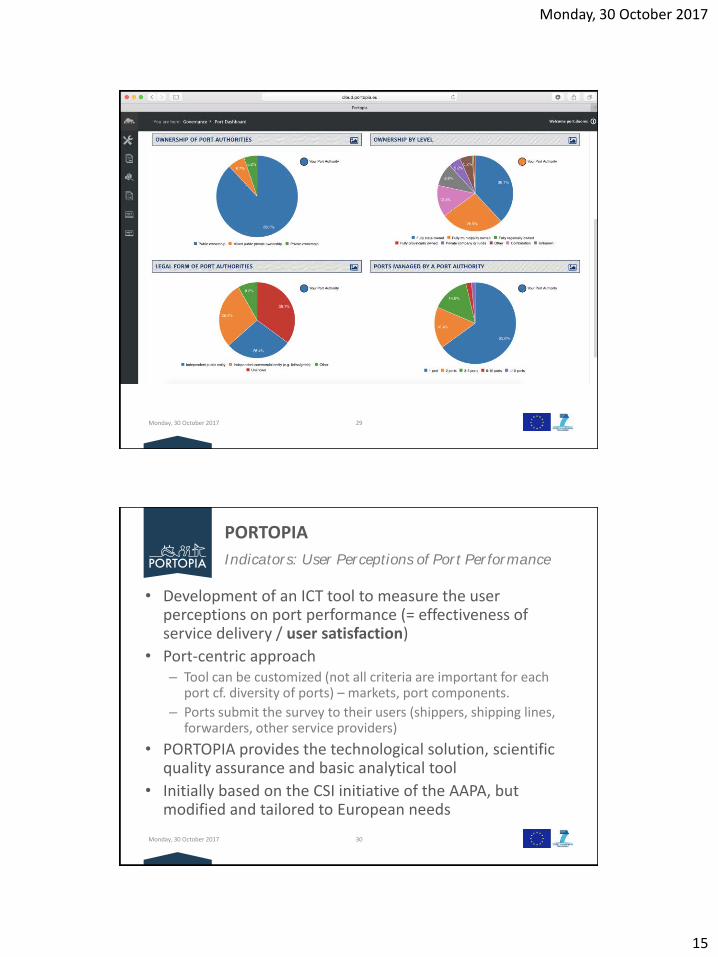
PORTOPIA
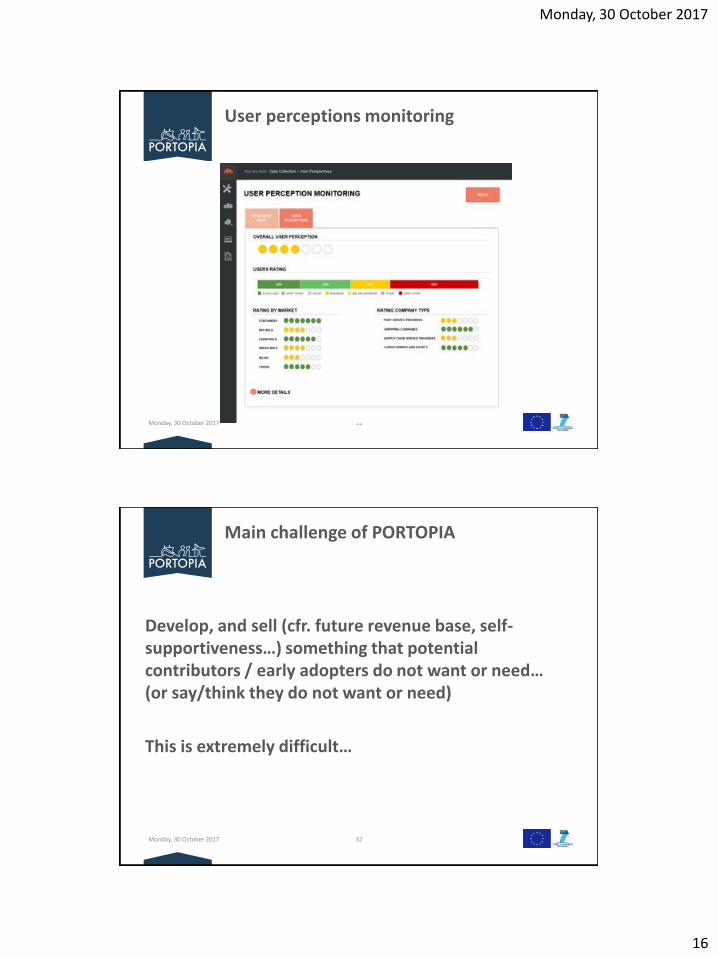
• Development of an ICT tool to measure the user perceptions on port performance (= effectiveness of service delivery / user satisfaction)
• Port-centric approach– Tool can be customized (not all criteria are important for each
port cf. diversity of ports) – markets, port components.
– Ports submit the survey to their users (shippers, shipping lines, forwarders, other service providers)
• PORTOPIA provides the technological solution, scientific quality assurance and basic analytical tool
• Initially based on the CSI initiative of the AAPA, but modified and tailored to European needs
Indicators: User Perceptions of Port Performance
Monday, 30 October 2017
16
Monday, 30 October 2017 31
User perceptions monitoring
Monday, 30 October 2017 32
Main challenge of PORTOPIA
Develop, and sell (cfr. future revenue base, self-supportiveness…) something that potential contributors / early adopters do not want or need… (or say/think they do not want or need)
This is extremely difficult…
Monday, 30 October 2017
17
Monday, 30 October 2017 33
| pag. 34
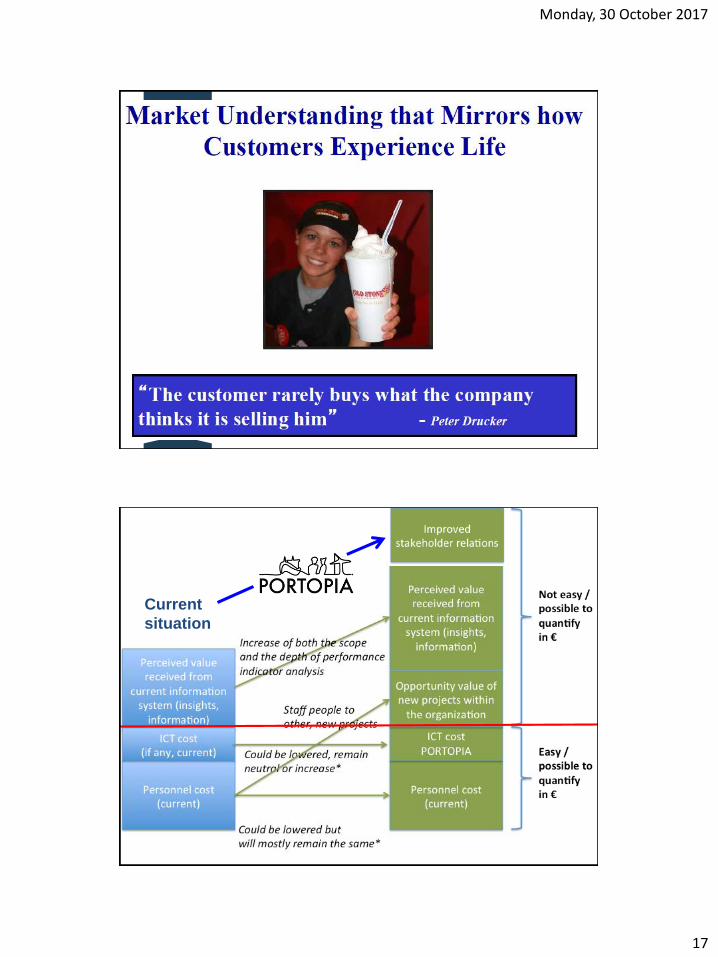
Current
situation
Monday, 30 October 2017
18
Monday, 30 October 2017 35
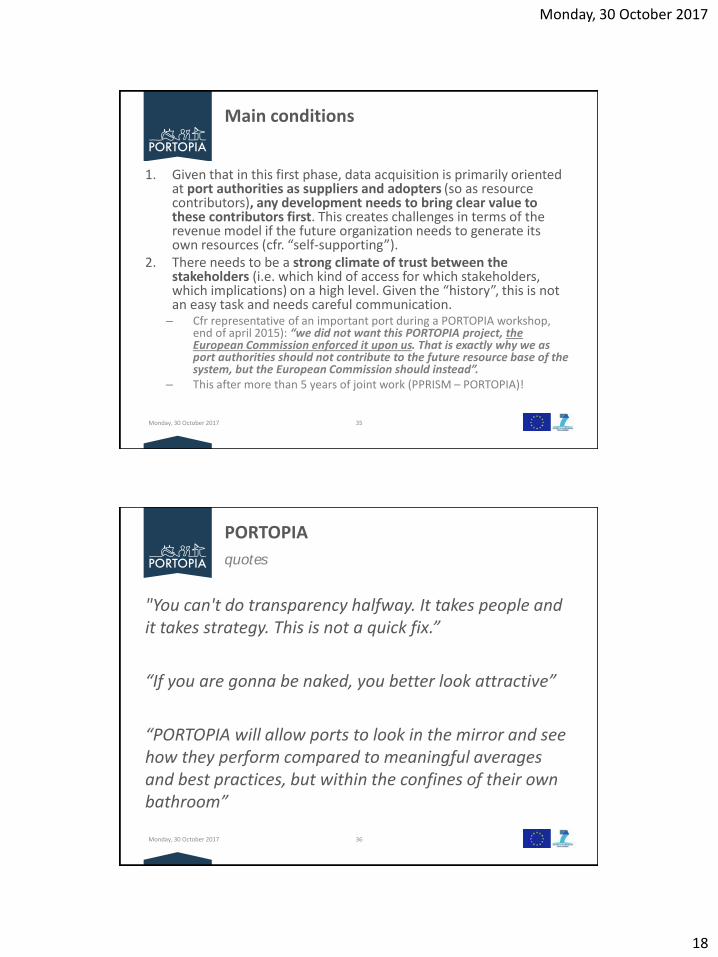
Main conditions
1. Given that in this first phase, data acquisition is primarily oriented at port authorities as suppliers and adopters (so as resource contributors), any development needs to bring clear value to these contributors first. This creates challenges in terms of the revenue model if the future organization needs to generate its own resources (cfr. “self-supporting”).
2. There needs to be a strong climate of trust between the stakeholders (i.e. which kind of access for which stakeholders, which implications) on a high level. Given the “history”, this is not an easy task and needs careful communication.
– Cfr representative of an important port during a PORTOPIA workshop, end of april 2015): “we did not want this PORTOPIA project, the European Commission enforced it upon us. That is exactly why we as port authorities should not contribute to the future resource base of the system, but the European Commission should instead”.
– This after more than 5 years of joint work (PPRISM – PORTOPIA)!
Monday, 30 October 2017 36
PORTOPIA
"You can't do transparency halfway. It takes people and it takes strategy. This is not a quick fix.”
“If you are gonna be naked, you better look attractive”
“PORTOPIA will allow ports to look in the mirror and see how they perform compared to meaningful averages and best practices, but within the confines of their own bathroom”
quotes
Monday, 30 October 2017
19
Monday, 30 October 2017 37
Challenges and risks
• Interaction academics / industry within a business intelligence project– Different profiles who do not understand each other interact to implement the
project• Need for “translators” who can bridge data, analytics and business decision making: data strategists,
data scientists and analytic consultants
– Understanding transaction costs when implementing an indicator: acceptability also means a cost-efficient way to collect data
– One by one indicator approach is difficult: create integrated dashboards
• Stakeholder management issues– Gain and maintain the trust of both industry and policy (government)
stakeholders– Often divergent objectives and attitudes, even within the industry!– Data confidentiality issues (trust in the partnership)– Dealing with uncertainty: entrepreneurial aspects of the project not in line with
main institutional logic of most port authorities or representative bodies (npo)– Implementation rhythm: take into account restricted absorptive capacity of
stakeholders– Change management: cfr. changes in RES system (make the case for change)
Monday, 30 October 2017 38
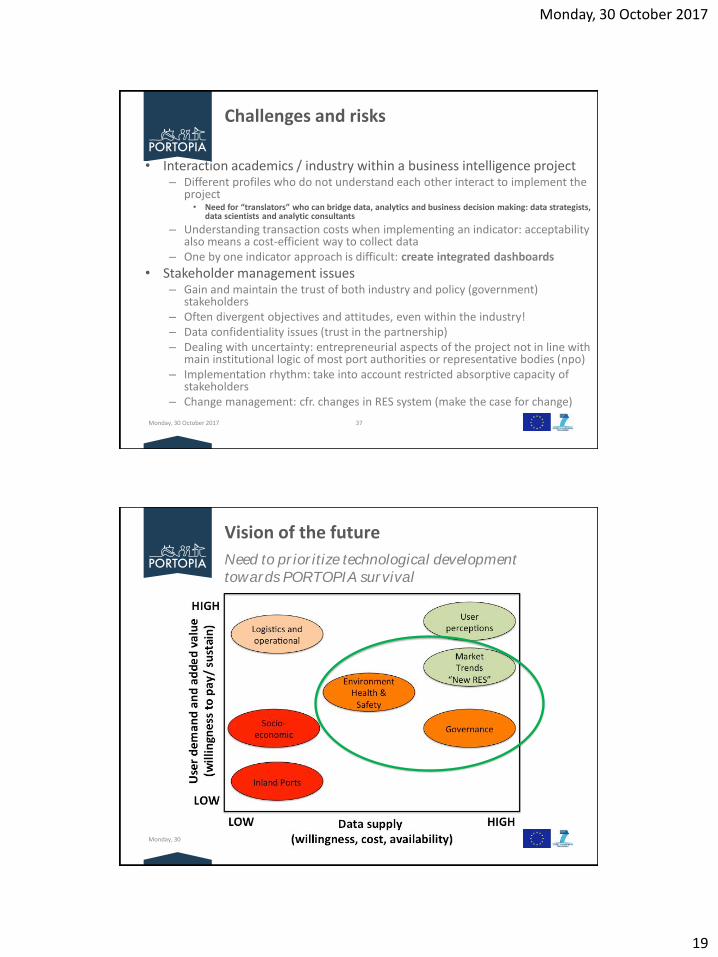
Vision of the future
Need to prioritize technological development towards PORTOPIA survival
Monday, 30 October 2017
20
Monday, 30 October 2017 39
Governance / organization is crucial
• Direct link to cost/revenue model
• Direct link to power relations between stakeholders (contributors of resources)– Data (port authorities, external sources)
– Intellectual knowledge (academics, industry)
– Technology provider
– => All three components are needed to deliver value (time/efficiency/cost)
– => Revenue in first stage primarily from one of the resource contributors.
Monday, 30 October 2017 40
Way forward (1)
• Favorable decision of ESPO Exec. Comm. to continue the “core” activity (traffics, environmental management, governance)
• Transfer to new technology partners
• Offer the platform to other (non-EU) users
• Start small and focused (!?): create a global database of quarterly port traffic, bottom-up…
• Seek network externalities and coalition building –share traffic data with other partners to develop new intelligence/insights
Monday, 30 October 2017
21
Monday, 30 October 2017 41
Way forward (2)
• New project ideas revolve around:
– Sustainability reporting for ports (IAPH/PIANC WG 174): guidelines and support
– Measurement of social license to operate (SLO)
– Integrated maritime logistics corridor dashboards integrating data from PORTOPIA, connectivity; fluidity and costs (“a fluid maritime logistics chain is a green logistics chain”).
• Involving all modes (road, rail, IWW)
Monday, 30 October 2017 42
Contact
• Prof. dr. Michaël Dooms – Project Director
• +32 2 629 21 30
• +32 477 606 132
• Skype michaeldooms
• Drs. Bruno Moeremans – Project Manager
• +32 2 629 20 35
• +32 474 32 45 84