COTE 2018 Dutch Disease and Premature Deindustrialization ...
Upload
hoangxuyenCategory
view
233download
0
Latin American Research Review, Vol. 48, No. 2. © 2013 by the Latin American Studies Association.
T R A D E L I B E R A L I Z AT I O N,
D E I N D U S T R I A L I Z AT I O N, A N D I N E Q UA L I T Y
Evidence from Middle-Income Latin American Countries
Juan Ariel BogliacciniUniversity of North Carolina at Chapel Hill
Abstract: This article explores the relationship among trade liberalization, deindustri-alization, and income inequality in the more industrially advanced Latin American countries. It argues that, among the most important liberal reforms implemented dur-ing the 1980s and 1990s, trade reform was especially detrimental to equality because it accelerated deindustrialization. The analysis provides evidence to support this mecha-nism. Therefore, as the liberalization of trade increased, the deindustrialization process produced an increase in inequality. In short, evidence shows how the process of economic integration to the global market, as it took place, produced an increase in inequality through the destruction of formal employment.
The import substitution industrialization (ISI) model in Latin America created
a dual labor market, deepening inequality, which was severe and greater than
in other parts of the globe even before the debt crisis (Bulmer Thomas 1996).1
But have the liberalization reforms really launched a new model of economic
growth and development that has ameliorated income inequality? Or have these
reforms further exacerbated inequality? This article shows how trade liberaliza-
tion reform played an important role in the destruction of formal employment in
industry. Concomitantly, this deindustrialization process produced an increase
in the levels of inequality. The analysis is done for the Latin American countries
that industrialized under the import substitution industrialization (ISI) model:
Argentina, Brazil, Chile, Costa Rica, Mexico, Uruguay, and Venezuela.
Latin America had begun its transition from the ISI model to an open-market
model at different paces by the late 1970s. By the 1990s almost every political econ-
omy in the region was in the process of integration into the global market. The lib-
eralization period constituted a structural adjustment process undertaken under
the strong infl uence of the so-called Anglo-Saxon neoliberal model, which refl ects
the neoclassical literature description of a capitalist economy (Williamson 1985).
I am thankful to Evelyne Huber, John D. Stephens, Jonathan Hartlyn, James Stimson, Lars Schoultz,
Fernando Filgueira, Merike Blofi eld, Sarah Brooks, Juan Pablo Luna, Sara Niedzwiecki, Santiago An-
ria, Jan Rovny, Jon Kropko, Diego Hernández, Federico Rodríguez, Santiago Cardozo, Russell Bither-
Terry, the late Pablo Alegre, and three anonymous LARR reviewers for their extremely useful comments
on previous versions of this article. I also thank Lars Schoultz, David Schwartz, and Alicia Nin for their
extensive editorial suggestions and corrections.
1. By 1980, 70 percent of households had income below the national average and the income of the
richest 20 percent was estimated as ten times greater than the poorest 20 percent (ECLAC 1993; United
Nations Development Program 1995).
P6171.indb 79P6171.indb 79 7/16/13 10:49:38 AM7/16/13 10:49:38 AM

80 Latin American Research Review
After the debt crisis, the structural adjustment was articulated and monitored by
the main debt creditors: international fi nancial institutions (IFIs) and the United
States. Parallel to this process, Latin American countries were also entering the
third wave of democratization.
It is precisely the strong role of IFIs in promoting and managing the structural
adjustment process between the debt crisis and the Argentinean crisis of 2001 that
characterizes this twenty-year period as the so-called neoliberal period. During
these years, and similarly to what happened after World War II in Western Eu-
rope, the convergence hypothesis about a homogeneous liberal, or liberal-based,
route to open-market capitalism fi rst gained adherents. Also as in the Western
European experience, this hypothesis came under suspicion as the literature be-
gan to identify qualitative differences in the paths different countries followed
into the global market (Goldthorpe 1984; Keohane 1984; Appel 2000; Huber 2002;
Brune, Garrett, and Kogut 2004; Madrid 2005; Bogliaccini and Filgueira 2012).2 In
other words, the process of convergence toward open-market capitalism should
be analytically distinguished from the particular routes that political economies
follow for integrating into the global market.
After the neoliberal period, countries have followed quite different routes,
some of them following the liberal path (arguably Chile, Costa Rica, and Mexico);
some others returning to some kind of coordinated paths (arguably Brazil and
Uruguay); and even others remaining in the process of stabilizing their political
systems, still arguing over a route to market integration (arguably Argentina and
Venezuela, although Argentina may belong to the second group). The infl uence
of IFIs is much weaker, and development processes are more autonomous in a
context of strong growth. However, the period between 1980 and 2000 is charac-
terized by reformers’ strong political dependence on IFIs, in terms of both credit
and projects.
The proposed analysis is based on the premise that the form in which Latin
American countries liberalized their markets since the 1980s was not the only
available alternative. The literatures on varieties of capitalism and welfare states
show that some variations of the European models of capitalism developed more
comprehensive welfare systems and have historically had lower inequality levels
(Esping-Andersen 1990; Huber and Stephens 2001; Iversen 2005; Pontusson 2005).
There is little debate about the pari passu increase in trade liberalization and
inequality during the twenty years between 1980 and 2000. This article aims to
shed light on the contested debate about the causal association between the two
phenomena. Figure 1 illustrates the trends in employment in industry as a per-
centage of total employment during the 1980s and 1990s. During the 1990s, the
deindustrialization process is evident in every country. The fi gure also shows
the debt-crisis effect in the evolution of employment in industry and how there
was a return to the mean effect after the crisis. Figure 2 illustrates the trends in
2. Schneider and Soskice (2009) propose that Latin American political economies developed a unique
post-opening model of capitalism (the so-called hierarchical model) characterized by the clash of patri-
monialism, liberalism, and the ISI institutions. Therefore, the convergence hypothesis core is not about
a liberal model necessarily but about a unique model after the neoliberal period.
P6171.indb 80P6171.indb 80 7/16/13 10:49:38 AM7/16/13 10:49:38 AM

TRADE LIBERALIZATION, DEINDUSTRIALIZATION, AND INEQUALITY 81
15.0
17.0
19.0
21.0
23.0
25.0
27.0
29.0
31.0
33.0
35.0
1980 1985 1990 1995 2000
Em
plo
ymen
t in
Ind
ust
ry
Argentina
Brazil
Chile
C. Rica
Mexico
Uruguay
Venezuela
Figure 1 Employment in industry as a percentage of total employment: Average and standard deviation for selected countries, 1980–2000.
40.0
45.0
50.0
55.0
60.0
65.0
1980 1985 1990 1995 2000
Gin
i In
dex
Argentina
Brazil
Chile
C. Rica
Mexico
Uruguay
Venezuela
Figure 2 Gini index: Average and standard deviation for selected countries, 1980–2000.
inequality for the same period, measured by the Gini index. Gini is a slow-mov-
ing variable; however, its level increased in all countries in the sample but Brazil.
In Brazil, where deindustrialization was the least severe in the region, it remained
steady (World Bank 2011; Brady, Kaya, and Gereffi 2011).
The availability of new and improved data on income inequality (World Insti-
tute for Development Economics Research 2008) allows the use of time series to
tackle two puzzles. First is the effect of trade reform on formal industrial employ-
ment. Second is the effect of formal employment shrinkage on inequality as trade
reform advanced.
TRADE REFORM, DEINDUSTRIALIZATION, AND INEQUALITY
The cornerstone of the neoliberal model that IFIs proposed for these Latin
American countries was the liberalization of trade to promote exportable goods
P6171.indb 81P6171.indb 81 7/16/13 10:49:38 AM7/16/13 10:49:38 AM

82 Latin American Research Review
that were previously absent. The advocates of this model argued initially that
export-led reforms would foster immediate economic growth based on increased
labor demand and capital use (Bhagwati and Martin 1980).3 However, contrary to
theoretical expectations, empirical evidence suggests that demand for labor did not
grow at the expected rates during the period, and even fostered inequality in most
developing countries long after the implementation of the reforms, with the excep-
tion of the South Asian “tigers” (Woods 1997; Feenstra and Hanson 1997; Hanson
and Harrison 1999; Spilimbergo, Londoño, and Székely 1999; Beyer, Rojas, and Ver-
gara 1999; Marjit and Acharyya 2003; Marjit, Beladi, and Chakrabarti 2004).
These empirical disconfi rmations of the reforms’ expected effect on employ-
ment generation and inequality strongly support Kuznets’s (1955) hypothetical
expectations. Kuznets stated that developing political economies would have
scarce opportunities to curve inequality in a way similar to that of the advanced
industrial democracies. The argument is grounded on the inability of countries
with weak political institutions to control the factors that produce inequality,
as, according to Kuznets, income sources of lower social groups were destroyed
much more rapidly than the new opportunities the economy created for them.
While open-market capitalism in advanced political economies developed
from the post–World War II period in a scenario of stable political and economic
institutional frameworks, the process of opening in Latin America was done in a
context of much weaker and unstable political institutions, which had been even
weaker in previous decades.
The question, then, is how to explain the relationship between trade liberal-
ization and growing inequality in post-ISI Latin America. The political economy
literature for the developing world offers two competing explanations for the in-
crease in inequality since the 1980s: the opening of international trade (trade lib-
eralization) and technology improvement. Two hypotheses have been developed
to explain the impact of opening trade on inequality. First, the more advanced
industrial countries in the region extended trade protection (under ISI) prefer-
entially to industries that made relatively intensive use of unskilled labor (Aedo
and Lagos 1984; Hanson and Harrison 1999). Second, the region’s liberalization
process coincided with the entry of China and other low-skilled-labor countries
into the world market, thus shifting the comparative advantage of middle-income
countries into goods of middle-skill intensity (Hanson and Harrison 1999). These
two processes contributed to the destruction of formal employment for unskilled
3. The rationale for this is the Heckscher-Ohlin (H-O) and Stopler-Samuelson (S-S) models. For a
complete discussion and critique of these models, see Marjit and Acharyya (2003). In a nutshell, H-O
asserts that countries should export goods that use intensively those factors of production that are rela-
tively abundant at home, and import goods that use intensively those factors that are relatively scarce.
S-S states that a reduction on trade barriers expands trade by increasing the demand for abundant fac-
tors because of the expansion of export sectors, and by reducing the demand for scarce factors because
of the concentration of import-competing sectors, with corresponding effects on factor prices. In devel-
oping countries, where unskilled labor is abundant and skilled labor is scarce, international trade was
expected to raise unskilled wages and to lower skilled wages, narrowing the gap between them (Woods
1997). However, both models have come under increasing criticism because of the assumption of per-
fectly competitive markets, perfect mobility of factors across sectors of the economy, constant returns to
scale technologies, and the absence of nontraded goods, among others (Marjit and Acharyya 2003).
P6171.indb 82P6171.indb 82 7/16/13 10:49:38 AM7/16/13 10:49:38 AM

TRADE LIBERALIZATION, DEINDUSTRIALIZATION, AND INEQUALITY 83
formal workers. As for the effect of technology improvement on inequality, the
main hypothesis states that technological progress in developing countries be-
tween the 1960s and the 1980s was biased against unskilled labor (Feenstra and
Hanson 1997), thus slowing down the demand for labor, even for those industrial
sectors that were already successfully competing in the global market.
The argument exposed in this article goes as follows: inequality levels have
grown since the 1980s because income sources of lower social groups were de-
stroyed much more rapidly than new opportunities in terms of the labor mar-
ket that was created for those groups.4 In the more industrially advanced Latin
American countries, formal industrial employment was dismantled, and no alter-
native sources of formal employment (or new safety nets) were put in place. The
explanation put forward in this study identifi es trade liberalization as a key factor
responsible for the shrinking of formal industrial employment. Import competi-
tion, particularly where liberalization happened quickly, caused the bankruptcy
of many industrial enterprises. Many of them simply closed down, and those jobs
were lost. The destruction of formal-sector jobs reduced the income of former
workers who were pushed into survival strategies in the informal sector.
At the onset of the liberalization period, the production systems of the set of
countries analyzed here were based on the ISI model, and their welfare structures
emulated the continental European conservative one, although with different lev-
els of coverage and stratifi cation (Bulmer Thomas 1996; Huber 1996; Filgueira and
Filgueira 2002; Filgueira and Bogliaccini 2004). Table 1 shows the main social,
political, and economic characteristics of these countries before 1980, acknowl-
edging the high level of variation in terms of social welfare spending, democratic
strength, and relative development. However, in all cases there is a relative de-
velopment of industry as part of the productive structure—even Costa Rica had
closed the gap and already belonged to the more advanced industrial countries
before liberalization began.
Deindustrialization processes occurred in most high- and middle-income
Western political economies between the 1970s and 2000s, but it was particularly
intense in middle-income Latin American ones (Iversen 2005; Brady, Kaya, and
Gereffi 2011). The trade reform consisted primarily of the reduction of tariffs and
other barriers to international trade, such as import quotas. Chile, Argentina, and
Uruguay were the fi rst movers in the early 1970s in the context of their bureau-
cratic authoritarian regimes. On average, tariffs were cut by half over the 1970s,
and again from an average of 46 percent in 1990 to 12 percent in 1995 (Morley
2001). Destruction of formal industrial employment was a consequence of the
opening of trade and the lack of competitiveness in the domestic industrial sector,
which prompted an increase in the size of the informal sector (Portes and Hoff-
man 2003; Portes and Roberts 2005; ILO 2010). The percentage of the economically
4. This argument is in line with classic works on social consequences of abrupt economic changes,
such as Kuznets’s (1955) previously cited work and Polanyi’s (1944, 167–168) suggested explanation of
the Indian famines during the mid-nineteenth century: “The three or four large famines that decimated
India under British rule since the Rebellion were thus neither a consequence of the elements, nor of ex-
ploitation, but simply of the new market organization of labor and land which broke up the old village
without actually resolving its problems.”
P6171.indb 83P6171.indb 83 7/16/13 10:49:38 AM7/16/13 10:49:38 AM

Tabl
e 1
Mai
n ec
onom
ic, s
ocia
l, an
d po
litic
al in
dica
tors
at t
he o
nset
of t
he p
erio
d of
libe
raliz
atio
n
Rel
ativ
e d
evel
op
men
t(1
96
0–1
98
0)T
rad
e(1
96
0–1
98
0)W
elfa
re c
ov
erag
e(1
96
0–1
98
0)S
tren
gth
of
dem
ocr
acy
(194
5–1
98
0)L
evel
of
ind
ust
ria
liz
atio
n(1
96
0–1
98
0)
Arg
en
tin
a (
$10,
50
0)A
rgen
tin
a (
13)
Arg
en
tin
a (
5)A
rgen
tin
a (
12)
Arg
en
tin
a (
46)
Bra
zil
($
5,3
00)
Bra
zil
(15
)B
raz
il (
1)B
raz
il (
9.5)
Bra
zil
(3
8)C
hil
e ($
6,70
0)C
hil
e (3
4)C
hil
e (8
.5)
Ch
ile
(16.5
)C
hil
e (4
0)C
ost
a R
ica
($
6,6
00)
Co
sta
Ric
a (
61)
Co
sta
Ric
a (
3.5)
Co
sta R
ica (
30.
5)C
ost
a R
ica (
27
)M
exic
o (
$5,
90
0)M
exic
o (
18)
Mex
ico
(3.
4)M
exic
o (
0)M
exic
o (
31)
Uru
gu
ay (
$7,0
00)
Uru
gu
ay (
30)
Uru
gu
ay (
10.7
)U
rug
uay
(29)
Uru
gu
ay (
32)
Ven
ezu
ela (
$10,
40
0)V
en
ezu
ela (
45)
Ven
ezu
ela (
1.5)
Ven
ezu
ela (
19)
Ven
ezu
ela (
44)
Not
e: R
ela
tiv
e d
ev
elo
pm
en
t is
mea
sure
d a
s G
DP
per
cap
ita; av
era
ge
va
lue
for
the
peri
od
is
in p
are
nth
ese
s (H
est
on
, S
um
mers
, a
nd
Ate
n 2
00
9; W
orl
d B
an
k 2
011)
. T
rad
e
is m
ea
sure
d a
s ra
tio
of
imp
ort
s p
lus
ex
po
rts
ov
er
GD
P; av
era
ge
va
lue
for
the
peri
od
in
pa
ren
the
ses
(Wo
rld
Ba
nk
201
1). W
elf
are
co
vera
ge
is m
ea
sure
d a
s so
cia
l se
curi
ty
an
d w
elf
are
ex
pen
dit
ure
as
perc
en
tag
e o
f G
DP
(IM
F 2
010
a); cl
ass
ifi c
ati
on
is
con
sist
en
t w
ith
ty
po
log
y p
rop
ose
d b
y F
ilg
ueir
a a
nd
Fil
gu
eir
a (
20
02)
. S
tren
gth
of
dem
oc-
racy
is
mea
sure
d b
y y
ea
rs u
nd
er
dem
ocr
ati
c ru
le.
Cu
mu
late
d r
eg
ime
va
lue
s si
nce
194
5 f
oll
ow
ing
cri
teri
a a
do
pte
d b
y R
ue
sch
em
eyer,
Hu
ber
Ste
ph
en
s, a
nd
Ste
ph
en
s
(19
92)
. L
ev
el
of
ind
ust
ria
liz
ati
on
is
mea
sure
d b
y i
nd
ust
ry v
alu
e ad
ded
(a
s p
erc
en
tag
e o
f G
DP
); a
vera
ge
va
lue
for
the
peri
od
is
in p
are
nth
ese
s (W
orl
d B
an
k 2
011)
.
P6171.indb 84P6171.indb 84 7/16/13 10:49:39 AM7/16/13 10:49:39 AM

TRADE LIBERALIZATION, DEINDUSTRIALIZATION, AND INEQUALITY 85
active population working in the informal sector in the seven countries analyzed
here rose, on average, from 33 percent in 1980 to 49 percent in 1997 (ILO 1998),
whereas employment in industry dropped from an average of 27 percent in 1980
to 22 percent in 2000 for the countries (World Bank 2007).
In other words, the theoretical claim behind the liberal model, that manufac-
turing exports would trigger industrial employment in developing countries as
the abundance of low-skilled labor created a comparative advantage, did not hold
in Latin America. As liberalization of trade increased, a process of destroying
formal employment also increased because of the inability of domestic industry
to compete globally (Brady, Kaya, and Gereffi 2011).
The literature on the effect of liberal reforms on deindustrialization in devel-
oping countries also postulates that the destruction of formal employment was
more severe in those countries where trade liberalization reformers were backed
by the most stable and durable regimes, mostly authoritarian ones. In those cases,
the process of dismantling the ISI model and establishing neoliberalism was sus-
tained, unopposed, for a longer time (Gatica 1989; Harvey 2005; Portes and Rob-
erts 2005). In other words, as Brady, Kaya, and Gereffi (2011) state, declining in-
dustrial employment may result because more politically insulated, durable states
have more time to dismantle the protections for domestic industry.
This process of deindustrialization, in turn, tends to produce an increase in in-
equality by destroying protected employment and enlarging the informal sector
of the economy. Concomitantly, as most welfare states in the region (where they
existed) were built on a conservative model of modernization that incorporated
urban labor from above and on a contributory basis, and linked to participation
in the formal sector of the economy (Esping-Andersen 1990; Collier and Collier
1991; Huber and Stephens 2001; Filgueira and Filgueira 2002), the destruction of
the unskilled industrial formal sector weakened the access of middle and lower
social sectors to welfare protection.
In summary, opening to the global market did not create opportunities either
for specialization in the industrialization of abundant factors, or for technology-
intensive production sectors to develop in ex-ISI political economies. Formal em-
ployment thus shrank in unopposed authoritarian regimes, or at least in recently
democratized regimes with weak civil societies. The informal sector and inequal-
ity grew. Welfare systems were not able to provide adequate safety nets to protect
against the new risks.
MODELS AND DATA
The proposed analysis of the relationship among reforms to liberalize trade,
deindustrialization, and inequality develops in two stages. To empirically test the
causal links proposed earlier, the fi rst stage tests the relationship between trade
liberalization and employment in industry. The second stage tests the relation-
ship between employment in industry and inequality. For this second model, an
interaction term is included between trade reform and employment in industry
to capture how deindustrialization has the effect of increasing inequality as trade
reform advances. The analysis is done with yearly data for Argentina, Brazil,
P6171.indb 85P6171.indb 85 7/16/13 10:49:39 AM7/16/13 10:49:39 AM

86 Latin American Research Review
Chile, Costa Rica, Mexico, Uruguay, and Venezuela for the period between 1980
and 2000. There are no internal gaps in the panels.5
Dependent Variables
Models 1–3 (table 2) assess the relationship between trade reform and employ-
ment in industry as a percentage of gross domestic product (GDP). The measure
of employment in industry as a percentage of GDP is the standard measure used
in the literature (World Bank 2011). Models 4–6 (table 3) assess the relationship
between employment in industry and inequality as the trade reform advances.
The measure of income inequality is the standardized Gini index from the World
Income Inequality Database (SWIID) (World Institute for Development Econom-
ics Research 2008).6
Independent Variables for Stage 1
The measure for trade liberalization reform is the index created by Morley,
Machado, and Pettinato (1998). As put forward in the theoretical section, trade
liberalization is expected to produce a destruction of employment in industry
during the period.7
The model also includes a set of control variables that the literature has found to
be signifi cant in explaining deindustrialization. The capital account liberalization
reform is measured by Chinn and Ito’s (2008) index.8 This reform was intended
to eliminate or reduce restrictions on current account transactions and on capital
account transactions, as well as the requirement to surrender hard currency from
export proceeds (Morley 2001). Argentina, Costa Rica, and Venezuela already had
5. Missing data for the independent variables were imputed using James Honaker and Gary King’s
(2007) multiple imputation strategy. The authors developed applications of modern methods for analyz-
ing data with missing values, based primarily on multiple imputations for cross-sectional, time-series,
and time-series cross-sectional data. Multiple imputations for missing data had long been recognized
as theoretically appropriate.
6. Using standardized Gini data has two main advantages. First, it allows comparison with other
countries in Latin America as well as with other parts of the world. Second, it provides a series without
gaps, which is necessary to run an error correction model. Refer to Solt (2009) for a detailed explanation
of the standardization methodology.
7. As the original indexes were created for the period 1970–1995, I use the indexes as updated until
2000 by Escaith and Paunovic (2004).
8. Morley, Machado, and Pettinato (1998) also have a fi nancial openness index for the analyzed period
and also use the IMF Annual Report on Exchange Arrangements and Exchange Restrictions ( AREAER,
available at http://www.imfareaer.org) as the main source for the index’s four indicators: presence of
multiple exchange rates, restrictions on current account transactions, restrictions on capital account
transactions, and requirement of the surrender of export proceeds. However, Morley, Machado, and
Pettinato (1998) also use World Bank memoranda as a source of data. In both cases, the construction
of the indexes implies a fundamentally subjective translation of verbal descriptions of controls into
numerical indexes. I use Chinn and Ito’s (2008) index for two reasons. First, given the interpretation sub-
jectivity problem, I assume that using only one source reduces the validity problem by leaving constant
over the period and countries the original (exogenous to the index) conceptualization of the indicators.
Second, as Chinn and Ito built the index for 181 countries and for the period 1970–2007, using this index
allows for future cross-region comparison and for extension of the analyzed time period.
P6171.indb 86P6171.indb 86 7/16/13 10:49:39 AM7/16/13 10:49:39 AM

TRADE LIBERALIZATION, DEINDUSTRIALIZATION, AND INEQUALITY 87
relatively open capital markets in the 1970s; Mexico and Uruguay began to open
their markets in that decade; and Chile and Brazil maintained signifi cant controls
over foreign capital transactions during the entire period (Morley 2001; Chinn
and Ito 2007).
GDP per capita (Heston, Summers, and Aten 2009) is included as a measure
for overall economic development.9 Trade as a percentage of GDP (World Bank
2011) is included as a measure of economic openness. The rationale for including
this variable in the model is that the effect of trade reform in employment in in-
dustry should be controlled by the level of actual trade in the economy. To control
for the impact of foreign direct investment (FDI) in the host economy, the model
includes FDI stock as a percentage of GDP (UN Conference on Trade and Devel-
opment 2009). Infl ation is measured as the percentage change in consumer prices
(IMF 2010).10 Sector dualism, measured as the net difference between employ-
ment in agriculture as a percentage of total employment (World Bank 2011) and
value added in agriculture (World Bank 2007), refers to the coexistence of a low-
productivity traditional sector and a high-productivity modern sector. Urbaniza-
tion is the percentage of the population living in urban areas (World Bank 2011).
To control the ability of domestic opposition to oppose the reform, the models
include the variable unopposed regimes. This variable is coded as 0 if opposition
was allowed in a democratic environment, 0.5 if limited opposition was allowed,
and 1 if no opposition was allowed. The rationale for this variable is to assess the
relevance of internal opposition for the reforms at the moment the reforms oc-
curred. Bureaucratic authoritarian regimes were coded 0, and Mexico was coded
0 until 1988 and 0.5 between 1988 and 2000. The coding was done following Díaz-
Cayeros and Magaloni’s (2001) accepted criteria for defi ning the Mexican democ-
ratization process. Brazil was coded 0.5 between 1985 and 1989, given that elec-
tions were not totally free and a military tutelage of the transition process was
in place, and Chile was coded 0.5 between 1990 and 2001 for the same reasons
and until the position of institutional senator was eliminated. I expect industrial
employment to be destroyed in higher proportion in unopposed regimes given an
unopposed trade liberalization process.
Finally, the model includes two dummy variables to account for membership
in Mercosur and participation in NAFTA, and another dummy variable to ac-
count for the periods in which the countries were participating in International
Monetary Fund (IMF) loan programs. For Mercosur membership, only full mem-
bers were considered.
Independent Variables for Stage 2
Model 6 (table 3) includes an interaction term between trade liberalization
reform and employment in industry as a percentage of total employment. The
9. This is a measure of real GDP per capita in constant dollars using the Chain index based on pur-
chasing-power parity (PPP) in 2005 international prices. Therefore, the growth rate for any period is
based on international prices most closely allied with the period.
10. Data from the Inter-American Development Bank are used to fi ll in missing observations for
Brazil for the 1970s and 1980s.
P6171.indb 87P6171.indb 87 7/16/13 10:49:39 AM7/16/13 10:49:39 AM

88 Latin American Research Review
theoretical reason for this is the expectation that the effect of the level of em-
ployment in industry on inequality would not remain constant as trade reform
advances. I expect the destruction of employment in industry to be detrimental to
inequality, and its effect to increase as trade liberalization increases.
Among the control variables included in models 4 to 6, some were also in-
cluded in the fi rst stage’s models: trade and capital account liberalization reforms,
trade openness, FDI stocks, infl ation, and sector dualism. The advancement of
the trade liberalization reform is expected to produce an increase in inequality,
as Morley (2001) has found. The hypothesized relationship between the liberal-
ization of the capital account and inequality goes as follows: on the one hand,
greater capital openness gives more leverage to capital to press for legislation that
favors its interests over those of labor. On the other hand, greater capital open-
ness should increase competition among capital and make capital cheaper, which
could work in the other direction.
An increment of GDP per capita should trigger an increase in inequality, as
Kuznets (1955) has suggested. Trade as a percentage of GDP (World Bank 2011) is
included to control the direct impact of levels of trade fl ows on inequality. Open-
ness of the economy to trade should theoretically favor the abundant factor of
production—unskilled labor—in developing countries. However, since the mar-
ket opening in Latin America happened around the same time as in countries
with even lower labor costs, such as China and countries of Eastern Europe, this
effect may be neutralized.
The literature recognizes two main advantages in FDI for the host economy:
transferring technology and generating employment. It also recognizes two main
disadvantages: repatriation of benefi ts and a race-to-the-bottom concern about
competition for FDI with lower taxes and environment and labor protection stan-
dards (Drezner 2001; Mosley and Uno 2007).11 A positive relationship between FDI
stock and inequality is expected, because investment in industry tended to re-
place labor with technology, and because investment in unskilled services tended
to destroy small and family-owned enterprises.
Accelerated infl ation and hyperinfl ation distort relative prices, whereas chronic
infl ation undermines prices. This distortion has greater effects on low-income seg-
ments of the population. However, hyperinfl ation was curved in the early 1990s,
parallel to the destruction of industrial employment. Sector dualism is expected
to contribute to an increase in the overall inequality level of a society (Alderson
and Nielsen 1999, 610).
The models also include other controls. The size of the informal sector, mea-
sured as the ratio of the labor force in the informal sector of the economy to the
total labor force (ECLAC 2010; ILO 2010), is a proxy of the level of formalization of
the economy. Given that there is a positive correlation between formal and stable
jobs, as well as the fact that the bulk of the welfare and social security spending
in the analyzed countries was done on a contributory basis during the period, I
expect inequality to increase as the size of the informal sector increases.
11. This point has been argued largely by dependency theorists (Prebisch 1952; Cardoso and Fa-
letto 1979).
P6171.indb 88P6171.indb 88 7/16/13 10:49:39 AM7/16/13 10:49:39 AM

TRADE LIBERALIZATION, DEINDUSTRIALIZATION, AND INEQUALITY 89
Health and education expenditure, measured as a percentage of GDP, in-
cludes subnational expenditure (ECLAC 2010). Spending on health and educa-
tion increased on average during the liberalization period (Wibbels 2006; Segu-
ra-Ubiergo 2007) and was more pro-cyclical than social security spending. This
variable is relevant as a measure of human capital formation, but the distributive
effect of health and education expenditure depends on its allocation.
Social security and welfare expenditure is measured as a percentage of GDP
on a year-to-year basis (IMF 2010).12 As most of this expenditure is done on a con-
tributory basis and formal employment is being destroyed, I expect inequality to
increase as social security and welfare expenditure remain stagnant or decrease.
To test the hypothesis that increases in inequality were greater where demo-
cratic institutions were weaker, the model includes a cumulative measure of de-
mocracy as a measure of domestic regime type.13 Democracy allows the under-
privileged to organize in social movements, it allows parties representing their
interests to establish themselves, it allows those parties to elect representatives to
the legislatures at all levels, and it allows legislators to have an infl uence on policy
over the long term. For instance, parties can demand compensatory measures
for workers affected by job losses and their families. Thus, I expect inequality to
increase less in countries with stronger democratic institutions.
Finally, the model also includes the IMF dummy variable to account for the ef-
fect of being under an IMF plan on the ability of governments to contain inequal-
ity via social expenditure.
Models
The analysis proceeds with two error correction models (ECMs) with ordinary-
least-squares panel-corrected standard errors.14 The error correction model is well
suited for the analysis because it allows for estimation of changes in employment
in industry and inequality. Based on the assumption that the dependent and in-
dependent variables are in a long-term equilibrium relationship, these models
allow for the assessment of long-term effects on the dependent variable (De Boef
and Keele 2008). The estimated models are of the following form:
∆Yit= β0 + Yt–1ϕ + βk∆χit–1 + χit–1βj+ Dt + eit
The dependent variable is measured as fi rst difference, and the right side of the
equation includes a lagged dependent variable, as well as both the lagged level
12. This measure, a ratio of spending to GDP (both in current local units), was previously used by
Kaufman and Segura (2001) and Huber and colleagues (2006).
13. The variable accumulates regime values since 1945, codifying them as follows (Rueschemeyer,
Huber Stephens, and Stephens 1992): authoritarian regime = 0, restricted democracy = 0.5, and full
democracy = 1.
14. Estimation is made with an error correction model that is robust to unit roots. A Fisher test (ta-
ble A1) validates the suitability of such model, which is estimated using ordinary least squares with
panel-corrected errors, as suggested by Beck and Katz (1995, 1996), given its relative simplicity and the
ease of interpreting results. Error correction models have been used by Kaufman and Segura-Ubiergo
(2001) and Segura-Ubiergo (2007), among others, for the study of social-spending determinants in Latin
America.
P6171.indb 89P6171.indb 89 7/16/13 10:49:39 AM7/16/13 10:49:39 AM

90 Latin American Research Review
and yearly changes of each variable. All variables included in the two models are
standardized. The coeffi cients βj measure long-term effects, allowing for assess-
ment of whether trends in independent variables are causally related to long-term
trends in the dependent variable. The coeffi cients βk measure short-term dynam-
ics of the variables, which are infl uenced by deviation from equilibrium (Enders
2004; De Boef and Keele 2008). The term Dt refers to dummies when present in the
model. Tables 2 and 3 display the results of the model. The long-run multipliers in
these tables are the long-term effect of the variables on the dependent variable.15
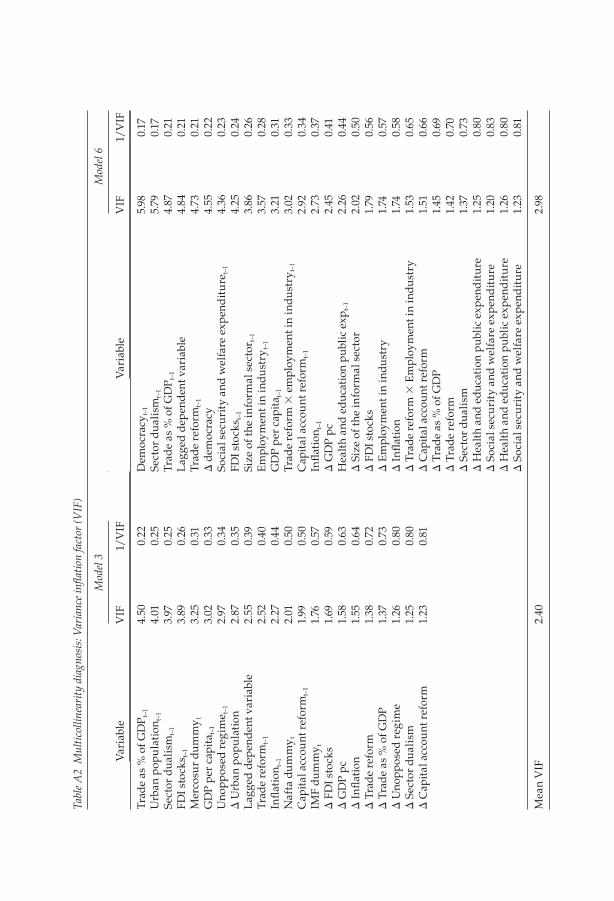
Variance infl ation factor (VIF) tests are performed for the models (table A2
in the appendix), showing that there are no multicollinearity problems. The
Breusch-Pagan-Cook-Weisberg test is also performed to rule out the possibility
of heteroskedastic standard errors (table A3 in the appendix). There are no infl u-
ential data points in the sample for either of the models, as shown in fi gures A1
and A2 in the appendix.16 Results from F-tests reveal that neither country nor year
dummies belong to stage 1 models. However, country dummies belong to stage
2 models and are included (not shown in table 3).
RESULTS
Results suggest two broad conclusions: the trade liberalization reform pro-
duced a signifi cant destruction of employment in industry, and the destruction of
employment in industry produced an increase in income inequality. The analysis
of results is done for models 3 and 6, which are the complete models.
Trade Liberalization and Employment in Industry
Model 3 shows that the destruction of formal employment in the industrial
sector is signifi cantly associated with trade reform over the long run. As trade
liberalization advanced, formal employment in industry shrank. The long-term
effect of trade liberalization on employment in industry is statistically signifi cant
(p ≤ .1). Increases in trade liberalization will cause deviations from these two
variables’ equilibrium, thus causing employment in industry to be too high. In
the short term, though not statistically signifi cant, employment in industry in-
creases 0.101 points per each unit increase of trade reform. Therefore, the former
will respond in the long run by decreasing by a total of 0.801 points, spread over
future time periods at a rate of 12 percent per time period. Figure 3 shows the
long-term effect of trade reform on employment in industry.
Consistent with these fi ndings, the Mercosur membership dummy is statisti-
15. Long-term multipliers are obtained by dividing the regression coeffi cient by the lagged depen-
dent variable (βj/–ϕ). The parameter U measures this long-term equilibrium relationship. Standard er-
rors are calculated for these long-term multipliers, as suggested by De Boef and Keele (2008, 192).
16. The scaled difference between the predicted responses from the model constructed from all the
data and the predicted responses from the model constructed by setting the i-th observation aside
(DFITS) was calculated (Welsch and Kuh 1977).
P6171.indb 90P6171.indb 90 7/16/13 10:49:39 AM7/16/13 10:49:39 AM

Tabl
e 2
Em
ploy
men
t in
indu
stry
and
trad
e re
form
: Err
or c
orre
ctio
n m
odel
s
Mod
el 1
Mod
el 2
Mod
el 3
βσ2
βσ2
βσ2
Tra
de
refo
rmt–
1–0
.12
20.
04
5**
*–0
.157
0.0
48
***
–0.0
95
0.0
50
**
∆ T
rad
e re
form
0.10
00.
134
0.02
50.
141
0.10
10.
129
Cap
ita
l acc
ou
nt
refo
rmt–
10.
019
0.0
30
0.01
80.
03
00.
04
20.
032
*
∆ C
ap
ita
l acc
ou
nt
refo
rm
0.0
04
0.0
59–0
.007
0.0
58
0.0
00
0.0
55
GD
P p
c t–1
–0.0
190.
04
0–0
.039
0.0
45
–0.0
77
0.0
51*
∆ G
DP
pc
0.57
70.
140
***
0.56
60.
137
***
0.61
00.
132
***
Tra
de
as
% o
f G
DP
t–1
0.02
30.
029
0.0
66
0.0
34
**–0
.04
00.
049
∆ T
rad
e a
s %
of
GD
P
0.025
0.0
90
0.01
70.
100
–0.0
44
0.10
4
FD
I st
ock
s t–1
–0.0
49
0.071
–0.0
410.
069
–0.0
670.
08
4
∆ F
DI
sto
cks
0.287
0.2
53
0.3
06
0.26
10.
439
0.2
54
**In
fl at
ion
t–1
0.029
0.028
0.0
46
0.028
*
∆ I
nfl
atio
n0.
02
20.
028
0.01
30.
026
Sect
or
du
ali
smt–
1–0
.018
0.0
38
–0.0
810.
04
4
∆ S
ect
or
du
ali
sm–0
.171
0.13
0*
–0.1
96
0.12
4**
Urb
an
po
pu
lati
on
t–1
0.0
610.
039
*0.
04
40.
037
∆ U
rba
n p
op
ula
tio
n–0
.017
1.7
77
–0.0
83
1.926
Un
op
po
sed
go
ver
nm
en
t t–1
–0.0
410.
03
8
∆ U
no
pp
ose
d g
ov
ern
men
t–0
.00
30.
073
Mer
cosu
r–0
.351
***
NA
FT
A0.
186
*
IMF
–0.0
22
(con
tinue
d)
P6171.indb 91P6171.indb 91 7/16/13 10:49:39 AM7/16/13 10:49:39 AM

Mod
el 1
Mod
el 2
Mod
el 3
βσ2
βσ2
βσ2
Lo
ng
-ru
n m
ult
ipli
ers
Tra
de
refo
rmt–
1–1
.897
1.3
31*
–1.9
79
1.14
9**
–0.8
010.
522
*C
ap
ita
l acc
ou
nt
refo
rmt–
10.
294
0.4
370.
224
0.3
65
0.3
510.
276
GD
P p
c t–1
–0.2
910.
710
–0.4
95
0.6
52–0
.64
80.
475
*
Tra
de
as
% o
f G
DP
t–1
0.3
570.
60
30.
831
0.73
5–0
.33
60.
370
FD
I st
ock
s t–1
–0.7
65
0.96
3–0
.514
0.796
–0.5
58
0.6
48
Infl
atio
nt–
10.
372
0.4
07
0.3
83
0.2
57*
Sect
or
du
ali
smt–
1–0
.22
30.
457
–0.6
780.
34
5**
Urb
an
po
pu
lati
on
t–1
0.76
80.
653
0.3
690.
34
2
Un
op
po
sed
go
ver
nm
en
t t–1
–0.3
410.
339
Inte
rcep
t–0
.070
*–0
.059
0.0
00
Lag
ged
dep
en
den
t v
ari
ab
le–0
.06
4**
–0.0
79
**–0
.119
***
R2
0.21
0.24
0.3
3N
147
147
147
Not
e: P
an
el-
corr
ect
ed
sta
nd
ard
err
or.
*p ≤
.1; **
p ≤
.0
5; *
**p
≤ .
01 (
on
e-t
ail
ed
te
st)
Tabl
e 2
(con
tinu
ed)
P6171.indb 92P6171.indb 92 7/16/13 10:49:39 AM7/16/13 10:49:39 AM
Tabl
e 3
Trad
e, e
mpl
oym
ent i
n in
dust
ry, a
nd in
equa
lity:
Err
or c
orre
ctio
n m
odel
s
Mod
el 4
Mod
el 5
Mod
el 6
βσ2
βσ2
βσ2
Tra
de
refo
rmt–
10.
081
0.0
35
**0.
201
0.0
46
***
0.14
10.
047
***
∆ T
rad
e re
form
0.0
390.
071
0.10
10.
06
6*
0.10
70.
06
4**
Cap
ita
l acc
ou
nt
refo
rmt–
10.
014
0.0
31–0
.020
0.028
–0.0
29
0.026
∆ C
ap
ita
l a
cco
un
t re
form
0.
032
0.0
33
0.0
05
0.029
–0.0
160.
028
GD
P p
c t–1
0.0
370.
020
*0.
141
0.0
37**
*0.
177
0.0
34
***
∆ G
DP
pc
–0.0
38
0.0
690.
03
30.
069
0.14
40.
072
**T
rad
e a
s %
of
GD
Pt–
10.
107
0.0
50
**0.
129
0.0
51**
*0.
109
0.0
49
**
∆ T
rad
e a
s %
of
GD
P
0.0
89
0.0
65
0.0
99
0.0
63
*0.
06
00.
061
FD
I st
ock
s t–1
–0.0
34
0.0
40
0.0
510.
049
0.0
50
0.0
47
∆ F
DI
sto
cks
–0.1
80
0.10
5*
–0.1
07
0.0
93
–0.0
44
0.0
91
Infl
atio
nt–
1–0
.016
0.01
2–0
.021
0.01
3*
–0.0
26
0.01
3**
∆ I
nfl
atio
n0.
002
0.01
10.
001
0.01
1–0
.007
0.01
1
Em
plo
ym
en
t in
in
du
stry
t–1
–0.0
310.
018
*–0
.051
0.02
5**
–0.0
44
0.024
**
∆ E
mp
loy
men
t in
in
du
stry
–0
.00
60.
041
–0.0
06
0.0
38
–0.0
45
0.0
38
Siz
e o
f th
e in
form
al
sect
or t
–10.
02
50.
02
20.
196
0.0
51**
*0.
271
0.0
53
***
∆ S
ize
of
the
info
rma
l se
cto
r 0.
20
00.
119
*0.
336
0.12
2**
*0.
246
0.11
8**
Sect
or
du
ali
smt–
10.
052
0.0
610.
124
0.0
66
**0.
116
0.0
63
**
∆ S
ect
or
du
ali
sm0.
114
0.0
84
0.17
10.
075
**0.
151
0.072
**H
ea
lth
an
d e
du
cati
on
ex
pen
dit
ure
t–1
0.02
20.
03
40.
014
0.0
33
∆ H
ea
lth
an
d e
du
cati
on
ex
pen
dit
ure
0.0
410.
039
0.021
0.0
38
So
cia
l se
curi
ty a
nd
wel
fare
ex
pen
dit
ure
t–1
0.0
34
0.0
53
0.0
04
0.0
52
∆ S
oci
al
secu
rity
an
d w
elfa
re e
xp
en
dit
ure
0.01
90.
052
–0.0
04
0.0
51
Dem
ocr
acy
t–1
–0.5
73
0.15
6**
*–0
.681
0.14
8**
*
∆ D
em
ocr
acy
–2.0
780.
56
3**
*–1
.574
0.55
4**
*
IMF
–0.0
34
0.0
44
–0.0
100.
04
3
Tra
de
refo
rm ×
Em
plo
ym
en
t in
in
du
stry
t–1
–0.1
130.
032
***
∆ T
rad
e re
form
× E
mp
loy
men
t in
in
du
stry
–0.0
520.
032
*
(con
tinue
d)
P6171.indb 93P6171.indb 93 7/16/13 10:49:39 AM7/16/13 10:49:39 AM

Tabl
e 3
(con
tinu
ed)
Mod
el 4
Mod
el 5
Mod
el 6
βσ2
βσ2
βσ2
Lo
ng
-ru
n m
ult
ipli
ers
Tra
de
refo
rmt–
10.
296
0.14
8**
0.76
20.
231
***
0.51
70.
226
**
Cap
ita
l acc
ou
nt
refo
rmt–
10.
051
0.10
5–0
.075
0.11
6–0
.10
50.
111
GD
P p
c t–1
0.13
60.
081
**0.
53
60.
201
***
0.6
520.
186
***
Tra
de
as
% o
f G
DP
t–1
0.39
00.
226
**0.
489
0.24
4**
0.4
00
0.19
2**
FD
I st
ock
s t–1
–0.1
23
0.15
00.
195
0.18
60.
183
0.17
5
Infl
atio
nt–
1–0
.058
0.0
41*
–0.0
79
0.073
–0.0
95
0.0
54
**
Em
plo
ym
en
t in
in
du
stry
t–1
–0.1
140.
07
7*
–0.1
93
0.0
93
**–0
.162
0.0
85
**S
ize
of
the
info
rma
l se
cto
r t–1
0.19
00.
22
30.
745
0.2
20**
*0.
995
0.24
9**
*S
ect
or
du
ali
smt–
10.
471
0.272
**0.
42
50.
25
0**
Hea
lth
an
d e
du
cati
on
ex
pen
dit
ure
t–1
0.0
83
0.13
50.
053
0.12
7S
oci
al
secu
rity
an
d w
elfa
re e
xp
en
dit
ure
t–1
0.13
10.
20
60.
014
0.0
94
Dem
ocr
acy
t–1
–2.1
77
0.6
85
***
–2.5
03
0.67
9**
*
Tra
de
refo
rm ×
Em
plo
ym
en
t in
in
du
stry
t–1
–0.4
140.
146
***
Inte
rcep
t0.
655
***
–1.1
22
***
–1.3
55
***
Lag
ged
dep
en
den
t v
ari
ab
le–0
.273
***
–0.2
63
***
–0.2
72
***
R2
0.3
40.
45
0.5
0N
140
140
140
Not
e: P
an
el-
corr
ect
ed
sta
nd
ard
err
or.
Mo
del
con
tain
s co
un
try
du
mm
ies,
no
t sh
ow
n i
n t
ab
le.
*p ≤
.1; **
p ≤
.0
5; *
**p
≤ .
01 (
on
e-t
ail
ed
te
st)
P6171.indb 94P6171.indb 94 7/16/13 10:49:39 AM7/16/13 10:49:39 AM
TRADE LIBERALIZATION, DEINDUSTRIALIZATION, AND INEQUALITY 95
-0.700
-0.600
-0.500
-0.400
-0.300
-0.200
-0.100
0.000
0.100
0.200
0 1 2 3 4 5 6 7 8 9 10 11 12 13 14 15 16 17 18 19 20
Time period
Em
plo
ymen
t in
Ind
ust
ry
Figure 3 Long-term effect of trade reform on employment in industry.
cally signifi cant and inversely related to employment in industry, which suggests
that membership in Mercosur is signifi cantly associated with the destruction of
industrial employment. On the contrary, for the analyzed period, membership in
NAFTA is signifi cantly associated with industrial employment generation, which
is consistent with the evidence from studies analyzing the short-term effect of the
maquila industry in Mexico (Jensen and Rosas 2007).
The other three predictors with statistically signifi cant long-term effects on
employment in industry are GDP per capita, infl ation, and sector dualism. GDP
per capita has a signifi cant negative effect on employment in industry. This is
consistent with Brady, Kaya, and Gereffi ’s (2011) fi ndings and suggests that, in the
context of strong liberalization of the economy, increasing worker productivity
has a signifi cant negative effect on industrial employment. The effect of infl a-
tion on employment in industry is statistically signifi cant. As the hyperinfl ation
was curved during the fi rst half of the 1990s, the destruction of employment in
industry intensifi ed. The fact that the sign of the relationship is positive has to
do with this simultaneous drop in both variables. Finally, higher values of sector
dualism, indicating the coexistence of a low-productivity traditional sector and
a high-productivity modern sector, are associated with higher levels of employ-
ment in industry destruction. This is consistent with a trade liberalization pat-
tern that benefi ted exporters of primary products over those of manufacturing
products.
Employment in Industry and Inequality
Having unveiled the association between trade liberalization and employment
in industry, the second stage of the analysis consists of assessing the relationship
between the deindustrialization process and income inequality. Models 4 and 5
suggest that there is a statistically signifi cant effect of employment in industry
on inequality. The sign of the effect is negative, which suggests that destruction
of this kind of employment is associated with an increase in inequality. Model 6
P6171.indb 95P6171.indb 95 7/16/13 10:49:39 AM7/16/13 10:49:39 AM

96 Latin American Research Review
-0.25
-0.20
-0.15
-0.10
-0.05
0.00
0.05
0.10
-1sd X +1sd
Mar
gina
l Effe
ct
Figure 4 Marginal effect of employment in industry on inequality for different levels of trade reform.
refi nes the analysis by adding an interaction term between trade liberalization
and employment in industry to test the hypothesis about the moderating effect
of trade liberalization on the relationship between the other two phenomena. The
interaction term belongs to the model.
Model 6 shows that the destruction of formal employment in the industrial
sector is signifi cantly associated with increased inequality in the long run. The
model shows that the destruction of formal employment in the industrial sec-
tor was detrimental to equality. As expected, the interaction term suggests that
the long-term effects of trade liberalization and level of employment in industry
on inequality are not independent of one another.17 As trade liberalization ad-
vanced, formal employment in industry shrank and its negative long-term effect
on inequality increased. Figure 4 shows how the marginal effect of employment
in industry on inequality becomes stronger and statistically signifi cant as trade
liberalization advances.
Therefore, the association between employment in industry and inequality
becomes signifi cant only as trade reform advances. Figure 5 shows the long-
term effect of employment in industry on inequality when trade reform is at its
mean, one standard deviation below its mean, and one standard deviation above
its mean. This suggests that the long-term effect of employment in industry on
inequality is almost inexistent when trade reform is at one standard deviation
below its mean.
The long-term effect of employment in industry on inequality when trade
liberalization is at its mean is statistically signifi cant (p ≤ .001). A decrease in
employment in industry will cause deviations from these two variables’ equi-
librium, thus causing inequality to be too low. In the short term, inequality will
increase by 0.52 points per each unit decrease in employment in industry. This
short-term relationship is also statistically signifi cant. Therefore, inequality will
17. For detailed explanation on calculation of interaction terms, in particular among continuous vari-
ables, see Brambor, Clark, and Golder (2005).
P6171.indb 96P6171.indb 96 7/16/13 10:49:39 AM7/16/13 10:49:39 AM

TRADE LIBERALIZATION, DEINDUSTRIALIZATION, AND INEQUALITY 97
Figure 5 Long-term effect of employment in industry on inequality for different levels of trade reform.
-0.600
-0.500
-0.400
-0.300
-0.200
-0.100
0.000
0.100
0 1 2 3 4 5 6 7 8 9 10
Time period
Ineq
ua
lity
-1 Std. Dev.
Mean
+1 Std. Dev.
respond in the long run by decreasing by a total of 0.276 points, spread over future
time periods at a rate of 27 percent per time period (see fi gure 5).
When trade liberalization is at one standard deviation above its mean, the re-
lationship between employment in industry and inequality becomes stronger. It
remains statistically signifi cant (p ≤ .001). At this level of trade reform, a unit
decrease in employment in industry will cause inequality to respond in the long
run by decreasing by a total of 0.574 points, spread over future time periods at a
rate of 27 percent per time period (see fi gure 5).
Consistent with these fi ndings, the increase in the size of the informal sector
of the economy is signifi cantly associated in the long run with increased inequal-
ity. For the seven analyzed countries and with infl uence of the other variables
held constant, a unit increase in employment in the informal sector as a share of
total employment is associated with a 0.99-point increase in the Gini index over
the long term. These results support the hypothesis that a change in inequality is
associated with changes in the structure of the labor market, through the dein-
dustrialization process during the period.
Increases in GDP per capita are signifi cantly associated in the long run with
increases in inequality. This result is consistent with Kuznets’s (1955) postulation
about the implausibility of developing economies being able to curve inequality
as the advanced industrial democracies did. Increases in trade are also statisti-
cally signifi cantly associated with increases in inequality in the long run, which is
consistent with the overall picture exposed in the analysis. Reduced infl ation (and
hyperinfl ation) over the period is associated with an increase in inequality in the
long run, which suggests that the reduction of the comparative advantages that
come from being a cheaper producer may have an effect on inequality as well. Fi-
nally, the long-term signifi cant effect of sector dualism on inequality is consistent
with the results in model 3, as well as with the hypothesis on the particular harm
of trade liberalization on those economies in the region that had further industri-
alized under the ISI model.
P6171.indb 97P6171.indb 97 7/16/13 10:49:40 AM7/16/13 10:49:40 AM

98 Latin American Research Review
Finally, but not less important, the strength of democracy is signifi cantly as-
sociated with inequality in the long run. As the democracy measure includes the
accumulated years under a democratic regime since 1945, it is intended to capture
the strength of democratic institutions and, consequently, the degree to which a
certain society has developed civil society organizations to represent and lobby
for their interests within the political system, particularly with the aim of social
protection. The model suggests that in the long run, a unit increase in years under
democracy is associated with a reduction of around 2.5 points in the Gini index.
These results are consistent with previous analyses, especially Huber and col-
leagues (2006), and are theoretically meaningful. In other words, in the long term,
a democratic environment tends to demand that leaders concern themselves with
the situation of the unprivileged.
CONCLUSION
This analysis aimed to shed light on the contested debate about the causal as-
sociation between trade liberalization and income inequality. The results suggest
that such a causal connection existed for the countries and period analyzed, and
they unveil the mechanism of deindustrialization as the causal link between the
two phenomena.
The analysis supports an overall negative picture of the effect of reforms toward
trade liberalization on income inequality. In other words, trade reform had a clear
detrimental effect on equality through its fostering of deindustrialization. How-
ever, trade liberalization was a necessary step to integrate domestic economies
into the global markets, and its effects were partly due to the implementation
strategy, which responded to the type of capitalism that reformist governments
and IFIs attempted to build: the reforms were sudden and lacked necessary ac-
companying increases in welfare safety nets.
Increases in inequality are better contained in democracies than in authoritar-
ian regimes. The results of this analysis undoubtedly support the theoretical claim
regarding the importance of democracy in shaping the distribution of welfare. In
the case of Latin America, a history of democracy matters for explaining the elite’s
incentives for redistribution. Over the long term, because the existence of demo-
cratic institutions predicts social integration, the longer the record of democracy
in a country, the stronger social institutions other than the state tend to be and the
more costly it is for politicians to engage in welfare-retrenching policies.
Overall, the emphasis of the neoliberal model on principles of effi ciency and
market competition over welfare spending and social protection was a politically
designed strategy. The worsening of the region’s already-skewed income distribu-
tion during the liberal reform years resulted from political decisions concerning
specifi c policy options and the specifi c model of capitalism that proponents of lib-
eralization favored. In particular, the Latin American version of this model failed
to formulate an alternative welfare structure for coping with the two most impor-
tant and predictable social consequences of its reforms: the deindustrialization
process and the consequential growth of the informal sector of the economy.
P6171.indb 98P6171.indb 98 7/16/13 10:49:40 AM7/16/13 10:49:40 AM

TRADE LIBERALIZATION, DEINDUSTRIALIZATION, AND INEQUALITY 99
While it is hardly debated that the ISI model had to be ousted, the form in
which the political economies analyzed here transitioned into the global market
reminds one of Polanyi’s or even Kuznets’s assessments about the perils of top-
down structural changes in highly unequal societies without strong democratic
institutions. This study and its implications for the study of policies and political
economies raise several questions for future research. Two questions are of par-
ticular interest. First, the region has grown in political and economic autonomy
in the post-neoliberal period, while transforming itself into a regional economic
center. Does regional integration then open a door to a regional product special-
ization in the manufacturing sector, with Brazil and its growing African mar-
ket as the main consumers? Second, is the region as such politically capable of
managing a process of sustainable reindustrialization? This question should be
addressed from the perspectives of domestic politics and the regional integration
process.
APPENDIX
Table A1 Fisher test with augmented Dickey-Fuller test (three lags)
χ2(14) Prob. > χ2
Gini index 15.466 0.491Trade reform 43.226 0.000Capital account reform 13.299 0.503GDP per capita 10.617 0.716Trade as % of GDP 6.603 0.949FDI stocks 0.778 1.000Infl ation 15.084 0.372Size of the informal sector 11.670 0.766Sector dualism 15.084 0.782Employment in industry 10.008 0.762Urban population 14.898 0.385Health and education expenditure 18.982 0.166Social security and welfare expenditure 9.452 0.801Unopposed regime 4.869 0.988Democracy 0.744 1.000
Note: The Fisher test combines the p values from N independent unit root tests, as developed by
Maddala and Wu (1999). Based on the p values for individual unit root tests, Fisher’s test assumes that
all series are nonstationary under the null hypothesis against the alternative that at least one series in
the panel is stationary.
P6171.indb 99P6171.indb 99 7/16/13 10:49:40 AM7/16/13 10:49:40 AM
Tabl
e A
2 M
ulti
colli
near
ity
diag
nosi
s: V
aria
nce
infl a
tion
fact
or (V
IF)
Mod
el 3
Mod
el 6
Va
ria
ble
VIF
1/V
IFV
ari
ab
leV
IF1/
VIF
Tra
de
as
% o
f G
DP
t–1
4.5
00.
22
Dem
ocr
acy
t–1
5.98
0.17
Urb
an
po
pu
lati
on
t–1
4.0
10.
25
Sect
or
du
ali
smt–
15.
79
0.17
Sect
or
du
ali
smt–
13.
97
0.2
5T
rad
e a
s %
of
GD
Pt–
14.8
70.
21F
DI
sto
cks t
–13.
89
0.26
Lag
ged
dep
en
den
t v
ari
ab
le4.8
40.
21M
erco
sur
du
mm
yt
3.2
50.
31T
rad
e re
form
t–1
4.7
30.
21
GD
P p
er c
ap
ita t
–13.
02
0.3
3∆
dem
ocr
acy
4.5
50.
22
Un
op
po
sed
reg
ime
t–1
2.9
70.
34
So
cia
l se
curi
ty a
nd
wel
fare
ex
pen
dit
ure
t–1
4.3
60.
23
∆ U
rba
n p
op
ula
tio
n2
.87
0.35
FD
I st
ock
s t–1
4.2
50.
24L
ag
ged
dep
en
den
t v
ari
ab
le2
.55
0.39
Siz
e o
f th
e in
form
al
sect
or t
–13.
86
0.26
Tra
de
refo
rmt–
12
.52
0.4
0E
mp
loy
men
t in
in
du
stry
t–1
3.57
0.28
Infl
atio
nt–
12
.27
0.4
4G
DP
per
cap
ita t
–13.
210.
31
Na
fta
du
mm
yt
2.0
10.
50
Tra
de
refo
rm ×
em
plo
ym
en
t in
in
du
stry
t–1
3.02
0.3
3C
ap
ita
l acc
ou
nt
refo
rmt–
11.
99
0.5
0C
ap
ita
l a
cco
un
t re
form
t–1
2.9
20.
34
IMF
du
mm
yt
1.76
0.57
Infl
atio
nt–
12
.73
0.37
∆ F
DI
sto
cks
1.69
0.59
∆ G
DP
pc
2.4
50.
41
∆ G
DP
pc
1.58
0.6
3H
ea
lth
an
d e
du
cati
on
pu
bli
c ex
pt–
12
.26
0.4
4
∆ I
nfl
atio
n1.
55
0.6
4∆
Siz
e o
f th
e in
form
al
sect
or
2.0
20.
50
∆ T
rad
e re
form
1.3
80.
72
∆ F
DI
sto
cks
1.79
0.56
∆ T
rad
e a
s %
of
GD
P1.
370.
73
∆ E
mp
loy
men
t in
in
du
stry
1.74
0.57
∆ U
no
pp
ose
d r
egim
e1.
26
0.8
0∆
In
fl at
ion
1.74
0.58
∆ S
ect
or
du
ali
sm1.
25
0.8
0∆
Tra
de
refo
rm ×
Em
plo
ym
en
t in
in
du
stry
1.
53
0.6
5
∆ C
ap
ita
l a
cco
un
t re
form
1.
23
0.81
∆ C
ap
ita
l a
cco
un
t re
form
1.
510.
66
∆ T
rad
e a
s %
of
GD
P1.
45
0.69
∆ T
rad
e re
form
1.4
20.
70
∆ S
ect
or
du
ali
sm1.
370.
73
∆ H
ea
lth
an
d e
du
cati
on
pu
bli
c ex
pen
dit
ure
1.2
50.
80
∆ S
oci
al
secu
rity
an
d w
elfa
re e
xp
en
dit
ure
1.20
0.8
3
∆ H
ea
lth
an
d e
du
cati
on
pu
bli
c ex
pen
dit
ure
1.26
0.8
0
∆ S
oci
al
secu
rity
an
d w
elfa
re e
xp
en
dit
ure
1.2
30.
81
Mea
n V
IF2
.40
2.9
8
P6171.indb 100P6171.indb 100 7/16/13 10:49:40 AM7/16/13 10:49:40 AM

Table A3 Heteroskedasticity diagnosis: Breusch-Pagan/Cook-Weisberg test
χ2(1) Prob. > χ2
Model 3 1.680 0.195Model 6 1.890 0.169
H0: Constant variance
-.5
-.1
0
.5
1
Res
idua
ls
-.6 -.4 -.2 0 .2 .4Fitted values
-.4
-.2
0
.2
.4
Res
idua
ls
-.3 -.2 -.1 0 .1 .2Fitted values
Figure A1 Stage 1 models: Fitted values versus residuals.
Figure A2 Stage 2 models: Fitted values versus residuals.
P6171.indb 101P6171.indb 101 7/16/13 10:49:40 AM7/16/13 10:49:40 AM
102 Latin American Research Review
REFERENCES
Aedo, C., and L. Lagos1984 “Protección efectiva en Chile, 1974–1979.” Documento de Trabajo No. 94, Instituto
de Economía, Universidad Católica de Chile, Santiago.Alderson, Arthur S., and François Nielsen
1999 “Income Inequality, Development, and Dependence: A Reconsideration.” American Sociological Review 64 (4): 606–631.
Appel, Hilary2000 “The Ideological Determinants of Liberal Economic Reform: The Case of Privatiza-
tion.” World Politics 52 (4): 520–549.Beck, Nathaniel, and Jonathan N. Katz
1995 “What To Do (and Not To Do) with Time-Series Cross-Section Data.” American Po-litical Science Review 89 (3): 634–647.
1996 “Nuisance vs. Substance: Specifying and Estimating Time-Series Cross-Section Models.” Political Analysis 6 (July): 1–37.
Beyer, Harald, Patricio Rojas, and Rodrigo Vergara1999 “Trade Liberalization and Wage Inequality.” Journal of Development Economics 59 (1):
103–123.Bhagwati, Jagdish, and Ricardo Martin
1980 “Un enfoque sobre estrategias de comercio internacional y sus incidencias sobre el empleo y el crecimiento económico.” In ¿Se puede superar la pobreza? Realidad y perspectivas en América Latina. Santiago, Chile: Comisió n Econó mica para Amé rica Latina and Programa de las Naciones Unidas para el Desarrollo.
Bogliaccini, Juan Ariel, and Fernando Filgueira2011 “Capitalismo en el Cono Sur de América Latin luego del fi nal del Consenso
de Washington: ¿notas sin partitura?” Revista del CLAD Reforme y Democracia 51: 24–56.
Brady, David, Yunus Kaya, and Gary Gereffi 2011 “Stagnating Industrial Employment in Latin America.” Work and Occupations 38 (2):
179–220.Brambor, Thomas, William Roberts Clark, and Matt Golder
2005 “Understanding Interaction Models: Improving Empirical Analyses.” Political Analysis 14 (1): 63–82.
Brune, Nancy, Geoffrey Garrett, and Bruce Kogut2004 “The International Monetary Fund and the Global Spread of Privatization.” Interna-
tional Monetary Fund Staff Papers 51 (2): 195–219.Bulmer-Thomas, Victor, ed.
1996 The New Economic Model in Latin America and Its Impact on Income Distribution and Poverty. London: Institute of Latin American Studies, University of London.
Cardoso, Fernando Henrique, and Enzo Faletto1979 Dependency and Development in Latin America. Berkeley: University of California
Press.Chinn, Menzie D., and Hiro Ito
2008 “A New Measure of Financial Openness.” Journal of Comparative Policy Analysis 10 (3): 309–322.
Collier, Ruth Berins, and David Collier1991 Shaping the Political Arena: Critical Junctures, the Labor Movement, and Regime Dynam-
ics in Latin America. Princeton, NJ: Princeton University Press.De Boef, Suzanna, and Luke Keele
2008 “Taking Time Seriously.” American Journal of Political Science 52 (1): 184–200.Díaz-Cayeros, Alberto, and Beatriz Magaloni
2001 “Party Dominance and the Logic of Electoral Design in Mexico’s Transition to De-mocracy.” Journal of Theoretical Politics 13 (3): 271–293.
Drezner, Daniel W.2001 “Globalization and Policy Convergence.” International Studies Review 3 (1):
53–78.
P6171.indb 102P6171.indb 102 7/16/13 10:49:40 AM7/16/13 10:49:40 AM

TRADE LIBERALIZATION, DEINDUSTRIALIZATION, AND INEQUALITY 103
2007 All Politics Is Global: Explaining International Regulatory Regimes. Princeton, NJ: Prince ton University Press.
ECLAC (Economic Commission for Latin America and the Caribbean)1993 Social Panorama of Latin America. Santiago, Chile: ECLAC.2010 Social Panorama of Latin America. Santiago, Chile: ECLAC.
Enders, Walter2004 Applied Econometric Time Series. Hoboken, NJ: Wiley.
Escaith, Hubert, and Igor Paunovic2004 “Reformas estructurales en América Latina y el Caribe en el periodo 1970–2000.”
ECLAC. http://ssrn.com/abstract=1158491.Esping-Andersen, Gøsta
1990 The Three Worlds of Welfare Capitalism. Cambridge: Polity Press.Feenstra, Robert C., and Gordon H. Hanson
1997 “Foreign Direct Investment and Relative Wages: Evidence from Mexico’s Maquila-doras.” Journal of International Economics 42 (3): 371–393.
Filgueira, Carlos H., and Fernando Filgueira2002 “Models of Welfare and Models of Capitalism: The Limits of Transferability.” In
Models of Capitalism: Lessons for Latin America, edited by Evelyne Huber, 127–158. University Park: Pennsylvania State University Press.
Filgueira, Fernando, and Juan Ariel Bogliaccini2004 “Las reformas educacionales en Chile y Uruguay: Descentralización orientada
al mercado versus centralismo estatista.” In Descentralizació n y polí ticas sociales en Amé rica Latina, edited by Ricard Gomà and Jacint Jordana, 297–348. Barcelona: Cen-tre d’Estudis i Documentació Internacionals (CIDOB).
Gatica Barros, Jaime1989 Deindustrialization in Chile. Boulder, CO: Westview Press.
Goldthorpe, John H., ed.1984 Order and Confl ict in Contemporary Capitalism. Oxford, UK: Clarendon Press.
Hanson, Gordon H., and Ann Harrison1999 “Trade Liberalization and Wage Inequality in Mexico.” Industrial and Labor Relations
Review 52 (2): 271–288.Harvey, David
2005 A Brief History of Neoliberalism. New York: Oxford University Press.Heston, Alan, Robert Summers, and Bettina Aten
2009 Penn World Table Version 6.3. Center for International Comparisons of Production, Income and Prices at the University of Pennsylvania, August.
Honaker, James, and Gary King2007 “What to Do about Missing Values in Time Series Cross-Section Data.” http://gking
.harvard.edu/fi les/pr.pdf.Huber, Evelyne
1996 “Options for Social Policy in Latin America: Neoliberal versus Social Democratic Models.” In Welfare States in Transition: National Adaptations in Global Economies, ed-ited by Gøsta Esping-Andersen, 141–191. London: Sage.
2002 Models of Capitalism: Lessons for Latin America. University Park: Pennsylvania State University Press.
Huber, Evelyne, François Nielsen, Jenny Pribble, and John D. Stephens2006 “Politics and Inequality in Latin America and the Caribbean.” American Sociological
Review 71 (December): 943–963.Huber, Evelyne, and John D. Stephens
2001 Development and Crisis of the Welfare State: Parties and Policies in Global Markets. Chi-cago: University of Chicago Press.
ILO (International Labor Organization)1998 Labor Panorama. Geneva: ILO.2010 Online Database on Labor Statistics (LABORSTA). http://laborsta.ilo.org.
IMF (International Monetary Fund)2010a Government Finance Statistics Yearbook. New York: IMF.2010b International Financial Statistics Yearbook. New York: IMF.
P6171.indb 103P6171.indb 103 7/16/13 10:49:40 AM7/16/13 10:49:40 AM

104 Latin American Research Review
Iversen, Torben2005 Capitalism, Democracy, and Welfare. New York: Cambridge University Press.
Jensen, Nathan M., and Guillermo Rosas2007 “Foreign Direct Investment and Income Inequality in Mexico, 1990–2000.” Interna-
tional Organization 61 (2): 467–487.Kaufman, Robert R., and Alex Segura-Ubiergo
2001 “Globalization, Domestic Politics, and Social Spending in Latin America: A Time-Series Cross-Section Analysis, 1973–97.” World Politics 53 (4): 553–587.
Keohane, Robert1984 “The World Political Economy and the Crisis of Embedded Liberalism.” In Order
and Confl ict in Contemporary Capitalism, edited by John H. Goldthorpe, 15–38. Ox-ford, UK: Clarendon Press.
Kuznets, Simon1955 “Economic Growth and Income Inequality.” American Economic Review 45 (1):
1–28.Maddala, G. S., and Shaowen Wu
1999 “A Comparative Study of Unit Root Tests with Panel Data and a New Simple Test.” Oxford Bulletin of Economics and Statistics 61 (S1): 631–652.
Madrid, Raúl L.2005 “Ideas, Economic Pressures, and Pension Privatization.” Latin American Politics and
Society 47 (2): 23–50.Marjit, Sugata, and Rajat Acharyya
2003 International Trade, Wage Inequality and the Developing Economy: A General Equilibrium Approach. New York: Physica-Verlag.
Marjit, Sugata, Hamid Beladi, and Avik Chakrabarti2004 “Trade and Wage Inequality in Developing Countries.” Economic Inquiry 42 (2):
295–303.Morley, Samuel A.
2001 The Income Distribution Problem in Latin America and the Caribbean. Santiago, Chile: United Nations Press.
Morley, Samuel A., Roberto Machado, and Stefano Pettinato1998 Indexes of Structural Reform in Latin America. Reformas Económicas No. 12. Santiago,
Chile: United Nations Press.Mosley, Layna, and Saika Uno
2007 “Racing to the Bottom or Climbing to the Top? Economic Globalization and Collec-tive Labor Rights.” Comparative Political Studies 40 (8): 923–948.
Polanyi, Karl1944 The Great Transformation. Boston: Beacon Press.
Pontusson, Jonas2005 Inequality and Prosperity: Social Europe vs. Liberal America. Ithaca, NY: Cornell Uni-
versity Press.Portes, Alejandro, and Kelly Hoffman
2003 “Latin American Class Structures: Their Composition and Change during the Neo-liberal Era.” Latin American Research Review 38 (1): 41–82.
Portes, Alejandro, and Bryan R. Roberts2005 “The Free-Market City: Latin American Urbanization in the Years of the Neoliberal
Experiment.” Studies in Comparative Institutional Development 40 (1): 43–82.Prebisch, Raúl
1952 Problemas teóricos y prácticos del crecimiento económico. Santiago, Chile: Comisión Económica para América Latina y el Caribe. Reprinted in Cincuenta años de pen-samiento de la CEPAL, vol. 1. Santiago, Chile: ECLAC and Fundación de Cultura Económica, 1998.
Rueschemeyer, Dietrich, Evelyne Huber Stephens, and John D. Stephens1992 Capitalist Development and Democracy. Chicago: University of Chicago Press.
Schneider, Ben Ross, and David Soskice2009 “Inequality in Developed Countries and Latin America: Coordinated, Liberal and
Hierarchical Systems.” Economy and Society 38 (1): 17–52.
P6171.indb 104P6171.indb 104 7/16/13 10:49:40 AM7/16/13 10:49:40 AM

TRADE LIBERALIZATION, DEINDUSTRIALIZATION, AND INEQUALITY 105
Segura-Ubiergo, Alex2007 The Political Economy of the Welfare State in Latin America: Globalization, Democracy,
and Development. New York: Cambridge University Press.Solt, Frederick
2009 “Standardizing the World Income Inequality Database.” Social Science Quarterly 90 (2): 231–242.
Spilimbergo, Antonio, Juan Luis Londoño, and Miguel Székely1999 “Income Distribution, Factor Endowments, and Trade Openness.” Journal of Devel-
opment Economics 59 (1): 77–101.UN Conference on Trade and Development
2009 Online Statistics Database. http://unctad.org/en/Pages/Statistics.aspx.United Nations Development Program
1995 Human Development Report. New York: UN Development Program.Welsch, Roy E., and Edwin Kuh
1977 “Linear Regression Diagnostics.” Working Paper No. 173, March 1977, National Bu-reau of Economic Research, Cambridge, MA.
Wibbels, Erik2006 “Dependency Revisited: International Markets, Business Cycles, and Social Spend-
ing in the Developing World.” International Organization 60 (2): 433–468.Williamson, Oliver E.
1985 The Economic Institutions of Capitalism: Firms, Markets, Relational Contracting. New York: Free Press.
Woods, Adrian1997 “Openness and Wage Inequality in Developing Countries: The Latin American
Challenge to East Asian Conventional Wisdom.” World Bank Economic Review 11 (1): 33–57.
World Bank2011 “World Development Indicators.” http://www.worldbank.org/data.
World Institute for Development Economics Research2008 World Income Inequality database. World Institute for Development Economics
Research, United Nations University. http://www.wider.unu.edu.
P6171.indb 105P6171.indb 105 7/16/13 10:49:40 AM7/16/13 10:49:40 AM