Trade Liberalization and Reallocation of Production An
25
Trade Liberalization and Reallocation of Production An Analysis of Indian Manufacturing Lawrence Edwards* University of Cape Town Asha Sundaram** University of Cape Town Draft: August 2012 Abstract In this paper, we look at the impact of the removal of the Multifibre Agreement quotas on reallocation of market-share and prices charged by Indian textile firms. We employ a difference- in-differences estimation technique on firm-level data from India to find that this reduction in trade barriers was associated with an increase in sales of quota-restricted products relative to non-quota restricted textile products. These effects are robust to controlling for unobservable firm-specific shocks affecting outcomes. Results also suggest that the MFA quota removal was associated with reallocation of market-share towards low-price products. Also, the price decrease associated with quota-removal was greater for low-price products, consistent with quality downgrading by firms in the presence of quotas. Results also indicate that these effects operate through the extensive margin, through product switching by firms. Our study highlights the role of distortions induced by trade barriers in developing countries in determining the allocation of production. JEL codes: F10, F13, L11, O14, O24 Keywords: Quotas, Quality Upgrading, Firm Behavior, Market Distortions, Welfare ------------------------------------------------------------ *School of Economics, University of Cape Town, Rondebosch, Cape Town 7701, South Africa. Email: [email protected] Phone: +27 (0)21 650 2722 ** School of Economics, University of Cape Town, Rondebosch, Cape Town 7701, South Africa. Email: [email protected] Phone: +27 (0)21 650 2730 We would like to thank Amit Khandelwal for assistance with CMIE Prowess data. We are also grateful to Alastair Codrington for excellent research assistance. All errors and omissions remain our own.
Transcript of Trade Liberalization and Reallocation of Production An
Trade Liberalization and Reallocation of Production An Analysis of Indian Manufacturing
Lawrence Edwards* University of Cape Town
Asha Sundaram** University of Cape Town
Draft: August 2012
Abstract
In this paper, we look at the impact of the removal of the Multifibre Agreement quotas on
reallocation of market-share and prices charged by Indian textile firms. We employ a difference-
in-differences estimation technique on firm-level data from India to find that this reduction in
trade barriers was associated with an increase in sales of quota-restricted products relative to
non-quota restricted textile products. These effects are robust to controlling for unobservable
firm-specific shocks affecting outcomes. Results also suggest that the MFA quota removal was
associated with reallocation of market-share towards low-price products. Also, the price
decrease associated with quota-removal was greater for low-price products, consistent with
quality downgrading by firms in the presence of quotas. Results also indicate that these effects
operate through the extensive margin, through product switching by firms. Our study highlights
the role of distortions induced by trade barriers in developing countries in determining the
allocation of production.
JEL codes: F10, F13, L11, O14, O24
Keywords: Quotas, Quality Upgrading, Firm Behavior, Market Distortions, Welfare
------------------------------------------------------------
*School of Economics, University of Cape Town, Rondebosch, Cape Town 7701, South Africa. Email: [email protected] Phone: +27 (0)21 650 2722 ** School of Economics, University of Cape Town, Rondebosch, Cape Town 7701, South Africa. Email: [email protected] Phone: +27 (0)21 650 2730 We would like to thank Amit Khandelwal for assistance with CMIE Prowess data. We are also grateful to Alastair Codrington for excellent research assistance. All errors and omissions remain our own.
1. Introduction
The Multifibre Arrangement (MFA) on Textile and Clothing (T&C) institutionalized
quotas on cotton textiles and apparel products by countries like the United States and the United
Kingdom against Asian textile exporters in 1974. The motivation behind the arrangement was
for developed countries to seek a more systematic mechanism to deal with the continued growth
of textile and clothing exports from large Asian countries. The MFA quotas were negotiated on
four main MFA ‘groups’ of products spanning Yarn, Fabric, Made-Ups and Clothing.
Protection from textile and apparel imports extended over a 20 year period, until 1994 and the
singing of the Agreement on Textile and Clothing (ATC) under the Uruguay Round of
negotiations under the World Trade Organization, after which the process of phasing down
these import quotas began. The final phase down of the MFA/ATC (hereinafter MFA) quotas
occurred in 2005, when all quotas under this arrangement were abolished.
For labor-abundant countries like India and China with a comparative advantage in
labor-intensive products, the MFA quotas were binding on clothing and textile exports. India,
for example, exhibited a quota fill rate of 87 percent, next to only China and Bangladesh, who
both exhibit a quota fill rate of 88 percent (Brambilla, Khandelwal and Schott 2010).1 Thus, the
removal of MFA quotas allowed for improved access to developed markets for these large
developing exporters.
The effect of the removal of MFA quotas on prices and export volumes, however, is not
symmetrical across all products. Theoretically, a quota is analogous to a fixed cost added to the
price of a good – the specific tariff equivalent of quotas established by Falvey (1979). The
implication for import prices in the quota imposing country is twofold: (i) the prices of quota
restricted products rise, but (ii) the increase in price is strongest for relatively low priced varieties.
Quotas, therefore, shift home composition of quota constrained goods towards relatively high
priced varieties, i.e. quotas lead to quality upgrading.
The effect of the ending of the MFA on trade volumes and trade prices is well
established (Barrows and Harrigan 2009; Brambilla et al. 2009). Less studied is the impact on
1 Brambilla, Khandelwal and Schott (2007) look at the ‘adjusted base quota’, actual exports and quota fill
rates (defined as exports divided base quota) for major developing exporters of textile and clothing from 1984 through 2004 under the MFA/ATC. They define the adjusted base quota as the quota originally negotiated quota level at the start of an agreement term, adjusted for “flexibilities” that allow countries to borrow unused base quotas across MFA groups and years.

firm behavior in the quota restricted country. Yet, as argued by Melitz (2003), trade policy shocks
have heterogeneous effects on firms within industries. The aggregate trade response is a
combination of within-firm responses and between-firm shifts in the composition of output.
In this paper, we investigate the effect of the removal of the MFA/ATC (hereinafter
MFA) quotas on market-share and pricing behavior using firm-level data2. This focus is
important for various reasons. First, we are interested in studying the impact of a reduction in
trade barriers on firm behavior and the reallocation of production resulting from the absence of
this market distortion, an exercise that, we believe, has important implications for ascertaining
welfare gains. Second, we wish to test trade theory that predicts quality downgrading among
firms as a result of the removal of the MFA quotas. The ending of the MFA is useful in this
regard as it was an externally imposed reduction in trade barriers, and hence presents a suitable
opportunity to control for some of the endogeneity in trade policy.
We focus on India for two reasons. First, we are able to exploit firm-level panel data on
Indian textile firms that allows us to account for some of the firm-specific unobserved
heterogeneity driving outcomes and also selection into products. Second, we evaluate the impact
of the quota removal on the Indian textile industry, an industry accounting for a sizeable share of
manufacturing in a large developing economy3. The firm-level data base that we use contains
data on publicly listed firms that account for about 60 to 70 percent of the economic activity in
the organized industrial sector in India. The database has information on sales and quantities of
1,918 products produced by each textile firm over the period 2002 through 2008.
The detailed product level information allows us to explore the differential impact of the
MFA on quota restricted and non-restricted products within the firm. We are hence able to
adopt a difference-in-differences estimation technique that looks at differential sales and unit-
values (our measure of price) of products that were subject to quotas and those that were not,
before and after 2005, to identify the effect of the removal of quotas on firm behavior. This
empirical strategy allows us to control for demand and supply side unobservable shocks such as
changing consumer preferences and changes in technology or the policy environment that might
affect firm behavior.
2 We note that what we measure here is the net effect from the MFA quota phase down, including the effect of the surge in Chinese (and other major developing exporter) textile and clothing exports. 3 The textile industry in India accounted for 21 percent of manufacturing employment and 8 percent of manufacturing value added in 2005-06 (see report on ‘Productivity and Competitiveness of Indian Manufacturing Sector: Textiles and Garments’, 2010)

This study relates to the literature using micro data to look at the impact of trade
liberalization on firm behavior (Pavcnik, 2002, Goldberg, Khandelwal, Pavcnik and Topalova,
2010), and in general, market distortions on firm behavior, focusing both on the intensive
margin (Hsieh and Klenow, 2009, Dollar and Wei, 2007, Petrin and Sivadasan, 2010) and the
extensive margin (Khandelwal, Schott and Wei, 2011). We also contribute to the literature on
the evidence for quality upgrading brought about by an import quota (Feenstra, 2005).
Khandelwal, Schott and Wei, 2011 look specifically at productivity gains to China from
the MFA quota phase-down and decompose it into gains from removal of the trade barrier and
gains from the removal of export licensing under the MFA quotas, using trade data on exports
by firm at the firm, product and destination level. They find that almost half of the overall
productivity gain among Chinese exporters following quota removal was due to the elimination
of the quota licensing institution. They also find evidence for price declines associated with
quota removal in the extensive margin, driven by entry of low-priced exporters, consistent with
quality downgrading. However, on probing further, they find that evidence for quality
downgrading in the Chinese case is weak, not robust to the inclusion of country-product pair
effects, and inconsistent with results on productivity effects of the quota removal derived from
an alternate firm-level production database.
While our data, unlike theirs, does not allow us to distinguish between export and
domestic sales, we are able to use sales and price data at the product level for each firm, thereby
enabling us to use a difference-in-differences estimation strategy to analyze the impact of the
MFA quota removal. Also, our firm-level data contain production data, including information
on inputs at the firm level, which can then allow us to analyze reallocation effects across firms of
differing productivity levels using a similar difference-in-differences strategy4.
We find that this reduction in trade barriers was associated with an increase in sales of
quota-restricted products relative to non-quota restricted textile products. The magnitude of
these effects suggests that quota removal was associated with an increase in sales of about 20
percent. We find that these effects are robust to controlling for unobservable firm-specific
shocks affecting outcomes. We, however, find that the evidence for a price effect of the MFA
4 We are currently endeavouring to look at such reallocation effects across firms of varying productivity
levels.

quota removal is relatively weak. Our results also suggest that the MFA quota removal was
associated with reallocation of market-share towards low-price products. Also, evidence suggests
that the price decrease associated with quota-removal was greater for low-price products,
consistent with quality downgrading by firms in the presence of quotas. Results also indicate
that these effects primarily operate through the extensive margin, through product switching by
firms.
2. Quotas and Quality Upgrading
The ‘non-equivalence’ of import quotas and tariffs is well established (Bhagwati, 1965;
Krishna, 1989). Like tariffs, binding quotas raise the price of constrained goods relative to
unconstrained goods. This holds in both competitive and imperfectly competitive markets.
Unlike, tariffs, however, quotas give rise to additional distortions. The upgrading of quality in
response to a quota is one such effect.
There are two avenues through which quality upgrading occurs: shifts in the composition
of demand towards higher priced import varieties, or the addition of improved characteristics in
each variety (Feenstra, 2004). Our focus is on the former effect.
As is well established, the price effect of a quota is equivalent to that of a specific tariff
Falvey (1979). The implication for import prices in the quota imposing country is twofold: (i)
the prices of quota restricted products rise, but (ii) the increase in price is strongest for relatively
low priced varieties. Consumer’s respond to relative price changes, and shift consumption
towards the relatively high priced variety.
To see this formally, we use the framework provided in Feenstra (2004). Assuming CES
demand and utility functions, consumers choose consumption of product varieties with
characteristics and prices , . Also, cost of producing variety is given by
where costs do not depend on the level of output. Consider an exporting firm operating
under a quota. This firm maximizes:
∑
∑ (2.1)
where the second part of the equation represents the quota constraint.

Prices are determined for each by:
(2.2)
where is the markup charged on all products sold by the firm and is assumed constant across
all products. The effect of the quota is to introduce a dollar price increase of to the price. It
hence acts as a ‘specific’ price increase across products. If two products are sold by the firm and
, then in the absence of the quota, and hence product 1 is the
more expensive product. However, in the presence of the quota, the new price ratio becomes:
= (2.3)
This indicates a relative price change in favor of the high-price variety, product 1.
Quotas therefore lead to quality upgrading. The effect is analogous to the Alchian-Allen’s
Washington Apples effect where per unit transport costs raise the relative price of the low priced
variety and hence induce the export of relatively higher priced and higher quality apples (see
Hummels and Skiba, 2004).
Our expectation is therefore that the removal of the MFA quotas raises exports of quota
restricted products (relative to non-restricted products), but that the impact is strongest in low
price varieties. Similarly, we expect the unit values of quota restricted products to fall, with
relatively strong declines in low unit-value products.
3. Empirical Specification
3.1 Impact of quota removal on sales and unit-values
We employ a difference- in-difference strategy to examine the impact of the removal of
the MFA quotas in 2005 at the firm level. Hence, we focus on the differential sales and unit
values of quota restricted products (or bound products) produced by firms relative to
unrestricted (or unbound products) before and after the MFA quota was lifted in 2005. Our
basic specification is hence

(3.1.1)
where refers to the outcome variable, log of sales or log of the unit-value (or price) of
product , firm at time , is a dummy variable that equals 1 if the product is quota-
restricted and zero if not, is a dummy variable that equals 1 if the year is greater than or
equal to 2006 (our firm level data records run from March of the previous year through April of
the current year) and is the idiosyncratic error term5. The coefficient β3 captures the
differential effect on the outcome variable in quota-restricted products after the quota was
removed. In other words, it is the difference-in-differences estimates of the effect of the quota
on the outcome. We expect β3 >0 where sales is the outcome variable and β3 <0 where the unit-
value (price) is the outcome variable. This captures the increase in market-shares and a fall in
prices of quota-restricted products with quota removal.
Next, we refine our specification by controlling for unobserved firm-specific shocks in
firm outcomes. For instance, one concern is that particular firm types select into production of
quota-restricted products and that the factors determining such selection are unobserved. This
would then lead to inconsistent estimates of the effect of the quota removal. Since we have firm
level data, we can control for such factors such as long as they are time-invariant, using firm
fixed effects. We hence estimate
(3.1.2)
The difference-indifference coefficient once again captures the effect of the quota
removal. This specification now includes a firm by product fixed effect. This includes a firm-
specific effect and product fixed effect. Finally, we estimate an unrestricted specification, where
we only exploit within-firm, cross product variation between quota bound and unbound
products to identify the effect of the MFA quota removal. We hence estimate:
(3.1.3)
5 We do not estimate 3.1.1 for unit-value as the dependent variable since quantities are not comparable
across products. Hence, we only estimate specifications that include product fixed effects.

3.2 Quota removal and Quality downgrading
Next, we look for evidence consistent with quality downgrading subsequent to quota
removal. To do this, we estimate the basic specification:
(3.2.1)
where is the average price of product produced by firm before the quota removal. Hence,
this specification is restricted to firm by product combinations that exist for at least one year
before the MFA quota was lifted in 2005. Again, we estimate 3.2.1 for both sales and price as the
outcome variable. In the sales estimation, we interpret a negative coefficient on to be
indicative of evidence for quality downgrading with quota removal. Hence, a negative would
imply that the increase in the market share of quota-restricted products with quota removal was
greater for low-priced products. In the price estimation, we interpret a positive coefficient on
to be consistent with quality downgrading. In other words, we expect relatively larger declines in
the price of low-priced products.
We also estimate (3.2.1) with firm by product fixed effects and firm by time and product
fixed effects. Here, we note that while a negative is consistent with quality downgrading by
firms post quota removal, it is possible that if price is a proxy for firm productivity. Then what
we capture by estimating 3.2.1 is the effect of the MFA quota removal on reallocation of market-
share towards low-productivity firms. Tying the evidence more closely to quality downgrading
would hence require a careful study of reallocation across firms of heterogeneous productivity
levels. This is an ongoing effort with this paper.
Finally, to tease out the intensive margin effect from the extensive margin effect, we
estimate all our specifications by restricting our sample to firm by product combinations that
existed for two years before quota removal (in 2004 and 2005) and for two years after quota
removal (in 2006 and 2007). Looking at a balanced panel like this allows us to isolate the
intensive margin effects. We also estimate our key specifications with the outcome variable as a
dummy variable which takes the value of 1 if a firm by product pair records positive sales in a
given year and zero otherwise. This helps us capture the effects of the quota removal on the

likelihood of a product being produced by a firm, in other words, the external margin of
adjustment.
4. Data
We use firm-level data from the Prowess database of the Center for Monitoring the
Indian Economy (CMIE). Firms are required by the 1956 Companies Act to disclose product-
level information on capacities, production and sales in their annual reports that CMIE compiles
into the Prowess database. The firm level data are captured from annual income statements and
balance sheets of about 9500 publicly listed companies, of which roughly 5000 are in the
manufacturing sector. The companies in the database together comprise 60 to 70 percent of the
economic activity in the organized industrial sector.
The Prowess database is the primary Indian database that allows for detailed, annual,
information on firms’ product mix and variables such as sales, production and capacity. Using
this database, we are able to exploit firm-specific production information and product level sales
and quantities sold for each firm, to explore inter and intra firm dynamics resulting from the
MFA quota removal. We use data for the period 2002 through 2008 and focus on textile and
clothing manufacturing firms. Export data is available through the Prowess database, however,
CMIE does not compile export data at the product level. We hence focus on the data on sales
and unit – values as a measure of price, which we construct using information on product
quantities sold. In our final sample, we have 922 textile and clothing firms in our sample and
1,918 unique products, out of which about 22 percent are quota restricted (see discussion below).
The ideal way to pursue our difference-in-differences estimation strategy would be to
classify each of our unique products into quota constrained and unconstrained and look at
differential patterns in outcomes across these two product groups before and after 2005. This
would be possible if Prowess products could be linked to HS ten digit codes which could then
be linked to quota information from US Customs and Border Protection. Unfortunately, the
nature of our data does not allow us to classify products in such a clean manner. We detect
significant measurement error in the Prowess classification of products, especially in certain key
Textile and Clothing groups like Garments and Cotton Fabrics and Cloth. While Garments are
further classified in Prowess into 14 products, most firms are documented as producing 3 to 4 of
these products. These 3 to 4 products that account for almost all firm output are called generic
and overarching product names like ‘Readymade Garments’ or ‘Textile Garments’. Similarly,
though Fabrics and Cloth is further broken down into 28 products, most firms are documented
as producing about 4 of these products. Appendix A provides distributions of products reported
by firms in Garments and Cotton Fabrics and Cloth. It is evident that products are bunched at
between 3 and 4 products within these Textile and Clothing groups.
Given this feature of the data, we adopt a method of broadly classifying Textile and
Clothing groups as quota restricted or unrestricted. The U.S Office of Textile and Apparel
(OTEXA) monitored trading partners’ compliance with the MFA and ATC quotas. OTEXA
make use of U.S. partners Expired Performance Reports and records quota fill rates for each
MFA quota category in Textiles and Clothing for years 1984 through 2004. Information is also
available on the HS (Harmonized System of product classification) 10 digit product codes in
each MFA quota category. Brambilla, Khandelwal and Schott (2010) list average fill rates for
products in 10 of the largest OTEXA MFA categories for China, India and Bangladesh (Table
8). India’s quota fill rates exceed 70 percent in the categories of Cotton Sheeting Fabric, Cotton
Printcloth Fabric, Non-knit Shirts, Cotton Trousers, and Trousers of Man-made Fibres.
Hence, in our data, we assign these products as quota restricted and assign all other
products as unrestricted products. Next, we are still left with product categories like ‘Readymade
Garments’ and ‘Apparel’ that we are unable to clearly classify as quota restricted or unrestricted
products. While some apparel products like cotton trousers had a fill rate of 98 percent,
garments like Underwear and Knit Shirts were subject to zero quotas. For the purposes of the
current study, we classify generic Garment and Apparel products and generic Cotton Fabrics as
quota constrained, while we leave other groups, mainly including Cotton Yarns as quota
unconstrained. In summary, our difference-in-differences strategy treats Garment and Apparel
products and Cotton Fabrics as quota restricted and all other Textile products as unrestricted
under the MFA quota regime6.
Figures 1, 2 and 3 use US trade data to look at trends in Indian exports of Textiles and
Clothing before and after 2005. Figure 1 that plots India’s share in US textile and clothing
imports reveals a jump in the year 2005 when the final MFA quotas were removed. Figure 2
looks at the composition of Indian textile and clothing exports to the US. It plots the percentage
6 We are currently exploring a strategy of using Indian trade data to arrive at weighted quota fill rates for
broad product groups in Textile and Clothing, which we believe will refine our current method of classification.

of Indian textile and clothing exports in various product categories over 2004 through 2007.
The figure reveals a jump in exports of apparel products, which were subject to heavy quotas,
and silk clothing. Focusing on Figure 3 that plots India’s share of total US imports in the key
textile and clothing categories, we find a jump in the year 2005 corresponding with the MFA
quota removal. In summary, the figures support the binding nature of MFA quotas on Indian
textile and clothing exports to the US. Table 1 provides mean sales values of textile and clothing
firms from Prowess for quota restricted and quota unrestricted products.
5. Results
5.1 The Impact of the Quota Removal on Sales and Unit-Values
Table 2(a) presents results for specifications 3.1.1, 3.1.2 and 3.1.3 with log of sales as the
explanatory variable. The coefficient on the difference-in-differences estimation coefficient from
column one, the basic specification, is positive as expected, though not statistically significant. In
column 2, we add firm by product and year fixed effects. The coefficient of interest is now
positive and statistically significant. Column 3 adds firm by time and product fixed effects and
only uses within firm and across product variation to identify the impact of the quota removal.
Again, the coefficient is positive and significant at the 10 percent level. Results indicate that the
removal of MFA quotas increased market share of quota restricted products by about 20
percent.
Table 2(b) presents results for specifications 3.1.2 and 3.1.3 with log of the unit-value as
the explanatory variable. Our hypothesis is that the difference-in-differences estimation
coefficient is negative since it indicates a fall in the price of previously quota constrained
products. Again, column 1 includes firm by product and year fixed effects while column 2 only
exploits within firm variation by including firm by time and product fixed effects. Results show
that the coefficient is indeed negative, as hypothesized, though it is not precisely estimated.
Next, we isolate the intensive and extensive margin effects of quota reform. First, we
restrict our sample to only those firm-product combinations that exist two years prior to and two
years after the year the quota was removed. Hence, we only consider those firm-product
combinations that exist from 2004 through 2007. We then estimate equations 3.1.1 through
3.1.2 on this new sample. Tables 3(a) and (b) present results for the log of sales and the log of

the unit-value as dependent variables respectively. From Table 3(a), we find that the coefficient
of interest is still positive and significant in column 1, but attenuated, at 16 percent, and
imprecisely estimated in column 2. From Table 3(b) we still find no evidence for the impact of
the quota removal on unit-values.
Next, we look at the external margin in Table 4. Here, we consider our sample from
2002 through 2008. We construct a balanced panel of all firm-product combinations in the data.
Our dependent variable is now a dummy variable that takes the value of one of a firm-product
combination reports positive sales and zero if it reports zero sales. Hence, we estimate
specifications 3.1.1 through 3.1.3 in a linear probability framework. We find that across all three
specifications, the difference-in-differences estimate is positive and statistically significant. This
result indicates that the quota removal was associated with greater likelihood of a quota-
constrained product being produced, providing evidence for a quota removal effect via the
extensive margin.
Overall, these results indicate that the MFA quota removal was associated with greater
market-share for quota-constrained products, and that this effect operated both through the
intensive and extensive margin. However, we are unable to find an effect of the MFA quota
removal on prices.
5.2 Quota Removal and Quality Downgrading
We now focus on looking for evidence consistent with quality downgrading associated
with the MFA quota removal. Tables 5(a) presents results for specification 3.2.1 with log of sales
as the dependent variable. Again, column 1 presents the basic estimation, while columns 2 and 3
add firm by product and year and firm by time and product fixed effects respectively. First, the
difference-in-differences coefficient is still positive and significant across all columns and
relatively stable at around 20 percent. Keying in on the triple interaction term, we find that it is
negative and significant, as hypothesized, in columns 1 and 2. This is consistent with our quality
downgrading hypothesis. It suggests that the increase in the market share of quota restricted
products was greater for low-priced products.
Moving on to the log of the unit-value as the dependent variable, Table 5(b) presents
results for estimation equation 3.2.1. Columns 1 and 2 present results for the baseline

specification including firm by product and year fixed effects in column 1 and firm by time and
product fixed effects in column 2. Focusing on the difference-in-difference coefficient, though
it is still negative, it is imprecisely estimated. The triple interaction term on the other hand, is
negative and statistically significant in column 1. This is inconsistent with our quality
downgrading hypothesis, since it would indicate that price declines were strongest for the high-
priced varieties.
However, this result flips in sign when we move to column 2, which only exploits within
firm and across product variation to identify the differential effect of the quota removal on quota
constrained versus unconstrained products. Here, the coefficient on the triple interaction term is
positive, as hypothesized, and statistically significant at the 10 percent level. This is consistent
with the quality downgrading hypothesis where price declines in quota removals are greater for
low-priced products. The qualitative difference in the results could stem from the fact that
results in column 1 do not account for unobserved, time-varying, firm specific shocks in pricing
behavior or selection into products that column 2 accounts for.
We then proceed to tease out the importance of the intensive and extensive margin
adjustments in quality downgrading. In Tables 6(a) and 6(b), we again restrict our sample to
those firm-product combinations that exist two years prior to and two years after the MFA quota
removal, and look at a balanced panel. From Tables 6(a) and 6(b) we find that this effect does
not seem to operate through the intensive margin. The triple interaction effects from Table 6(a)
are all statistically insignificant and also of the wrong sign. From Table 6(b), while column 1
looks similar to column 1 of Table 6(a), the positive and statistically significant coefficient on the
triple interaction term in column 2 now disappears. In summary, the results seem to suggest that
the quality downgrading effect operates primarily through the extensive and not the intensive
margin. This is reinforced by our results in Table 7.
Table 7 estimates equation 3.2.1 in the baseline (column 1), with firm by product and
year fixed effects (column 2)7. Again, the dependent variable is a dummy variable that equals 1 if
a product produced by a firm records positive sales. We consider a balanced panel for the years
2002-2008 that includes all firm-product combinations. Focusing on the triple interaction term,
we find that the coefficient is negative and statistically significant, indicating that the MFA quota
7 We omit column 3 with the firm by time and product fixed effects, in both Table 6(a) and Table 7, since
it did not yield significant results in our estimation on the full sample (Table 5(a)).
removal was associated with a higher probability of quota-constrained products being produced,
and that this effect was stronger for low-priced products, even via the extensive margin. In
conclusion, results suggest that in the extensive margin, evidence is consistent with the quality
downgrading story.
6. Conclusion
This study looks at the impact of a reduction in trade barriers, particularly the MFA
textile and clothing quotas, on reallocation of market shares across products in Indian
manufacturing firms. It finds that the MFA quota removal was associated with an increase in
market share of quota constrained products relative to unconstrained products, though evidence
of a price response is weak. Results seem to indicate that the extensive margin is relatively more
important in the adjustment to trade reform. The study also finds evidence consistent with
quality downgrading by textile firms in response to the quota removal.
The study throws some light on adjustment mechanisms of manufacturing firms in
developing economies to a reduction in trade barriers, and also highlights the role of market
distortions in reallocating resources across products of differing characteristics, like quality. We
believe that this can have potential implications for welfare. As a next step, we plan to focus on
reallocation across firms of heterogeneous productivity levels resulting from the MFA quota
removal. We believe that this will enable us to further consolidate evidence for the quality
downgrading hypothesis, while also informing us on the dynamics of resource allocation with
trade reform in a world of heterogeneous firms.
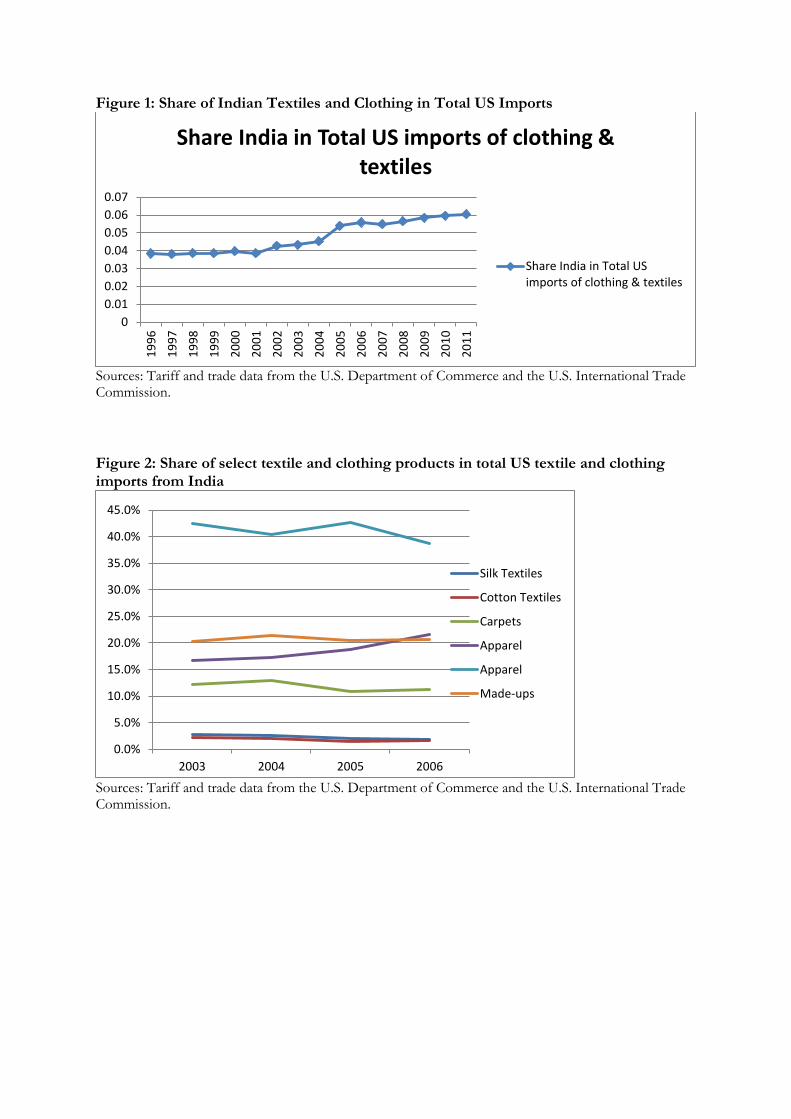
Figure 1: Share of Indian Textiles and Clothing in Total US Imports
Sources: Tariff and trade data from the U.S. Department of Commerce and the U.S. International Trade Commission.
Figure 2: Share of select textile and clothing products in total US textile and clothing imports from India
Sources: Tariff and trade data from the U.S. Department of Commerce and the U.S. International Trade Commission.
0
0.01
0.02
0.03
0.04
0.05
0.06
0.07
19
96
19
97
19
98
19
99
20
00
20
01
20
02
20
03
20
04
20
05
20
06
20
07
20
08
20
09
20
10
20
11
Share India in Total US imports of clothing & textiles
Share India in Total USimports of clothing & textiles
0.0%
5.0%
10.0%
15.0%
20.0%
25.0%
30.0%
35.0%
40.0%
45.0%
2003 2004 2005 2006
Silk Textiles
Cotton Textiles
Carpets
Apparel
Apparel
Made-ups
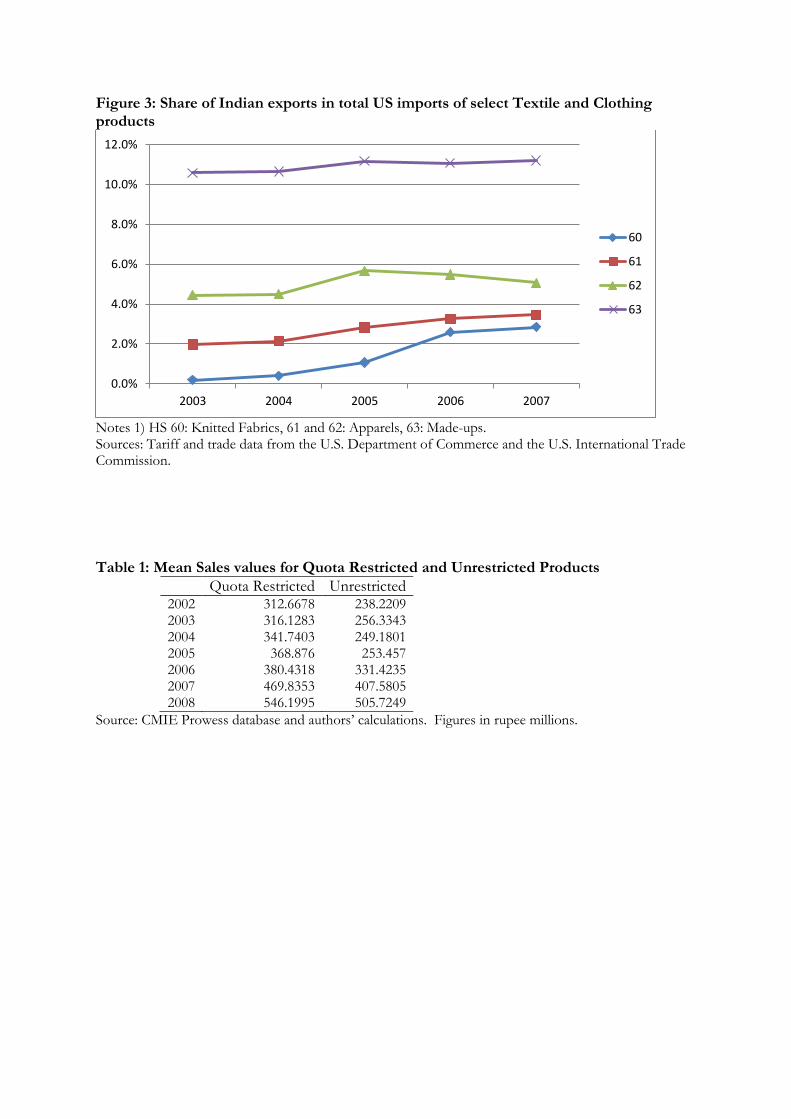
Figure 3: Share of Indian exports in total US imports of select Textile and Clothing products
Notes 1) HS 60: Knitted Fabrics, 61 and 62: Apparels, 63: Made-ups. Sources: Tariff and trade data from the U.S. Department of Commerce and the U.S. International Trade Commission.
Table 1: Mean Sales values for Quota Restricted and Unrestricted Products
Quota Restricted Unrestricted 2002 312.6678 238.2209 2003 316.1283 256.3343 2004 341.7403 249.1801 2005 368.876 253.457 2006 380.4318 331.4235 2007 469.8353 407.5805 2008 546.1995 505.7249
Source: CMIE Prowess database and authors’ calculations. Figures in rupee millions.
0.0%
2.0%
4.0%
6.0%
8.0%
10.0%
12.0%
2003 2004 2005 2006 2007
60
61
62
63

Table 2(a): Quota Removal and Market Share Effects
Ln(1+Sales) Ln(1+Sales) Ln(1+Sales)
Post MFA dummy 0.241*** 0.164*** (0.055) (0.050) Bound dummy -0.344*** -2.901 (0.080) (2.367) Post x Bound 0.087 0.196** 0.223* (0.120) (0.092) (0.119) Product Fixed Effects No No Yes Year Fixed Effects No Yes No Firm by Product Fixed Effects No Yes No Firm by Time Fixed Effects No No Yes Observations 7,964 7,964 7,964 R-sq 0.007 0.022 0.893 Note: 1) Robust standard errors in parentheses. 2) Post MFA dummy equals one if year is 2006 or after. 3) Bound equals one if the product belongs to garments or cotton fabrics.
Table 2(b): Quota Removal and Price Effects
Ln(Unit Value) Ln(Unit Value)
Post MFA dummy 0.106*** (0.028) Bound dummy 1.548 (1.169) Post x Bound -0.050 -0.014 (0.037) (0.059) Product Fixed Effects No Yes Year Fixed Effects Yes No Firm by Product Fixed Effects Yes No Firm by Time Fixed Effects No Yes Observations 7,964 7,964 R-sq 0.006 0.945 Note: 1) Robust standard errors in parentheses. 2) Post MFA dummy equals one if year is 2006 or after. 3) Bound equals one if the product belongs to garments or cotton fabrics.
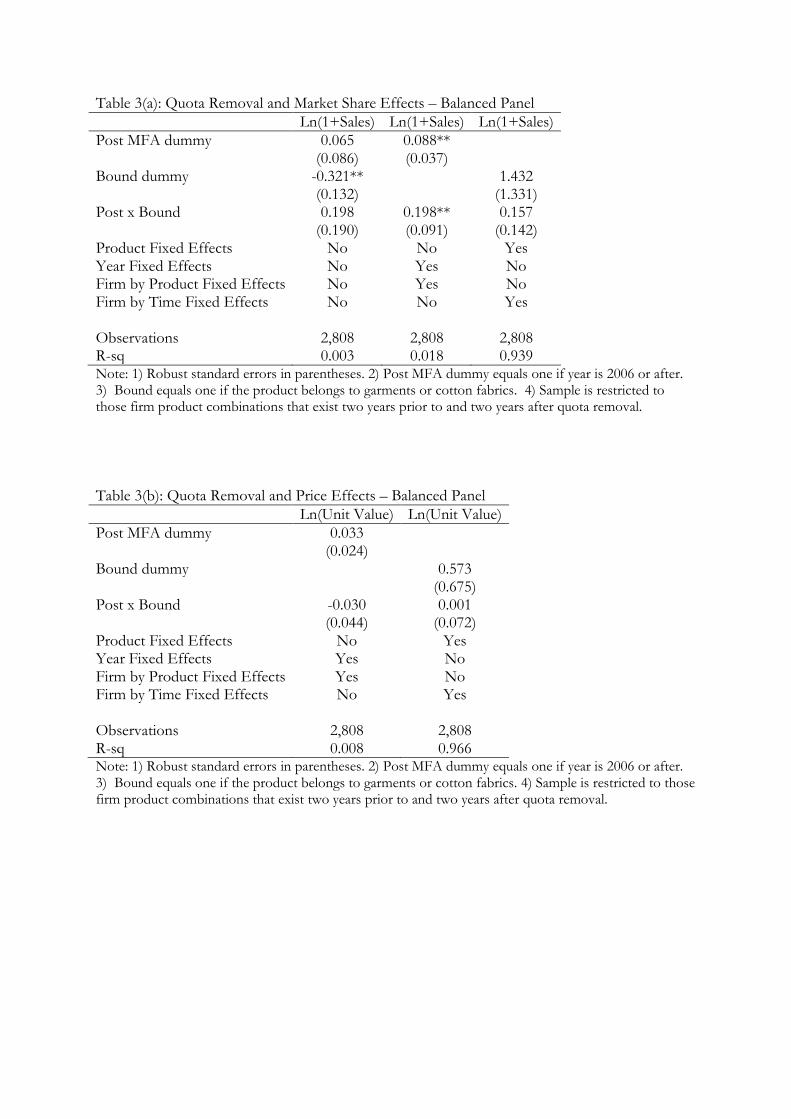
Table 3(a): Quota Removal and Market Share Effects – Balanced Panel
Ln(1+Sales) Ln(1+Sales) Ln(1+Sales)
Post MFA dummy 0.065 0.088** (0.086) (0.037) Bound dummy -0.321** 1.432 (0.132) (1.331) Post x Bound 0.198 0.198** 0.157 (0.190) (0.091) (0.142) Product Fixed Effects No No Yes Year Fixed Effects No Yes No Firm by Product Fixed Effects No Yes No Firm by Time Fixed Effects No No Yes Observations 2,808 2,808 2,808 R-sq 0.003 0.018 0.939 Note: 1) Robust standard errors in parentheses. 2) Post MFA dummy equals one if year is 2006 or after. 3) Bound equals one if the product belongs to garments or cotton fabrics. 4) Sample is restricted to those firm product combinations that exist two years prior to and two years after quota removal.
Table 3(b): Quota Removal and Price Effects – Balanced Panel
Ln(Unit Value) Ln(Unit Value)
Post MFA dummy 0.033 (0.024) Bound dummy 0.573 (0.675) Post x Bound -0.030 0.001 (0.044) (0.072) Product Fixed Effects No Yes Year Fixed Effects Yes No Firm by Product Fixed Effects Yes No Firm by Time Fixed Effects No Yes Observations 2,808 2,808 R-sq 0.008 0.966 Note: 1) Robust standard errors in parentheses. 2) Post MFA dummy equals one if year is 2006 or after. 3) Bound equals one if the product belongs to garments or cotton fabrics. 4) Sample is restricted to those firm product combinations that exist two years prior to and two years after quota removal.
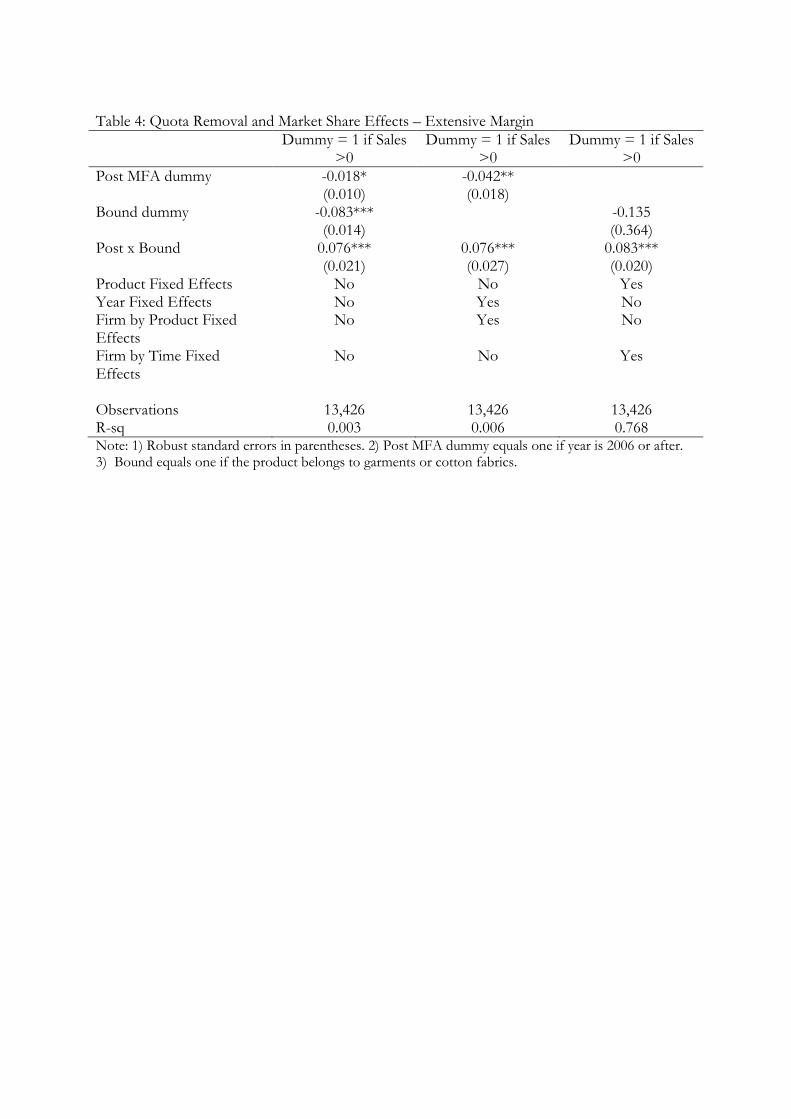
Table 4: Quota Removal and Market Share Effects – Extensive Margin
Dummy = 1 if Sales >0
Dummy = 1 if Sales >0
Dummy = 1 if Sales >0
Post MFA dummy -0.018* -0.042** (0.010) (0.018) Bound dummy -0.083*** -0.135 (0.014) (0.364) Post x Bound 0.076*** 0.076*** 0.083*** (0.021) (0.027) (0.020) Product Fixed Effects No No Yes Year Fixed Effects No Yes No Firm by Product Fixed Effects
No Yes No
Firm by Time Fixed Effects
No No Yes
Observations 13,426 13,426 13,426 R-sq 0.003 0.006 0.768 Note: 1) Robust standard errors in parentheses. 2) Post MFA dummy equals one if year is 2006 or after. 3) Bound equals one if the product belongs to garments or cotton fabrics.
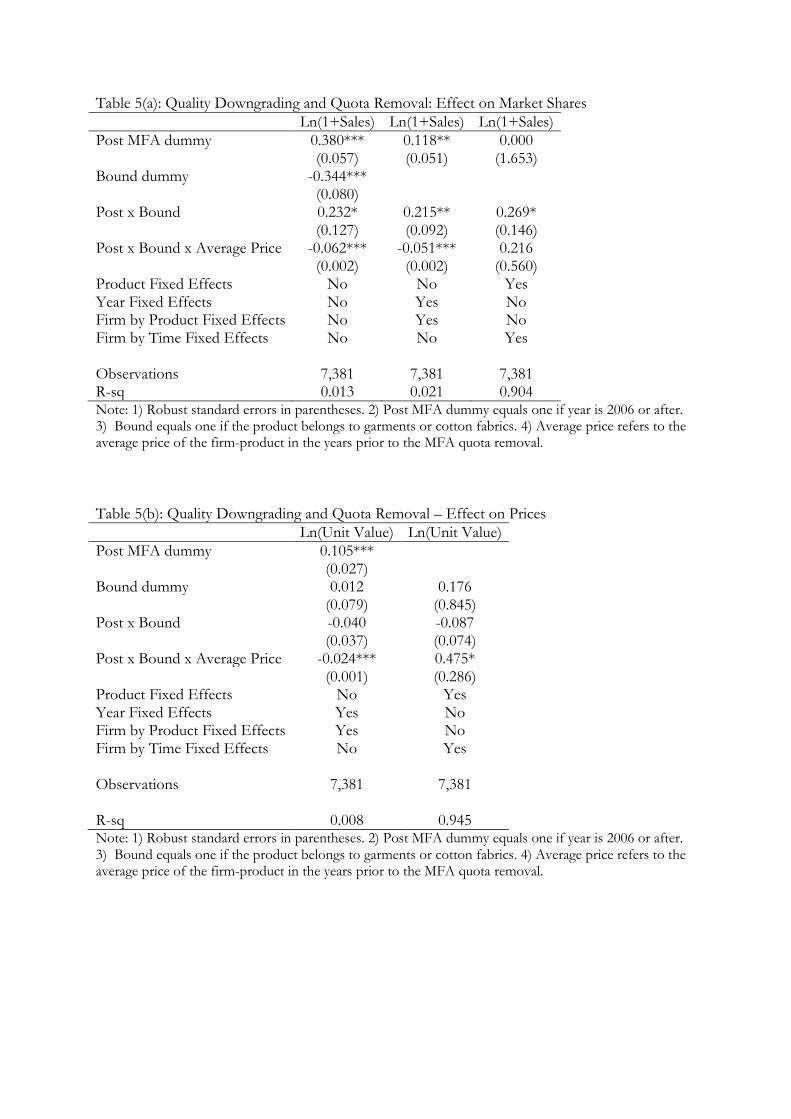
Table 5(a): Quality Downgrading and Quota Removal: Effect on Market Shares
Ln(1+Sales) Ln(1+Sales) Ln(1+Sales)
Post MFA dummy 0.380*** 0.118** 0.000 (0.057) (0.051) (1.653) Bound dummy -0.344*** (0.080) Post x Bound 0.232* 0.215** 0.269* (0.127) (0.092) (0.146) Post x Bound x Average Price -0.062*** -0.051*** 0.216 (0.002) (0.002) (0.560) Product Fixed Effects No No Yes Year Fixed Effects No Yes No Firm by Product Fixed Effects No Yes No Firm by Time Fixed Effects No No Yes Observations 7,381 7,381 7,381 R-sq 0.013 0.021 0.904 Note: 1) Robust standard errors in parentheses. 2) Post MFA dummy equals one if year is 2006 or after. 3) Bound equals one if the product belongs to garments or cotton fabrics. 4) Average price refers to the average price of the firm-product in the years prior to the MFA quota removal.
Table 5(b): Quality Downgrading and Quota Removal – Effect on Prices
Ln(Unit Value) Ln(Unit Value)
Post MFA dummy 0.105*** (0.027) Bound dummy 0.012 0.176 (0.079) (0.845) Post x Bound -0.040 -0.087 (0.037) (0.074) Post x Bound x Average Price -0.024*** 0.475* (0.001) (0.286) Product Fixed Effects No Yes Year Fixed Effects Yes No Firm by Product Fixed Effects Yes No Firm by Time Fixed Effects No Yes Observations 7,381
7,381
R-sq 0.008 0.945 Note: 1) Robust standard errors in parentheses. 2) Post MFA dummy equals one if year is 2006 or after. 3) Bound equals one if the product belongs to garments or cotton fabrics. 4) Average price refers to the average price of the firm-product in the years prior to the MFA quota removal.

Table 6(a): Quality Downgrading and Quota Removal: Effect on Market Shares, Balanced Panel
Ln(1+Sales) Ln(1+Sales)
Post MFA dummy 0.065 0.088** (0.086) (0.037) Bound dummy -0.321** (0.132) Post x Bound 0.047 0.062 (0.216) (0.113) Post x Bound x Average Price 0.923 0.831 (0.630) (0.653) Product Fixed Effects No No Year Fixed Effects No Yes Firm by Product Fixed Effects No Yes Firm by Time Fixed Effects No No Observations 2,808 2,808 R-sq 0.004 0.022 Note: 1) Robust standard errors in parentheses. 2) Post MFA dummy equals one if year is 2006 or after. 3) Bound equals one if the product belongs to garments or cotton fabrics. 4) Average price refers to the average price of the firm-product in the years prior to the MFA quota removal. 5) Sample is restricted to those firm product combinations that exist two years prior to and two years after quota removal.
Table 6(b): Quality Downgrading and Quota Removal – Effect on Prices, Balanced Panel
Ln(Unit Value) Ln(Unit Value)
Post MFA dummy 0.033 (0.024) Bound dummy 0.570 (0.676) Post x Bound 0.098 -0.007 (0.060) (0.089) Post x Bound x Average Price -0.782** 0.052 (0.394) (0.324) Product Fixed Effects No Yes Year Fixed Effects Yes No Firm by Product Fixed Effects Yes No Firm by Time Fixed Effects No Yes Observations 2,808 2,808 R-sq 0.013 0.966 Note: 1) Robust standard errors in parentheses. 2) Post MFA dummy equals one if year is 2006 or after. 3) Bound equals one if the product belongs to garments or cotton fabrics. 4) Average price refers to the average price of the firm-product in the years prior to the MFA quota removal. 5) Sample is restricted to those firm product combinations that exist two years prior to and two years after quota removal.

Table 7: Quality Downgrading and Quota Removal: Effect on Market Shares, Extensive Margin
Dummy = 1 if Sales >0 Dummy = 1 if Sales >0
Post MFA dummy -0.126*** -0.201*** (0.010) (0.017) Bound dummy -0.035** (0.014) Post x Bound 0.028 0.029 (0.023) (0.026) Post x Bound x Average Price -0.006*** -0.007*** (0.002) (0.001) Product Fixed Effects No No Year Fixed Effects No Yes Firm by Product Fixed Effects No Yes Firm by Time Fixed Effects No No Observations 11,347 11,347 R-sq 0.017 0.037 Note: 1) Robust standard errors in parentheses. 2) Post MFA dummy equals one if year is 2006 or after. 3) Bound equals one if the product belongs to garments or cotton fabrics. 4) Average price refers to the average price of the firm-product in the years prior to the MFA quota removal.

References:
Barrows G and James Harrigan (2009), ‘Testing the Theory of Trade Policy: Evidence from the Abrupt End of the Multifiber Arrangement’, The Review of Economics and Statistics, 91(2), 282-294. Bhagwati J N (1965), ‘On the Equivalence of Tariffs and Quotas’, in Baldwin, R.E. et al. (Eds), Trade, Growth and the Balance of Payments – Essays in Honor of G. Haberler, Rand McNally, Chicago, IL. Brambilla I, Khandelwal A K and Peter K. Schott (2010), ‘China's Experience under the Multi-Fiber Arrangement (MFA) and the Agreement on Textiles and Clothing (ATC)’, In Robert C. Feenstra and Shang-Jin Wei (editors) China's Growing Role in World Trade, National Bureau of Economic Research. Dollar D and Shang-Jin Wei (2007), ‘Das (Wasted) Kapital: Firm Ownership and Investment Efficiency in China’, NBER Working Paper 13103. Falvey R E (1979), ‘The Composition of Trade within Import-restricted Product Categories’, The Journal of Political Economy, 87(5) Part 1, 1105-1114. Feenstra R (2005), ‘Advanced International Trade: Theory and Evidence’, Princeton University Press, New Jersey. Goldberg P K, Khandelwal A K, Pavcnik N and Petia Topalova (2010), ‘Multiproduct Firms and Product Turnover in the Developing World: Evidence from India’, The Review of Economics and Statistics, 92(4), 1042-1049. Hsieh C and Peter J Klenow (2009), ‘Misallocation and Manufacturing TFP in China and India’, Quarterly Journal of Economics, CXXIV(4), 1403-1448. Hummels D and Alexandre Skiba (2004), ‘Shipping the Good Apples out? An Empirical Confirmation of the Alchian-Allen Conjecture’, The Journal of Political Economy, 112(6), 1384-1402. Khandelwal A, Schott P K and Shang-Jin Wei (2011), ‘Trade Liberalization and Embedded Institutional Reform: Evidence from Chinese Exporters’, mimeo, Columbia Business School, United States. Krishna K M (1989), ‘Trade restrictions as facilitating practices’, Journal of International Economics, 26, 251-270. Melitz M J (2003), ‘The Impact of Trade on Intra-Industry Reallocations and Aggregate Industry Productivity’, Econometrica, 71(6), 1695-1725. Pavcnik, N (2002), ‘Trade Liberalization, Exit, and Productivity Improvement: Evidence from Chilean Plants’, Review of Economic Studies, 69(1), 245-76. Petrin A and Jagadeesh Sivadasan (2010), ‘Estimating Lost Output from Allocative Inefficiency, with Application to Chile and Firing Costs’, mimeo, University of Michigan.

‘Productivity and Competitiveness of Indian Manufacturing Sector: Textiles and Garments’, Economic Services Group, National Productivity Council, New Delhi, July 2010, http://nmcc.nic.in/pdf/TextilesClothing_03July2010.pdf accessed on March 15, 2012.

Appendix A: Distribution of Product by Year Observations within ‘Garments’ and
‘Cotton Fabrics’ MFA Quota Groups
Source: Prowess Database, CMIE, 2002 through 2008
0
10
20
30
40
50
60
70
80
90
100
1 2 3 4 5 6 7 8 9 10 11 12 13 14 15 16 17 18 19 20 21 22 23 24 25 26 27 28
Cotton Fabric & Cloth
0
10
20
30
40
50
60
70
80
1 2 3 4 5 6 7 8 9 10 11 12 13 14
Garments