Trade in ideas - Swinburne University€¦ · Trade in Ideas: The Cross Flow of Ideas between...
21
1 Trade in Ideas: The Cross Flow of Ideas between Australia and the Rest of the World Associate Professor Russell Thomson & Professor Beth Webster* Centre for Transformative Innovation, Swinburne University of Technology March 2014 *This report was made with the assistance of funding from IP Australia. The Authors wish to thank Ben Mitra-Kahn, Philip Noonan and Richard Hayes fro their comments on earlier drafts.
Transcript of Trade in ideas - Swinburne University€¦ · Trade in Ideas: The Cross Flow of Ideas between...

1
Trade in Ideas: The Cross Flow of Ideas between Australia and the Rest of the World
Associate Professor Russell Thomson & Professor Beth Webster*
Centre for Transformative Innovation, Swinburne University of Technology
March 2014
*ThisreportwasmadewiththeassistanceoffundingfromIPAustralia.TheAuthorswishtothankBenMitra-Kahn,PhilipNoonanandRichardHayesfrotheircommentsonearlierdrafts.

1
Contents
1. Tradeinideas......................................................................................................................................................3
2. Technologyreceiptsandpayments.....................................................................................................................4
3. Typesoftrade–furtherinformation................................................................................................................11
(a)IPassetssalesandpurchases.......................................................................................................................11
(b)Royaltiesandlicencefees............................................................................................................................12
(c)TradeinR&Dservices...................................................................................................................................13
Appendix:Datasources.............................................................................................................................................17
2
HOWIDEASARETRADED
An idea has three geographic dimensions:where it is created;where it is owned; andwhere it is used.Cross-national trade in ideasoccurswhenever thecreation,ownershipanduseofaparticular idea takesplaceinmorethanonecountry.
Ideas can be embodied in goods and people, or alternatively in patents, blueprints or other writtenmaterial. It iscommonforaparticular ideatobeembodied inseveral forms.Forexample, thecodifiablepart of a new product ideamay be captured by a patent application, the tacit (uncodifed) part will beretained in theminds of the inventor, and the final incarnationof the ideawill be revealed in the gooditself.
Thisreportseekstodocumentthetradeinrecentideas.Thatis,ideasthataretradedatsomemeasurableprice because they have not yet fallen into the ‘public domain’. In contrast, the invention of thewheelremainsagoodandvaluableidea,buttheideaisfreeandnottradedforaprice.Tradeinrecentlycreatedideasoften leaveapaper trail suchas investment flows (e.g.,R&Dspending)or IntellectualProperty (IP)registrations.Thethreemainchannelsoftradeofideasaresummarisedbelow.
• Ownership: when firms can buy technology from inventors (or owners) abroad and we observeinternationalR&Dinvestment,patentassignmentsorinvestmentinhightechnologycompanies.
• Licence foruse:usercan ‘rent’ technology fromanownerabroadwhich isobservedas internationalpaymentsofroyaltyandlicensefees.
• Trade in goods embodyingnew ideas:whenever theuser is located in a different country from themanufacturer,weobservepaymentsfor‘hightech’goods.
Existingdatacollationsarenotperfect.Theydonotallowustorecordall theseaspectsofcross-nationaltrade.Forexample,whilewecanmeasureforeigninvestmentflowswithaccuracy,wedonotknowwhichportionoftheseisassociatedwiththepurchaseof‘newidea’-intensivecompanies.Whilewecanmeasurepaymentsforimportedandexportedgoods,it isnotsimpletomeasuretheshareofvalueattributabletoembodiednewideas.1Whilewecanmeasurethecross-flowofpeople,measuringtheextenttowhichtheyareacatalystfornewideasisnotstraightforward.
Accordingly,inthisreportweconsideronlycross-borderflowsofR&D,IP,patentassignment,androyaltiesandlicencefees
1Statisticalagencies,includingtheABS,collecttradedatabycommoditygroupwhichcanbeaggregatedinto‘hightech’and‘lowtech’groups.Suchmeasurescanbeindicative,thereareseveralsubstantivelimitationstothisapproach.Thefirstrelatestocomponenttrade,thephenomenonwherebyfirmsimportcomponentsinhightechcommoditygroupsperform‘lowtech’assemblyusingthesecomponentsandre-export.Suchexportswouldbecountedas‘hightech’despitenoneofthetechnologybeingcreatedintheexportingcountry.Second.Mostcommoditygroupsincludeamixofhighandlowtechsotheaccuracydependsonthelevelofgranulation.Third,identifyingthatcertaincommoditiesembodysomethresholdoftechnologydoesnotidentifytheshareofthevalueoftradedgoodswhichshouldbeattributedtothistechnology(thatis,theroyaltymark-up).

3
At a glance
ThissnapshotofAustralia’s‘tradeinideas’findsthat:
• Australiaaccruesanetdeficitinthetechnologybalanceofpayments:Australiansspendmoreimporting
foreignideasthanwereceiveexportingideasownedbyAustralianorganisations.
o Thesinglebiggestdriverofourtechnologybalanceofpaymentsdeficitisroyaltiesandlicencefeesforsoftware,trademarks,franchisesandmusic.
• ThesectoralcompositionoftradeinideaslargelyreflectssectoralpatternsofR&D.Thatis,broadlyspeakinglargertheshareofR&Dthelargerthemagnitudeoftradeflows.
• MosttradeinideasiswithOECDcountries,andthetechnologybalanceofpaymentsismostlynegative.
• AustraliaaccruesapositivetechnologybalanceofpaymentswithNon-OECDAsia(i.e.AsiaexcludingJapanandSouthKorea).
• Australiaisanetexporterofpatentedinventionsduetoforeignfirm’soffshoringR&DtoAustralia.Nationalscientificcapacity,underpinnedbyourhighereducationsectorprovidessomeexplanationofthis.
• Theimplicationsforcommunitywell-beingarisingoutofimportingorexportingtechnologyisnotstraightforward;itisnotacaseof‘deficits=bad’‘surplus=good’.AdeficitmaymeanAustraliansareverygoodatabsorbingideasfromtherestoftheworldwhichisclearlybetterthantryingtoinventeverythingthemselves.

4
1. Tradeinideas
This report provides a snapshot of available indicators of Australia’s ‘trade in ideas’. Trade in ideas includesroyalties,licencefees,R&Doffshoringandpurchasesofhightechnologycompanies.Despitetheeverincreasingimportance of intellectual property and intangible capital in global economic output, international scholarshipinto thewelfare implicationsof trade in ideas is in its infancy. The contributionof this report is to summariseavailableindicatorsofAustralia’stradeinideasandtooutlinesomeofthefactorsthatmaybedrivingthem.Weemphasisethattheimplicationsforcommunitywell-beingarisingoutofimportingorexportingtechnologyisnotstraightforwardandtheseissuesarenotcanvasedinanydetailinthisreport.
The terms ‘exportof ideas’,and ‘importof ideas’,bundlesdifferent typesof transactions.Anexportcanoccurwhen an idea is created in Australia at the request of an overseas organisation who then owns the idea.Alternatively, an export might occur when an idea is owned by an Australian resident but then licensed tooverseas users. Both transactions result in a payment into Australia. However, these two examples differaccordingtowhohastakentheriskinvestinginthecreationoftheidea,andtherefore,whosubsequentlyownsit.
Thisbalanceoftradeiscomposedoftwofactors:(a)howwellAustralianideasarespreadabroad(exports)minushow well Australians learn and imitate from foreign ideas (imports) and (b) whether there are paymentsassociatedwiththeseflows.AnegativebalanceoftrademayindicatethatAustralianshaveanexcellentcapacitytoabsorbideasandtechnologiesfromoverseas(agoodthing)orthattheyarepooratextractingpaymentsforideastheycreate(possiblyabadthing).
Inthisreportwebeginbyprovidinganoverviewoftheaggregateexportandimportpaymentsfornewideas.Theaggregate data are primarily descriptive, since they reflect underlyingmovements in a range of factorswhoseinterpretations are not necessarily consistent. Section 3 provide a more detailed analysis of underlyingcomponentsofaggregatetradeanddiscussfactorswhichappeartobedrivingthese.
2. Technologyreceiptsandpayments
Figure 1 below shows the aggregated technology balance of payments position for Australia over the period1999-2011andcomprisesboththecross-bordertradeinassetsandtherighttouseideas.Thisincludesthesumsofmoneypaidandreceivedfortheacquisitionanduseofpatents;licences;trademarks;designs;know-howandclosely related technical services (including technical assistance); and industrial R&D carriedout abroadduringtheperiod1999to2011.
Since 1999, payments by Australians to acquire and use the technology of overseas entities have outpacedreceipts from the sale and licensingof intellectualproperty and related technical services tooverseasentities.Paymentsandreceiptsmovedbroadlyintandemfrom1999to2006,butdivergedsharplythereafter.Technologypaymentsabroadincreasedatanannualrateof8.9percentfrom1999to2011,whereasreceiptsroseby7.6percentperannum.Theoverallnetbalanceofpaymentsdeficitintechnologyfellfrom$976millionin1999toalowof$306millionin2006,beforeincreasingto$3.4billionin2011.

5
Figure 1: Payments have outpaced receipts over the period leading to a widening deficit. Cross-border technology receipts and payments, A$ million (2010 prices), 1999–2011
Source:OECDPaper:DSTI/IND/WPGI(2012)3,byIsabelleDesnoyer-JamesandKoenDebacker
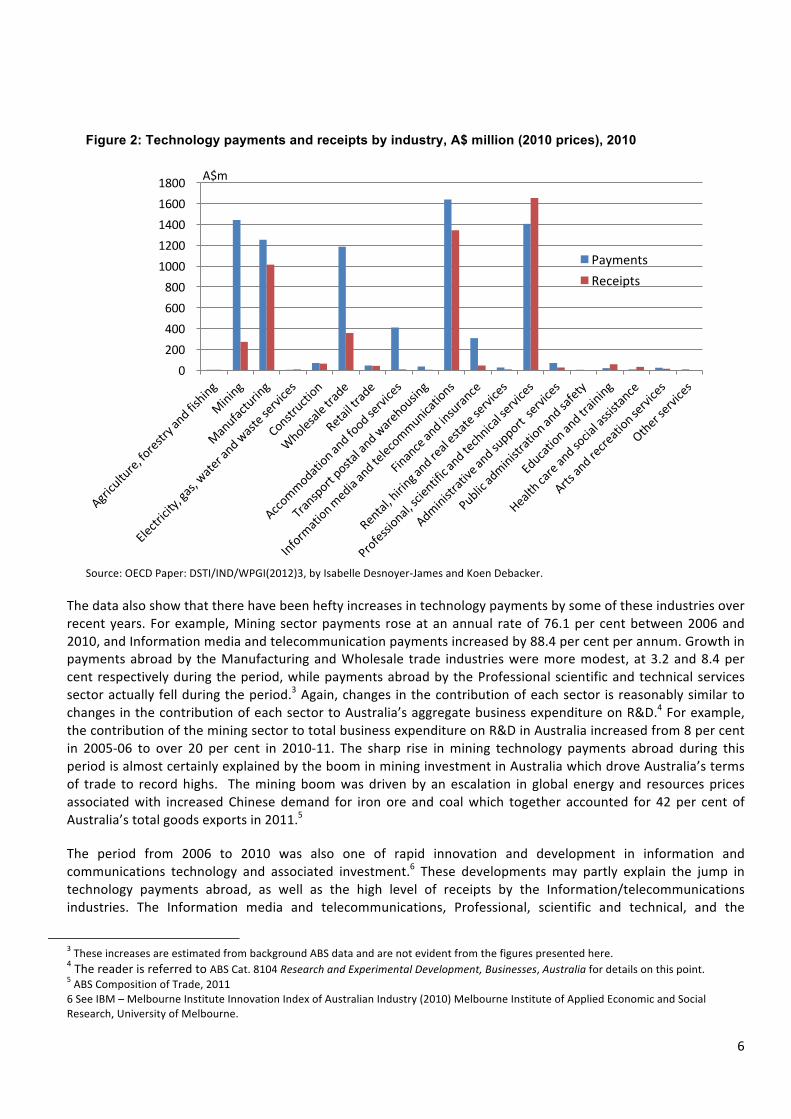
Figure2providesasnapshotofcross-bordertechnologypaymentsandreceiptsbrokendownbyindustrysector.Sectoral patterns in cross-border technology payments closely resemble patterns in R&D investment. That issectors which account for a greater share of aggregate R&D account for a commensurately greater share ofexportsandimportsoftechnologypayments.Thissuggeststhatthesearedrivenbyacommonfactorrelatingtoeach sector’s technological intensity, which to some extent reflects the rate of technological change in eachsector.
Justfiveofthe19industriesaccountedforthegreatbulkofcross-borderpaymentsandreceipts.Thesecomprise:Information media and telecommunications; Professional, scientific and technical services; Manufacturing;Mining; and Wholesale trade. Together these five industries accounted for 87.1 per cent of total paymentsabroadfortheacquisitionanduseoftechnology,and93.8percentoftotalreceiptsfromthesaleandleaseoftechnology,in2010.TheseindustriesarealsoamongstthebiggestspendersonR&D:Manufacturing,MiningandProfessionalscientificandtechnicalservicestogetheraccountedfortwo-thirdsoftotalbusinessexpenditureonR&Din2009–10.2Intwoindustries(Accommodationandfoodservices,andFinanceandinsurance)paymentsforthe purchase of technologyweremoderately high at around $300 to $400million but receiptswereminimal.Meanwhilein12industriescross-borderreceiptsandpaymentsfortechnologywereminimal–suchthatneitherpaymentsnorreceiptsexceeded$100millionin2010.
2ABSCat.8104ResearchandExperimentalDevelopment,Businesses,Australia.
-6000
-4000
-2000
0
2000
4000
6000
8000
10000
1999 2000 2001 2002 2003 2004 2005 2006 2007 2008 2009 2010 2011A$m
illion(2010price
s)
Year
Payments Receipts Netreceipts
6
Figure 2: Technology payments and receipts by industry, A$ million (2010 prices), 2010
Source:OECDPaper:DSTI/IND/WPGI(2012)3,byIsabelleDesnoyer-JamesandKoenDebacker.
Thedataalsoshowthattherehavebeenheftyincreasesintechnologypaymentsbysomeoftheseindustriesoverrecentyears. Forexample,Mining sectorpayments roseatanannual rateof76.1per centbetween2006and2010,andInformationmediaandtelecommunicationpaymentsincreasedby88.4percentperannum.Growthinpaymentsabroadby theManufacturingandWholesale trade industriesweremoremodest,at3.2and8.4percentrespectivelyduringtheperiod,whilepaymentsabroadbytheProfessionalscientificandtechnicalservicessectoractuallyfellduringtheperiod.3Again,changes inthecontributionofeachsector isreasonablysimilartochangesinthecontributionofeachsectortoAustralia’saggregatebusinessexpenditureonR&D.4Forexample,thecontributionoftheminingsectortototalbusinessexpenditureonR&DinAustraliaincreasedfrom8percentin 2005-06 to over 20 per cent in 2010-11. The sharp rise inmining technology payments abroad during thisperiodisalmostcertainlyexplainedbytheboominmininginvestmentinAustraliawhichdroveAustralia’stermsof trade to recordhighs. Theminingboomwasdrivenby anescalation in global energy and resourcespricesassociatedwith increased Chinese demand for iron ore and coalwhich together accounted for 42 per cent ofAustralia’stotalgoodsexportsin2011.5
The period from 2006 to 2010 was also one of rapid innovation and development in information andcommunications technology and associated investment.6 These developments may partly explain the jump intechnology payments abroad, as well as the high level of receipts by the Information/telecommunicationsindustries. The Information media and telecommunications, Professional, scientific and technical, and the
3TheseincreasesareestimatedfrombackgroundABSdataandarenotevidentfromthefigurespresentedhere.4ThereaderisreferredtoABSCat.8104ResearchandExperimentalDevelopment,Businesses,Australiafordetailsonthispoint.5ABSCompositionofTrade,20116SeeIBM–MelbourneInstituteInnovationIndexofAustralianIndustry(2010)MelbourneInstituteofAppliedEconomicandSocialResearch,UniversityofMelbourne.
020040060080010001200140016001800 A$m
PaymentsReceipts

7
Manufacturingindustrieseachreceivedbetween$1billionand$1.7billionfromthesaleorleasingoftechnologyabroadin2010.
Figure 3: Technology payments and receipts by partner region, A$ million, 2010
Source:OECDPaper:DSTI/IND/WPGI(2012)3,byIsabelleDesnoyer-JamesandKoenDebacker.
Figure 3 presents the source of Australia’s technology payments and receipts. The OECD group of countriesaccounted for the biggest ‘regional’ share of receipts and payments in 2010, at 78 per cent and 59 per centrespectively. Given the established link between a country’s spending on technology and its overall economicdevelopmentandperformanceovertime,itisnotsurprisingthatAustralia’stechnologyengagementwithfellow-OECDdevelopedcountriesissignificant.NorthAmerica(mostlytheUnitedStates)andEuropeaccountedforthemajor part (close to 90 per cent in each case) of the OECD’s share of Australia’s technology receipts andpayments. The other significant region is Non-OECD Asia (i.e. Asia excluding Japan and South Korea) whereAustraliahadapositivetechnology‘balanceofpayments’.
ItisalsointerestingtocompareAustraliatootherdevelopednations.ThetwopanelsofFigure4illustratethenettechnologyreceiptsasapercentofGDPforAustraliaandcomparisoncountries.Nettechnologyreceiptsincludeeachcountry’s cross-borderacquisitionanduseofpatents, trademarks,designs,know-howandclosely relatedtechnicalservices.Acountry’snetpositioncanbethoughtofasits‘balanceofpayments’intechnology.SomeoftheexportswillbeforcontractedservicesorIPsalesandwillbeintheformofroyaltypaymentsfortheuseofAustralianownedtechnologies(andthereverseforimports).
AccordingtoFigure4,Australiahasmaintainedasmallnettechnologydeficitacrosstheentireperiodfrom1999to 2010. Switzerland has run a net deficit in technology trade in almost every year of the period. As will beillustratedinthenextsection,despiteapparentsimilarities,AustraliaandSwitzerlandappeartobedrivenbyverydifferent factors.Australia runsa technologydeficitbecauseofhigh royaltyand license feepaymentswhereasSwitzerland’sdeficitisdrivenbyheavyinvestmentinR&DabroadresultinginthetransferofpatentedtechnologytoSwissfirms.
0
1000
2000
3000
4000
5000
6000
7000 A$m
PaymentsReceipts

8
ThesedatashowthattheUnitedKingdomandAustriahaveapositivetechnologybalanceofpayments.Aswillbeshownbelow,thesecountriesarealsonetexportersofR&Dservices.ThenetpositionsofJapanandSouthKoreahavebeeninnearbalanceacrosstheperiodwhichismorereflectiveoftheirrelatively‘closed’technologytrade,ratherthanaperfectbalancingoutofreceiptsandpayments.
Figure 4: Net technology receipts as a % of GDP, Australia and comparator countries, 1999–2010
Source:SourceOECD,MSTIMainScienceandTechnologyIndicators,dataextractedon07Mar201303:54UTC(GMT)fromOECDiLibrary
Asmentionedpreviously,technologybalanceofpaymentscompriseanumberofunderlyingcomponents.Thesecomponents are illustrated in Figure5. This shows that receipts aredominatedbyTechnology-related serviceswhichaccountedfor justover70percentoftotal technology-relatedreceipts in2011.Receiptsrelatingtothisitem increasedstronglyatanannual rateof9.0percent from1999to2011. .Cross-borderreceipts relatedtoRoyaltiesandlicencefeesandOverseas-fundedR&DinAustraliaalsorosesteadilybetween1999and2011,atanannual rateof4.7and6.6percent respectively.Therehasbeenvirtuallynogrowth in the saleofpatentsandinventions,despitetheoccasionalupward‘blip’,notablyin2006.
-1
-0.5
0
0.5
1
1.5
2
1999 2000 2001 2002 2003 2004 2005 2006 2007 2008 2009 2010
Australia
Japan
Korea
UK
USA
Switzerland

9
Figure 5a: Technology receipts, A$ million (2010 prices), 1999–2011, Patents and inventions
Source:OECDPaper:DSTI/IND/WPGI(2012)3,byIsabelleDesnoyer-JamesandKoenDebacker.
-500
0
500
1000
1500
2000
2500
3000
3500
4000
1999 2000 2001 2002 2003 2004 2005 2006 2007 2008 2009 2010 2011
A$m
illion(2010price
s)
Year
Saleofpatentsandinventions Purchaseofpatentsandinventions Netreceipts

10
Figure 5b: Technology receipts, A$ million (2010 prices), 1999–2011, Royalties and licences
Source:OECDPaper:DSTI/IND/WPGI(2012)3,byIsabelleDesnoyer-JamesandKoenDebacker.Figure 5c: Technology receipts, A$ million (2010 prices), 1999–2011, Technology-related services
-4000
-3000
-2000
-1000
0
1000
2000
3000
4000
1999 2000 2001 2002 2003 2004 2005 2006 2007 2008 2009 2010 2011
A$m
illion(2010price
s)
Year
Royaltiesandlicencereceipts Royaltiesandlicencepayments Netreceipts
-1000
-500
0
500
1000
1500
2000
2500
3000
3500
4000
1999 2000 2001 2002 2003 2004 2005 2006 2007 2008 2009 2010 2011
A$m
illion(2010price
s)
Year
Technology-relatedservicereceipts Technology-relatedservicepayments Netreceipts

11
Source:OECDPaper:DSTI/IND/WPGI(2012)3,byIsabelleDesnoyer-JamesandKoenDebacker.
Figure 5d: Technology receipts, A$ million (2010 prices), 1999–2011, R&D carried out abroad
Source:OECDPaper:DSTI/IND/WPGI(2012)3,byIsabelleDesnoyer-JamesandKoenDebacker.
Insummary,Figures5a-5dindicatethatAustraliaisa:• Minornetbuyerofpatentsandinventions(netimporter)except2006.However,thelevelofbothinflow
andoutflowsofassetsissmall.• Averylargenetuseroflicensedtechnologies(netimporter).• Asignificantnetselleroftechnology-relatedservices(netexporter)priorto2009(andanetbuyerfrom
2009to2011).• AnetsellerofR&Dservices(netexporter).
3. Typesoftrade–furtherinformation
Inthissectionwedelvedeeperintoourdatasourcestorevealmoreinformationabout(a)IPsalesandpurchases(b)Royaltiesandlicensefeesand(c)thetradeinR&Dservices.Wehavenofurtherinformationaboutthetradeintechnology-relatedservices.
(a)IPassetssalesandpurchases
Figure6presentsalongertimeseriesofdataontheoutrightsaleandpurchaseof‘disembodied’IPassets,thatis,of assets such as patents, copyright, trademarks and franchises. It covers the period from1988 to 2011. Bothpaymentsandreceiptsaresubjecttoperiodic‘spikes’suchthattheyriseandfallquitesharply.Overall,however,thereislittleevidenceofarealtrendineitherseriesduringtheperiodshowninthechart.
0
500
1000
1500
2000
2500
3000
3500
4000
1999 2000 2001 2002 2003 2004 2005 2006 2007 2008 2009 2010 2011
A$m
illion(2010price
s)
Year
OverseasfundedR&DcarriedoutinAustralia AustralianfundedR&Dcarriedoutabroad
Netreceipts

12
Figure 6: Sales and purchases of disembodied IP assets, A$ million (2010 prices), 1988–2011
Notes:Salesandpurchasesofpatents,copyrights,trademarks,franchises.PotentiallyincludestransactionsinembassylandbuttheseareestimatedbytheABStobeveryminor.Source:ABS5331.0-BalanceofPaymentsandInternationalInvestmentPosition,Australia,Concepts,SourcesandMethods,1998.ABS5206.0-AustralianNationalAccounts:NationalIncome,ExpenditureandProduct,Jun2012.ImplicitPriceDeflators-GrossDomesticProduct-A2303730T.
(b)Royaltiesandlicencefees
Figures7ato7dbelowpresentdisaggregateddataonAustralianpaymentsandreceipts forroyaltyand licencefeesasapercentageofGDP.ThecategoriesareSoftware;Hardwareanddesign;Trademarkandfranchise;andMusic and ‘other’; Since 1988 payments exceeded receipts in all categories. The greatest difference betweenpayments and receiptswas for Software and Trademark and franchise. For this group, payments abroad as apercentageofGDProsewhilereceiptshavebeenfalling. Incontrast,bothpaymentsandreceiptsforHardwareanddesignandMusicand‘other’havebeenfallingmodestlyasapercentageofGDPsince1998.Technologicaldevelopmentsmayaccountforthesefalls7
Australia’swideningnetdeficit inroyaltyand licensefeepayments inrelationtobothSoftwareandTrademarkandfranchisinginthepastdecadeorsohasbeenthemostnotabletrend.TheriseinthevalueoftheAustraliandollarsince2009mayhavefacilitatedincreasedpurchasesoftechnologyabroad.Boomingcommodityprices,andensuingmininginvestment,mayalsopartlyexplainthesedevelopments.
7Evidenceontheeffectofpiracyonretailsalesismixed,however,McKenzieandWalls(2013)findpiracyreducescinematicketsalesinAustralia.
0
100
200
300
400
500
600 A$m
ReceiptsPayments

13
Figure 7a: Software
Figure 7b: Trademark and franchise
Figure 7c: Hardware and design
Figure 7d: Music and other
SourceFigures8–11:ABS5302.0BalanceofPaymentsandInternationalInvestmentPosition,Australia.
(c)TradeinR&Dservices
Patentsassignmentdatacanbeusedtoshedlightonthe‘tradeinR&Dservices’sincethecountryoftheinventorlistedonapatentreflectsthecountrywheretheR&Dtookplacewhilethecountryoftheapplicantcorrespondsto the ‘buyer’.The firmdoing theR&D(theseller)and thepatentapplicant (thebuyer)areusuallypartof thesamemultinational enterprise, so the indicator can also be thought of as a measure of net R&D offshoring.8CountrieswhichoffshoreR&Deffectively import ideas.CountrieswhichhostoffshoredR&D,effectivelyexportideas.NegativenetexportsreflectfirmsinthecountryoffshoremoreR&Dthanforeignfirmsundertakeinthatcountry.
8Technically,someforeignpatentsmaybetheresultofthetemporarysecondmentofnationalsfromtheinventingcountrytotheassigneecountryorex-postreassignments.
0.00
0.05
0.10
0.15
0.20
0.25
0.30
0.35
1998
1999
2000
2001
2002
2003
2004
2005
2006
2007
2008
2009
2010
2011
%ofGDP
Receipts Payments
0.00
0.05
0.10
0.15
0.20
0.25
0.30
0.35
1998
1999
2000
2001
2002
2003
2004
2005
2006
2007
2008
2009
2010
2011
%ofGDP
Receipts Payments
0.00
0.05
0.10
0.15
0.20
0.25
0.30
0.35
1998
1999
2000
2001
2002
2003
2004
2005
2006
2007
2008
2009
2010
2011
%ofGDP
Receipts Payments
0.00
0.05
0.10
0.15
0.20
0.25
0.30
0.35
1998
1999
2000
2001
2002
2003
2004
2005
2006
2007
2008
2009
2010
2011
%ofGDP
Receipts Payments

14
R&Doffshoringprimarilyoccursbetweendevelopedeconomies.While the21stCenturyhasseenhigh ratesofgrowthinR&Doffshoringtodevelopingcountries,developedcountriesremainthedominanthostforoffshoredR&D (the sellers) and theyare theprimary sourceofoffshoredR&D (themainbuyers) (Thomson2013). Firmsoffshoretotechnologicallyadvancedcountriessincesuchcountriesoffermoreopportunitytotapintotheglobaltechnological frontier (example Samsung set up R&D in Silicon Valley in the 1980s). To this end there existsreasonably robust evidence that the quality of higher education institutions and basic scientific capacity areimportantindeterminingtheattractivenessofcountriesaslocationstoinvestinR&D(Thomson2013).
Thetechnologicalcapacityof thefirms’homebase isalsoakeyfactor indeterminingwhichcountriesoffshoreR&D (i.e., who are the buyers). This is because only firms on the technological frontier have the capacity tomanageglobalizedR&Doperationsandintegratederivedtechnologiesintheirglobaloperations.Firmsoperatingonthetechnologicalfrontierhaveoftenexhaustedavailablepossibilitiesfor learningwithintheirhomecountryandthereforehavemoretobenefitfromoffshoringR&D(example).(SeeSongandShin2008)
There isno strong theoreticalevidence to support thehypothesis thatbeinganetexporterofR&Dservices isunambiguouslygoodorbadinthecontextofwelfareoreconomicgrowth.Buttheevidenceismoreinstructive:thesevencountriesintheOECDthatarenetimportersofR&D(USA,Switzerland,Netherlands,Sweden,Finland,JapanandKorea)areamongthemosttechnologicallyadvancedeconomiesintheworld.
Figure8depictsnetexportsofR&DservicesforAustraliaandasampleofotherdevelopedeconomies.Apositivenet R&Dexport share indicates fewerpatents are assigned to the country than are inventedby its residents.9Usingthismeasure,about11percentofOECDR&Dserviceswereoff-shoredin2005,whichisaboutdoublewhatitwasin1985.
This data confirms that Australia is a net exporter of R&D services. That is, more foreign firms undertakeoffshoredR&DinAustraliathanAustralianfirmsdoabroad.MosttradeinR&DservicesisthoughttobemediatedthroughmultinationalfirmsandthereforethepresenceorabsenceofmultinationalcompaniesdomiciledineachcountryhasanimportantbearingonpatternsofR&Doffshoring.ThehighdegreeofforeignownershipwithintheAustralian economy, and particularly in patent intensive sectors such as manufacturing, may explain our netexporterstatus.Thatis,muchoftheexportingislikelytoreflectforeign-ownedmanufacturingfirmsoperatinginAustralia undertaking R&D on behalf of the parent company. In addition, the strength of Australia’s highereducationsector, intermsofresearchoutput,mayalsocontributetomakingAustraliaanattractive locationtoundertakeR&D(SeeThomson2013).
ThepatternforothercountriesrevealsmoreunderstandingaboutthepatternofR&Doff-shoring.Switzerlandisarelatively largenet importerofR&Dservices.That is, thenumberofpatentsassignedtoSwitzerlandthatareinventedabroadminusthenumberofpatentsinventedinSwitzerlandandassignedtoforeignfirmisequivalentto more than 30 percent of the total number of patents assigned to Swiss entities each year. This might beexplained by the fact that Switzerland is home to several very large multinational companies such as ABB(Engineering),Nestle(Foodandbeverage),andpharmaceuticalfirmsNovartisandRoche(industry?).SwedenalsoappearstobeimportinganincreasingvolumeofR&D10andlikeSwitzerland,thismayreflecttheimportantroleoftechnologyintensivemultinationalenterprises(SAAB,AstraZenica,Ericsson)intheSwedisheconomy.
BothJapanandKoreaarecomparatively‘closed’inthesensethatfirmsfromthesecountriesdolittleoffshoringand fewforeign firmsperformR&D in JapanorKorea.Theessentially ‘non-globalized’natureof JapaneseR&Dactivities has been widely noted. Up until about a decade ago, researchers often attribute this to Japan’s‘latecomerstatus’;JapanesefirmsonlybegantointernationalizeR&Dinthe1990s.
9R&Dexportsisindicatedbythenumberofpatentsinventedinacountrylessthenumberofpatentsassignedtothesamecountry(standardisedbythenumberofpatentsinventedinthecountry).10TheseestimatesofR&Dexportsarebasedonpatentdatasoreflectvolumesratherthanvalues.

15
Figure 8a: Net export of R&D services (evidence from patent data), Australia & comparator countries, 1980–2006
Source:AdaptedfromThomson(2012)Figure 8b: Net export of R&D services (evidence from patent data) Australia & comparator countries, 1980–2006
Source:AdaptedfromThomson(2012)
-0.3
-0.2
-0.1
0
0.1
0.2
0.3
1980
1981
1982
1983
1984
1985
1986
1987
1988
1989
1990
1991
1992
1993
1994
1995
1996
1997
1998
1999
2000
2001
2002
2003
2004
2005
2006
Sweden USA
UK Korea
Japan Australia
-0.3
-0.2
-0.1
0
0.1
0.2
0.3
1980
1981
1982
1983
1984
1985
1986
1987
1988
1989
1990
1991
1992
1993
1994
1995
1996
1997
1998
1999
2000
2001
2002
2003
2004
2005
2006
Canada Austria
Switzerland Belgium
Australia

16
Researchhasrevealedacorrelationbetweenoffshoringlocationsandcommonlanguageaswellasculturalandgeographic proximity (see e.g., Ambos 2005, Thomson 2013). In fact language barriersmaywell play a role inexplaining Japan and Korea’s limited offshoring. Similarly, the geographic distance between these East Asianinnovatorsandotheradvancedeconomies,especiallywhencomparedtothehighlyintegratedeconomieswithinEurope,probablyplaysarole.Forexample,Austria,BelgiumandtheUKstandoutassignificantnetexportersofR&D services this high rate of exporting reflects the high degree of foreign ownership of large Austrian firms(GasslerandNones2008).GermanyisthemajordestinationforpatentsinventedinAustria(geographicproximityand shared language), themain export destination of UK patents are firms in the USA (shared language andculture)andBelgiumsharesalandborderwithmajorR&Doffshoringnation’sGermanyandtheNetherlands.
It should be cautioned however the presence of foreign-owned firms in a host country does not conclusivelypredictsubstantial ‘exports’ofR&Dservices. Inmany instancesmultinational firmsthatfocusonproductionordistributionanddolittleR&D.Moreover,datasuggeststhatmostR&DperformedbymultinationalfirmsabroadissolelytargetedtothehostcountrymarketandthereforewouldinvolvetransferringIPtothehomebase.
4. Concludingremarks
Lookingatbalanceofpaymentfiguresandpatentdatatelltwodifferentstories.Australiahasalargenetdeficitinthebalanceofpaymentsinpaymentsforsoftware,trademarks,softwareandmusic.However,likemostcountries,AustraliaisanetexporterofpatentswhichindicatesAustraliainanexporterofR&Dservices.
.

17
Appendix: Data sources
OECDTechnologyBalanceofPayments
Moneypaidorreceivedfortheacquisitionanduseofpatents, licences,trademarks,designs,know-howandcloselyrelatedtechnicalservicesincludingtechnicalassistance)andforindustrialR&Dcarriedoutabroad,etc.Thisisacompositemeasurewhichcomprisesbothforthetradeoftheasset(between,forexample,creatorsandowners)andtradeinvolvingtherighttouseidea(between,forexample,theowneranduser).
Balanceofpaymentsmeasure Sources Notes“Technologybalanceofpayments” OECDMSTI,paymentsmadeand
received. Source: OECDPaper:DSTI/IND/WPGI(2012)3,byIsabelleDesnoyer-JamesandKoenDebacker,ThesedatafromIsabelleDesnoyer-James([email protected])weresenton10January2013toBenjaminMitra-Kahn,Seconde-mailreceived7/2/13,updating2010and2011figures.HistoricfiguresfromSourceOECD,MSTIMainScienceandTechnologyIndicators,dataextractedon07Mar201303:54UTC(GMT)fromOECDiLibrary.
Thisrefersto“commercialtransactionsrelatedtointernationaltechnologytransfers”.Itconsistsofmoneypaidorreceivedfortheacquisitionanduseofpatents,licences,trademarks,designs,know-howandcloselyrelatedtechnicalservices(includingtechnicalassistance)andforindustrialR&Dcarriedoutabroad,etc.
TradeinR&DServicesPatentdata.
OurmeasureofR&Doffshoringusesacountofprioritypatentapplications(DatafortheUSPTOaregrantedpatents)accordingtothecountryoftheinventorandthecountryoftheapplicant.Itincludespatentapplicationsmadeateveryoffice.TheindicatorsarederivedinThomson(2012)fromrawdatacompiledbydeRassenfosseetal.(2011)fromthePATSTATdatasetusingstandardfractionalcountingmethodologytoaccountformulti-inventorandormulti-applicantpatents.
SaleofIPassets
TheonlyABSdataseriespubliclyavailablereferstoacombinationofdifferentintellectualpropertyassettypes–thereisnoseparationbyintellectualpropertyassettype.Thequestionusedwas:“Didthisbusinesshaveanytransactions with non-residents relating to the purchase or sale of any licences, leases, goodwill, patents,copyrights,softwarerightsorotherrightsetc.(resultinginachangeofownershipoftheasset)?”.Thefollow-up Q7 does ask for details of the assets: “Please provide details of transactions indicated in Question 6.Descriptionofassetsoldorpurchased.”Whileintheorythisdataseriesalsoincludes“...theacquisitionoflandby a government or international organisation (for the purpose of establishing an embassy or similarinstitution),orthedisposalofsuchland”,theABSbelievesthatthisincludesonlyminoradditionstothetotals.
Tradeinassets-tradeofallfuturerights
Sources Notes
Tradeinpatents,copyrights,trademarksandfranchisesasassets
ABS5302.0-BalanceofPaymentsandInternationalInvestmentPosition,Australia.Quarterly,Flow.SeriesA3533998F,A3534021V,A3533767W(net,creditsanddebitsrespectively)
Acquisitionanddisposalofnon-produced,non-financialassets:Thesecompriseintangibleassetsrecordedinthecapitalaccountsuchassalesofpatents,copyrights,trademarks,franchisesandsometransactionsinembassyland.

18
Royaltiesandlicensefees
The ABS has several IP royalty and licensing fee data series, some of which are summations of other dataseries.Alloftheseseriesarebasedondataobtainedfromsurveysthatarepartofthenationalaccountsandbalance of trade figures. The survey instrument is provided at Appendix 1, and the relevant subsection is‘Transactionsinservicesandroyalties’.LicencefeesassociatedwithcomputersoftwareareatItem20,licencefeesassociatedwithcomputerdesignandhardwareareatItem21.Dataonroyalties,distribution,franchise,copyright,licenceandpatentfeesandtrademarksarecollectivelyobtainedfromthesamesurveyinstrument.Thiscollectionoffeesfortheuseofintellectualproperty(excludingcomputersoftware,design&hardware)isgroupedasfollows:
• Films,TVprograms,videoandmultimedia(Item39)• Music(Item40)• Patents,industrialknowhow,manufacturingrightsandprototypes(Item41)• Trademarksandfranchisingfees(Item42)• Otherroyalties(Item43).
In all cases these charges refer to trade in stand-alone licences. These are not trade in the underlyingintellectual property asset and are not licences purchased as part of purchasing a company, or part ofpurchasingalargerITsystemforexample.Itisexpectedthatthesesurveyitemsincludelicensingfeespaidorreceived as part of court judgements or out of court settlements. The ABS gives no explicit place to courtjudgementsoroutofcourtsettlementsinthenationalaccounts.Howeverwhereroyaltiesarepaidasaresultofacourt judgementoranoutofcourtsettlementthenit isreasonabletoexpectroyaltiestobetreatedasroyalties.
Wherejudgementsorsettlementsinclude‘compensation’,suchcompensationreceiptstakeonthecharacterof the item they replace for tax purposes.11 This taxation treatment of compensation means that mostorganisations face this classification issue. So they would appear to have information about how suchcompensationshouldaffecttheirsurveyresponses.Howeverweareunabletodetermineifthisisthepracticeactuallyfollowedbyorganisationssurveyed–asforallofthesesurveyresponsesthereisnostrictwayforustoknowhowsurveyedorganisationsconstruethesurveyquestions.Webelieveitisreasonabletoassumethatcompensationforroyaltieswouldbetreatedasroyaltiesforthepurposeofnationalaccountscompilation.
Wehavebeenunable to identifyanydatabaseof intellectualproperty-related judgementsandsettlements.Even if such a database is available, many out-of-court settlements in particular do not have their detailsdisclosed. So it is difficult to knowhow significant these judgements and settlements are for total licensingcash flows. Some such judgements and settlements may cover many years of royalty payments orcompensation.Sotheyhavethepotentialtobequite‘lumpy’.12
Tradeinlicensingofintangibleassets–chargesforuseofIP
Sources Notes
Chargesfortheuseofintellectualpropertynotincludedelsewheren.i.e.
Credits-ABSSeriesA3533818KDebits–ABSSeriesA3533912F
Chargesfortheuseofintellectualpropertyn.i.e.-Licencestoreproduceand/ordistributecomputerservices
Credits-ABSSeriesA3533708WDebits–ABSSeries
Sumofsoftwareanddesignandhardwareseries.
11CommissionersofTaxation(NSW)vMeeks(1915)19CLR568,(perGriffithJ).12Forexample,a2012settlementpaidtoCSIROforwi-fitechnologyitdevelopedinthe1990shasbeenreportedat$220millioninroyalties(TheAustralian,2012)

19
A3533839WChargesfortheuseofintellectualpropertyn.i.e.-Licencestoreproduceand/ordistributecomputerservices,Software
Credits-ABSSeriesA3533690KDebits–ABSSeriesA3533740W
Chargesfortheuseofintellectualpropertyn.i.e.-Licencestoreproduceand/ordistributecomputerservices,Hardwareanddesign
Credits-ABSSeriesA3533734ADebits–ABSSeriesA3533762K
Chargesfortheuseofintellectualpropertyn.i.e.–Outcomesofresearchanddevelopment
Credits-ABSSeriesA3533905JDebits–ABSSeriesA3533970C
Chargesfortheuseofintellectualpropertyn.i.e.-Franchiseandtrademarkslicensingfees
Credits-ABSSeriesA3533709XDebits–ABSSeriesA3533799R
Chargesfortheuseofintellectualpropertyn.i.e.–Othercharges
Credits–ABSSeriesA3534027JDebits–ABSSeriesA3533822A
Chargesfortheuseofintellectualpropertyn.i.e.-Othercharges,Royaltiesoneducation
Credits-ABSSeriesA3533691LDebits–ABSSeriesA3533971F
Chargesfortheuseofintellectualpropertyn.i.e.-Othercharges,Music
Credits-ABSSeriesA3533710JDebits–ABSSeriesA3534038R
Chargesfortheuseofintellectualpropertyn.i.e.-Othercharges,Other
Credits–ABSSeriesA3533882CDebits–ABSSeriesA3533823C

20
Ambos,B., 2005. Foreigndirect investment in industrial researchanddevelopment:A studyofGermanMNCs,ResearchPolicy34,395-410.
McKenzie, Jordi&Walls,W.D.,2013. "File-SharingandFilmRevenues:AnEmpiricalAnalysis,"WorkingPapers2013-14,UniversityofSydney,SchoolofEconomics.
Song, J., and Shin 2008. ‘The paradox of technological capabilities: a study of knowledge sourcing from hostcountriesofoverseasR&Doperations’.JournalofInternationalBusinessStudies39,291–303.
Thomson,R,2012,“NationalTechnologicalCapacityandR&DOffshoring”,ResearchPolicy42,517-528