TRADE FACILITATION INDICATORS: THE POTENTIAL IMPACT OF ...
84
TRADE FACILITATION INDICATORS: THE POTENTIAL IMPACT OF TRADE FACILITATION ON DEVELOPING COUNTRIES’ TRADE
Transcript of TRADE FACILITATION INDICATORS: THE POTENTIAL IMPACT OF ...

TRADE FACILITATION INDICATORS:
THE POTENTIAL IMPACT OF TRADE
FACILITATION ON DEVELOPING
COUNTRIES’ TRADE

For Official Use TAD/TC/WP(2012)24 Organisation de Coopération et de Développement Économiques Organisation for Economic Co-operation and Development 12-Nov-2012 ___________________________________________________________________________________________
English - Or. English TRADE AND AGRICULTURE DIRECTORATE TRADE COMMITTEE
Working Party of the Trade Committee
TRADE FACILITATION INDICATORS: THE POTENTIAL IMPACT OF TRADE FACILITATION ON DEVELOPING COUNTRIES’ TRADE
4-5 December 2012 The OECD Conference, Paris
Background and action required: This document presents the findings on the OECD trade facilitation indicators for developing countries’ trade. It is proposed to the Working Party for discussion. The addendum document, containing findings on transit trade will be issued separately at a later date. Link to the Programme of Work and Budget: The work corresponds to the output result on trade facilitation (3.1.1.2.3) of the 2011-2012 PWB and was undertaken with resources foreseen under this output result. A voluntary contribution from Norway has allowed to expand the data collection to a larger set of countries.
Contacts: Evdokia Moïsé (Email: [email protected]) and Silvia Sorescu (Email: [email protected]).
JT03330581
Complete document available on OLIS in its original format This document and any map included herein are without prejudice to the status of or sovereignty over any territory, to the delimitation of international frontiers and boundaries and to the name of any territory, city or area.
TAD
/TC/W
P(2012)24 For O
fficial Use
English - O
r. English

TAD/TC/WP(2012)24
2
TABLE OF CONTENTS
TRADE FACILITATION INDICATORS: THE POTENTIAL IMPACT OF TRADE FACILITATION ON DEVELOPING COUNTRIES’ TRADE .................................................... 4
Executive summary .................................................................................................................... 4 I. Background and objectives ................................................................................................. 5 II. The structure of the work and the dataset ........................................................................ 6 III. The impact of the TFIs on trade flows and trade costs .................................................... 8
The Impact of the TFIs on bilateral trade patterns ................................................................. 8 Trade flows impacts by income country groupings .............................................................. 10 Trade flows impacts by geographical and regional country groupings ................................ 10 The impact of the TFIs on trade costs .................................................................................. 11
IV. Reflections on the indicators ......................................................................................... 13 (a) Information availability .......................................................................................... 15 (b) Involvement of the trade community ....................................................................... 16 (c) Advance rulings ....................................................................................................... 17 (d) Appeal procedures ................................................................................................... 18 (e) Fees and charges ...................................................................................................... 20 (f) Formalities - documents ........................................................................................... 20 (g) Formalities and automation ..................................................................................... 21 (h) Formalities and procedures ...................................................................................... 23 (i) Border agency cooperation – internal ...................................................................... 27 (j) Border agency cooperation – external ..................................................................... 28 (k) Consularization ........................................................................................................ 28 (l) Governance and impartiality .................................................................................... 28
V. Conclusions ................................................................................................................... 29
REFERENCES ............................................................................................................................ 31
ANNEX 1. TRADE FACILITATION INDICATORS VARIABLES ........................................ 33
ANNEX 2. MAIN DATA SOURCES ......................................................................................... 49
Global Express Association Customs Capabilities Report ................................................... 49 World Trade Organization Trade Policy Reviews: Section on “Trade Policies and Practices by measures” ........................................................................................................ 49 Countries’ Customs websites and Customs Codes ............................................................... 49 Doing Business indicators - World Bank ............................................................................. 49 Logistics Performance Index (LPI) World Bank .................................................................. 50 World Economic Forum (WEF) Global Competitiveness Report (GCR) ............................ 50 Institutional Profiles Database (IPD) .................................................................................... 50 Asia-Pacific Economic Cooperation (APEC) Sub-Committee on Customs Procedures – 2010 Evaluation Report on Customs Activities in APEC ............................... 51
ANNEX 3. COUNTRY LIST ...................................................................................................... 52
ANNEX 4. COUNTRY GROUPINGS ....................................................................................... 53

TAD/TC/WP(2012)24
3
Country groupings by income .................................................................................................. 53 Low income country group ...................................................................................................... 53 Lower middle income country group ....................................................................................... 53 Upper middle income country group ....................................................................................... 53 High income non-OECD country group .................................................................................. 53 Geographical country groupings ............................................................................................. 53 Sub-Saharan Africa country group ........................................................................................... 53 Middle East and North Africa country group ........................................................................... 53 Europe non-OECD and Central Asia country group ................................................................ 54 Latin America and Caribbean country group ........................................................................... 54 Asia country group ................................................................................................................... 54 Economic partnership groupings ............................................................................................. 54 APEC country list .................................................................................................................... 54 ECOWAS country list .............................................................................................................. 54 OECD countries (for which TFIs were calculated in the 2011 OECD study) ......................... 54
ANNEX 5. RELEVANCE AND ORGANISATION OF THE VARIABLES ............................ 55
ANNEX 6. GRAVITY SPECIFICATIONS ................................................................................ 56
ANNEX 7. TRADE COSTS CALCULATION .......................................................................... 59
ANNEX 8. TRADE COSTS REGRESSIONS ............................................................................ 61
ANNEX 9. CONTRIBUTION TO THE VARIANCE ................................................................ 62
APPENDIX 1. TRADE FLOWS - GRAVITY REGRESSIONS WITH THE INDIVIDUAL TFI ....................................................................................................................... 65
APPENDIX 2. TRADE COSTS REGRESSIONS WITH THE INDIVIDUAL TFI .................. 83

TAD/TC/WP(2012)24
4
TRADE FACILITATION INDICATORS: THE POTENTIAL IMPACT OF TRADE FACILITATION ON DEVELOPING COUNTRIES’ TRADE
Executive summary
This paper presents findings from the OECD analysis of indicators for assessing the relative economic and trade impact of specific trade facilitation measures on non-OECD countries. An earlier phase of this work produced estimates of the trade impact of trade facilitation measures for OECD countries. The purpose of the estimation is to understand the relative economic importance and relevance of trade facilitation measures for OECD and non-OECD countries so as to provide a basis for prioritizing trade facilitation actions by governments and mobilize technical assistance and capacity building efforts for developing countries in a more targeted way.
Sixteen trade facilitation indicators (TFIs) have been constructed, corresponding to the main policy areas under negotiation at the WTO, in order to estimate the impact of those policy areas on trade volumes and trade costs in all WTO member countries and observers. These sixteen indicators are composed of some ninety-seven variables, whose values are drawn from publicly available data and subsequently fact-checked with concerned governments. Data were collected for a hundred and six non-OECD countries, of which ninety-five are WTO members and eleven WTO observers. The coverage is fairly wide, including twenty-one low income, thirty-two lower-middle income, thirty-eight upper-middle income and fifteen high income non-OECD countries. In order to account for differences in income, geography and level of development, which could result in differing outcomes as to the relative impact of trade facilitation measures, the assessment considered several groups of countries defined on the basis of income, geographic and economic partnership criteria.
The econometric analysis reveals that enhancing trade facilitation has a positive impact on trade flows. We also find that the most significant trade facilitation measures (i.e. those that have the highest impact on trade volumes) are information availability, harmonisation and simplification of documents, automated processes and risk management, streamlining of border procedures and good governance and impartiality. Sector specific analysis shows that these indicators are particularly significant for manufactured goods but less so for agricultural goods. The latter finding may be driven by the poor data availability on variables accounting for specificities of agricultural goods.
For low income countries, the trade facilitation area that leads to the most significant increases in trade flows is the harmonisation and simplification of documents. The same outcome applies to the Sub-Saharan African group of countries. For lower-middle and higher-middle income countries the strongest impact comes from the streamlining of procedures, the same applies for the Asia, Latin America and Caribbean, Eastern Europe and Central Asia groups of countries.
The impact of the TFIs is significant not only in specifications concerning developing countries as importers, but equally so when developing countries are exporting to the rest of the countries (developing and developed economies) in the overall sample. Improving the efficiency of export procedures and addressing border bottlenecks on the export side are important components of trade facilitation measures. This result confirms that improvements in the trade facilitation environment of developing countries are essential for increasing their export performance.
Where matters concern overall trade costs, governance and impartiality and measures to harmonise and simplify documents are the greatest contributors for low income countries: the former has the potential of reducing trade costs by 1.9% and the latter by 1.4%. For lower-middle income

TAD/TC/WP(2012)24
5
countries the harmonisation and simplification of documents could potentially reduce costs by 1.9% and the streamlining of procedures by 1.6%, while for upper-middle income countries the streamlining of procedures could bring cost reductions of 1.8% and the use of automated processes and risk management another 1.7%. If all the TFIs are added within the same regression, their cost reduction potential would reach almost 12% of the total costs for low income countries, which is an estimate consistent with findings in the literature. When combined, the total effect of the TFIs is greater than the simple sum of the impacts of their individual components, confirming the importance of undertaking trade facilitation reform in a comprehensive manner rather than simply focussing on isolated measures.
The use of individual trade facilitation indicators should enable countries to better assess which trade facilitation dimensions deserve priority. More precise results would be subject to the improvement of information available in the current database.
I. Background and objectives
1. Trade facilitation refers to policies and measures aimed at reducing trade costs by improving efficiency at each stage of the international trade chain. According to the WTO definition, trade facilitation is the “simplification of trade procedures”, understood as the “activities, practices and formalities involved in collecting, presenting, communicating and processing data required for the movement of goods in international trade”.1 This is the definition underpinning WTO negotiations on trade facilitation, while wider definitions, such as those used by UNCTAD or APEC, may include, in addition to customs and transit issues, transport, banking and insurance, business practices and telecommunications. Whatever the definition and scope, existing economic analysis of trade facilitation usually draws on the notion of trade transaction costs and seeks to assess the benefits of (efficiency-enhancing) trade facilitating measures by estimating the costs of inefficiency in the various policy areas influencing the movement of goods.
2. The OECD work on trade facilitation indicators (TFIs) was undertaken to measure the relative economic and trade impact of trade facilitation measures currently under negotiation in the World Trade Organization (WTO) on trade volumes and trade costs in all WTO member countries. Contrary to previous studies which sought to quantify the overall impact of trade facilitation, the primary aim of this work has been to estimate the impact at the macro level of addressing specific facilitation hurdles in the trade procedures of given countries; and provide an indication of the net benefits of specific measures at the micro level, focussing on trade facilitation dimensions which directly depend on public sector involvement. The purpose of the estimation was to understand better the relative economic importance and relevance of various trade facilitation measures for OECD and non-OECD countries in order to a) provide a basis for prioritizing trade facilitation actions by governments; b) better focus advocacy efforts; c) provide additional support for the successful conclusion of the ongoing WTO negotiations; d) mobilize technical assistance and capacity building efforts for developing countries in a more targeted way.
3. The first phase of the work [OECD Trade Policy Working Paper no.118] analyzed the trade facilitation indicators for OECD countries and Hong Kong, China and identified areas that impact the most on trade volumes and trade costs. The current, second phase of the work focuses on non-OECD countries [scoping paper TAD/TC/WP(2011)12], in line with the call from the OECD Trade Facilitation Experts meeting that took place in October 2010 [TAD/TC/WP(2010)34], stressing the 1. For the purposes of the Doha Round negotiations, discussions aim to “clarify and improve relevant
aspects of Articles V, VIII and X of the GATT 1994 with a view to further expediting the movement, release and clearance of goods, including goods in transit”

TAD/TC/WP(2012)24
6
importance of the indicators for non-OECD countries, not only in light of the challenge of implementation of any future WTO agreement, but more generally as they seek to improve the efficiency of their border processes and further integrate into global markets.
II. The structure of the work and the dataset
4. The first step to composing specific indicators for each trade facilitation measure or family of measures amenable to economic analysis was to identify the key elements making up each indicator. The current structure of the WTO negotiation process was followed closely in order to maintain the relevance of the resulting indicators for negotiators, implementing authorities and donors. The Draft Consolidated Negotiating Text (DCNT) on trade facilitation includes 12 families of measures, covered in 12 articles of the draft agreement:2
Article 1 Publication and Availability of Information (covering publication; information available through Internet; enquiry points; and notification) Article 2 Prior Publication and Consultation (covering intervals between publication and entry into force; opportunity to comment on new and amended rules; and consultations) Article 3 Advance Rulings Article 4 Appeal Procedures Article 5 Other Measures to Enhance Impartiality, Non-Discrimination and Transparency (covering conditions applied to import alerts; detention of shipments; and test procedures) Article 6 Disciplines on Fees and Charges Imposed on or in Connection with Importation and Exportation Article 7 Release and Clearance of Goods (including pre-arrival processing; separation of release from final determination and payment of Customs duties, taxes, fees and charges; risk management; post clearance audits; average release times; authorised operators; and expedited shipments) Article 8 Consularization Article 9 Border Agency Cooperation Article 10 Formalities Connected with Importation and Exportation (covering their periodic review; reduction; and harmonisation with international standards; the acceptance of copies of documents; use of single windows; disciplines on pre-shipment inspection and customs brokers; and temporary admission of goods) Article 11 Freedom of Transit Article 12 Customs Cooperation
5. These twelve families of measures have been re-organized, in order to take into account similarities between measures, underlying shared components, as well as areas where further distinctions were warranted. Another indicator, meant to capture elements of good governance and impartiality of border administrations, was also added.
2. Negotiating Group on Trade Facilitation, WTO Draft Consolidated Negotiating Text,
TN/TF/W/165/REV.13, 17 October 2012. The text also includes three more articles: Art.13 on Institutional Arrangements; Art.14 on National Committee on Trade Facilitation; and Art.15 on Cross-Cutting Matters; and a Section II on Special and Differential Treatment Provisions for Developing Country Members and Least Developed Country Members.

TAD/TC/WP(2012)24
7
6. This reorganisation resulted in the following sixteen indicators on import export and transit trade:
a. Information availability [Art.1+2] b. Involvement of the trade community [Art.2] c. Advance Rulings [Art.3] d. Appeal Procedures [Art.4] e. Fees and charges [Art.6] f. Formalities – Documents [Art.7+10] g. Formalities – Automation [Art.7+10] h. Formalities – Procedures [Art.5+7+10] i. Cooperation – Internal [Art.9§1 and 2 ] j. Cooperation – External [Art.9§3+12] k. Consularization [Art.8] l. Governance and Impartiality m. Transit fees and charges [Art.11] n. Transit formalities [Art.11] o. Transit guarantees [Art.11] p. Transit agreements and cooperation [Art.11]
7. The four transit-specific indicators were developed specifically for this second phase of the work. While the first phase of the trade facilitation indicators work did not consider feasible the estimation of a separate, statistically robust, transit indicator within the OECD sample3, transit trade was recognised as a significant issue for developing landlocked and transit countries and the transit-specific indicators will be calculated separately [TAD/TC/WP(2012)24/ADD1].
8. Most measures reflected in the variables (single window, fees and charges, etc.) draw on the definitions of the WTO Negotiating Group on Trade Facilitation, to be found in the Draft Consolidated Negotiating Text (TN/TF/W/165/REV.13). Annex 1, listing the 78 import and export variables4, indicates, where appropriate, the DCNT Article linked to each variable and provides additional annotations to explain the scope and coverage of the variables. The variables seek to reflect not only the regulatory framework in the concerned countries, but delve, to the extent possible, into the state of implementation of various trade facilitation measures. Slight variations from the list of variables used for the OECD sample are due to the need for adjusting the composition of the indicators to reflect developing country specificities, including differences in the business, administrative and infrastructure environment, and data collection difficulties.5
9. Data to calculate TFIs for non-OECD countries were collected by the Secretariat from publicly available sources (Customs websites, official publications such as Customs Codes, annual reports, public databases, etc.) for nearly all WTO Members and Observers that had not been included in the previous phase of the work6. Annex 2 provides a short description of the sources used. Each country’s
3. Including only four landlocked countries and not identifying separately the countries of transit involved.
4. The transit indicators contain 19 variables. These are presented in Addendum 1.
5. Like for the OECD sample, some variables for which data were scarce across the whole non-OECD sample were dropped from the list of variables.
6. The Secretariat was not able to collect data on trade facilitation measures from public sources or directly from the concerned countries’ administrations for a number of countries including Egypt, Dominican Republic, Djibouti, Tajikistan, or Uzbekistan. Furthermore, the database does not include countries such

TAD/TC/WP(2012)24
8
dataset was checked for accuracy and for filling in missing data with respective capitals, although a number of data gaps remain at this stage despite the verification process. This resulting database contains information about 106 non-OECD countries, of which 95 are WTO Members and 11 WTO Observers. The database provides a very wide coverage of countries, including 21 low income, 32 lower middle income, 38 upper middle income, as well as 15 high income non-OECD countries. This is a representative sample of countries covering all continents, including landlocked countries, least developed countries as well as major emerging economies, and also several high-income non-OECD countries. The list of covered countries is included in Annex 3.
10. Contrary to the OECD sample, which covered a relatively homogeneous group of high income countries, sharing many governance, infrastructure, structure of production and trade links characteristics relevant for trade facilitation, the current sample includes countries with widely varying characteristics in terms of income, geography and level of development. In order to reflect these differences which may result in differing outcomes as to the relative impact of the trade facilitation indicators, several groups of countries (as opposed to individual countries) were formed according to a number of income, geographic, as well as economic partnership criteria. With respect to income, countries were grouped according to the World Bank’s classification of low income (LICs), lower middle income (LMICs), upper middle income (UMICs) and high income countries, respectively. In what concerns geographical groupings, the following regions were selected: Sub-Saharan Africa (SSA), Middle East and North Africa (MENA), Asia, Latin America and the Caribbean (LAC), Eastern Europe (non-OECD) and Central Asia (EAC). Several economic partnership groupings were selected, including APEC Member countries and ECOWAS countries. The lists of groups are given in Annex 4.
III. The impact of the TFIs on trade flows and trade costs
11. Following the construction of the indicators, their impact on trade flows and trade costs is estimated. This quantitative analysis allows observing which areas of trade facilitation lead to higher changes in trade flows and trade costs, respectively. However, this does not allow organising the indicators in a preferential implementation order, i.e. sequencing of interventions. In order to do this, additional data on the implementation dates of the different measures would be needed.
12. Regressions are run for goods trade in different sectors at aggregated levels7, but also separately for the agriculture and manufacturing sectors. Indicators are calculated for the most recent period, but the gravity model is run over the period 2002-108.
The Impact of the TFIs on bilateral trade patterns
13. The impact of TFIs is first tested on bilateral trade flows through a gravity trade model. The “classical” trade gravity model, in which trade is regressed on a number of time-invariant trade
as the Democratic Republic of Congo or Lao People’s Democratic Republic, for which the absence of data on trade flows does not allow to estimate the impact of trade facilitation.
7. Bilateral trade data is drawn from WITS COMTRADE database, in the SITC Rev.3 nomenclature. The following sectors are included: agriculture, manufacture, mineral fuels and mining products.
8. TFIs for non-OECD countries are built with the latest information available. In order to enlarge the number of observations, take into account for multilateral resistance and price variation, a panel over the period 2002-10 is considered. From the way the indicators are built and considering that we do not control at this stage for the rate of implementation of measures, some categories within the TFIs can be viewed as relatively stable over this period. A cross-section for the year 2009 is run as a robustness check.

TAD/TC/WP(2012)24
9
impediments/promoters such as per capita incomes, physical, cultural and administrative distance, is augmented by introducing the computed TFIs. The model tests the direction of change in bilateral trade following improvements in TFIs and calculates their elasticities. Our hypothesis, in line with existing literature, is that bilateral trade flows between two countries depend not only on the specific costs of trading bilaterally between them, but also on the importance of those costs relative to the ones linked to trading with the rest of the world.9
14. The objective of this quantitative assessment is to exploit the possibility of differentiated impacts of trade facilitation measures on trade, across the selected country groups. This will allow highlighting whether priorities differ across such groups. As discussed above, various criteria are considered for grouping developing countries: income groups (3), geographic groups (5), as well as regional economic partnership groups (2 examples). While the analysis of the OECD country sample estimated the impacts of the trade facilitation indicators considering bilateral trade between the OECD countries and Hong Kong, China only, the present analysis considers bilateral trade between all the countries in the TFIs database, including the OECD countries for which the TFIs were calculated in the previous study. A possible asymmetric impact of TFIs on exports and imports is also accounted for, by including in the gravity model the country groups alternatively as exporters and importers10. This will permit observing whether it is not only the TFIs performance on the importer-side (exporter-side) that matters, but also if the trading partner’s trade facilitation performance is equally important for bilateral trade. Each specification undergoes different checks.
15. Across all specifications, the results are stable for the “classical” variables of the gravity equation, which bear the expected signs and are statistically significant. The most statistically meaningful results on the impact of the measures on trade flows are obtained when all sectors all included. The measures that seem to have the highest and most robust impact across developing countries, i.e. the low and middle income country groups, are (a) Information Availability, (f) Formalities - Documents, (g) Formalities – Automation, (h) Formalities – Procedures, and (l) Governance and Impartiality. Less robust results are obtained for consultations, advance rulings, appeal procedures, fees and charges, and border agencies cooperation – external and internal, where we also encounter the most prevalent data difficulties. Measures covering (h) Formalities and procedures, (f) Formalities and documents, (l) Governance and impartiality result equally important for manufacturing trade. More consistent results are obtained for (b) Involvement of the trade community, (c) Advanced rulings and (d) Appeal procedures are obtained at the manufacturing sector level. An important result that is worth highlighting is the fact that indicator (l) exerts a very high impact when the importer countries sample is restricted in the regressions to middle income countries.
16. A particularly noteworthy result of the analysis is that the impact of the TFIs is significant not only in specifications concerning developing countries as importers, but equally so when developing countries are exporting to the rest of the countries (developing and developed economies) in the overall sample. Improving the efficiency of export procedures and addressing border bottlenecks on the export side are important components of trade facilitation measures. This result confirms that 9. We therefore adopt Baier and Bergstrand’s (2009) approach, which consists of computing “multilateral
resistance” (MR) terms based on bilateral trade cost data between all country pairs and the size of one economy relative to the size of all others (details on the methodology and specifications are provided in Annex 5).
10. Saslavsky and Shepherd (2012) use such restrictions to their total sample to highlight the importance of trade facilitation (illustrated through the LPI) on selected trade of final goods and intermediates for Asian countries as exporter and importers, as well as for North-South and South-South trade. Our gravity specifications are ran by limiting each time the sample of exporters and importers alternatively to our selected groups, having as trading partners all the other countries.

TAD/TC/WP(2012)24
10
improvements in the trade facilitation environment of developing countries are essential for increasing their export performance.
17. Results are less robust for the agriculture sector trade across the different groups, where the coefficient signs for some of the TFIs result contrary to expectations or the estimated impacts are not significant. This can be largely explained by the fact that the design of the indicators includes few agricultural sector specific variables, such as the distinction between perishable and non-perishable goods and that, with respect to those, available data was scarce. However, the model seems to fit rather well to the agricultural sector of lower and upper middle income countries, where indicators: (a) Information availability, (c) Advance rulings, (f) Formalities-documents, (g) Formalities-automation, (h) Formalities-procedures and (l) Governance and impartiality are positive and significant.
Trade flows impacts by income country groupings
18. When low income countries are tested, the Formalities group of indicators, (f) Documents, (g) Automation and (h) Procedures seem to have the most important impact on trade flows (Appendix 1). With respect to both middle income countries groups, indicators (h) Formalities-Procedures, (f) Formalities-Documents, (l) Governance and Impartiality, and (a) Information Availability seem to have the strongest impact. When the importers sample is restricted to middle income countries, indicator (c) Advance Rulings has a positive and significant coefficient. In the case of lower middle income countries, (b) Involvement of the trade community and (d) Appeal procedures exert a significant impact on trade. Results are generally confirmed at the manufacturing trade level (Tables 5-10 in Appendix 1).
Trade flows impacts by geographical and regional country groupings
19. The impact of the TFIs is further tested for selected geographical groups11. The measures that seem to matter most for Sub-Saharan Africa are: (f) Formalities – documents, (l) Governance and impartiality and (g) Formalities – automation. Indicators (b), (c), (d), (e) and (j) also result very important for the Sub-Saharan Africa (SSA) region; the same set of indicators impact in a positive and significant way manufacture and agriculture trade. For Asian countries, results point to Formalities indicators: (h) Procedures, (f) Documents and (g) Automation. Indicators (a), (b), (d) are also important for this group; results are not consistent here for (c) Advance rulings and (e) Fees and charges. Interestingly, for Latin America and the Caribbean (LAC) countries and for Eastern Europe non-OECD and Central Asia countries (EAC), results are relatively similar in terms of the sets that have the highest impact, namely (h) Formalities – procedures, (f) Formalities – documents and (a) Information availability. (c) Advance rulings and (e) Fees and charges are also important for the LAC group. Results for the manufacture and agriculture sectors in the case of MENA and EAC groups are more ambiguous (Tables 11-20 in Appendix 1).
20. Interesting results are obtained when testing the impact of TFIs on intra-regional trade for each of the geographic groups (e.g. countries in the Sub-Saharan Africa region trading only with Sub-Saharan Africa countries). For the Sub-Saharan Africa region, indicators: (f) Formalities – documents, (l) Governance and impartiality, and (g) Formalities – automation result equally statistically significant than in the specification where Sub-Saharan African countries trade with all the other economies. A major factor behind the low level of intra-African trade has indeed been identified as the wide range of prevailing trade facilitation constraints (African Union, 2012). Recent literature states that the measures currently discussed in the framework of the WTO Negotiations on Trade Facilitation 11. Similarly, the importer (exporter) sample is restricted alternatively to these groups. For each of the
geographical groups, we also test the impact of trade facilitation measures on intra-regional trade.

TAD/TC/WP(2012)24
11
have also the potential to reduce informal cross-border trade (Lesser and Moisé, 2009). The model seems to fit very well also to the data for Asia and the Latin America and the Caribbean regions.
21. Two examples of regional economic partnerships, APEC and ECOWAS, have also been tested. For the APEC group, the most important sets of measures result to be (g) Formalities – automation, (h) Formalities – procedures and (b) Involvement of the trade community. For the ECOWAS group, the most important sets of measures seem to be (f) Formalities – documents and (l) Governance and impartiality, following thus a similar pattern to the Sub-Saharan Africa group (Tables 21 and 22 in Appendix 1).
22. Less robust results for some of the remaining indicators do not necessarily mean that those indicators are not relevant for trade facilitation, but that data gaps for the developing countries sample do not allow firm conclusions to be drawn at this stage.
The impact of the TFIs on trade costs
23. The impact of the TFIs is also tested against trade costs. The exercise is based on the premise that the trade facilitation measures identified should decrease bilateral trade costs. Trade costs were calculated on the basis of the methodology developed by Novy (2008) and tailored by Duval and Utoktham (2011)12 in the ESCAP Trade Cost Database (Version 1) to developing countries data shortcomings. According to the Novy (2008) equation, trade costs can be inferred from bilateral and intra-national trade, pointing to how much more expensive it is to trade at an international level compared to the intra-national level (see details in Annex 6). This is a comprehensive measure of trade costs, capturing not only international transport costs and tariffs, but also a wider range of trade costs that make it harder to trade goods between rather than inside countries (e.g. border infrastructure, customs and clearance procedures, behind-the-border regulatory measures, differences in business and investment climates) (Shepherd, 2010; Duval and Utoktham, 2011). The calculated trade costs between two trading partners are a geometric average of trade costs in both directions. Trade costs calculated on the basis of this methodology are regressed against “classical” variables such as distance, common border, common language, and tested with alternative specifications for the introduction of the TFIs (as detailed in Annex 7). A quantitative contribution of each indicator to the reduction of trade costs is obtained through a “decomposition of variance” (details in Annex 8).
24. The impact of TFIs on trade costs is tested for the same country groups as in the trade flows section. The trade costs data sample is alternatively restricted to countries in each selected country group and all their trading partners. The results for trade flows are generally confirmed for trade costs as well (Table 23 in Appendix 2). The measures that had the highest impact on trade flows seem to be having an equally strong impact on the reduction of trade costs, although for each country group the ranking can differ. These slightly different impacts can be explained by the fact that, while trade costs are taken as a function of bilateral determinants only, in the case of trade flows the importance of the costs of trading bilaterally relative to the costs of trading with the rest of the world and the sizes of the other economies are also accounted for.
25. When analyzing bilateral trade costs between low income countries with the rest of the countries, (l) Governance and impartiality, (f) Formalities – documents and (g) Formalities – 12. Duval and Utoktham (2012) provide a more refined way of calculating trade costs for developing
countries by taking into account estimations for developing countries’ gross output and obtaining sectoral estimates (for agriculture and manufacturing). This improved methodology, available in the second version of the UNESCAP Trade Cost Database, was not possible to use here due to data limitations, which would have led to a drastic reduction of the covered countries in the TFIs dataset.

TAD/TC/WP(2012)24
12
automation exert the highest impact (estimated potential reductions in trade costs of 1.9%, 1.4% and 0.95% respectively). For lower middle income countries, the sets of measures that seem to contribute to lowering trade costs the most are the Formalities set of indicators: (f) Documents (1.9%), (h) Procedures (1.6%) and (g) Automation (1.5%), while for upper middle income economies, the indicators prove to be (h) Formalities – Procedures (1.8%), (g) Formalities - Automation (1.7%) and (l) Governance and impartiality (1.4%) (see Table 3 in Annex 9).
Figure 1. Potential overall trade costs reductions by income groupings
26. When restricting the sample to countries in each geographic group and all their trading partners, the areas that seem to contribute the most to the reduction of trade costs in Sub-Saharan Africa are (g) Formalities – automation, (f) Formalities - documents and (b) Involvement of the trade community (estimated potential reductions of 2.3%, 1.7% and 1.2% respectively); in Middle East and North Africa, the highest potential for cost reductions seems to lie in the area of (g) Formalities – automation (1.6%), (b) Involvement of the trade community (1.3%) and (h) Formalities – procedures (0.9%). For Asia, cost reductions would result from improvements in the areas of (g) Formalities - automation (2.1%), (f) Formalities – procedures (1.5%) and (d) Appeal procedures (0.9%). In the case of Latin America and the Caribbean, the sets of measures would be (h) Formalities – procedures (2.0%), (f) Formalities – documents (1.5%) and (l) Governance and impartiality (1.0%). Lastly, with respect to Eastern Europe and Central Asia, the most statistically significant results are obtained for (g) Formalities – automation (1.5%), (f) Formalities – documents (1.2%) and (b) Involvement of the trade community (0.8%) (see Table 4 in Annex 9).
Figure 2. Potential overall trade costs reductions by geographical groupings
0
0.5
1
1.5
2
(f) (l) (g) (f) (h) (g) (h) (g) (l)
LICs LMICs UMICs
0
0.5
1
1.5
2
2.5
(g) (f) (l) (g) (b) (h) (g) (f) (d) (h) (f) (l) (g) (f) (b)
SSA MENA Asia LAC EAC

TAD/TC/WP(2012)24
13
27. When all the TFIs are added within the same regression13, important outcomes are obtained with respect to the total impact on trade costs across the different groups. For income level country groups, as well as for geographic groups, overall trade costs reductions based on trade facilitation improvements result significant. For low income countries, this average trade costs potential reduction is estimated at 12%, while for lower and upper middle income country groups, this is estimated at 14% and 11%, respectively (Table 3 and 4 in Annex 9). Combined, the total effect of the TFIs is thus greater than the simple sum of the impacts of their individual components, confirming the importance of undertaking trade facilitation in a comprehensive manner rather than simply focussing on isolated measures.
28. The results for the rest of the indicators do not mean that they are not relevant. Data limitations do not allow for more solid conclusions to be drawn at this stage. Further improvements in the dataset or extending time series for the indicators could highlight a statistically significant impact of other indicators on trade costs, stable across different specifications.
IV. Reflections on the indicators
29. This section presents general observations on the trade facilitation areas covered by each of the indicators, both as regards to the full sample of non-OECD countries (91 developing countries and 15 high income non-OECD countries) and to the country groups considered within the quantitative analysis. The section highlights the most important country variations and what they mean for country performance. It also draws attention to interpretation issues raised by the different variables, in particular for trade facilitation areas where data shortages make interpretations across country performances difficult.
30. The main facilitation areas where reliable information is scarce concern indicators (e) Fees and Charges, (i) Internal Border Agency Cooperation and (j) External Border Agency Cooperation. Data challenges concerned also particular dimensions within the various indicators, including (v13) targeted stakeholders involved in public consultations, (v17) the number of advance rulings requests, (v41) percentage of procedures carried out electronically, (v47) the publication of the average clearance time, or (v54) post-clearance audits.
31. Figures 3 and 4 provide an overall picture of the differences across the various groups of countries in the state of implementation for the sets of measures. This overview confirms that there are differences prevailing between the groups of countries, more pronounced as regards income groups than geographical groups. It also allows observing in which areas the gaps are larger to fill. There appear to be more significant disparities related to income level in the areas of consultations, advance rulings, appeal procedures or documents than in the areas of automation or procedures simplification. Among geographical groups performance variations are fewer, with the striking exception of consultations, advance rulings and, to a lesser extent, documents. The sub-sections below will explore more in-depth differences between sets of measures across these groups.
13. Apart from “ambiguous” indicators, i.e. indicators too correlated to the others to be included without
biasing the outcomes or producing outcomes with unexpected signs.

TAD/TC/WP(2012)24
14
Figure 3. TFIs and developing countries income groups
Figure 4. TFIs and developing countries geographic groups
0
0.2
0.4
0.6
0.8
1
1.2
1.4
1.6
1.8
Information availability
Consultations
Advance rulings
Appeal procedures
Fees and chargesFormalities - documents
Formalities - automation
Formalities - procedures
Governance and impartiality
LICs LMICs UMICs
0
0.2
0.4
0.6
0.8
1
1.2
1.4
1.6
1.8
Information availability
Consultations
Advance rulings
Appeal procedures
Fees and chargesFormalities - documents
Formalities -automation
Formalities - procedures
Governance and impartiality
Sub-Saharan Africa
Middle East and North Africa
Asia
Latin America and the Caribbean
Eastern Europe (non-EU) and Central Asia

TAD/TC/WP(2012)24
15
(a) Information availability
32. Information availability measures refer both to web-based and to other forms of publication about Customs and border-related rules and procedures, as well as to transparency mechanisms such as enquiry points. This group of measures is relatively well implemented among surveyed countries. Websites offering a minimal set of information related to import or export procedures are available in all of the surveyed countries with the exception of few Sub-Saharan Africa countries (Burundi, Gabon, The Gambia, and Liberia). The great majority of these sites display information in one of the WTO’s official languages (English, French, or Spanish). The large majority of countries also seem to provide information on the rate of duties, as well as enough information for understanding the basic steps of the import and export procedures (67% among surveyed LICs). On the other hand, fewer countries are directly providing documents and forms directly for download on the Customs website, especially among low income countries. Areas that seem less thoroughly implemented among non-OECD countries in our sample relate to the publication of agreements and the publication of decisions and examples of Customs classification. Based on the overview of Customs websites, around a half of the countries in the dataset seem to be publishing such information and the share is even lower among low income countries.
Figure 5. Information availability measures
33. The efficiency-enhancing potential of enquiry points seems now well understood around the world. Most of the lower middle and upper middle income countries and 52% of surveyed LICs maintain one or more enquiry points and offer the possibility to ask questions on Customs-related issues, either by telephone or by means of an online form. Most of this information is also available on the Customs website. It should be noted however that the database indicates the availability of enquiry points and other mechanisms to respond to questions, it does not assess the quality of response and

TAD/TC/WP(2012)24
16
information provided by such enquiry points, for which further field research would have been necessary.
34. Finally, less than half of the countries in the sample seem to provide an interval between the publication and entry into force of all new or amended trade related laws and regulations; for a third of the countries, it was not possible to find any information on this topic.
(b) Involvement of the trade community
35. Measures aiming to ensure the involvement of the trade community to the design and everyday operation of border-related policies and procedures refer mainly to the consultations between traders and the government, their scope, contents and outcomes. Publicly available information was difficult to find as regards this group of measures. Half of the countries in the sample – the large majority of which are middle income countries and high income non-OECD countries – seem to hold regular consultations between traders and the administration. Although we would a priori expect large differences between countries with respect to the frequency of such consultations, it was not possible to gather information on their number in the case of countries that do hold consultations between traders and government.
36. Likewise, it proved difficult to identify the types of audiences that have access to such consultations or whether public comments formulated during the consultations are taken into account in the drafting or amendment of concerned regulations. The question about targeted audiences was proxied with an International Profiles Database variable assessing whether dialogue structures within a country consider the interests of the country’s major economic and social actors. Information was available for 65 developing countries and consultations seem to be open to all concerned stakeholders for 30 out of these 65 countries.
Figure 6. Consultations between traders and governments
0
0.2
0.4
0.6
0.8
1
1.2
1.4
1.6
Communication of policy
objectives
Consultations
Open consultations
Adoption of public
comments
LICs
LMICs
UMICs

TAD/TC/WP(2012)24
17
(c) Advance rulings
37. More than two-thirds (76 out of 105) of the countries in the sample provide a mechanism for advance rulings (AR). The remaining 29 countries14 are equally distributed between the low, lower middle and upper middle income groups. Unlike for the OECD countries sample, it was not possible to keep in the construction of the indicator any variables related to the number of rulings issued or requested. As the construction of the indicator includes thus only variables relating to the characteristics of the advance rulings system, any potential causal relationship should be between the advance rulings indicator and trade volumes or trade costs and not the other way round (i.e. we would not expect trade volumes to drive the demand for advance rulings but, on the contrary, advance rulings causing changes in trade volumes or trade costs). On the other hand, the lack of information on this and on a number of characteristics-related aspects of the indicators, as described below, probably explains the fact that outcomes for this indicator have been less consistent in terms of statistical significance across specifications for some of the groups.
38. Anecdotal information seems to indicate that the levels of use of advance rulings mechanisms differ significantly across countries, but accurate statistics on the number of advance rulings requests in most of the countries issuing advance rulings were not available. Most advance rulings issued seem to concern tariff classification, a scope that is similar to patterns in the OECD sample and more limited than the scope of the mandatory advance ruling scheme proposed in the WTO negotiations. Less data is available on other covered areas, such as origin or valuation methods.
39. More than half of the countries providing a mechanism for advance rulings indicate that they propose a website dealing with AR procedures. The large majority of these web-pages are only providing information on advance rulings procedures, but do not have an interactive interface, i.e. that would allow filling AR requests online. On the other hand, information on the duration of validity of issued advance rulings is missing for 33 of the countries having an advance rulings mechanism, most of them upper middle income countries. Among the remaining 43 countries, the duration of validity of advance rulings varies from 6 months to unlimited validity, i.e. until the advance ruling is either modified or revoked.
14. For which it was not possible to ascertain whether an advance rulings mechanism exists or not.

TAD/TC/WP(2012)24
18
Figure 7. Advance rulings
40. The rate of implementation varies widely in areas such as the publication of advance rulings of general interest, the possibility to request the review of an advance ruling, and the disclosure of the motives behind the refusal to issue or the revocation of advance rulings. For almost all low income countries, there is either no information available about these aspects or there is evidence that they do not implement them. On the contrary, in the case of middle income countries having an AR mechanism, the large majority is implementing all of the above.
(d) Appeal procedures
41. The indicator on appeal procedures refers to a number of basic characteristics of the appeal system in concerned countries, such as the transparency, fairness, accessibility, timeliness and effectiveness of the applicable rules and of outcomes. A well functioning appeal procedures mechanism ensures a transparent application and enforcement of the legislation by the Customs administration and related agencies. Drawing on the information provided in the Global Express Association questionnaire, it would seem that many of the countries surveyed reportedly display information on appeal procedures on a dedicated website, although it was not possible to locate web addresses and verify the content for a number of countries in the sample.
0
0.2
0.4
0.6
0.8
1
1.2
1.4
1.6
Issuance of advance rulings
Available information on AR
Publication average issuance time
Publication of AR
Possibility to request review
Motivated refusal to issue or revocation
LICs LMICs UMICs

TAD/TC/WP(2012)24
19
Figure 8. Appeal procedures
42. Information on the patterns of implementation across countries, including timeliness, is scarce and would deserve further investigation. The data drawn from the Institutional Profiles Database (IPD) on the equality of treatment between national and foreign actors in commercial disputes and the extent of implementation and speed of court rulings in commercial matters (the value of each index ranges from 0 to 4) indicates that there is a large area for improvement in the judicial mechanism covering commercial matters.
Figure 9. Court rulings in commercial matters
Source: Authors’ calculations based on Institutional Profiles Database 2009 data.
0
0.5
1
1.5
2
Publication of information on
appeal procedures
Judicial appeal procedures
Time limit for deciding appeals
Information on the motives of the decisions
LICs LMICs UMICs
0
1
2
3
4
LICs LMICs UMICs
Equality of treatment between national and foreign actors
Extent of implementation and speed of court rulings

TAD/TC/WP(2012)24
20
(e) Fees and charges
43. Publicly available information on applicable fees and charges is very scarce. For half of the countries in the sample, it was not possible to confirm whether information can at least be found in the Customs Code. Only a few countries have a dedicated fees and charges webpage on the Customs website, and they are largely upper middle income and high income non-OECD economies, while a few others have reported having dedicated websites on fees and charges. Information on the calculation of fees and charges on an ad-valorem basis was available for only 46 countries. Data available mostly from the WTO Trade Policy Reviews points to 15 developing countries applying an ad-valorem calculation basis for fees and charges. It would also appear that 22 of the surveyed developing countries’ Customs administrations apply fees for services during normal working hours. The scarcity or poor visibility and accessibility of publicly available data on fees and charges point to the need of improving performance in this area. Missing data may also explain that outcomes for this indicator were not robust across several of the groups and specifications.
44. The level of various fees and charges (e.g. port charges, airport charges, road transport charges, rail transport rates, warehousing/transloading charges, agent fees) are considered high or very high by an average of 50% of respondents to the LPI survey for the low income country group; 46% of respondents for the lower middle income group; and 44% of respondents for the upper middle income group.
(f) Formalities - documents
45. Measures relating to document requirements refer both to the extent of harmonisation of trade documents, through reliance to international standards and the simplification of documentary requirements, through the use of copies and the reduction of the number and complexity of required documentation. The information concerning the use of copies remains limited and was available in public sources or provided directly from concerned administrations for less than half of the countries in the sample, among which non-OECD APEC members. Among those countries, a half seems to accept copies of documents.
46. Regarding the rest of the variables within this indicator, differences between income groups in this area are striking. Low income countries lag significantly behind the other groups in terms of the number of documents necessary for exporting and importing, as well as the time required on average for the preparation of such documents, pointing to this area as a priority target in future policy interventions and technical assistance and capacity building endeavours. Middle income countries require fewer documents for importing and exporting, and the time necessary to prepare such documents is lower than in low income countries. These performances can be directly correlated with the implementation of Electronic Data Interchange (EDI) and Single Windows systems, as middle income countries are better performers in these areas (see following sections); the implementation of such systems allows for simplifying documentary requirements and reducing the complexity of documents submission.

TAD/TC/WP(2012)24
21
Figure 10. Documents and time required for exporting and importing
Source: Authors’ calculation based on Doing Business Trading Across Border indicators, World Bank.
47. Compliance with international standards15 remains relatively low among the surveyed countries. Out of the 91 developing countries, 43 countries have ratified at least two of the considered International Conventions, 33 have ratified only one, while the remaining 15 economies have not ratified either of the three. However, as in the case of the OECD sample, scoring for the “international standards compliance” variable (v36) needs to be interpreted with caution; ratification of a treaty does not automatically mean its full and immediate implementation, while some countries in the sample may have not yet ratified such conventions but already apply some of the provisions in practice.
(g) Formalities and automation
48. This indicator covers a series of very important dimensions of trade facilitation, including automated procedures, electronic interchange of documents, or the application of risk management procedures. It appears that for the majority of the surveyed countries, IT systems capable of electronic data exchange are in the process of implementation or already functional. For most of lower and upper middle income countries, such an IT system seems by now ready for EDI, while most of low income countries state that such a system is in the process of implementation (Figure 12).
15. This variable accounts for the ratification of the following International Conventions: the Istanbul
Convention, the Harmonized System Convention and the Revised Kyoto Convention.
0 2 4 6 8 10 12 14 16 18 20
LICs
LMICs
UMICs
time necessary to prepare documents for export
time necessary to prepare documents for import
documents export
documents import

TAD/TC/WP(2012)24
22
Figure 11. Formalities and automation
Figure 12. IT systems and EDI
49. This information needs to be corroborated with the data concerning the availability of full-time automated processing for Customs agencies; it would seem that only 40 countries report the existence of full-time automation, with the large majority being upper middle income and high income non-OECD countries.
0
0.2
0.4
0.6
0.8
1
1.2
1.4
1.6
Use of risk management
IT systems capable of accepting EDI
Availability for full-time automated
processing
Quality of telecommunications
and IT
LICs
LMICs
UMICs
0
2
4
6
8
10
12
14
16
18
20
LICs LMICs UMICs
no EDI in the process of implementation system ready for EDI

TAD/TC/WP(2012)24
23
Figure 13. Availability of full-time automated processing for Customs agencies
50. Very little recent information was available on the percentage of procedures that can be performed electronically, and this was obtained through the direct responses of countries at the stage of verification. With respect to risk management, one of the most important aspects of automation, it seems that 32 of the countries have such a system successfully implemented, in particular upper middle income and high income non-OECD countries. 72 of the countries either do not have such a system or are in the process of implementing one. These observations point to an important area of performance improvement.
Figure 14. Risk management implementation
(h) Formalities and procedures
51. The Procedures indicator also incorporates a series of very important dimensions of trade facilitation, including single windows, pre-arrival processing, physical inspections, post-clearance audits (PCAs), separation of release from clearance and the concept of authorized traders, all of them central aspects in the operation of Customs agencies.
0
2
4
6
8
10
12
14
16
18
20
LICs LMICs UMICs
no yes
0
2
4
6
8
10
12
14
16
18
20
LICs LMICs UMICs
no RM in the process of implementation operational RM

TAD/TC/WP(2012)24
24
Figure 15. Formalities and procedures
52. Single Windows are a very important trade facilitation measure, the characteristics and implementation of which can vary considerably among countries. It would seem that most of the countries in the sample are in the process of implementation of some type of single window, or have a scheduled an intervention in this area.16 21 countries state that they already make use of a Single Window, more than half being upper middle income economies. The fact that the majority of surveyed countries state that a Single Window is planned or in the process of implementation highlights the importance of efforts undertaken in this area, as the implementation of a Single Window can only be achieved within a medium-term timeframe and with the involvement of a wide range of stakeholders; meanwhile, planning, approach and budget outline will differ across countries.
53. The link between the development of single window mechanisms and advances in IT systems is not directly upheld by the data, as the number of middle income countries actually implementing a Single Window with a view to simplifying border formalities for traders and other economic operators is much lower than the number of countries stating that their IT systems are ready for EDI or that a risk management approach is implemented. However, available information on the institutional architecture and the number of different agencies with a direct involvement in the cross border movement of goods was not sufficient to indicate whether the missing link for capitalizing on the improvements of IT systems lies with the quality of cooperation and information exchange between different government agencies, Customs departments, and border control posts.
16. Although not all the information on this topic was confirmed directly by concerned countries.
0
0.2
0.4
0.6
0.8
1
1.2
1.4
1.6
1.8
Pre-arrival processing
Elimination of pre-shipment
inspection
Adjustment of working hours to
commercial needs
Requirement for clearance by
Customs broker
Single Window
LICs
LMICs
UMICs

TAD/TC/WP(2012)24
25
Figure 16. Single Window implementation
54. The rates of physical inspections indicate that low income countries are characterised by a 42% rate of physical inspections, on average, compared to 27% and 25% for the lower and upper middle group, respectively. There is an inverse relationship between the rate of physical inspections and the scores for the Indicator (g) Formalities – Automation; countries with lower rates of physical inspections experiment much higher scores for that indicator (Figure 17). In particular, there seems to be a strong link between physical inspections and the pattern of risk management implementation; countries that are characterized by lower rates of physical inspections are usually the ones that are in the process of implementation or already operating a risk management mechanism. Some information was found for around 50 countries with respect to the treatment of perishable versus non-perishable goods, as regards the rate of physical inspections and the separation of release from clearance. More than half of the countries stating that treat differently perishable from non-perishable goods are upper middle income countries.
Figure 17. Rates of physical inspection and TFI (g) Formalities - Automation
Source: Authors’ calculation. Rate of physical inspections data from World Bank LPI, 2010.
0
2
4
6
8
10
12
14
16
LICs LMICs UMICs
no SW SW planned SW

TAD/TC/WP(2012)24
26
55. Countries still applying pre-shipment inspections are principally low income countries, although similar information was found for some middle income countries. Information on the application of pre-shipment inspections was mainly available either in the Customs Code or on the Customs website, together with the description of import procedures. For some of the countries that do not currently apply such a mechanism, pre-shipment inspections were actually eliminated not very long ago. 54% of countries in Sub-Saharan Africa for which data are available seem to be still applying pre-shipment inspections (15 countries), while this seems to be the case for only 2 and 5 countries in Latin America and the Caribbean and in Asia, respectively.
Figure 18. Pre-shipment inspection
Figure 19. Pre-arrival processing
56. From the data collected it would result that the countries not applying separation of release from clearance are majoritarily upper middle income economies. A large share of the countries still applies the separation of release from clearance only in specific cases or restricts it to the authorized trader status.
0
5
10
15
20
25
30
LICs LMICs UMICs
yes no
0
5
10
15
20
25
LICs LMICs UMICs
no yes

TAD/TC/WP(2012)24
27
Figure 20. Separation of release from clearance
57. The variable relating to the authorised operator programmes is drawn from the World Bank Logistics Performance Indicator. This variable allows for an assessment of the application of expedited customs clearance for traders with high compliance levels in the surveyed countries. The pattern of application of expedited customs clearance for traders with high compliance levels varies, with 28% of traders in the surveyed low income countries stating that this happens often or nearly always; the corresponding percentages are 46% and 48% of traders for the surveyed lower and upper middle income economies, respectively. From the 76 developing countries for which information is available, around a half impose the mandatory use of a third party customs broker. Variable 54 on Post-Clearance Audits (PCAs) could not be taken into account at this stage for lack of sufficient information.
(i) Border agency cooperation – internal
58. The internal border agency cooperation is another area for which information is largely insufficient. However, it is important to highlight that from the data recovered from the Global Express Association Customs Capabilities Report, many countries’ government agencies delegate controls to Customs authorities in all income groups.
0
2
4
6
8
10
12
14
16
18
LICs LMICs UMICs
no only in specific cases yes, with guarantee

TAD/TC/WP(2012)24
28
Figure 21. Government agencies delegating controls to Customs authorities
(j) Border agency cooperation – external
59. This is another area were information was scarce, which explains the less conclusive results. Although this area is of high importance for landlocked countries in particular, complete data for the four variables composing indicator (j) are only available for 10 out of 24 landlocked countries, and most of that was not actually confirmed by the concerned countries. Some of the best publicly available information on external cooperation concerns South American countries and was retrieved from the IIRSA Initiative (Iniciativa para la Integración de la Infraestructura Regional Suramericana17). On the basis of available information, joint operations seem to exist in the case of 11 out of the 24 landlocked countries. This highlights the need to reinforce information availability in this area, including through improved display of information on joint activities undertaken with neighbouring countries’ Customs on national Customs websites.
(k) Consularization
60. The database contains information on consular transaction requirements for only 67 of the countries in the total dataset. Of these, 25 countries seem to be currently imposing consular transaction requirements, equally distributed among the three income groups (LICs; LMICs; HMICs and HI non-OECD). Most of the countries applying such consular transaction requirements can be found in Sub-Saharan Africa, MENA and Asia.
(l) Governance and impartiality
61. According to the outcomes of our quantitative analysis, governance and impartiality measures seem to have a highly positive impact on trade flows and trade costs in developing countries. The indicator refers to an array of good governance characteristics, including clearly established and transparent structures and functions, the existence of a Code of Conduct and an ethics policy, internal audits and transparent provisions for financing and for internal sanctions in the Customs administrations. Countries in the sample generally provide a description of the structures and functions of the Customs administration on their respective websites. This information is usually accompanied by an organization chart. The same does not seem to apply to the provisions on the financing of the Customs Administration, as only 34 countries in the sample report to be posting such information. 17. More information available at http://www.iirsa.org/Institucional_ENG.asp?CodIdioma=ENG
0
2
4
6
8
10
12
14
16
18
20
LICs LMICs UMICs
no
yes
TAD/TC/WP(2012)24
29
62. Fifty five countries in the sample have a functional internal systems audit function out of the 57 countries for which we have information. For the rest of the countries, information was insufficient to draw clear conclusions.
63. A Code of Conduct seems to be implemented across most Customs administrations. However, the information on the implementation and transparency of sanctions against misconduct remains scarce. Some information can be found in Customs Codes, but this information is usually not very detailed. The database contains information on the existing application of an ethics policy within the Customs administration for 61 countries, 11 of which state that they do not apply an ethics policy. While 40 countries in the sample seem to be applying an ethics policy observing all of the principles of the WCO Revised Arusha Declaration18, only for some of them the ethics code is actually available on the Customs administration website. However, from the research conducted directly on countries’ Customs websites, it seems that in several countries, the ethics policy applying for all public administration employees is equally valid for Customs administration employees, without adding further specificities. It is important to note that 28 middle income countries seem to dispose of a help desk or a special body is established to guide staff on ethical issues, although no further information is available in the database on the state of functioning of such help desks and special bodies.
64. Information on the publication of annual Customs reports is available for half of the countries in the sample. 49 of these countries (mainly upper middle income and high income non-OECD countries) publish annual customs reports and make them publicly available. Meanwhile, around a third of these countries publish only partial information on Customs activities, not including sufficient information on budget and duties collected, complaints or efficiency indicators. The pattern of publication differs greatly, with countries that publish on Customs websites a rather long series of annual Customs reports and other countries that have only recently started to publish such reports.
V. Conclusions
65. The work undertaken to date in order to develop the OECD TFI database beyond the OECD membership allowed extending the coverage of the Trade Facilitation Indicators to non-OECD countries. Despite problems with data availability and a few ambiguous results, the indicators appear robust and almost all of them can be tested for their impact on trade flows or trade costs.
66. This work has focused on country groups. The main findings indicate that some indicators have a larger impact than others on trade flows and trade costs, at least in the current data and country sample. Sector specific results show that the indicators are especially valid for manufactured goods. This conclusion is consistent with the way the indicators are built, as agricultural goods specificities (especially the perishable/non-perishable nature of goods) are poorly accounted for by the indicators due to the lack of available information in this particular area. Overall, the indicators that seem to have the greatest impact on trade volumes and trade costs for trade flows are: (a) Information availability, (f) Formalities – documents, (g) Formalities – automation, (h) Formalities – procedures, (l) Governance and impartiality. When seeking to assess the relative importance of the different dimensions of trade facilitation at the manufacturing sector level, some consistent results are obtained also for (b) Involvement of the trade community, (c) Advance rulings, (d) Appeal procedures.
67. If all the TFIs are added within the same regression, their cost reduction potential would reach almost 12% of trade costs for low income countries, which is an estimate consistent with several existing studies on the overall impact of trade facilitation on trade costs. Combined, the total effect of 18. 1993 Declaration of the Customs Co-operation Council (WCO) Concerning Good Governance and
Integrity in Customs, as revised in 2003.

TAD/TC/WP(2012)24
30
the TFIs is thus greater than the simple sum of the impacts of their individual components, confirming the importance of undertaking trade facilitation in a holistic manner rather than simply focussing on isolated measures.
68. Data collection has been a major challenge. More precise results would be subject to the improvement of information available in the current database, both in terms of filling existing gaps and in obtaining further confirmation of such information directly with countries’ Customs administrations and other border agencies. However, this implies a much wider cooperation from concerned administrations.
69. The use of the indicators should enable countries sharing similar characteristics to better assess which trade facilitation dimensions deserve priority. On the other hand, data constraints do not permit, at least not at this stage, to provide indications about the best implementation sequence of various measures.

TAD/TC/WP(2012)24
31
REFERENCES
African Union (2012), “Boosting Intra-African Trade. Issues Affecting Intra-African Trade, Proposed Action Plan for Boosting Intra-African Trade and Framework for the fast tracking of a Continental Free Trade Area”, United Nations Economic Commission for Africa and African Union Report.
Anderson, J. and E. van Wincoop (2003), “Gravity with Gravitas: A Solution to the Border Puzzle”, American Economic Review 93(1), 170-92.
Anderson, J. and E. van Wincoop (2004), “Trade costs”, NBER Working Paper no. 10480, May.
Baier, S. and J. H. Bergstrand (2009), “Bonus vetus OLS: A simple method for approximating international trade-cost effects using the gravity equation”, Journal of International Economics, Vol. 77 No 1, February 2009, pp. 77-85.
Behar, A. (2009), “De Bonus Vetus OLS: Approximating the International Trade-Cost Effects of Export Documentation”, Forum for Research in Empirical International Trade Working Paper No. 37, 2009.
Behar, A., P. Manners and B. Nelson (2011), “Exports and International Logistics”, World Bank Policy Research Working Paper Series 5691, The World Bank.
Brooks, D. H. and B. Ferrarini (2010), “Changing Trade Costs Between People’s Republic of China and India”, ADB Economic Working Paper Series No. 203, Asian Development Bank, May.
Chen, N. and D. Novy (2008), “International Trade Integration: A Disaggregated Approach”, CEP Discussion Paper No. 908, January.
Choi, J. Y. (2011), “A Survey of Single Window Implementation”, World Customs Organization Research Paper No. 17, August.
Duval, Y. and C. Utoktham (2011), “Trade Costs in the India – Mekong Subregion: Identifying Policy Priorities for Trade Facilitation”, UNESCAP Trade and Investment Division, Staff Working Paper 04/11, September.
Duval, Y. and C. Utoktham (2012), “Trade Costs in Asia and the Pacific: Improved and Sectoral Estimates”, UNESCAP Trade and Investment Division, Staff Working Paper 05/11, January.
Hummels, D. (2004), “Toward a Geography of Trade Costs”, September.
Hummels, D. and V. Lugovskyy (2006), “Are Matched Partner Trade Statistics a Usable Measure of Transportation Costs?”, Review of International Economics, 14(1), 69-86.
Hummels, D. (2007), “Transportation Costs and International Trade in the Second Era of Globalization”, Journal of Economic Perspectives, Vol. 21, No. 3, pp. 131-154.
Jacks, D.S., C.M. Meissner and D. Novy (2010), “Trade Booms, Trade Busts and Trade Costs”, Working Paper, October.
Lesser, C. and E. Moise-Leeman (2009), “Informal Cross-Border Trade and Trade Facilitation Reforms in Sub-Saharan Africa”, OECD Trade Policy Working Papers, No.86, OECD Publishing, doi:10.1787/225770164564.

TAD/TC/WP(2012)24
32
Moise, E., T. Orliac and P. Minor (2011), “Trade Facilitation Indicators: The Impact on Trade Costs”, OECD Trade Policy Working Papers, No.118, OECD Publishing. http://dx.doi.org/10.1787/5kg6nk654hmr-en.
Novy (2008), “Gravity Redux: Measuring international trade costs with Panel data”, The Warwick Economics Research Paper Series, 861, University of Warwick, Department of Economics.
Pomfret, R. and P. Sourdin (2010), “Trade Facilitation and the Measurement of Trade Costs”, Journal of International Commerce, Economics and Policy, Vol.1, No.1, 145-163.
Santos Silva, J. and S. Tenreyro (2005), “The Log of Gravity”, CEPR Discussion Papers 5311.
Saslvasky, D. and B. Shepherd (2012), “Facilitating International Production Networks. The Role of Trade Logistics”, World Bank Policy Research Working Paper No. 6224, September.
Shepherd, B. (2010), “Trade Costs and Facilitation in APEC and ASEAN: Delivering the goods?”, MPRA Paper No. 21531, January.
OECD (2003), “Quantitative Assessment of the Benefits of Trade Facilitation”, TD/TC/WP(2003)31/FINAL.
UNCTAD (2011), “Technical Notes on Trade Facilitation”, Transport and Trade Facilitation Series No. 1.

TAD/TC/WP(2012)24
33
ANNEX 1. TRADE FACILITATION INDICATORS VARIABLES
Putting together the dataset confirmed that information for some variables is more difficult to obtain than for others. As such, some variables are not sufficiently supported across the sample. We calculate the indicators for countries for which available data covers at least half of the variables composing the indicator. Variables for which the rate of reply (or publicly available data) is under 40% are dropped from the construction of the indicators at this stage of the data collection. These variables are:
• C17 on the number of advance rulings requests.
• H41 on the percentage of procedures that can be done electronically (out of the total number of import/export/transit procedures).
• H47 on the publication of average clearance time.
• H54 on the percentage of Post-Clearance Audits (PCAs) carried out (out of the total yearly transactions).
• I65 on regular meetings held (including training seminars).
• J66 on the alignment of working days and hours with other neighbouring countries at border crossings.
• J68 on the development and sharing of common facilities with other neighbouring countries at border crossings.
• L75 on the clear provisions for the financing of the Customs administration.
Scores follow a multiple binary scheme where the top score (2) generally corresponds to the best performance
Indicator (a) - Information availability
Variable 1 Establishment of a national customs website 0 There is no clearly identified Customs’ website on the Internet. 1 There is an official website.
2 The website makes available a minimal set of information related to import or export procedures in one of the official WTO languages.
A national Customs website can be part of a wider website like the Ministry of Trade and Finance website. An official Customs website should at least cover the description of importation, exportation and transit procedures, electronic links to the forms and documents required, and the relevant legislation. The official WTO languages are English, French and Spanish.
Variable 2 Publication of rate of duties
0 It is not possible to find the rate of duties on the Customs website.

TAD/TC/WP(2012)24
34
2 There is information (or an electronic link) on the rate of duties.
Variable 3 Establishment of Enquiry Points 0 There are no Enquiry points to answer reasonable enquiries.
2 There are one or more enquiry points.
Enquiries of traders may refer to issues covered by [DCNT 1.3] such as: importation, exportation and transit procedures, applicable rate of duties, rules for classification or valuation, fees and taxes, restrictions or prohibitions, penalty provisions, appeal procedures and agreements with third countries.
Variable 4 Possibility to ask questions to Customs 0 There is no possibility to ask questions on Customs related matters. 2 There are possibilities to ask questions on Customs related matters.
Questions cover the same areas as the “reasonable enquiries”. Here, the enquiry point is the Customs.
Variable 5 Information on import and export procedures
0 There is not enough information on procedures and required forms and
documents. 2 There is enough information on these topics.
The quantity of information is enough to understand the basic steps of the import or export procedures. It is not possible to provide a standardized minimum level of information, it varies across the regulations of each country which are more or less burdensome and the friendliness of each customs website.
Variable 6 Procedures of border agencies
0 There is no possibility to download the required documents and forms.
2
Some documents and forms are available for downloading on the Customs website.
Variable 7 Procedures published at least xx days before entry into force
0 There is no interval between the publication of new or amended trade related laws and regulations, and their entry into force, or there is only an interval for selected new or amended trade related laws and regulations.
2 There is an interval between the publication of new or amended trade related laws and regulations, and their entry into force.
Average time is the interval generally applied in the country, whether on the basis of applicable rules, such as an Information Act, or on the basis of practice.

TAD/TC/WP(2012)24
35
Variable 8 Publication of Agreements with any country or countries relating to the above issues
0
There is no information on the official customs website about international agreements relating to importation or exportation.
2 Such agreements are available on the official customs website*.
*At least an electronic link exists on the Customs websites.
Variable 9 Publication of decisions and examples of customs classification
0 Rules and examples of customs classification are not published. 2 Rules and examples of customs classification are publicly available.
Variable 10 Transparency of government policymaking
0 The score is below the 30th percentile of the sample. 1 The score is between the 30th and 70th percentile of the sample. 2 The score is above the 70th percentile of the sample.
Source: we used as proxy World Economic Forum (WEF) Global Competitiveness Report (GCR): the score based on the reply to the question How easy is it for business in your country to obtain information about changes in government policies and regulations affecting their activities? [1=impossible; 7=extremely easy]
Indicator (b) - Involvement of the trade community
Variable 11 Communication of policy objectives
0 The number is below the 30th percentile of the sample. 1 The number is between the 30th and 70th percentile of the sample. 2 The number is above the 70th percentile of the sample.
Source: we used as proxy Logistics Performance Index (LPI): percent of respondents answering often or nearly always to the question Provision of adequate and timely information on regulatory changes.
Variable 12 Consultations between traders and government
0 There are no consultations between traders and governments.
1
There are irregular consultations between traders and governments when introducing or amending trade related laws, regulations and administrative rulings of general application.
2
There are regular consultations when introducing or amending trade related laws, regulations and administrative rulings of general application.
Relates to DCNT Article 2.3.1

TAD/TC/WP(2012)24
36
Variable 13 Targeted stakeholders
0 Consultations are limited to a specific number of stakeholders.
2 Consultations are fully open.
Stakeholders: SMEs, Large traders, Transporters, Customs brokers and Citizens, other
Source: Institutional Profiles Database (IPD) proxy : score based on the answer to the question Do dialogue structure(s) consider(s) the interests of the country’s major economic and social actors? [0 = no consultation structure. If structure(s) exist(s), note from 1 = little consideration to 4 = high consideration]
Variable 14 Adoption of public comments
0 Public comments are not taken into account. 2 Public comments are taken into account.
Category: Advance ruling
Variable 15 Issuance of advance rulings 0 Advance rulings are not issued. 2 Advance rulings are issued.
* An advance ruling is a written decision provided by a Member to an applicant prior to the importation of a good covered by the application that sets forth the treatment that the Member shall provide to the good at the time of importation or exportation. It may cover tariff classification, valuation methods and their application, duty drawback, quotas, origin of the good or applicable fees and charges. Following this definition, Binding Tariff Information (BTI) is regarded as an advance ruling mechanism.
Variable 16 Publication of necessary information on advance rulings
0 Information is not displayed on the customs website or it is only available in the relevant legislation (Customs Code).
1 There is a specific page on the Customs website dealing with Advance
Rulings procedures. 2 There is a specific page and an online request procedure is available.
Variable 17 Number of advance rulings requests (total)
0 The number is below the 30th percentile of the sample. 1 The number is between the 30th and the 70th percentile of the sample. 2 The number is above the 70th percentile of the sample.
Variable 18 Length of time for which the advance ruling is valid (duration)
0 Below the country sample average.

TAD/TC/WP(2012)24
37
2 On or above the country sample average.
* Advance rulings apply with respect to the applicant during a set period of time, unless the law, facts or circumstances supporting the original ruling have changed. The validity of the ruling may vary according to the policy area.
Variable 19 Publication of average issuance time
0
An average issuance time is not published on the Customs website or the related legislation.
2
The average issuance time is published on the Customs website or the related legislation.
Variable 20 Publication of Advance Rulings of general interest
0 Advance rulings of significant interest to other interested parties
(governments, traders…) are not published. 2 Advance rulings of general interest are publicly available.
Variable 21 Possibility to request a review of an advance ruling or its revocation or modification 0 It is not possible. 2 It is possible.
Variable 22 Refusal to issue or revocation of advance ruling are motivated 0 Refusal to issue or revocation are not motivated. 2 Refusal to issue or revocation are motivated.
Indicator (c) - Appeal procedures
Variable 23 Publication of information on procedural rules for appeal
0 There is no appeal mechanism for Customs matters or the related laws are
not publicly available.
1
There is an appeal mechanism and it is only explained in the relevant legislation (Customs Code).
2 Information is displayed on the Customs website.
Variable 24 Judicial appeal procedures 0 There is no possibility of judicial appeal.

TAD/TC/WP(2012)24
38
2
Possibility of judicial following, or independent of, the administrative appeal.
Variable 25 Time limit for deciding such appeals
0 There is no time limit for deciding such appeals. 1 The time limit for deciding appeals is above the country sample average.
2 The time limit for deciding appeals is below the country sample average.
Variable 26 Availability of information on the motives of the administration’s decisions
0 There is no information on the motives.
2
Information about the motives of the administration's decision is provided.
Variable 27 Efficiency of legal framework in challenging regulations
0 The score is below the 30th percentile of the sample. 1 The score is between the 30th and 70th percentile of the sample. 2 The score is above the 70th percentile of the sample.
Source: WEF GCR proxy : the score based on the reply to the question How efficient is the legal framework in your country for private businesses in challenging the legality of government actions and/or regulations? [1=extremely inefficient; 7=highly efficient]
Variable 28 Judicial independence
0 The score is below the 30th percentile of the sample. 1 The score is between the 30th and 70th percentile of the sample. 2 The score is above the 70th percentile of the sample.
Source: WEF GCR proxy: the score based on the reply to the question To what extent is the judiciary in your country independent from influences of members of government, citizens, or firms? [1=heavily influenced; 7=entirely independent]
Variable 29 Equality of treatment between national and foreign actors in commercial disputes
0 The score is below the 30th percentile of the sample. 1 The score is between the 30th and 70th percentile of the sample. 2 The score is above the 70th percentile of the sample.
Source: IPD proxy: score based on the answer to Equality of treatment between national and foreign actors in commercial disputes [1=low equal treatment; 4=high equal treatment]
Variable 30 Extent of implementation and speed of court rulings in commercial matters
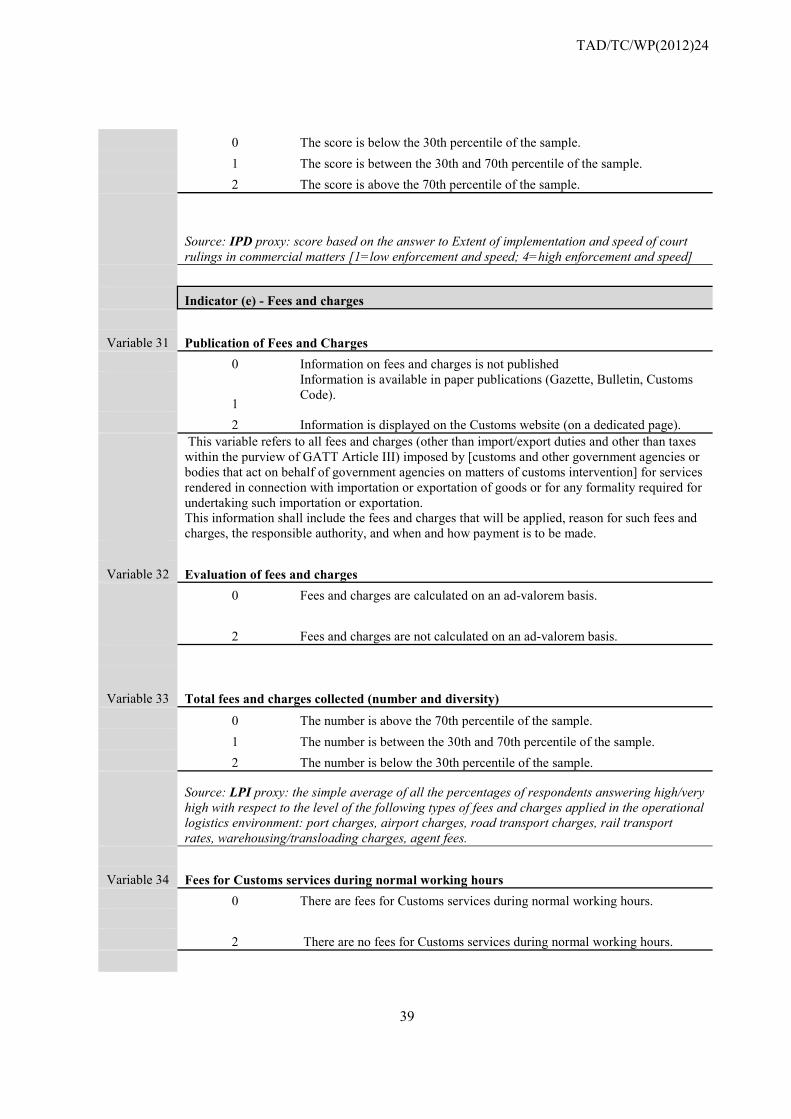
TAD/TC/WP(2012)24
39
0 The score is below the 30th percentile of the sample. 1 The score is between the 30th and 70th percentile of the sample. 2 The score is above the 70th percentile of the sample.
Source: IPD proxy: score based on the answer to Extent of implementation and speed of court rulings in commercial matters [1=low enforcement and speed; 4=high enforcement and speed]
Indicator (e) - Fees and charges
Variable 31 Publication of Fees and Charges 0 Information on fees and charges is not published
1
Information is available in paper publications (Gazette, Bulletin, Customs Code).
2 Information is displayed on the Customs website (on a dedicated page).
This variable refers to all fees and charges (other than import/export duties and other than taxes within the purview of GATT Article III) imposed by [customs and other government agencies or bodies that act on behalf of government agencies on matters of customs intervention] for services rendered in connection with importation or exportation of goods or for any formality required for undertaking such importation or exportation. This information shall include the fees and charges that will be applied, reason for such fees and charges, the responsible authority, and when and how payment is to be made.
Variable 32 Evaluation of fees and charges
0 Fees and charges are calculated on an ad-valorem basis. 2 Fees and charges are not calculated on an ad-valorem basis.
Variable 33 Total fees and charges collected (number and diversity)
0 The number is above the 70th percentile of the sample. 1 The number is between the 30th and 70th percentile of the sample. 2 The number is below the 30th percentile of the sample.
Source: LPI proxy: the simple average of all the percentages of respondents answering high/very high with respect to the level of the following types of fees and charges applied in the operational logistics environment: port charges, airport charges, road transport charges, rail transport rates, warehousing/transloading charges, agent fees.
Variable 34 Fees for Customs services during normal working hours
0 There are fees for Customs services during normal working hours. 2 There are no fees for Customs services during normal working hours.

TAD/TC/WP(2012)24
40
Indicator (f) - Formalities and documents
Variable 35 Use of copies 0 Customs and other border agencies do not accept copies of documents.
1
Copies are accepted with exceptions (related to the type of good, the circumstances or the agency).
2 Copies are accepted without exceptions.
Variable 36 International Standards compliance*
0 The rate of ratification is below the 30th percentile of the sample.
1 The rate of ratification is between the 30th and 70th percentile of the sample.
2 The rate of ratification is above the 70th percentile of the sample.
*ratification of: Istanbul Convention, HS Convention, Revised Kyoto Convention
Variable 37 Number of documents for import
0 The number is above the 70th percentile of the sample. 1 The number is between the 30th and 70th percentile of the sample. 2 The number is below the 30th percentile of the sample.
Source: World Bank Doing Business Trading Across Borders: Number of documents to import which records documents required for clearance by government ministries, customs authorities, port and container terminal authorities (transport documents), health and technical control agencies and banks.
Variable 38 Number of documents for export
0 The number is above the 70th percentile of the sample. 1 The number is between the 30th and 70th percentile of the sample. 2 The number is below the 30th percentile of the sample. Source: Doing Business
Variable 39 Time to prepare documents for import (days)
0 The number is above the 70th percentile of the sample. 1 The number is between the 30th and 70th percentile of the sample. 2 The number is below the 30th percentile of the sample. Source: Doing Business
Variable 40 Time to prepare documents for export (days)
0 The number is above the 70th percentile of the sample. 1 The number is between the 30th and 70th percentile of the sample. 2 The number is below the 30th percentile of the sample. Source: Doing Business

TAD/TC/WP(2012)24
41
Indicator (g) - Formalities and automation
Variable 41 Percentage of procedures that can be done electronically (out of the total number of import/export/transit procedures)
0 The number is below the 30th percentile of the sample. 1 The number is between the 30th and 70th percentile of the sample. 2 The number is above the 70th percentile of the sample.
Variable 42 Use of Risk Management 0 There are no risk management procedures in place. 1 In the process of implementation, not yet fully operational. 2 There is a fully operational procedure.
Risk Management means the systematic application of management procedures and practices providing customs [and other relevant border agencies] with the necessary information in order to address movements or consignments which present a risk [DCNT 7.3.6(b)]. Members shall concentrate customs control [and other relevant border controls] on high risk consignments and expedite the release of low risk consignments.[DCNT 7.3.2].
Variable 43 IT Systems capable of accepting EDI and exchanging data electronically
0 IT systems are not ready for EDI. 1 In the process of implementation, not yet fully operational. 2 IT systems are ready for EDI.
An Electronic Data Interchange (EDI) system is an interface providing access to an electronic declaration system.
Variable 44 Availability of full-time (24/7) automated processing for Customs agencies
0 There is no full-time automated processing. 2 There is full-time automated processing.
Variable 45 Quality of telecommunications and IT
0 The number is above the 70th percentile of the sample. 1 The number is between the 30th and 70th percentile of the sample. 2 The number is below the 30th percentile of the sample.
Source: LPI proxy: percent of respondents answering low/very low to the question The quality of telecommunications and IT in the country of work.
Indicator (h) - Formalities and procedures/process
Variable 46 Single Window

TAD/TC/WP(2012)24
42
0 There is no Single Window. 1 A Single Window is planned or in the process of implementation. 2 There is a Single Window.
A Single Window is defined as a facility that allows parties involved in trade and transport to lodge standardized documentation and/or data with a single entry point to fulfil all import, export and transit-related regulatory requirements [UN/CEFACT Recommendation No.33]. It can be a facility already in place acting as a Single Window (i.e. not covering all the aspects of a Single Window facility) or a facility in the process of implementation but not yet fully operational.
Variable 47 Publication of Average Clearance Time
0 The average release time is not published in a consistent manner on a periodic basis.
2 The average release time is published in a consistent manner on a periodic basis, for major customs offices.
Variable 48 Clearance time (days)
0 The number is above the 70th percentile of the sample. 1 The number is between the 30th and 70th percentile of the sample. 2 The number is below the 30th percentile of the sample. Source: LPI
Variable 49 Implementation of Pre-Arrival Processing 0 Pre-arrival processing is not implemented. 2 Pre-arrival processing is implemented.
Relates to DCNT 7.1.1: Each Member shall adopt or maintain procedures [for traders] [allowing importers] [with good compliance records] to submit import documentation and other required information [to customs and other relevant border agencies] for [processing] [examination] prior to the arrival of goods with a view to expediting the [clearance and] release of goods upon arrival.
Variable 50 Percent of physical inspections
0 The number is above the 70th percentile of the sample. 1 The number is between the 30th and 70th percentile of the sample. 2 The number is below the 30th percentile of the sample. Source: LPI
Variable 51 Physical inspections as regards to perishable or non-perishable goods
0 Physical inspection procedures do not allow to accelerate the control for
perishable goods.

TAD/TC/WP(2012)24
43
2 Perishable goods benefit from accelerated controls.
Variable 52 Efficiency of Customs and delivery of imports
0 The number is below the 30th percentile of the sample. 1 The number is between the 30th and 70th percentile of the sample. 2 The number is above the 70th percentile of the sample.
Source: LPI (grades the efficiency of the customs clearance process in the delivery of imports)
Variable 53 Efficiency of Customs and delivery of exports
0 The number is below the 30th percentile of the sample. 1 The number is between the 30th and 70th percentile of the sample. 2 The number is above the 70th percentile of the sample.
Source: LPI (grades the efficiency of the customs clearance process in the delivery of exports)
Variable 54 Percentage of Post-Clearance Audits (PCAs) carried out (out of the total of yearly transactions)
0 The number is below the 30th percentile of the sample. 1 The number is between the 30th and 70th percentile of the sample. 2 The number is above the 70th percentile of the sample.
Variable 55 Separation of release from final determination and payment of Customs duties 0 There is no such mechanism. 1 Yes, only in specific cases or restricted to the Authorized Trader status. 2 Yes, without conditions other than the submission of guarantee
Variable relates to DCNT 7.2: [Each Member [shall] [is encouraged to] adopt or maintain procedures [providing][allowing] an importer [or its agent] [the opportunity] to obtain the release of goods prior to final determination and payment of customs duties, taxes, fees and charges, upon provision of sufficient guarantee [as determined by the Member itself] [where these are not determined at or prior to arrival] [where there is delay in the final determination of customs duties, taxes, fees and charges].]
Variable 56 Treatment of perishable and non-perishable goods concerning the separation of release from clearance
0 There is no preferential treatment of perishable goods.
2 Perishable goods enjoy preferential treatment concerning the separation of
release from clearance.
Variable 57 Elimination of pre-shipment inspection 0 Pre-shipment inspection is required on Customs matters.

TAD/TC/WP(2012)24
44
2 No pre-shipment inspection is required on Customs matters. Variable related to DCNT 10.5
Variable 58 Authorized Operator (AO) programmes
0 The number is below the 30th percentile of the sample. 1 The number is between the 30th and 70th percentile of the sample. 2 The number is above the 70th percentile of the sample.
Source: LPI: the percent of respondents answering often or nearly always to the question Application of expedited customs clearance for traders with high compliance levels
Variable 59 Simplification of procedures (time)
0 The number is below the 30th percentile of the sample. 1 The number is between the 30th and 70th percentile of the sample. 2 The number is above the 70th percentile of the sample.
Source: LPI proxy: the percent of respondents answering improved/much improved to the following question Evaluation of customs clearance procedures since 2005.
Variable 60 Simplification of procedures (cost)
0 The number is below the 30th percentile of the sample. 1 The number is between the 30th and 70th percentile of the sample. 2 The number is above the 70th percentile of the sample.
As a proxy, we use the variation over the last three years of the cost to import (USD per container), according to the Doing Business database [Trading Across Border]
Variable 61 Adjustment of working hours of Customs personnel to commercial needs
0 The working hours of Customs personnel are not adapted to commercial needs.
1 The working hours of Customs personnel are partially adapted to commercial needs.
2 The working hours of Customs personnel are entirely adapted to commercial needs.
Variable 62 Requirement for clearance by a third-party customs broker
0 Mandatory use of a third-party customs broker is required. 2 Mandatory use of a third-party customs broker is not required.
Indicator (i) - Border agency Cooperation - internal

TAD/TC/WP(2012)24
45
Variable 63 Cooperation between agencies on the ground
0 The number is below the 30th percentile of the sample. 1 The number is between the 30th and 70th percentile of the sample. 2 The number is above the 70th percentile of the sample.
Source: As a proxy we use Institutional Profiles Database score based on the answer to the question Co-ordination and cooperation between ministries and within administrations [1= low level of co-ordination and co-operation to 4 = high level of co-ordination and cooperation]
Variable 64 Control delegation at the national level
0 Government agencies do not delegate controls to Customs authorities. 2 Government agencies delegate controls to Customs authorities.
Variable 65 Regular meetings are held (including training seminars)
0
There are no meetings between the different public agencies involved in the procedures required to import or export goods or such meetings are not regular.
1 Regular meetings are held to improve cooperation.
2 These meetings also include the private sector.
Indicator (j) - Border agency Cooperation - External
Variables relate to DCNT Art. 9.3
Variable 66 Alignment of working days and hours with other neighbouring countries at border crossings
0 Working days and hours are not aligned with other neighbouring countries. 2 Working days and hours are aligned with other neighbouring countries.
Variable 67 Alignment of procedures and formalities with other neighbouring countries at border crossings
0 Procedures and formalities are aligned with other neighbouring countries. 2 Procedures and formalities are aligned with other neighbouring countries.
Variable 68 Development and sharing of common facilities with other neighbouring countries at border crossings
0 Common facilities are not developed and shared with other neighbouring
countries.

TAD/TC/WP(2012)24
46
2 Common facilities are developed and shared with other neighbouring
countries.
Variable 69 Joint controls with other neighbouring countries at border crossings
0 There are no joint controls performed in cooperation with other
neighbouring countries. 1 Joint controls are performed with other neighbouring countries. 2 One stop border posts are shared with neighbouring countries.
Indicator (k) - Consularization
Variable 70 Consular transaction requirements 0 The country imposes consular transaction requirements. 2 The country does not impose consular transaction requirements.
Relates to DCNT 8.1: Defined as "the procedure of obtaining from a consul of the importing Member in the territory of the exporting Member, or in the territory of a third party, a consular invoice or a consular visa for a commercial invoice, certificate of origin, manifest, shippers' export declaration, or any other customs documentation in connection with the importation of the good."
Indicator (l) - Governance and Impartiality
Variable 71 Clearly established and transparent structures and functions
0 Structures and functions of the Customs administration are not publicly
described. 2 Structures and functions are publicly available.
Variable 72 Establishment of a code of conduct 0 There is no Code of conduct.
2
A code setting out ethics policy is developed, published and made available to all employees.
Variable 73 Implementation and transparency of sanctions against misconduct
0 There is no publicly available information on sanctions against
misconduct.

TAD/TC/WP(2012)24
47
2 Information on disciplinary provisions specifying what constitutes misconduct and the type of sanctions which apply (e.g. noncompliance penalties) are publicly available.
Variable 74 Ethics Policy
0 There is no ethics policy.
1 The ethics policy observes all of the principles of the Revised Arusha Declaration.
2 A help desk or a special body is established to guide staff on ethical issues.
Variable 75 Clear provisions for the financing of the Customs administration
0 There is no public information as to the financing of the Customs administration.
2 Financing is determined and set out in legal provisions and related information is publicly available.
Variable 76 Internal systems audit function
0 There is no internal audit mechanism.
2 An audit function for internal systems is established, adequately empowered and operational.
Variable 77 Publication of an Annual Customs Report
0 Customs do not publish annual activity reports.
1 Annual reports are available, but they contain insufficient information on customs activities*.
2 Annual reports are available and contain sufficient information on Customs activities.
* Not sufficient information means there are not sufficient information on budget and duties collected, complaints or efficiency indicators.
Variable 78 Irregular payments and bribes
0 The score is below the 30th percentile of the sample. 1 The score is between the 30th and 70th percentile of the sample. 2 The score is above the 70th percentile of the sample.
Source: We use a proxy World Economic Forum Global Competitiveness Report: score based on the answer to the question: In your country, how common is it for firms to make undocumented extra payments connected with: (a) imports and exports; (b) public utilities; (c) annual tax payments; (d) awarding of public contracts and payments; (e) obtaining favourable judicial decisions. [1=very common; 7=never occurs]

TAD/TC/WP(2012)24
48
Category: Additional data
• Customs revenue - Customs Duty collected If possible, please provide the most recent available data: Import Duty Excise Duty Total Duty Total Duty as a percentage of government revenue Annual operating budget of your Customs Service
• The average cost/collection ratio of your Customs Service
Most recent available data for: the Cost of operation of the Customs Administration the total collection of the Customs administration
• A de minimis procedure* 0 Customs do not apply a de minimis procedure. 2 Yes, such a procedure exists.
* Procedure under which customs duties and taxes are not assessed for goods under a specified value. Where no customs duties are in place a de minimis procedure is irrelevant.

TAD/TC/WP(2012)24
49
ANNEX 2. MAIN DATA SOURCES
Global Express Association Customs Capabilities Report
The Global Express Association (GEA) has developed questionnaires in an attempt to compile reports on market access and customs barriers in a large set of developed and developing countries19. The objectives of the survey, among others, are to identify national laws and policies that make it difficult for express delivery companies and other transport companies to serve a particular country in an efficient manner as well as to identify capacity building needs in the country’s customs administration. Replies to questionnaires are available for 137 developed and developing countries. The GEA survey questions (within the Customs Capabilities Report) cover three key areas: transparency, customs efficiency and post-release processes.
World Trade Organization Trade Policy Reviews20: Section on “Trade Policies and Practices by measures”
Countries’ Customs websites21 and Customs Codes
Doing Business indicators - World Bank
The Trading across borders indicator of Doing Business is focused on the procedural requirements for exporting and importing a standardized cargo of goods by ocean transport and measures the associated time and cost (excluding tariffs). It does so by compiling all the official procedures for exporting and importing the goods – from the contractual agreement between the two parties to the delivery of goods – along with the time and cost for completion. The main Trading across borders indicators thus include: number of all documents required to export/import goods; time necessary to comply with all the procedures required to export/import goods; and cost associated with all the procedures required to export/import goods. Different stakeholders, including local freight forwarders, shipping lines, customs brokers, port officials and banks, provide information on required documents and cost as well as the time to complete each procedure22. Specific information for the countries included in the database was also be collected through the Doing Business directory for Business Reform Summaries for Trading across borders23 which contains references to specific measures concerning customs procedures (e.g. introduction of a single window system, introduction of an electronic data interchange system, implementation of a risk-based management system etc.) implemented by countries during 2008 and 2011.
19. GEA is the global trade association of the express delivery industry. All the country replies to the questionnaire are available at http://www.global-express.org/index.php?id=4.
20. The directory of complete WTO TPRs can be found at http://www.wto.org/english/tratop_e/tpr_e/tpr_e.htm.
21. http://www.wcoomd.org/customwebsites/ provides all the links to national Customs websites.
22. http://www.doingbusiness.org/methodology/trading-across-borders
23. http://www.doingbusiness.org/reforms/overview/topic/trading-across-borders

TAD/TC/WP(2012)24
50
Logistics Performance Index (LPI) World Bank
Based on a worldwide survey of global freight forwarders and express carriers, the LPI is a benchmarking tool developed by the World Bank that measures performance along the logistics supply chain within a country. The LPI consists of both perception and objective measures.24 Proxy variables for the TFIs have been selected from the LPI’s domestic component. The Domestic LPI provides qualitative and quantitative assessments of a country’s logistics environment and performance by logistics professionals working inside it. Variables covered by the domestic LPI cover 130 countries. The following variables have been selected: Level of fees and charges (port charges, airport charges, road transport rates, rail transport rates, warehousing / transloading charges, agent fees); Quality of telecommunications and IT; Efficiency of process: Clearance and delivery of imports, Clearance and delivery of exports, Provision of adequate and timely information on regulatory changes, Expedited customs clearance for traders with high compliance levels; Changes in the Logistics Environment Since 2005: Customs clearance procedures; Clearance time, with physical and without physical inspection (days); The percentage of physical inspections.
World Economic Forum (WEF) Global Competitiveness Report (GCR)
The WEF GCR provides an assessment of national competitiveness, providing a useful portrait of a country’s economic environment and its ability to achieve sustained levels of prosperity and growth25. The 2011-2012 GCR covers 142 countries. The WEF draws its data from the following sources: international organizations and national sources as well as its own Executive Opinion Survey. The GCI uses data from the WEF’s annual Executive Opinion Survey to capture concepts that require a more qualitative assessment or for which internationally comparable statistical data are not available for the entire set of economies. The variables extracted from the GCR are covered within the Institutions pillar of the Global Competitiveness Index. Transparency of government policymaking was included in Indicator A - Transparency; Judicial independence and Efficiency of legal framework in challenging regulations are used as components of Indicator D – Appeal Procedures, while Irregular Payments and Bribes was integrated as a component of Indicator L – Governance and Impartiality.
Institutional Profiles Database (IPD)
The Institutional Profiles Database26 (IPD) 2009 presents a set of indicators on the institutional characteristics of 123 developed and developing countries. The database was constructed from a world survey conducted by the French Ministry for the Economy, Industry and Employment (MINEIE) and the French Development Agency (AFD) network of agencies present in the countries covered in the database. The structure of the institutional field in each country is obtained by intersecting nine institutional functions (describing the essential functions performed by institutions at a national level) and four sectors of operation (public institutions and civil society, the market for goods and services; the capital market; the labour market and social relations). IPD focuses on the effectiveness, the quality and the implementation of institutional arrangements. Several IPD variables were selected as source of information for Indicator B and Indicator D, namely scores concerning the dialogue
24.
http://web.worldbank.org/WBSITE/EXTERNAL/TOPICS/EXTTRANSPORT/EXTTLF/0,,contentMDK:21514122~menuPK:3875957~pagePK:210058~piPK:210062~theSitePK:515434,00.html
25. http://www.weforum.org/reports/global-competitiveness-report-2011-2012
26. http://www.cepii.fr/anglaisgraph/bdd/institutions.htm

TAD/TC/WP(2012)24
51
structures between private and public actors within a country and scores assessing the functioning of courts with regard to commercial matters.
Asia-Pacific Economic Cooperation (APEC) Sub-Committee on Customs Procedures – 2010 Evaluation Report on Customs Activities in APEC
In 2010, all 21 APEC economies27 participated in a comprehensive evaluation and analysis of customs activities with the objective of determining the status of the Collective Action Plan (CAP) items. The CAP outlines APEC member economies collective actions to promote trade and investment liberalization and facilitation. The evaluation report was drafted based on the result of a survey using a questionnaire to which all countries provided answers. The questionnaire frames fifteen key themes, each containing Yes/No replies to different questions concerning customs activities in all APEC countries. Various questions covered in ten out of the fifteen themes were selected as proxy variables for the TFIs variables: Harmonization of Tariff Structure with the HS Convention; Public availability of information on customs laws, regulations, administrative guidelines and rulings provided to the business sector on an ongoing basis; Simplification and Harmonization on the basis of the Kyoto Convention; Adoption and Support for the UN/EDIFACT/Paperless trading; Adoption of the principles of the WTO Valuation Agreement; Introduction of clear appeals provisions; Introduction of an advance classification ruling system; Risk management techniques; Integrity; Customs-business partnership.
Southern Africa Trade Hub Reports28 : including the 2011 Audit of the Implementation of Regional SADC Customs Instruments and International Conventions
Other sources: West Africa Trade Hub Reports29; OECD Directorate for Financial Affairs - Administrative Barriers Reports for CEFTA Parties; WTO Trade Facilitation Case studies; Initiative for the Integration of the Regional Infrastructure of South America (IIRSA) Reports and case studies on “Trade facilitation at border stops in South America”; European Commission – Agriculture and Rural Development DG Country dossiers “Export refunds: Customs Documents and Stamps”30.
27. Australia, Brunei Darussalam, Canada, Chile, China, Hong Kong, China, Indonesia, Japan, Korea,
Malaysia, Mexico, New Zealand, Papua New Guinea, Peru, the Philippines, Russian Federation, Singapore, Chinese Taipei, Thailand, The United States and Viet Nam.
28. Trade Facilitation reports and other information available at http://www.satradehub.org/trade-facilitation/sath-content/activities/regional-integration/trade-facilitation.
29. Reports available at http://www.watradehub.com/taxonomy/term/68/all.
30. Country reports available at http://ec.europa.eu/agriculture/markets/export_refunds/forms/list_en.htm.

TAD/TC/WP(2012)24
52
ANNEX 3. COUNTRY LIST
Albania, Algeria, Angola, Antigua and Barbuda, Argentina, Armenia, Azerbaijan, Bahamas, Bahrain, Bangladesh, Barbados, Belarus, Belize, Benin, Bhutan, Bolivia, Bosnia and Herzegovina, Botswana, Brazil, Brunei Darussalam, Bulgaria, Burkina Faso, Burundi, Cambodia, Cameroon, China, Colombia, Congo, Rep., Costa Rica, Cote d’Ivoire, Croatia, Cuba, Cyprus31, Ecuador, El Salvador, Ethiopia, Fiji, Gabon, The Gambia, Georgia, Ghana, Guatemala, Honduras, India, Indonesia, Jamaica, Jordan, Kazakhstan, Kenya, Kuwait, Kyrgyz Republic, Latvia, Lebanon, Lesotho, Liberia, Lithuania, Macedonia FYR, Madagascar, Malawi, Malaysia, Mali, Malta, Mauritius, Moldova, Mongolia, Montenegro, Morocco, Mozambique, Namibia, Nepal, Nicaragua, Nigeria, Oman, Pakistan, Panama, Papua New Guinea, Paraguay, Peru, Philippines, Qatar, Romania, Russian Federation, Rwanda, Saudi Arabia, Serbia, Senegal, Sierra Leone, Singapore, South Africa, Sri Lanka, Suriname, Swaziland, Chinese Taipei, Tanzania, Thailand, Togo, Trinidad and Tobago, Tunisia, Uganda, Ukraine, United Arab Emirates, Uruguay, Venezuela, Viet Nam, Zambia, Zimbabwe
31. Footnote by Turkey: The information in this document with reference to “Cyprus” relates to the southern
part of the Island. There is no single authority representing both Turkish and Greek Cypriot people on the Island. Turkey recognizes the Turkish Republic of Northern Cyprus (TRNC). Until a lasting and equitable solution is found within the context of United Nations, Turkey shall preserve its position concerning the “Cyprus” issue.
Footnote by all the European Union Member States of the OECD and the European Commission: The Republic of Cyprus is recognized by all members of the United Nations with the exception of Turkey. The information in this document relates to the area under the effective control of the Government of the Republic of Cyprus.

TAD/TC/WP(2012)24
53
ANNEX 4. COUNTRY GROUPINGS
Country groupings by income
Low income country group
Bangladesh, Benin, Burkina Faso, Burundi, Cambodia, Ethiopia, The Gambia, Kenya, Kyrgyz Republic, Liberia, Madagascar, Malawi, Mali, Mozambique, Nepal, Rwanda, Sierra Leone, Tanzania, Togo, Uganda, Zimbabwe Lower middle income country group
Angola, Armenia, Belize, Bhutan, Bolivia, Cameroon, Congo, Rep., Cote d'Ivoire, El Salvador, Fiji, Georgia, Ghana, Guatemala, Honduras, India, Indonesia, Lesotho, Moldova, Mongolia, Morocco, Nicaragua, Nigeria, Pakistan, Papua New Guinea, Paraguay, Philippines, Senegal, Sri Lanka, Swaziland, Ukraine, Viet Nam, Zambia Upper middle income country group
Albania, Algeria, Antigua and Barbuda, Argentina, Azerbaijan, Belarus, Bosnia and Herzegovina, Botswana, Brazil, Bulgaria, Colombia, Costa Rica, Cuba, Ecuador, Gabon, Jamaica, Jordan, Kazakhstan, Latvia, Lebanon, Lithuania, FYR Macedonia, Malaysia, Mauritius, Montenegro, Namibia, Panama, Peru, Romania, Russian Federation, Serbia, South Africa, Suriname, Thailand, Tunisia, Uruguay, Venezuela High income non-OECD country group
Bahamas, Bahrain, Barbados, Brunei, Croatia, Cyprus, Kuwait, Malta, Oman, Qatar, Saudi Arabia, Singapore, Chinese Taipei, Trinidad and Tobago, United Arab Emirates Geographical country groupings
Sub-Saharan Africa country group
Angola, Benin, Botswana, Burkina Faso, Burundi, Cameroon, Congo, Rep., Cote d'Ivoire, Ethiopia, Gabon, The Gambia, Ghana, Kenya, Lesotho, Liberia, Madagascar, Malawi, Mali, Mauritius, Mozambique, Namibia, Nigeria, Rwanda, Senegal, Sierra Leone, South Africa, Swaziland, Tanzania, Togo, Uganda, Zambia, Zimbabwe Middle East and North Africa country group
Algeria, Bahrain, Jordan, Kuwait, Lebanon, Morocco, Oman, Qatar, Saudi Arabia, Tunisia, United Arab Emirates

TAD/TC/WP(2012)24
54
Europe non-OECD and Central Asia country group
Albania, Armenia, Azerbaijan, Belarus, Bosnia and Herzegovina, Bulgaria, Croatia, Cyprus, Georgia, Kazakhstan, Kyrgyz Republic, Latvia, Lithuania, Macedonia FYR, Malta, Moldova, Romania, Russian Federation, Serbia, Ukraine Latin America and Caribbean country group
Antigua and Barbuda, Argentina, Bahamas, Barbados, Belize, Bolivia, Brazil, Colombia, Costa Rica, Cuba, Ecuador, El Salvador, Guatemala, Honduras, Jamaica, Nicaragua, Panama, Paraguay, Peru, Suriname, Trinidad and Tobago, Uruguay, Venezuela. Asia country group
Bangladesh, Bhutan, Brunei, Cambodia, China, Fiji, India, Indonesia, Malaysia, Mongolia, Nepal, Pakistan, Papua New Guinea, Philippines, Singapore, Sri Lanka, Thailand, Viet Nam Economic partnership groupings
APEC country list
Australia, Brunei, Canada, China, Hong Kong, China, Indonesia, Japan, Korea, Malaysia, Mexico, New Zealand, Papua New Guinea, Peru, Philippines, Russian Federation, Singapore, Thailand, United States of America, Viet Nam ECOWAS country list
Benin, Burkina Faso, Cote d’Ivoire, The Gambia, Ghana, Liberia, Mali, Nigeria, Senegal, Sierra Leone, Togo OECD countries (for which TFIs were calculated in the 2011 OECD study)
Australia, Belgium, Canada, Czech Republic, Germany, Denmark, France, Greece, Hungary, Italy, Japan, Korea, Mexico, Netherlands, Norway, New Zealand, Poland, Portugal, Slovak Republic, Spain, Sweden, Turkey, United Kingdom, United States

TAD/TC/WP(2012)24
55
ANNEX 5. RELEVANCE AND ORGANISATION OF THE VARIABLES
Variables vary sufficiently within the overall country sample, showing that all categories are relevant. This is shown in Tables 1 and 2 of standard deviations, pointing that there is sufficient variation within each indicator.
Table 1. Average standard error among variables
ID Standard deviation ID
Standard deviation ID
Standard deviation ID
Standard deviation
1 0.512906 20 0.991495 38 0.754453 59 0.795011
2 0.700488 21 1.004738 39 0.788263 60 0.882493
3 0.632456 22 1.004738 40 0.721036 61 0.868437
4 0.351608 23 0.829674 42 0.757381 62 0.987149
5 0.828296 24 0.653197 43 0.646638 63 0.791395
6 0.896942 25 0.92775 44 0.994149 64 0.961949
7 0.975433 26 0.581607 45 0.844294 67 0.923043
8 0.842293 27 0.775689 46 0.719435 69 0.775521
9 0.923133 28 0.789429 48 0.998123 70 0.974575
10 0.773117 29 0.664411 49 0.750569 71 0.524038
11 0.866251 30 0.82484 50 0.994177 72 0.557436
12 0.890425 31 0.644481 51 0.78019 73 0.788886
13 1.00234 32 0.98687 52 0.968293 74 0.782667
14 1.002033 33 0.743311 53 0.768614 76 0.371274
15 0.898513 34 0.92165 55 0.905539 77 0.689019
16 0.781832 35 0.57933 56 0.9941 78 0.775689
18 0.995613 36 0.772157 57 0.886199
19 0.9935 37 0.697825 58 0.78019 Note: The table does not consider the variables that could not be included within the indicator. ID corresponds to variable number. All variables range from 0 to 2.
Table 2. Variation for each indicator
Categories Standard deviation TFI (a) Information availability .4463819
TFI (b) Involvement of the trade community .7116731
TFI (c) Advance rulings .8028919
TFI (d) Appeal procedures .4117324
TFI (e) Fees and charges .55954
TFI (f) Formalities – documents .4755765
TFI (g) Formalities – automation .5992804
TFI (h) Formalities – procedures .3664077
TFI (i) Border agency cooperation - internal .6867248
TFI (j) Border agency cooperation - external .7859684
TFI (k) Consularization .974575
TFI (l) Governance and impartiality .3790255

TAD/TC/WP(2012)24
56
ANNEX 6. GRAVITY SPECIFICATIONS
We start from the log-linearised trade gravity equation derived by Anderson and van Wincoop (2003). Anderson and van Wincoop (2003) provide the theoretical background of the derivation of the gravity equation, such a discussion being out of the scope of the present paper. log 1 log 1 log 1 log
where xij represents exports from country i to country j in sector k; Ej is the sectoral expenditure in country j; Yi is the sectoral production in country i; tij represents bilateral trade costs; σk is the intra-sectoral elasticity of substitution (between varieties within a sector); and εij is the random error term. Pj
k and πik terms represent “multilateral resistance”, accounting for the fact that bilateral trade patterns
between the two countries depend not only on a specific bilateral trade cost between them, but the extent of that cost relative to the ones characterising the trade with the rest of the world.
Different empirical approaches have been applied in order to control for MR in the gravity model. The easiest way of controlling for “multilateral resistance” and obtaining unbiased coefficient estimates is to use country or country-pair specific fixed effects (Eaton and Kortum, 2002; Feenstra, 2004). The key drawback of this estimation method is that it precludes the inclusion in the model of explanatory variables that vary only in the country dimension, such as our key explanatory variables. We therefore adopt Baier and Bergstrand’s (2009) alternative approach, which consists of computing “multilateral resistance” (MR) terms based on bilateral trade cost data between all country pairs and the size of one economy relative to the size of all others.
Using a log-linear Taylor expansion of the multilateral resistance expression defined by Anderson and van Wincoop (2003), Baier and Bergstrand (2009) express the multilateral resistance by using the GDP-share-weighted average trade costs faced by the two trading partners relative to the GDP-share-weighted average of those trade costs between all the other countries. The MR term is thus a linear approximation of the MR between countries that allows capturing bilateral trade costs, such as distance or border, between countries relative to those of the rest of the world (Behar et al., 2011).
The Multilateral resistance (MR) terms are calculated as follows:
_ ∑ ln ∑ ln ∑ ∑ ln
where: Varij denotes the bilateral trade cost variable (e.g. distance, common border) Yw denotes global total GDP Therefore, the baseline specifications are the ones where we adjust the bilateral trade cost variables in order to take into account the multilateral resistance issues. Firstly, we consider in the regression the importer country TFI and we thus adjust the “classical” bilateral trade cost variables in the regression (distance, contiguity, language, colony, rta). We introduce these variables as the difference between the original value of the variable and their adjusted multilateral resistance term.

TAD/TC/WP(2012)24
57
(reg1): ln β β ln distance _MR β contiguity _MR β language _MR β colony _MRβ rta _MR β GDP β GDP β TFIlandlocked landlocked D D ε where: i, j, k and t denote the exporting country, the importing country, the sector and year xk
ijt exports from country i to j in sector k in year t distanceij represents the bilateral distance contigij denotes the existence of a common border, langij the existence of a common language colonyij denotes common colony ties Dt and Dk denote fixed effects for year and sector subscript c indicates the TFI indicator A similar specific is tested, in which we consider both the importer and exporter TFIs: (reg2): ln β β ln distance _MR β contiguity _MR β language _MR β colony _MRβ rta _MR β GDP β GDP β TFI β TFIlandlocked landlocked D D ε
We also run a specification including the geometric average of the importer and exporter countries TFIs. The geometric average is employed because it will also smooth accuracy issues, when for instance an index for country i will be based on several missing variables opposed to an index for country j computed without missing variables.
We equally adjust the bilateral trade cost variable for the multilateral resistance. The specification thus becomes:
(reg3): ln β β ln distance _MR β contiguity _MR β language _MR β colony _MRβ rta _MR β GDP β GDP β TFI landlocked landlocked D D ε Following recent literature (Behar, 2009; Behar et al., 2011) that adjusts other bilateral trade costs besides the “classical” gravity variables for multilateral resistance, when we consider in the regression the geometric average of the TFIs, this variable is adjusted as well.
(reg3bis): ln β β ln distance _MR β contiguity _MR β language _MR β colony _MRβ rta _MR β GDP β GDP β TFI _MRlandlocked landlocked D D ε

TAD/TC/WP(2012)24
58
When the gravity model is estimated in a log-normal specification, zero trade observations are discarded, i.e. for the country pairs that do not trade at all. It remains nevertheless interesting to observe the fact that some countries do not trade at all in some products. This is all the more important when seeking to identify the impact of trade facilitation areas on developing countries’ trade. Results are also reported for OLS estimations, by adding 1 to all trade flows. In line with the recent developments in the literature, this issue is also addressed by estimating the model using a Poisson Maximum Likelihood Estimation (Poisson) estimator (Santos Silva and Tenreyro, 2006). This allows including in the estimation sample the observations where trade is equal to zero. Moreover, it deals with the heteroskedasticity that can result in biased estimates of standard errors under OLS. Poisson estimations for the different country groups are reported in Appendix 1. A cross section is also estimated for 2009 and results remain consistent across country groups.

TAD/TC/WP(2012)24
59
ANNEX 7. TRADE COSTS CALCULATION
Novy (2008) develops a measure of bilateral trade costs derived from the gravity model of Anderson and van Wincoop (2003). After several rearrangements of the basic gravity equation and the multilateral resistance terms, he derives an expression for the geometric average of trade costs in both directions, a measure of bilateral trade costs (tijtji) relative to domestic trade costs (tiitjj). This measure captures the fact that a decrease (increase) in trade costs, increases (reduces) international trade relatively to domestic trade flows. The calculated trade costs are a geometric average of trade costs in both directions.
where: xii, xjj denote the production sold domestically for countries i and j (i.e. domestic output minus exports) and sector xij represent the exports from to i to j and xji the exports from j to i the elasticity of substitution across goods 32 However, in the case of most developing countries, Gross Output data availability constitutes a major issue. There have been different attempts to find proxy variables for this data in the equation. The methodology used for constructing a first version of the UN-ESCAP Trade Cost database33 is outlined in Duval and Utoktham (2011). Following other authors (Novy, 2008; Jacks, Meissner and Novy, 2008; Shepherd, 2010), Duval and Utoktham (2011) define xii and xjj as the difference between gross domestic product (GDP) and total exports. Duval and Utoktham (2011) define three levels of cost measures: - trade costs for which intranational trade (xii and xjj) is GDP less total exports - trade costs where xii and xjj are adjusted for the share of services in GDP xii
adjusted=NS*(xii) with NS the average non-service sector share of GDP of countries in the income group to which country i belongs to - and “comprehensive trade costs” equal to the simple average of the two measures defined above As Duval and Utoktham (2011), we first define xii and xjj as gross domestic product (GDP) less export and apply the above equation to calculate trade costs between OECD countries and a large number of developing countries (the “upper-bound” estimates). We also calculate the “lower-bound” trade costs where xii and xjj are adjusted for the share of services in GDP. Comprehensive trade costs are calculated as a simple average of the upper-bound and lower-bound trade costs. 32. The elasticity of substitution is set equal to 8 (Anderson and van Wincoop, 2003; Novy, 2009). If further
work will focus on working at a more disaggregated trade level, it should be considered that elasticity normally varies across sector and estimates and can prove more or less sensitive to the value chosen.
33. This database is developed by the Trade and Investment Division of the UNESCAP, in support of the ARTNet research programme on trade facilitation. The database is available at http://www.unescap.org/tid/artnet/trade-costs.asp.

TAD/TC/WP(2012)24
60
In the second version of the UNESCAP database, Duval and Utoktham (2012) further refine the equation by trying to employ estimated values for the gross output where such data was missing. Authors obtain as well sectoral estimates of trade costs for some developing countries, for agriculture and manufacturing sectors. We use the Novy (2008) formula as adjusted by Duval and Utoktham (2011). Ideally, we would have wanted to use the formula as adjusted by Duval and Utoktham (2012), but in trying to extend this computation to our extended set of countries and years, the trade costs model did not result robust and this is largely due to the major data limitations in obtaining valid estimates of Gross Output for a much larger set of developing countries.

TAD/TC/WP(2012)24
61
ANNEX 8. TRADE COSTS REGRESSIONS
We test two specifications when evaluating the impact of trade costs. The trade costs main specification includes the TFI computed as geometric mean of both the importer and exporter dimensions. The geometric average will also smooth accuracy issues, when an index for country i will be based on several missing variables opposed to an index for country j computed with less or no missing variables. The variability in trade costs comes mostly from the variation in country pairs characteristics.
As the total variation in trade costs for our study period proves specific to the country-pair dimension, we estimate a cross-section by averaging the trade costs over 5 years (2005-09) and estimating the impact of the bilateral measure of the TFIs. This will allow “smoothing” missing data for this selected period or inaccuracies in the trade costs estimations. ln τ β β ln distance β contiguity β language β colonyβ rta β avg_applied_tariff β TFI D D where avg_applied_tariff is the geometric average of tariffij and tariffji (tariffij is the trade-weighted average effective import tariff imposed by country i on country j) over the same period.

TAD/TC/WP(2012)24
62
ANNEX 9. CONTRIBUTION TO THE VARIANCE
The contribution of each explanatory variable (Vm) to the total variance of trade costs is calculated as: ,
where βm is the partial regression coefficient of variable Vm in the main regression. These values express the contribution of each explanatory variable to the variation of trade costs. The first table reports the results for the explanatory variables in the case of the regressions with all the TFIs together. The following tables report the results for the explanatory variables in the trade costs regressions for the income level and geographical country groups. This is done after “data cleaning”, where we drop non-significant variable, “correlated” variables and variables that do not bear the expected sign in the first set of estimations with the TFIs altogether.
Table 3. Income level groups – Contribution to the variance
Variables LICs LMICs UMICs
Distance 0.251423 0.245234 0.231723
Language 0.026721 0.021425 0.020812
Contiguity 0.091182 0.081270 0.087264
Colony 0.002024 0.000891 0.000762
RTA 0.012531 0.015271 0.018271
Tariffs_ij_ji 0.036214 0.029812 0.031051
TFI (a) 0.015400 0.014401 0.009027
TFI (b) 0.012170 0.012587 0.014213
TFI (c) 0.008124 0.015501 0.132071
TFI (d) -0.016798 0.019214 0.008192
TFI (e) -0.000329 -0.019720 0.007211
TFI (f) 0.019412 0.022034 0.009169
TFI (g) 0.029312 0.017823 0.015285
TFI (h) 0.015890 0.015091 0.021285
TFI (i) -0.001594 0.012217 -0.015164
TFI (j) 0.009812 -0.011723 -0.012849
TFI (l) 0.015821 0.013214 0.014473
Total variation 0.527315 0.504542 0.592796
Table (A)

TAD/TC/WP(2012)24
63
Table 4. Geographic groups – Contribution to the variance
Variables LICs LMICs UMICs
Distance 0.234100 0.202100 0.215600
Language 0.023182 0.019871 0.018542
Contiguity 0.090800 0.089100 0.085200
Colony 0.001825 0.000876 0.000852
RTA 0.010235 0.013429 0.011620
Tarif fs_ij_ji 0.032723 0.031714 0.028910
TFI (a) 0.013620 0.012444 0.010703
TFI (b) 0.011990 0.013687 0.011237
TFI (c) 0.010077 0.014583 0.013466
TFI (d) 0.013615 0.012910
TFI (e) 0.009205
TFI (f) 0.021475 0.019452 0.011169
TFI (g) 0.014691 0.016481 0.017385
TFI (h) 0.013657 0.015416 0.018485
TFI (i) 0.012705
TFI (j) 0.010241
TFI (l) 0.018374 0.015005 0.014493
Total variation 0.506990 0.490478 0.479777
Table (B)
Variables SSA MENA Asia LAC EAC
Distance 0.261090 0.161030 0.198120 0.200050 0.150080
Language 0.008200 0.003290 0.002981 0.014520 0.007532
Contiguity 0.091230 0.051320 0.085234 0.065430 0.097354
Colony 0.008901 -0.000124 0.000205 0.003261 -0.000099
RTA 0.006129 0.003120 0.011901 0.016812 0.019882
Tariffs_ij_ji 0.035803 0.021830 0.029324 0.027203 0.019331
TFI (a) 0.013821 0.000812 0.011325 0.007390 -0.001281
TFI (b) 0.012721 0.015526 0.013823 0.013080 0.010311
TFI (c) 0.008120 -0.009100 0.009087 0.012305 0.011982
TFI (d) 0.009971 0.124020 0.012345 0.007203 -0.011928
TFI (e) -0.099202 -0.012392 0.009821 0.007301 -0.009129
TFI (f) 0.019209 0.010022 0.020762 0.014328 0.013129
TFI (g) 0.035621 0.017801 0.024981 0.011023 0.018712
TFI (h) 0.015914 0.008210 0.011345 0.025629 0.008190
TFI (i) 0.008209 -0.009922 0.009218 -0.01398 -0.009821
TFI (j) 0.017651 -0.01202 -0.000004 -0.000217 -0.000381
TFI (l) 0.009237 0.000321 0.014098 0.014391 0.012082
Total variation 0.462625 0.373744 0.464566 0.425729 0.335946
Table (A)

TAD/TC/WP(2012)24
64
Variables SSA MENA Asia LAC EAC
Distance 0.254130 0.151090 0.213810 0.198030 0.178030
Language 0.009823 0.003028 0.003128 0.012371 0.008712
Contiguity 0.099403 0.021924 0.089712 0.067320 0.098723
Colony 0.009012 -0.000125 0.000198 0.002302 -0.000109
RTA 0.005109 0.004091 0.010725 0.015029 0.021620
Tariffs_ij_ji 0.037812 0.022081 0.028412 0.027203 0.021345
TFI (a) 0.012421 0.010150 0.009311 0.008320
TFI (b) 0.011989 0.013526 0.008872 0.009561 0.0084231
TFI (c) 0.010812 0.009108 0.009981 0.008499
TFI (d) 0.011997 0.007287 0.009417 0.007524
TFI (e) 0.005871 0.005203
TFI (f) 0.017422 0.008421 0.015424 0.0153781 0.012428
TFI (g) 0.023172 0.016231 0.021498 0.009012 0.015721
TFI (h) 0.012391 0.009218 0.009399 0.020901 0.008124
TFI (i) 0.007100 0.004190
TFI (j) 0.008120
TFI (l) 0.012498 0.009810 0.008921 0.0104231 0.008001
Total variation 0.543212 0.276732 0.447997 0.418558 0.389517
Table (B)

TAD/TC/WP(2012)24
65
APPENDIX 1. TRADE FLOWS - GRAVITY REGRESSIONS WITH THE INDIVIDUAL TFI
Table 5. Low income countries – All sectors
Note: Fixed effects for year and sector are included but not reported. Robust standard errors clustered by country pair. p for Poisson. Significance levels are: ***=1%, **=5%, *=10%. Values for R2 range between 51-60%.
SectorImporter sampleExporter sample
reg1p reg2p reg3p reg3bisp reg1p reg2p reg3p reg3bisp0.1185*** 0.0258** 0.0995*** 0.0464* 0.1128** 0.0869** 0.2772** 0.8785*
-1.7686 -0.3372 -1.3424 -0.1869 (-0.6902) (-0.5310) -1.6441 -1.46850.1792** 0.7210***-2.2665 -3.201
0.1440** 0.1656** 0.3889*** -0.2268** 0.1745 0.1751 -0.0593 0.1823-2.129 -2.3055 -4.3236 (-2.3288) (-1.5164) (-1.5137) (-0.3870) -0.7833
0.2504*** 0.0913-4.4995 -0.6798
0.1112 0.0745 0.0672 0.1898* 0.3335*** 0.3939*** 0.5349*** -0.1538(-1.4586) (-0.8584) -0.5106 (-1.6556) -3.1494 -3.6126 -3.7303 (-0.4700)
0.2565*** 0.1696-3.3196 -0.7395
0.0188 0.0384 0.3073** 0.1688 0.3334* 0.3243* 0.4749*** -0.2975-0.1619 -0.3052 -2.2641 (-0.7591) -1.8856 -1.8558 -3.3879 (-0.7426)
0.3331*** 0.3846***-3.4505 -2.6395
0.1338 -0.1478 -0.0351 0.0085 -0.4423*** -0.4432*** -0.4291** 0.9671**(-1.1159) (-1.0685) (-0.2498) (-0.0270) (-3.8851) (-3.9837) (-2.5157) -2.4149
0.0898 -0.1767-0.8621 (-1.0749)
0.3108*** 0.3178*** 0.8940*** 0.7667** 0.4404*** 0.4433*** 0.8572*** 1.5546**-3.4088 -3.4651 -7.4969 -2.1175 -2.8552 -2.7929 -4.3862 -2.1743
0.5674*** 0.4012***-7.118 -3.2476
0.4615*** 0.4625*** 0.6344*** 0.0886 0.4818*** 0.4316*** 0.5652*** 0.5305*-6.6765 -6.6982 -7.4271 -0.7405 -5.1702 -5.033 -6.1427 (-1.8854)
0.087** 0.3335***-1.4427 -3.0071
0.2257*** 0.0256* 1.2431*** 1.3766* 0.5380** 0.5022** 1.3171*** 2.6017*(-0.2094) (-0.1993) -7.7367 -1.8187 -2.3098 -2.4027 -5.5814 -1.6746
1.2528*** 1.0027***-11.1377 -4.6189
0.0852 -0.071 0.0316 0.0007 -0.0476 -0.0448 0.0932 0.1312(-1.6238) (-1.3074) (-0.5625) (-0.0044) (-0.5021) (-0.4651) -1.1209 -0.48
0.0468 0.1631*-0.8689 -1.8174
0.0757 0.1726 0.3028*** 0.5511** 0.4046*** 0.2918** 0.2492* 0.6372**-0.9522 -1.4832 -2.6599 -2.2058 -3.0356 -2.3295 -1.7626 -2.2808
0.2462** 0.1626-2.3514 -1.2114
0.1119** 0.2576** 0.4148*** 0.4796*** 0.119** 0.0353* 0.2513*** 0.518***(-0.0155) (-0.4075) -3.377 (-1.0311) (-0.6149) (-0.1738) -1.276 -0.8037
0.6635*** 0.4346**-5.2013 -2.0605
TFI (f)
Total TotalLICs AllAll LICs
TFI (a)
TFI (b)
TFI (c)
TFI (d)
TFI (e)
TFI (g)
TFI (h)
TFI (i)
TFI (j)
TFI (l)

TAD/TC/WP(2012)24
66
Table 6. Low income countries – Manufacture and agriculture
Note: Robust standard errors clustered by country pair. p for Poisson. Significance levels are: ***=1%, **=5%, *=10%. Values for R2 range between 40-49%.
Sector
Importer sample
Exporter sample
reg1p reg2p reg3p reg3bisp reg1p reg2p reg3p reg3bisp reg1p reg2p reg3p reg3bisp reg1p reg2p reg3p reg3bisp
0.0078** 0.0142** 0.0214* 0.0844* 0.0806** 0.0633** 0.207** 0.4283 0.0153* 0.0195** 0.1198 -0.1221 -0.1372 0.0195** 0.0271 0.6986
-0.0819 -0.1471 -0.2294 -0.2735 (-0.4314) (-0.3386) -1.0962 -0.6128 -0.1731 -0.2171 -1.3786 (-0.4270) (-0.7172) -0.2171 -0.1157 -0.8254
0.0742** 0.5780*** 0.2396*** 0.2396***
-0.7633 -2.8906 -2.6213 -2.6213
0.0607 0.0793* 0.2958*** -0.1045 -0.2961** -0.2979** -0.0849 -0.3983 0.2575*** 0.3030*** 0.6974*** -0.4949*** 0.2056 0.3030*** 0.5319*** -0.3155
-0.7446 -0.92 -2.6794 (-0.8682) (-2.4463) (-2.3842) (-0.5287) (-1.3834) -3.0942 -3.4549 -6.3495 (-4.4232) -1.5058 -3.4549 -3.3462 (-1.1031)
0.1993*** 0.3738*** 0.4585*** 0.4585***
-2.7795 -2.606 -6.9386 -6.9386
0.2397** 0.2067* -0.0251 -0.0948 0.2530** 0.3142*** 0.5300*** 0.5184** -0.1416 -0.1259 0.005 -0.2899** 0.1601 -0.1259 0.3553* -0.3887
(-2.4771) (-1.8691) (-0.1495) (-0.6560) -2.1165 -2.7244 -3.5424 (-2.1058) (-1.5879) (-1.2339) -0.0328 (-2.1485) -1.2002 (-1.2339) -1.9399 (-1.4846)
0.2644*** 0.4603*** 0.3237*** 0.3237***
-2.7577 -2.8254 -3.6707 -3.6707
0.0119 0.0298 0.2244 0.3127 0.3495* 0.3370* 0.4998*** 0.8510* -0.0909 -0.0638 0.1401 -0.2178 -0.1487 -0.0638 -0.0919 0.1362
-0.0764 -0.1764 -1.2755 (-1.1297) -1.7819 -1.7439 -3.0406 (-1.9485) (-0.6744) (-0.4362) -0.8888 (-0.8006) (-0.7014) (-0.4362) (-0.4816) -0.2307
0.3086*** 0.4625*** 0.2780** 0.2780**
-2.5854 -2.6536 -2.3652 -2.3652
0.4340*** 0.4381*** -0.147 -0.0522 0.4422*** 0.4556*** -0.1677 0.2222 0.1548 0.1933 0.4638*** 0.9508*** 0.0773 0.1933 0.1355 -0.5843
(-2.9855) (-2.6458) (-0.8519) (-0.1427) (-3.6998) (-3.7329) (-1.0063) -0.5673 -1.1087 -1.1999 -2.6758 (-2.6119) -0.4289 -1.1999 -0.6464 (-1.4258)
0.1736 0.1853 0.3767*** 0.3767***
-1.388 -1.3149 -2.991 -2.991
0.2738** 0.2849*** 1.0995*** 0.4662 0.3790** 0.3802** 0.5770*** 0.565 0.3309*** 0.3326*** 0.7793*** 0.2737 0.0949 0.3326*** 0.5452*** 0.948
-2.4998 -2.5995 -7.6378 -1.046 -2.1099 -2.0819 -3.0864 -0.9145 -2.8645 -2.8544 -5.3686 -0.6128 -0.5779 -2.8544 -2.7852 -1.5412
0.8031*** 0.2546** 0.5036*** 0.5036***
-8.0587 -2.0841 -5.4725 -5.4725
0.7831*** 0.7841*** 0.9621*** 0.0039 0.4957*** 0.4342*** 0.6283*** 0.8477*** 0.4158*** 0.4181*** 0.6552*** 0.1019 0.2723* 0.4181*** 0.3764*** -0.4519
-8.8574 -8.8746 -9.0036 -0.0254 -4.694 -4.5835 -6.8463 (-3.0556) -5.2338 -5.2762 -6.5385 (-0.7471) -1.9109 -5.2762 -2.8289 (-1.5678)
0.0835 0.4592*** 0.2027*** 0.2027***
-1.0972 -3.6613 -2.8364 -2.8364
1.1532** 0.0637** 1.0721*** 0.0433** 0.4777* 0.4326** 1.4686*** 2.8361** 0.0837 0.1237 1.5026*** 0.4148 0.2239 -0.1237 1.0594*** -0.2042
-2.4191 (-0.4087) -5.4696 (-0.2934) -1.8742 -2.0022 -5.9019 -1.44 (-0.5671) (-0.7922) -7.8219 -0.4337 -0.7659 (-0.7922) -3.3766 (-0.0865)
1.0727*** 1.3207*** 1.6278*** 1.6278***
-7.4904 -5.2153 -11.5971 -11.5971
0.2111*** 0.1979*** -0.1230* -0.0211 -0.1004 -0.0945 -0.0096 -0.2327 -0.046 -0.0167 0.002 0.1437 -0.0079 -0.0167 0.1548 0.1964
(-3.1881) (-2.9034) (-1.7611) (-0.1144) (-0.9201) (-0.8393) (-0.1043) (-0.7450) (-0.7366) (-0.2610) -0.0311 -0.8058 (-0.0760) (-0.2610) -1.5339 -0.5378
0.0431 0.0921 0.0138 0.0138
-0.6659 -0.9155 -0.2248 -0.2248
0.1718* 0.2404* 0.4380*** 0.6854** 0.4430*** 0.3169** 0.3370*** 0.7408*** 0.1751* 0.3037* 0.2955** 0.459 0.3946*** 0.3037* 0.1551 0.4338
-1.7914 -1.7731 -3.2679 -2.334 -2.8175 -2.3599 -2.6092 -2.8252 -1.6476 -1.8735 -2.1298 -1.5219 -3.1069 -1.8735 -0.5234 -0.7873
0.3772*** 0.2466** 0.1917 0.1917
-2.9903 -2.0737 -1.4549 -1.4549
0.3122** 0.4500*** 0.1145*** 0.2231*** 0.0902* 0.0447 0.1162** 0.5584 0.1405 0.0777 0.6438*** 1.2626** 0.1584 0.0777 0.3558 0.0166
(-2.1173) (-2.6303) -0.748 -0.4036 (-0.4250) (-0.2086) -0.5433 -0.6382 -0.9441 -0.4503 -4.3164 (-2.2053) -0.6654 -0.4503 -1.3787 (-0.0214)
0.5335*** 0.2572 0.8925*** 0.8925***
-3.4346 -0.9988 -5.6806 -5.6806
TFI (i)
TFI (j)
TFI (l)
TFI (c)
TFI (d)
TFI (e)
TFI (f)
TFI (g)
TFI (h)
TFI (b)
Manufacture Manufacture Agriculture Agriculture
LICs All LICs All
All LICs All LICs
TFI (a)

TAD/TC/WP(2012)24
67
Table 7. Lower middle income countries – All sectors
Note: Fixed effects for year and sector are included but not reported. Robust standard errors clustered by country pair. p for Poisson. Significance levels are: ***=1%, **=5%, *=10%. Values for R2 range between 51-59%.
SectorImporter sampleExporter sample
reg1p reg2p reg3p reg3bisp reg1p reg2p reg3p reg3bisp0.8268*** 0.8112*** 0.2916*** 0.7870* 0.1933*** 0.0139 -0.0399 2.1878***
-6.7674 -6.5434 -3.437 -1.7393 -0.0761 -0.3767 (-1.3284) -4.2858-0.0324 -0.0820***
(-0.4128) (-2.7859)0.7423*** 0.8020*** 0.9671*** -0.6296*** 0.0651*** 0.0528*** 0.2950*** -0.5055***-11.5544 -11.6804 -12.7148 (-4.9182) -3.1204 -2.6694 -13.001 (-4.0113)
0.3717*** 0.3667***-6.5351 -16.1975
0.5896*** 0.5910*** 0.8209*** 0.4671*** 0.0669*** 0.0763*** 0.0761** -0.3491***-10.5901 -9.2648 -10.1968 (-4.1479) -3.176 -3.2109 -2.5027 (-3.2412)
0.3124*** 0.0830***-5.2326 -3.1941
0.4955*** 1.5032*** 0.9854*** -0.3469 -0.0189 -0.0175 0.1795*** 0.5582-9.9567 -12.1812 -8.9623 (-1.0092) (-0.6351) (-0.6072) -5.3016 -1.6057
0.1633* 0.4190***
-1.757 -10.0840.0092 0.0704 0.3029*** 0.027 0.0379 0.0339 0.0566** 0.3074
-0.1199 -0.8032 -3.1531 -0.0923 -1.5039 -1.3869 -2.3111 -1.08160.3213*** 0.0395*
-3.2289 -1.68381.3982*** 1.4213*** 1.5089*** 3.1131*** 0.028 0.0275 0.3170*** 2.0733***-16.2958 -16.2979 -15.1218 -9.5415 -0.9959 -1.0001 -9.0248 -6.4178
0.3712*** 0.4419***-5.0233 -12.9677
0.2815*** 0.2815*** 0.3474*** 0.2841** 0.0095 0.0112* 0.1064*** 0.7500***-4.8924 -4.8905 -4.9876 -2.3212 -0.4007 -0.4722 -3.9463 -5.7414
0.005 0.1185***(-0.0826) -4.7392
1.548*** 0.0241** 1.4978*** 2.7937*** 0.0485 0.032** 0.0482 3.1240***(-0.2939) -0.1266 -7.6301 -3.2178 -1.2657 -0.8568 -0.7765 -3.5669
1.1617*** 0.0378*-8.7757 -0.5679
-0.0822 -0.0893* -0.0859 0.0986 0.0026 0.0012 -0.0673*** 0.1722(-1.6406) (-1.7281) (-1.5465) -0.7241 -0.1403 -0.0641 (-3.4673) -1.1163
-0.0161 -0.0923***(-0.3132) (-4.6319)
0.0486 -0.0723 0.0615 0.2405 -0.0211 -0.0656* -0.1020** -0.1465-0.4612 (-0.5436) -0.4666 -0.857 (-1.0182) (-1.7991) (-2.3420) (-0.4071)
0.0937 -0.0993**-0.9219 (-1.9608)
0.8142*** 0.5125*** 0.7348*** 0.6988** 0.0655* 0.0811* 0.0311 0.1019-5.2624 -4.5493 -6.7424 (-1.6893) -1.7618 -1.9296 -0.7471 -0.2268
0.6473*** 0.025-5.1923 (-0.4649)
TFI (e)
TFI (f)
Total TotalLMICs
All LMICsAll
TFI (a)
TFI (b)
TFI (c)
TFI (d)
TFI (g)
TFI (h)
TFI (i)
TFI (j)
TFI (l)

TAD/TC/WP(2012)24
68
Table 8. Lower middle income countries – Manufacturing and agriculture
Note: Robust standard errors clustered by country pair. p for Poisson. Significance levels are: ***=1%, **=5%, *=10%. Values for R2 range between 56-68%.
Sector
Importer sample
Exporter sample
reg1p reg2p reg3p reg3bisp reg1p reg2p reg3p reg3bisp reg1p reg2p reg3p reg3bisp reg1p reg2p reg3p reg3bisp0.8739*** 0.8630*** 0.2441** 0.4716 -0.0784 -0.0905 -0.2524** 2.5858*** 0.7506*** 0.7318*** 0.2876*** 0.4635 -0.0938 -0.1104 -0.2502** 1.6298***
-6.137 -5.9498 -2.4407 -0.9234 (-0.8145) (-0.9003) (-2.4724) -4.2252 -5.1345 -4.9176 -2.9335 -0.876 (-0.9693) (-1.0939) (-2.4596) -2.851-0.132 -0.3914*** 0.0101 -0.3295**
(-1.3986) (-2.6941) -0.1114 (-2.3191)0.8540*** 0.9303*** 1.1491*** -0.7087*** 0.1373** 0.1273* 1.0589*** -0.5220*** 0.8620*** 0.9245*** 1.2097*** -0.8588*** 0.1171* 0.1077 1.1310*** -0.8116***-10.8593 -11.0463 -12.3408 (-4.6346) -2.1576 -1.8223 -12.5963 (-3.4581) -12.1227 -12.1507 -13.6828 (-6.0352) -1.8117 -1.5332 -12.7621 (-5.3904)
0.4268*** 1.1182*** 0.5618*** 1.2813***-6.1132 -15.1667 -7.9784 -16.6653
0.6403*** 0.6752*** 0.9810*** -0.5630*** 0.1572** 0.2295*** 0.5843*** -0.4128*** 0.5672*** 0.5546*** 0.7459*** -0.5415*** 0.2119*** 0.1974*** 0.4867*** -0.3230**-9.3989 -8.6776 -10.2169 (-4.2580) -2.5031 -3.4475 -6.5698 (-3.2734) -8.7497 -7.489 -7.8684 (-4.2990) -3.2883 -2.8108 -5.0309 (-2.5661)
0.3800*** 0.4813*** 0.3188*** 0.3779***-5.3909 -6.7911 -4.5903 -4.9586
1.4961*** 1.4989*** 1.2884*** -1.2338*** -0.1414 -0.1419 0.9983*** 0.5776 1.6875*** 1.6816*** 0.8524*** -0.7428* -0.1281 -0.1273 0.8814*** -0.3293-10.8426 -10.2392 -10.0297 (-3.1367) (-1.3651) (-1.2753) -7.5731 -1.3815 -11.447 -10.6556 -6.2499 (-1.8578) (-1.2146) (-1.1206) -6.4495 (-0.7727)
0.4711*** 2.0255*** -0.0246 1.8999***-4.2337 -14.4647 (-0.2225) -12.3373
0.0939 0.1895* 0.5341*** -0.5419 0.2302*** 0.2246* 0.6014*** -0.1228 0.0569 0.1061 0.3548*** -0.2325 0.1866** 0.0938 -0.1018 0.5519-1.058 -1.8534 -4.7235 (-1.5724) -2.586 -1.8983 -4.9068 (-0.3590) -0.5853 -0.9474 -2.8814 (-0.6233) -1.9804 -0.7517 (-0.8155) -1.4846
0.5461*** 0.5174*** 0.3921*** -0.2176*-4.6183 -4.4427 -3.161 (-1.9133)
1.6103*** 1.6388*** 2.1052*** 4.2632*** 0.0207 -0.0047 1.2962*** 2.7185*** 1.5711*** 1.5924*** 1.4529*** 2.7747*** 0.0361 0.0504 1.1549*** 1.9581***-15.6082 -15.7557 -17.7765 -11.1655 (-0.2256) (-0.0529) -10.9746 -7.1442 -15.7043 -15.6962 -12.005 -7.0542 -0.3784 -0.5451 -9.3994 -5.0347
0.8046*** 1.5985*** 0.1883** 1.4166***-9.2415 -15.5239 -2.0913 -13.0623
0.4650*** 0.4647*** 0.5289*** 0.1871 0.0343 -0.037 -0.0626 0.8893*** 0.3169*** 0.3196*** 0.5336*** 0.0012 -0.1232* -0.1194 0.2839*** 0.5076***-6.732 -6.7255 -6.173 -1.2781 (-0.4758) (-0.5142) (-0.7167) -5.6568 -4.5105 -4.5509 -6.1809 -0.0086 (-1.6777) (-1.6276) -3.0502 -3.2761
-0.0161 -0.2028** 0.1946*** 0.2846***(-0.2196) (-2.5285) -2.712 -3.53
0.5766*** 0.4731** 1.3461*** 2.0558* 0.3471*** 0.2974* 0.7169*** 3.6079*** 0.1567** 0.2504 2.1643*** 4.0908*** 0.2249* 0.1853 0.7134*** 1.6871(-2.8063) (-2.1558) -5.7044 -1.9587 -2.75 -1.821 -2.9779 -3.2429 -0.687 -0.9965 -8.5979 -3.7803 -1.7102 -1.094 -2.7761 -1.4542
1.2131*** 0.6417** 1.5709*** 1.0838***-7.6776 -2.2451 -9.3146 -3.7024
-0.2780*** -0.2840*** -0.1474** 0.0663 -0.0687 -0.0826 0.076 0.2077 -0.0525 -0.0505 -0.1560** 0.0584 0.0586 0.0584 -0.1568** 0.0891(-4.7089) (-4.6637) (-2.2203) -0.429 (-1.1725) (-1.3065) -1.1056 -1.1264 (-0.8917) (-0.8304) (-2.3871) -0.3569 -0.965 -0.8959 (-2.2763) -0.4878
0.1081* 0.1749** -0.1607*** -0.2423***-1.7644 -2.5449 (-2.6156) (-3.4864)
-0.3712*** -0.5294*** -0.157 -0.0265 0.002 -0.0766 0.1889 -0.1711 0.3992*** 0.256 0.2065 0.2864 -0.0206 -0.0843 -0.0626 0.0462(-2.7532) (-3.1631) (-1.0107) (-0.0775) -0.0256 (-0.6330) -1.206 (-0.4684) -3.1002 -1.4666 -1.1708 -0.7141 (-0.2490) (-0.4998) (-0.2968) -0.1026
0.0605 0.9085*** 0.1151 0.0645-0.494 -5.1128 -0.8365 -0.3129
0.2661** 0.2347* 0.6394*** 0.9708** 0.2176* 0.3323** 0.8061*** 0.4799 0.5314*** 0.5171*** 0.7784*** 1.2061** 0.5530*** 0.5582*** 0.6468*** -0.7322-2.2387 -1.7101 -4.8358 (-1.9969) -1.7604 -2.2835 -6.3439 -0.9173 -4.3964 -3.7319 -5.7459 (-2.4755) -4.3721 -3.7122 -4.7091 (-1.4270)
0.7705*** 0.8732*** 0.7503*** 0.4957***-5.0201 -6.4835 -4.9853 -3.3534
TFI (i)
TFI (j)
TFI (l)
TFI (c)
TFI (d)
TFI (e)
TFI (f)
TFI (g)
TFI (h)
TFI (b)
Manufacture Manufacture Agriculture Agriculture
LMICs All LMICs All
All LMICs All LMICs
TFI (a)

TAD/TC/WP(2012)24
69
Table 9. Upper middle income countries – All sectors
Note: Fixed effects for year and sector are included but not reported. Robust standard errors clustered by country pair. p for Poisson. Significance levels are: ***=1%, **=5%, *=10%. Values for R2 range between 58-62%.
Sector
Importer sample
Exporter sample
reg1p reg2p reg3p reg3bisp reg1p reg2p reg3p reg3bisp
0.4961*** 0.0839 0.0366** 1.4312*** 0.4975** 0.4961** 0.2715 0.2715
-9.9222 -1.1857 -0.5635 -4.6189 -2.0123 -2.0101 -1.2951 -1.2951
0.0354 -0.1604
(-0.4749) (-0.5976)
-0.043 -0.0411 0.4185*** 0.144 0.6194*** 0.6158*** 0.3206** 0.3206**
(-1.0040) (-0.9229) -8.7465 -1.2468 -3.6041 -3.62 -2.0786 -2.0786
0.5863*** -0.2095
-11.6178 (-1.4911)
0.4696*** 0.5276*** 0.7871*** -0.4178*** 0.4058*** 0.4233*** 0.3073** 0.3073**
-12.4099 -12.9016 -15.1527 (-4.2567) -2.6506 -2.7449 -2.1912 -2.1912
0.4286*** 0.042
-8.5872 -0.4122
0.086 0.1022 0.2141*** 0.9345*** 0.3129 0.3225 0.4865** 0.4865**
-1.0888 -1.2439 -2.8487 -3.2035 -1.5208 -1.5427 -2.0753 -2.0753
0.2277*** 0.5497**
-2.9295 -1.9933
0.3275*** 0.3350*** 0.6486*** -0.4573 0.3546** 0.4257*** 0.5519*** 0.5519***
-5.1534 -4.6601 -8.9539 (-1.4533) -2.2336 -2.6086 -3.3339 -3.3339
0.6072*** 0.4762***
-8.13 -2.6286
0.5833*** 0.5944*** 0.7326*** 1.5783*** 0.3269* 0.3372** 0.5625** 0.5625**
-8.7654 -8.8048 -9.5885 -7.1266 -1.9366 -1.9706 -2.4973 -2.4973
0.3824*** 0.278
-5.756 -1.4828
0.3834*** 0.1816*** 0.0016 0.6747*** 0.6251*** 0.6222*** 0.5596*** 0.5596***
(-7.6925) (-3.6544) -0.0287 -5.0353 -3.2539 -3.2771 -2.631 -2.631
0.1011* 0.088
-1.8043 -0.5243
1.6204*** 0.6680*** 1.6479*** 2.0007*** 0.232 0.2979 0.9447*** 0.9447***
-22.8571 -8.2367 -15.029 -3.7135 -0.6145 -0.8522 -2.6565 -2.6565
1.4412*** 0.6931***
-14.3666 -2.767
-0.0233 -0.0244 -0.0551 0.0963 0.2392** 0.2395** 0.184 0.184
(-0.5367) (-0.5472) (-1.2667) -0.751 -2.0795 -2.101 -1.3334 -1.3334
-0.0443 0.0036
(-1.0090) -0.027
-0.3650*** -0.4635*** -0.4996*** 0.0318 0.1588 0.0163 -0.3442** -0.3442**
(-6.7040) (-6.7653) (-5.0905) -0.1987 -1.2435 -0.1182 (-1.9634) (-1.9634)
-0.0725 -0.4383***
(-1.0913) (-2.7299)
1.0331*** 0.9560*** 0.9966*** 0.5697*** 0.089 0.0579* 0.3786 0.3786
-11.2194 -9.5887 -11.2842 (-11.394) (-0.2765) (-1.158) -1.2939 -1.2939
0.7653*** 0.9970***
-7.4752 -2.9187
TFI (g)
TFI (h)
TFI (i)
TFI (j)
TFI (l)
TFI (f)
Total Total
UMICs All
All UMICs
TFI (a)
TFI (b)
TFI (c)
TFI (d)
TFI (e)

TAD/TC/WP(2012)24
70
Table 10. Upper middle income countries – Manufacturing and agriculture
Note: Robust standard errors clustered by country pair. p for Poisson. Significance levels are: ***=1%, **=5%, *=10%. Values for R2 range between 59-68%.
Sector
Importer sample
Exporter sample
reg1p reg2p reg3p reg3bisp reg1p reg2p reg3p reg3bisp reg1p reg2p reg3p reg3bisp reg1p reg2p reg3p reg3bisp0.2615*** 0.2673*** 0.1709** 0.6411* 0.0015 0.0017 0.0534 2.0514*** 0.027 0.0193 -0.0029 0.9264*** -0.2492** -0.2523** 0.2187** 1.1309***
-3.1677 -3.1778 -2.214 -1.7947 (-0.0148) (-0.0164) -0.601 -5.1839 -0.2993 -0.2105 (-0.0353) -2.6351 (-2.5279) (-2.5278) -2.5404 -3.0718-0.0049 0.1054 -0.0037 0.6197***
(-0.0550) -1.1318 (-0.0413) -6.8390.1152** 0.1372*** 0.6541*** -0.1184 0.1657** 0.1741*** 0.3063*** 0.3418** -0.1459** -0.1566*** 0.4905*** 0.0693 0.1846*** 0.1889*** 0.5869*** -0.169
-2.307 -2.6491 -11.6823 (-0.8884) -2.5534 -2.6277 -4.5857 -2.2721 (-2.5449) (-2.6200) -7.4179 -0.4978 -2.8883 -2.9134 -8.8835 (-1.2000)0.7364*** 0.1859*** 0.8229*** 0.6000***-12.2046 -2.7717 -12.2062 -9.5088
0.4293*** 0.4837*** 0.9435*** -0.4629*** 0.1904*** 0.2253*** 0.9219*** -0.5118*** 0.7057*** 0.7445*** 0.8579*** -0.7046*** 0.2563*** 0.2905*** 0.6283*** -0.2933**-9.2591 -9.8186 -15.7831 (-4.1060) -2.9717 -3.4331 -12.2425 (-4.2130) -14.3553 -13.6748 -12.064 (-5.9342) -4.0572 -4.4163 -8.3986 (-2.3574)
0.6511*** 0.8974*** 0.3500*** 0.4803***-11.3834 -15.4868 -5.1797 -7.7143
0.1386 0.1608* 0.5802*** -0.2138 -0.1111 -0.0762 0.9539*** 0.5354 -0.1201 -0.1317 -0.1481 1.2473*** -0.1112 -0.0866 0.9564*** -0.363-1.4989 -1.6673 -6.5629 (-0.6468) (-1.0762) (-0.7364) -8.8806 -1.1196 (-1.1598) (-1.1958) (-1.4693) -3.3181 (-1.0882) (-0.8315) -8.817 (-0.7959)
0.6869*** 1.6502*** -0.0707 1.6695***-7.3693 -14.0082 (-0.6769) -13.5717
0.2567*** 0.2470*** 0.8684*** -1.0718*** 0.2910*** 0.3017*** 0.2689*** 0.9662** 0.0196 0.024 0.4445*** -0.0253 0.2941*** 0.3066*** 0.6875*** -0.4963-3.4264 -2.9589 -10.1564 (-3.1617) -3.3721 -3.2779 -2.6583 -2.4406 -0.2156 -0.2292 -4.3466 (-0.0600) -3.4091 -3.2998 -6.8625 (-1.3895)
0.9744*** 0.0407 0.5863*** 0.7374***-11.1566 -0.3766 -5.6727 -7.216
0.4240*** 0.4517*** 1.1986*** 2.4736*** 0.0991 0.1466* 1.0922*** 2.1085*** 0.3687*** 0.3746*** 0.2876*** 0.4427 0.0084 0.0413 1.0132*** 1.8218***-5.1789 -5.5842 -13.6123 -9.7977 -1.1216 -1.6817 -10.9447 -7.3806 -4.0032 -4.0074 -2.7263 -1.438 -0.0925 -0.4589 -9.7822 -6.1393
1.0431*** 1.4342*** 0.0737 1.4525***-13.6538 -16.1842 -0.7879 -14.9352
0.0313 0.0297 0.1039 0.3633** -0.0972 -0.0886 0.3523*** 0.4095** 0.3674*** -0.3600*** 0.0773 0.5369*** -0.1532** -0.1388* 0.5241*** -0.0485(-0.5284) (-0.5010) -1.5541 -2.2789 (-1.3372) (-1.2235) -4.3109 -2.3521 (-5.5188) (-5.4220) -0.9774 -3.2955 (-2.1278) (-1.9480) -6.5519 (-0.2876)
0.0895 0.4094*** 0.4182*** 0.6934***-1.3557 -5.8067 -5.5954 -10.1516
0.5196*** 0.5551*** 1.8245*** 1.8476*** 0.4532*** 0.4921*** 2.9172*** 3.3386*** 0.2725** 0.2927** 1.5630*** 1.6831** 0.2843** 0.2685** 3.1016*** 2.0029***-5.4227 -5.6426 -13.8984 -2.9506 -3.5774 -4.0053 -19.7583 -4.5422 -2.5027 -2.4833 -9.8287 -2.2889 -2.2185 -2.1492 -19.533 -2.6745
1.7468*** 2.7188*** 1.8733*** 3.1420***-14.8567 -24.5671 -12.7966 -26.6393
-0.016 -0.0128 0.0824 0.1057 -0.0527 -0.0531 0.1464** 0.1906 0.0827 0.0776 -0.1403** -0.0224 0.026 0.0228 -0.0998* 0.0534(-0.3123) (-0.2400) -1.585 -0.6767 (-0.9105) (-0.9087) -2.4861 -1.1028 -1.3734 -1.2437 (-2.4272) (-0.1336) -0.4443 -0.3832 (-1.7050) -0.3082
0.1347** 0.3252*** -0.2468*** -0.1488**-2.5075 -5.4108 (-4.3524) (-2.4364)
-0.2211*** -0.2898*** -0.3742*** 0.0882 -0.0074 -0.0385 0.1235 0.1735 -0.4127*** -0.5367*** -0.5625*** 0.0081 -0.0746 -0.118 0.3020** -0.0148(-3.3068) (-3.6883) (-3.5464) -0.4692 (-0.1007) (-0.4336) -0.9547 -0.7636 (-5.6785) (-5.5131) (-4.1764) -0.0365 (-0.9985) (-1.1961) -2.2098 (-0.0566)
-0.1582** 0.1874* -0.0665 0.5232***(-2.0311) -1.789 (-0.7126) -4.6222
0.9607*** 0.9264*** 1.2119*** 1.9912*** 0.3799*** 0.3518*** 1.7426*** -0.3866 0.8461*** 0.7082*** 0.8815*** -0.5514 0.3945*** 0.3905*** 1.4520*** 1.1108-8.679 -7.7729 -12.1541 (-4.1889) -3.172 -2.6582 -13.4363 (-0.5237) -6.5702 -4.8652 -6.9639 (-0.9029) -3.3136 -2.8856 -10.8002 (-1.5729)
1.0894*** 2.9169*** 0.8080*** 2.2970***-9.3887 -17.7572 -5.5485 -12.7696
TFI (i)
TFI (j)
TFI (l)
TFI (c)
TFI (d)
TFI (e)
TFI (f)
TFI (g)
TFI (h)
TFI (b)
Manufacture Manufacture Agriculture Agriculture
UMICs All UMICs All
All UMICs All UMICs
TFI (a)

TAD/TC/WP(2012)24
71
Table 11. Sub-Saharan Africa – All sectors
Note: Fixed effects for year and sector are included but not reported. Robust standard errors clustered by country pair. p for Poisson. Significance levels are: ***=1%, **=5%, *=10%. Values for R2 range between 45-54%.
Sector
Importer sample
Exporter sample
reg1p reg2p reg3p reg3bisp reg1p reg2p reg3p reg3bisp reg1p reg2p reg3p reg3bisp0.1089*** 0.061 0.1419** 0.1287 -0.0457 -0.0374 0.1170* 0.6254*** 0.0149 0.026 0.1405 -0.2067
-2.178 -0.8778 -2.1215 -0.5177 (-0.6229) (-0.4897) -1.7794 -2.9998 -0.1011 -0.17 -1.0141 (-0.5645)0.1808** 0.1989*** 0.1956-2.4136 -3.2541 -1.5952
0.2733*** 0.6473*** 0.8825*** 0.5884*** 0.1166** 0.1236** 0.7527*** -0.2236*** 0.5640*** 0.6359*** 1.2344*** -0.6422***(-3.0263) -11.0795 -12.0016 -10.8571 -2.4485 -2.4439 -10.1039 (-2.6354) -5.312 -5.79 -6.601 (-4.4194)
0.2277*** 0.6335*** 0.4740***-4.4483 -11.4122 -4.7422
0.4226*** 0.6342*** 0.8324*** 0.6155*** 0.0736 0.081 0.7986*** -0.4274*** 0.3977*** 0.3121* 0.6940* 0.7077***(-4.1598) -9.3617 -8.3047 -10.4286 -1.5257 -1.2707 -8.2468 (-4.5845) -3.3254 -1.8544 -1.9613 (-3.4306)
0.1474** 0.6805*** 0.5666***-2.1294 -10.2436 -3.4878
0.4594*** 0.5336*** 0.7407*** -0.4670** -0.1261 -0.1293 0.5731*** 0.4680** 0.3468** 0.5017** 0.8305*** -1.4944***-5.5387 -6.0024 -7.6865 (-2.0636) (-1.5447) (-1.3834) -5.4664 -2.0568 -2.003 -2.5172 -3.5009 (-3.6740)
0.4277*** 0.7802*** 0.6030***-4.5738 -8.4462 -3.1953
0.4011*** 0.4524*** 0.3423** -0.2 0.0627 0.0275 0.2563* 0.0796 0.5911*** 0.6987*** 1.2615*** -2.4103***-3.503 -3.4192 -2.543 (-0.6475) -0.9126 -0.2796 -1.9124 -0.2745 -2.7308 -2.7987 -3.7756 (-3.7062)
0.0474 0.3683*** 0.7344***-0.4663 -2.7024 -2.7192
0.8602*** 0.8715*** 1.2829*** 1.9131*** 0.0041 0.0095 0.6420*** 1.2484*** 0.6721*** 0.7191*** 1.2527*** 0.9198***-12.229 -12.2437 -14.2836 -6.3907 -0.0565 -0.1337 -7.3932 -4.7113 -4.677 -5.0132 -6.081 (-18.378)
0.5253*** 0.6604*** 0.6895***-7.4352 -9.8978 -5.1613
0.5765*** 0.3911*** 0.4271*** 0.7792*** 0.031 0.0225 0.1563* 0.0328 0.4438*** 0.4645*** 0.9514*** 0.2851*-8.9242 -8.2263 -4.3171 -11.2371 (-0.5639) (-0.4187) -1.6021 (-0.3367) -4.2671 -4.5075 -6.0913 (-1.6569)
0.0567 0.7121*** 0.3450***-1.0105 -13.9833 -3.1609
0.3904*** 0.5065*** 1.5931*** 1.0716* 0.5066*** 0.5686*** 1.9713*** 1.7525*** 0.4834*** 0.5255** 1.7853*** 0.0196*-8.2109 -4.8645 -11.2581 -1.6877 -5.227 -5.2215 -13.0562 -2.6166 -9.668 -2.405 -5.5678 (-0.0138)
1.2733*** 1.6889*** 1.4869***-11.5958 -14.3074 -6.2163
-0.1085** -0.0951** -0.0644 0.1015 -0.0035 -0.0045 -0.0196 0.1172 -0.063 0.0109 0.0272 -0.1659
(-2.5327) (-2.1522) (-1.2714) -0.7925 (-0.0749) (-0.0890) (-0.3832) -0.8609 (-0.7088) (-0.1165) -0.2465 (-0.6974)0.0133 -0.0168 0.0972
-0.2567 (-0.3529) -0.96370.2897*** 0.4104*** 0.4060*** 0.4575** 0.1163* 0.2206** 0.6091*** 0.4324 0.0243*** 0.2834 0.0324 0.0325
-3.9049 -4.0789 -3.8939 -1.9923 -1.7711 -2.0276 -5.1387 -1.6245 -0.486 (-0.9237) -0.0958 -0.04470.2845*** 1.1242*** 0.3911**
-2.8149 -10.6575 -1.19220.676*** 0.2383*** 0.4420*** 0.2317*** 0.3718*** 0.4670*** 0.1528 0.2398 0.2634* 0.2454 0.222 0.9887**
(-3.0745) -2.9045 -4.7336 -3.2865 -3.4759 -3.2172 -1.5313 (-0.7104) -1.7077 -1.1338 -0.986 (-2.2719)0.6551*** -0.0006 0.191
-4.6733 (-0.0074) -0.9293
TFI (j)
TFI (l)
TFI (d)
TFI (e)
TFI (f)
TFI (g)
TFI (h)
TFI (i)
TFI (c)
All All All
SSA All SSA
All SSA SSA
TFI (a)
TFI (b)

TAD/TC/WP(2012)24
72
Table 12. Sub-Saharan Africa – Manufacture and agriculture sectors
Note: Robust standard errors clustered by country pair. p for Poisson. Significance levels are: ***=1%, **=5%, *=10%. Values for R2 range between 45-63%.
Sector
Importer sample
Exporter sample
reg1p reg2p reg3p reg3bisp reg1p reg2p reg3p reg3bisp reg1p reg2p reg3p reg3bisp reg1p reg2p reg3p reg3bisp
0.1932** 0.2040** 0.2316*** 0.0047 -0.1269 -0.1256 0.2464*** 0.8811*** 0.2816*** 0.2831*** 0.3321*** -0.1964 -0.0438 -0.046 0.0034 0.3722
-2.1261 -2.1979 -2.7475 -0.0158 (-1.5132) (-1.4333) -3.1524 -3.5863 -3.2981 -3.2528 -4.089 (-0.7108) (-0.4878) (-0.4923) -0.0404 -1.4684
0.1565* 0.4609*** 0.2517*** 0.0618
-1.7692 -6.2554 -2.9538 -0.7211
0.8178*** 0.8928*** 1.1596*** -0.3185*** 0.0504 0.0547 0.9988*** -0.3054*** 0.6774*** 0.7457*** 1.1336*** -0.6239*** 0.1703*** 0.1847*** 0.7639*** -0.2938***
-12.2414 -12.4693 -13.0036 (-2.8804) -0.9226 -0.9523 -11.2789 (-3.1343) -10.6023 -10.9796 -13.1924 (-6.1569) -2.8064 -2.903 -8.4202 (-2.8002)
0.2195*** 0.9453*** 0.5155*** 0.6067***
-3.4779 -14.5594 -8.6301 -8.5275
0.5578*** 0.5676*** 0.8207*** -0.4348*** 0.009 0.0256 1.1806*** -0.5164*** 0.6890*** 0.6805*** 0.8435*** -0.5432*** 0.1334** 0.1419* 0.6624*** -0.4577***
-7.8173 -6.9135 -7.0462 (-3.4628) -0.1656 -0.3561 -10.4914 (-4.7931) -9.6994 -8.3846 -7.3733 (-4.6084) -2.1929 -1.7849 -5.9129 (-3.9213)
0.2303*** 1.0231*** 0.1802** 0.5555***
-2.6897 -13.4742 -2.2871 -6.9559
0.6951*** 0.7813*** 0.9934*** -0.6564** -0.1957** -0.2004* 1.0716*** 0.2692 0.4404*** 0.5162*** 0.6027*** -0.6714** -0.2170** -0.2288* 0.2870** 0.5604*
-6.8691 -7.237 -8.7794 (-2.3891) (-2.0990) (-1.8963) -8.6399 -1.0155 -4.2057 -4.5587 -5.1621 (-2.4781) (-2.0068) (-1.8857) -2.2131 -1.9088
0.4841*** 1.4810*** 0.3341*** 0.5137***
-4.2728 -13.6662 -3.0606 -4.3011
0.3237** 0.3353** 0.3017** -0.1941 0.0403 0.0307 0.4714*** 0.1568 0.6300*** 0.7567*** 0.7576*** -0.9448** 0.1591* 0.1185 -0.3031* 0.0781
-2.5678 -2.3235 -1.9771 (-0.5516) -0.5235 -0.2848 -3.1626 -0.4906 -4.5992 -4.7866 -4.5829 (-2.5444) -1.7348 -0.9365 (-1.7879) -0.2037
0.0723 0.6556*** 0.2774** -0.5335***
-0.6091 -4.2658 -2.2004 (-3.2532)
1.0535*** 1.0738*** 1.6948*** 2.4535*** -0.1540* -0.1444* 1.0194*** 2.1857*** 0.9321*** 0.9349*** 1.2094*** 1.5701*** 0.1072 0.1116 0.5737*** 0.7823**
-12.4442 -12.5988 -15.575 -6.8255 (-1.8724) (-1.8176) -9.978 -6.937 -10.6268 -10.5108 -10.7467 -4.3399 -1.1492 -1.2021 -4.9556 -2.1634
0.7672*** 1.1640*** 0.4101*** 0.5288***
-8.7911 -15.3119 -4.9 -5.773
0.6671*** 0.6681*** 0.9058*** 0.0314 -0.0035 0.0088 1.0930*** -0.2353** 0.5028*** 0.5051*** 0.7580*** -0.1757 -0.0711 -0.0596 0.9995*** -0.2162*
-11.3478 -11.3676 -11.7565 -0.2654 (-0.0559) -0.1441 -13.6062 (-2.1322) -8.2702 -8.3255 -9.5246 (-1.5122) (-1.0186) (-0.8777) -11.32 (-1.7784)
0.0955 1.0263*** 0.2236*** 0.9637***
-1.4082 -17.5638 -3.4292 -14.2399
0.3265*** 0.3767*** 1.2681*** 1.7141** 0.4216*** 0.4665*** 2.2225*** 3.0422*** 0.4757*** 0.5180*** 1.9758*** 0.8173 0.4562*** 0.4955*** 1.7198*** 0.9673
-2.9101 -3.1611 -7.5509 -2.3801 -3.8809 -3.9013 -13.4225 -4.0405 -3.9349 -4.0366 -11.333 -1.0079 -3.4811 -3.3163 -8.9007 -1.1462
0.9889*** 2.0545*** 1.7113*** 1.4809***
-7.1855 -15.9038 -12.2704 -9.8611
-0.1196** -0.1151** -0.0744 0.0784 -0.0503 -0.0518 0.1653*** 0.1726 -0.1413*** -0.1254** -0.1208** 0.1247 0.0421 0.0448 -0.013 -0.0235
(-2.3285) (-2.1788) (-1.2283) -0.5384 (-0.9613) (-0.9146) -2.8718 -1.1605 (-2.7218) (-2.3439) (-2.0693) -0.8245 -0.7117 -0.7179 (-0.2045) (-0.1428)
0.0229 0.2536*** -0.0466 -0.0281
-0.3869 -4.8777 (-0.7930) (-0.4746)
0.2427*** 0.3315*** 0.4692*** 0.5794** 0.1516** 0.2970*** 0.6793*** 0.5343* 0.1119 0.1909 0.3237** 0.5139* 0.0885 0.2558* 0.6163*** 0.5490*
-2.7781 -2.7951 -3.9849 -2.2708 -2.1084 -2.651 -5.665 -1.9457 -1.1006 -1.2956 -2.4754 -1.8531 -1.0299 -1.7632 -4.0491 -1.6894
0.4023*** 1.1851*** 0.2958** 1.0071***
-3.5047 -10.4094 -2.3287 -6.4433
0.2472*** 0.2445** 0.4086*** 0.9321** 0.2223* 0.3357** 0.4140*** 0.0744 0.3002*** 0.2846*** 0.5513*** 1.5231*** 0.5383*** 0.5368*** 0.0526 0.2313
-2.9339 -2.4902 -3.7188 (-2.3758) -1.8449 -2.0162 -3.6238 -0.1878 -3.5408 -2.9046 -4.9857 (-4.1012) -4.0025 -2.9914 (-0.4224) (-0.5645)
0.5521*** 0.3422*** 0.8832*** -0.2630**
-3.2824 -3.4784 -5.3779 (-2.4138)
TFI (i)
TFI (j)
TFI (l)
TFI (c)
TFI (d)
TFI (e)
TFI (f)
TFI (g)
TFI (h)
TFI (b)
Manufacture Manufacture Agriculture Agriculture
SSA All SSA All
All SSA All SSA
TFI (a)

TAD/TC/WP(2012)24
73
Table 13. Middle East and North Africa – All sectors
Note: Fixed effects for year and sector are included but not reported. Robust standard errors clustered by country pair. p for Poisson. Significance levels are: ***=1%, **=5%, *=10%. Values for R2 range between 60-64%.
Sector
Importer sample
Exporter sample
reg1p reg2p reg3p reg3bisp reg1p reg2p reg3p reg3bisp reg1p reg2p reg3p reg3bisp0.2715*** 0.2593*** 0.7669*** 0.4646 -0.2321 -0.2038 0.8495*** 2.0018* 2.6372*** 3.2434*** 3.7632*** 4.8878
-5.432 -5.186 -6.1048 -0.626 (-1.5627) (-1.4452) -5.1809 -1.7462 -4.2125 -5.6653 -8.6349 -3.66730.0581 3.2896*** 3.0899***
-0.5221 -15.0834 -6.17760.7184*** 0.7485*** 0.9263*** 1.3061** 0.2962 0.3114 1.0125*** 0.3258 0.7036* 1.3667*** 2.6048*** 4.6113*
-5.9993 -5.7785 -7.7092 (-2.2928) -1.6016 -1.5787 -5.9846 -0.4004 -1.6782 -3.3726 -6.1941 (-1.7347)0.7848*** 1.2708*** 3.0427***
-5.3631 -7.3921 -8.04040.5410*** 0.6087*** 0.6586*** -0.6902*** -0.1620* -0.0943 0.5690*** 0.0418 0.8596** 2.5815*** 2.0681 -3.8647***
-5.5467 -5.9963 -4.8168 (-4.3659) (-1.7349) (-0.8323) -2.9646 -0.2305 -2.0906 -4.2299 -1.4036 (-2.7473)0.3090*** 0.6586*** 1.7501**
-3.2054 -4.7105 -2.3633-0.3909*** -0.3869** 0.0562 0.9770** 0.0804 0.0716 -0.2181 3.5951*** -0.4102 -0.0187 1.0133 -4.0292(-2.6733) (-2.5429) -0.4286 -1.9743 -0.5216 -0.4663 (-1.2909) -5.3186 (-0.7035) (-0.0320) -1.5478 (-1.3334)
0.2989** -0.5672*** 1.6248***-2.3532 (-2.9046) -2.747
0.2216*** 0.3330*** 0.5205*** -0.5081* -0.0452 -0.0159 0.3067** 0.6299* 0.6094* -0.1474 -0.9570* 2.2831**-2.6254 -3.4589 -4.5438 (-1.7070) (-0.3331) (-0.1099) -1.9668 -1.7216 -1.7283 (-0.3996) (-1.6658) -2.5426
0.3433*** 0.2282* -1.7343***-2.8662 -1.8242 (-5.5428)
0.6902*** 0.7220*** 0.9456*** 2.1350*** -0.1056 -0.1007 0.0629 0.2773 1.2208** 1.9267*** 2.5955*** 5.6800***-4.9597 -5.1967 -7.5924 -6.9723 (-0.7310) (-0.6962) -0.4 -0.7062 -2.158 -3.5384 -4.959 -4.6848
0.6300*** 0.3002* 2.0430***-5.5965 -1.889 -4.0669
0.9106*** 0.9963*** 2.1399*** 0.208 0.222 0.2364 1.3606*** 2.0636** 1.3818** 1.7361*** 3.2604*** -2.293-6.6349 -6.9482 -11.1297 (-0.2424) -1.1326 -1.2289 -5.4239 -2.1896 -2.6062 -3.5592 -4.6124 (-0.7410)
1.4921*** 1.1809*** 1.9966***-9.8248 -6.4618 -4.4361
0.8585*** 0.8595*** 0.5006*** 0.9459*** 0.17 0.1401 0.7965*** -1.0541*** 0.9104** 1.3840*** 1.9919*** 4.7765***-8.6039 -8.6135 -4.8194 (-3.9453) (-1.6246) (-1.4087) -6.0846 (-3.8184) -2.1405 -3.253 -3.96 (-4.1005)
0.0409 1.5870*** 1.7187***-0.4489 -12.2397 -4.8099
-0.3977*** -0.4204*** -0.2086*** 0.1851 0.0715 0.0668 -0.1744** 0.5992** -0.217 -0.148 0.1339 1.0374(-5.5572) (-5.6834) (-2.8391) -0.824 -0.8319 -0.7854 (-2.1013) -2.3225 (-0.8689) (-0.5521) -0.5043 -1.1987
0.012 -0.4640*** 0.2374-0.1642 (-4.9160) -0.8472
-0.9882*** -0.9366*** -0.6438*** 0.32 0.0715 0.1269 -0.7516*** 0.1176 -1.4084* -0.7189 -0.8973 -0.8759(-8.9533) (-6.6641) (-3.7807) -0.7907 -0.8319 -0.7554 (-3.3799) -0.2234 (-1.9506) (-0.8547) (-0.8636) -1.0193
0.0418 -1.0693*** -1.127-0.3268 (-6.4552) (-0.8617)
0.3807*** 0.3971*** 0.5173*** 0.4274*** 0.2359** 0.2142** 0.8966*** 0.085 0.5320* 0.6912** 1.2418** 0.5577-4.9305 -4.9364 -5.381 (-2.7033) (-2.4907) (-2.3285) -6.9349 -0.4716 -1.8629 -2.1648 -2.3586 (-1.1076)
0.2406*** 1.0679*** 0.3621-2.8918 -9.911 -1.1442
TFI (j)
TFI (l)
TFI (d)
TFI (e)
TFI (f)
TFI (g)
TFI (h)
TFI (i)
TFI (c)
All All All
MENA All MENA
All MENA MENA
TFI (a)
TFI (b)

TAD/TC/WP(2012)24
74
Table 14. Middle East and North Africa – Manufacture and agriculture
Note: Robust standard errors clustered by country pair. p for Poisson. Significance levels are: ***=1%, **=5%, *=10%. Values for R2 range between 45-54%.
Sector
Importer sample
Exporter sample
reg1p reg2p reg3p reg3bisp reg1p reg2p reg3p reg3bisp reg1p reg2p reg3p reg3bisp reg1p reg2p reg3p reg3bisp
0.3784*** 0.3745*** 0.7039*** 0.5221 0.1026 0.0764 0.8949*** 2.8928** 2.3883*** 2.3449*** 0.9052*** 0.0663 0.4396*** 0.4090** 0.7642*** 1.6287
-7.568 -7.2724 -4.6956 (-0.6333) (-0.6018) (-0.4628) -4.8601 -2.2762 -10.7186 -10.3025 -5.8528 (-0.0750) (-2.6077) (-2.5376) -4.1264 -1.2425
-0.0548 3.0451*** 0.1857 3.5565***
(-0.3999) -11.8885 -1.3214 -14.0994
0.3777*** 0.4128*** 0.5724*** -0.5874*** -0.2426** -0.2161** 1.1108*** 0.0063 0.3758*** 0.3777*** 0.5544*** -0.5402** -0.2850** -0.2602** 0.9560*** -0.0121
-3.9353 -4.1149 -4.7177 (-2.9053) (-2.1982) (-2.0269) -7.6873 -0.0295 -3.4102 -3.2514 -3.9444 (-2.5631) (-2.5169) (-2.3871) -6.0512 (-0.0607)
0.3124*** 1.2991*** 0.3217*** 1.2156***
-2.8564 -10.7195 -2.7187 -9.3657
0.6219*** 0.7240*** 0.9188*** -0.8417*** -0.1976* -0.0951 0.0951 0.2183 0.7918*** 0.8553*** 0.7663*** -0.7646*** -0.1835* -0.1537 0.5263** 0.0796
-5.1798 -5.7713 -5.4434 (-4.3926) (-1.8042) (-0.6878) -0.4167 -1.0551 -5.7743 -5.8968 -4.0528 (-3.6503) (-1.6726) (-1.2381) -2.4166 -0.3953
0.4390*** 0.1736 0.2114 0.6677***
-3.7242 -1.0429 -1.524 -4.1562
-0.4632** -0.4251** 0.3416** -0.2809 0.0102 0.0065 -0.0671 4.0154*** -0.5538** -0.5796** -0.4951*** 1.9562*** 0.0818 0.07 -0.3431 3.1242***
(-2.5393) (-2.2412) -2.1263 (-0.4638) -0.0575 -0.0367 (-0.3474) -4.8345 (-2.5476) (-2.4978) (-2.6774) -2.594 -0.4489 -0.385 (-1.6442) -3.7327
0.6813*** -0.2388 -0.267 -0.7581***
-4.4117 (-1.0557) (-1.5343) (-3.1545)
0.3008*** 0.4421*** 0.8420*** -1.3029*** -0.0819 -0.0939 -0.3694** 0.8587** 0.2833** 0.3529*** 0.4872*** -0.3138 -0.1159 -0.0659 0.1873 0.5156
-2.9646 -3.8618 -6.159 (-3.6669) (-0.5295) (-0.5710) (-2.1387) -2.1915 -2.5273 -2.7193 -3.1846 (-0.8196) (-0.7124) (-0.3838) -1.0651 -1.2915
0.8190*** -0.3417** 0.1963 0.1693
-5.4949 (-2.4851) -1.188 -1.2363
0.7793*** 0.8120*** 1.5459*** 3.5421*** -0.0387 -0.0319 0.1675 0.4321 0.7167*** 0.7310*** 0.6271*** 1.2948*** -0.1292 -0.1341 -0.2266 -0.0568
-4.5976 -4.9016 -10.6696 -9.9479 (-0.2409) (-0.1985) -0.9704 -1.003 -3.9341 -3.9772 -3.6083 -2.9876 (-0.7705) (-0.8003) (-1.2566) (-0.1243)
1.2210*** 0.4167** 0.2894* -0.3021*
-9.2254 -2.2472 -1.7829 (-1.7310)
0.8938*** 0.8917*** 0.4012*** 0.9961*** -0.1648 -0.1211 1.2998*** -1.5493*** 0.7028*** 0.7093*** 0.5905*** 1.1376*** 0.1912 0.1565 0.9848*** -1.0902***
-7.2795 -7.2647 -3.1934 (-3.4075) (-1.3704) (-1.0960) -9.1835 (-5.0518) -4.6975 -4.7518 -3.9817 (-3.4065) (-1.5659) (-1.3469) -6.3264 (-3.5297)
-0.081 2.3124*** 0.2527** 1.8408***
(-0.7213) -18.5655 -2.0466 -12.705
1.0561*** 1.1077*** 2.1691*** 0.8739 0.0192 -0.0042 1.3056*** 2.4098** 0.7617*** 0.8431*** 2.2011*** 0.333 0.0933 0.0839 0.7155** 2.1950**
-6.35 -6.3582 -9.4884 (-0.8465) -0.201 (-0.0188) -4.4099 -2.0784 -4.2384 -4.2913 -7.8625 (-0.2892) (-0.4038) (-0.3654) -2.4902 -2.1333
1.4211*** 1.3061*** 1.7448*** 0.7676***
-7.6585 -6.133 -7.4651 -3.7074
-0.4336 -0.4399*** -0.1707 0.219 0.2614 0.0109 -0.4022*** 0.5531* -0.3895*** -0.4244*** -0.2786*** 0.1489 0.0941 0.0886 0.2038** 0.5550*
(-1.7942) (-4.7164) (-2.8850) -0.7597 -0.0958 -0.1174 (-4.2369) -1.8229 (-3.8829) (-4.0439) (-2.8831) -0.5152 -0.9285 -0.8805 (-2.1003) -1.8455
0.068 -0.8176*** -0.0908 -0.5404***
-0.7429 (-7.6938) (-0.9604) (-4.9625)
-0.9555 -0.8344*** -0.7585*** -0.2663 0.2339 0.1684 -0.8797*** 0.0729 -1.1817*** -1.2154*** -0.7679*** 0.3543 0.0848 0.1269 -1.7910*** 0.062
(-3.7264) (-5.1340) (-4.0741) (-0.5604) -1.1529 -0.7998 (-3.1373) -0.1185 (-7.9942) (-5.6320) (-3.0095) -0.6121 -0.6211 -0.7806 (-7.5499) -0.0778
-0.0556 -1.2545*** 0.1251 -2.3827***
(-0.3716) (-6.2193) -0.6587 (-11.6479)
0.6719*** 0.6573*** 0.9276*** 1.5978** 0.2219 0.3002 1.1147*** 0.6774 0.7817*** 0.8550*** 1.2578*** -2.3199*** 0.0825 0.0891 1.5207*** 0.6241
-4.5311 -4.0703 -6.4591 (-2.5260) -1.632 -1.3579 -5.8429 -0.7512 -4.4534 -4.2967 -6.7329 (-2.6880) -0.3797 -0.3883 -7.6615 (-0.6609)
0.8737*** 1.4016*** 1.2436*** 2.2019***
-4.9769 -7.148 -5.4636 -12.0773
TFI (i)
TFI (j)
TFI (l)
TFI (c)
TFI (d)
TFI (e)
TFI (f)
TFI (g)
TFI (h)
TFI (b)
Manufacture Manufacture Agriculture Agriculture
MENA All MENA All
All MENA All MENA
TFI (a)

TAD/TC/WP(2012)24
75
Table 15. Asia – All sectors
Note: Fixed effects for year and sector are included but not reported. Robust standard errors clustered by country pair. p for Poisson. Significance levels are: ***=1%, **=5%, *=10%. Values for R2 range between 66-68%.
Sector
Importer sample
Exporter sample
reg1p reg2p reg3p reg3bisp reg1p reg2p reg3p reg3bisp reg1p reg2p reg3p reg3bisp
0.5659*** 1.0753*** 1.0912*** 0.1987 -0.1144 -0.1115 0.4628*** 0.2283 1.4087*** 1.5844*** 1.4254*** 2.6660***
-5.6787 -9.8187 -10.145 (-0.4300) (-1.0896) (-1.0600) -4.3896 -0.4823 -4.5448 -4.9842 -4.8915 (-3.4785)
-0.0851 0.8931*** 0.8869***
(-0.8549) -8.1008 -3.2105
0.6116*** 0.6586*** 0.6004*** -0.2505 0.0799 0.0693 0.5798*** -0.2152 0.5952*** 0.7106*** 1.3802*** -2.4290***
-7.2882 -7.4413 -7.6461 (-1.2655) -1.2134 -1.0419 -6.967 (-1.0826) -2.5923 -2.9737 -5.8755 (-3.2659)
0.2469*** 0.9581*** 1.2626***
-3.8074 -10.3489 -6.0272
0.049 0.0169 0.1384 0.1569 0.077 0.0532 0.0548 0.1109 -0.111 -0.1717 0.2685 -0.677
-0.5769 -0.1735 -1.4039 -1.0617 -1.128 -0.7435 -0.5209 -0.7509 (-0.4739) (-0.6618) -0.9207 (-1.5154)
0.0709 -0.0018 0.6873***
-1.0119 (-0.0177) -2.8214
0.5751*** 0.5700*** 0.4330*** 0.6697 -0.0145 -0.0315 0.5871*** 0.6429 0.4149 0.3352 0.6941* -3.5348**
-4.4967 -4.2269 -3.8753 -1.4837 (-0.1341) (-0.2751) -4.5551 -1.1989 -1.065 -0.7797 -1.9462 (-2.2838)
0.1105 1.0422*** 0.8599**
-1.0103 -6.9298 -2.5267
-0.0825 0.0008 0.1591* 0.3536 0.1138 0.0808 0.037 0.6015** 0.2372 0.2895 0.4509** -0.8784
(-0.9910) -0.0091 -1.6728 -1.2955 -1.1936 -0.7839 -0.3551 -2.239 -1.192 -1.5465 -2.2159 (-1.3323)
0.1748* -0.0489 0.3901*
-1.9304 (-0.5190) -1.8284
0.7433*** 0.7892*** 1.1412*** 2.7332*** 0.1048 0.137 0.9568*** 2.7118*** 0.7993*** 1.0376*** 2.1961*** 4.4748***
-7.5905 -8.0891 -10.4011 -8.6539 -1.0944 -1.4599 -6.9116 -6.0262 -3.2671 -4.1885 -6.7794 -4.8124
0.5346*** 1.6455*** 1.4351***
-6.0795 -10.7412 -4.9167
0.6627*** 0.5147*** 0.7073*** 0.9305*** 0.0263 -0.0251 0.2404** 1.0584*** 0.5828* 0.6774** 1.8048*** 0.6958
-3.5627 -4.0393 -7.1596 -4.5909 (-0.3608) (-0.3437) -1.9635 -5.2185 -1.9244 -2.2953 -5.6152 (-0.9531)
0.1554** 0.0669 1.2788***
-2.1963 -0.4127 -3.6918
1.0174*** 1.1260*** 1.9672*** 0.5554 0.3847*** 0.4018*** 1.8179*** 0.5435 1.7583*** 1.9893*** 3.2217*** 3.6934
-7.4037 -7.9068 -11.557 -0.6868 -3.046 -3.1373 -9.8852 -0.6584 -5.7683 -6.5026 -8.0509 (-1.5349)
1.1571*** 1.8016*** 1.8091***
-9.1471 -10.9559 -5.2095
-0.8119*** -0.8292*** -0.3477*** -0.0585 0.001 -0.0081 -0.4815*** 0.1581 -1.2871*** -1.3960*** -1.0992*** -1.1813*
(-9.7336) (-9.7037) (-5.0339) (-0.2861) -0.016 (-0.1312) (-6.5677) -0.7994 (-5.1482) (-5.4373) (-4.3747) (-1.6600)
0.0116 -1.0186*** -0.3699
-0.1975 (-12.4413) (-1.6025)
-0.5554*** -0.6411*** -0.2626 -0.3147 0.1323 0.2902* -0.2122 -0.6271* -1.0069*** -1.4469*** -2.2064*** -6.7787***
(-5.0984) (-4.3031) (-1.5643) (-0.9087) -1.6145 -1.9 (-0.8876) (-1.6576) (-4.5163) (-4.3562) (-7.0538) (-6.7719)
0.1327 -3.4839*** -1.9529***
-1.0408 (-9.6788) (-5.5979)
0.5085*** 0.7109*** 0.7051*** -0.2093 0.3425*** 0.3572*** 1.4627*** 0.9088 0.7455 1.0600** 1.9005*** -7.2621***
-3.9871 -3.3134 -5.3923 (-0.3248) -2.746 -2.9032 -9.655 -0.9398 -1.5854 -2.2273 -4.5376 (-3.2737)
0.5189*** 5.6227*** 2.1491***
-4.1692 -21.2871 -4.3114
TFI (j)
TFI (l)
TFI (d)
TFI (e)
TFI (f)
TFI (g)
TFI (h)
TFI (i)
TFI (c)
All All All
Asia All Asia
All Asia Asia
TFI (a)
TFI (b)

TAD/TC/WP(2012)24
76
Table 16. Asia – Manufacture and agriculture
Note: Robust standard errors clustered by country pair. p for Poisson. Significance levels are: ***=1%, **=5%, *=10%. Values for R2 range between 57-75%.
Sector
Importer sample
Exporter sample
reg1p reg2p reg3p reg3bisp reg1p reg2p reg3p reg3bisp reg1p reg2p reg3p reg3bisp reg1p reg2p reg3p reg3bisp0.9811*** 0.9824*** 0.4689*** -0.2568 -0.0878 -0.0817 0.5152*** -0.3644 0.9853*** 0.9683*** 0.5100*** -0.0042 -0.2442* -0.2579** 0.2112* -0.1694
-7.6323 -7.4958 -3.9501 (-0.4705) (-0.7402) (-0.6895) -4.3468 (-0.6774) -7.8097 -7.5127 -4.467 (-0.0084) (-1.9329) (-1.9869) -1.7021 (-0.3124)-0.1599 0.9469*** -0.0637 0.6554***
(-1.2940) -7.4909 (-0.5505) -5.07380.7005*** 0.7686*** 0.7671*** -0.5496** 0.1172 0.1034 0.3239*** -0.1837 0.5239*** 0.5763*** 0.7530*** -0.3657 0.0071 -0.0181 0.7363*** -0.5617**
-6.8152 -7.0604 -7.66 (-2.3016) -1.531 -1.2979 -3.1393 (-0.8050) -4.9761 -5.1837 -7.5633 (-1.5035) -0.0882 (-0.2212) -7.3537 (-2.1760)0.3761*** 0.4505*** 0.4499*** 1.4371***
-4.5911 -3.7952 -5.4249 -12.5898-0.043 -0.0458 0.3910*** 0.1524 0.0124 -0.0175 -0.2256* 0.2609 -0.1412 -0.2221** -0.0776 0.1796 0.0945 0.0576 -0.1728 0.1392
(-0.4296) (-0.4035) -3.349 -0.9066 -0.1604 (-0.2172) (-1.8671) -1.6078 (-1.4743) (-2.0647) (-0.6593) -1.0904 -1.1541 -0.6889 (-1.4691) -0.8260.2725*** -0.3093*** 0.0569 -0.2962**
-3.3412 (-2.6375) -0.6703 (-2.5633)0.3787** 0.4024** 0.6860*** 0.5712 -0.1206 -0.1601 -0.0115 0.9901 0.3579** 0.2985* -0.1964 0.9883* -0.2085 -0.2644* 0.5917*** -1.0139-2.4439 -2.466 -4.8959 -1.0872 (-0.9653) (-1.1940) (-0.0748) -1.6259 -2.4654 -1.936 (-1.4545) -1.8685 (-1.5694) (-1.8415) -3.7119 (-1.5825)
0.5523*** 0.1797 -0.4977*** 1.4394***-4.0824 -0.9528 (-3.5596) -7.7577
0.0087 0.1489 0.5667*** 0.1384 0.2151** 0.1745 0.1787 0.4153 -0.0371 0.0027 0.1835 0.1682 -0.0128 -0.1018 -0.2879** 0.8964***-0.0879 -1.3588 -4.8054 -0.4075 -2.0373 -1.5943 -1.6375 -1.5847 (-0.3370) -0.0223 -1.4558 -0.4257 (-0.1136) (-0.8271) (-2.4104) -2.592
0.5718*** 0.0456 0.2419** -0.3329***-4.9984 -0.4925 -2.0053 (-3.0321)
1.0814*** 1.1243*** 1.8583*** 4.0337*** 0.1002 0.1341 0.9962*** 2.6540*** 0.4917*** 0.5366*** 0.3280** 0.7830* -0.0518 0.0069 1.3138*** 2.7486***-9.0094 -9.612 -14.314 -10.6966 -0.9148 -1.2377 -6.1527 -5.0009 -3.823 -4.1397 -2.2926 -1.8944 (-0.4409) -0.0618 -7.9318 -5.3378
1.0240*** 1.7365*** -0.0655 3.0036***-9.9389 -9.2484 (-0.5903) -17.2265
0.6115*** 0.6145*** 0.6371*** 0.8761*** 0.0222 0.0208 0.2003 0.8567*** 0.3904** 0.4043*** 0.8366*** 0.5805*** -0.1118 -0.1211 -0.1689 1.2000***-4.068 -4.0852 -5.2957 -3.7549 -0.2633 -0.2463 -1.4014 -3.6552 -2.4872 -2.5876 -6.6442 -2.6344 (-1.2367) (-1.3435) (-1.2041) -5.2298
0.0761 -0.0774 0.3505*** -0.5054***-0.8927 (-0.4128) -4.0028 (-2.9255)
1.0667*** 1.2085*** 2.2613*** 0.4835 0.3326** 0.3074** 2.0131*** 0.5524 0.5491*** 0.5955*** 1.8090*** 1.4059 0.1591 0.1162 1.4101*** -0.2045-6.3185 -6.9475 -10.961 -0.5126 -2.2998 -2.0955 -9.6548 -0.5761 -3.2345 -3.2793 -7.8423 -1.3817 -1.0327 -0.6957 -6.3802 (-0.2131)
1.3904*** 2.0905*** 1.4132*** 1.5990***-9.2445 -11.3596 -8.1268 -8.1849
-0.8572*** -0.8851*** -0.2160*** 0.0625 -0.1310* -0.1413** -0.6552*** 0.1431 -0.8317*** -0.8195*** -0.5641*** -0.2063 0.0233 0.0151 -0.5575*** 0.0861(-8.6165) (-8.6825) (-2.6108) -0.2638 (-1.8900) (-2.0649) (-7.8734) -0.6485 (-8.2558) (-7.9769) (-6.9968) (-0.8928) -0.305 -0.196 (-6.5150) -0.3756
0.1818*** -1.1849*** -0.2366*** -1.2181***-2.5837 (-12.4369) (-3.3049) (-12.1961)
-0.4913*** -0.7048*** -0.3894** -0.0804 0.0973 0.2105 -0.0833 -0.3949 -0.3092** -0.253 -0.0244 -0.6475 0.1158 0.2606 -0.0666 -0.3413(-3.4588) (-3.7152) (-2.0465) (-0.1888) -1.0416 -1.2706 (-0.3585) (-0.9101) (-2.2711) (-1.3618) (-0.1258) (-1.6270) -1.1803 -1.5136 (-0.2364) (-0.8305)
-0.0519 -2.9506*** 0.2551* -3.1447***(-0.3452) (-6.5760) -1.7529 (-8.1606)
0.1298 0.2126 0.7744*** 0.0586 0.2561* 0.2619* 1.2069*** -0.2768 0.3688 0.4523* 0.5706*** 0.0302 0.2763* 0.2766* 1.5510*** -1.9942*-0.5732 -0.8218 -4.8731 -0.0778 -1.804 -1.7948 -7.0097 (-0.2493) -1.5725 -1.7257 -3.3977 -0.0396 -1.8123 -1.8422 -8.6985 (-1.7785)
0.7511*** 4.9141*** 0.4833*** 6.6312***-4.9756 -14.718 -2.9816 -23.2175
Asia All Asia
TFI (h)
Manufacture Agriculture Agriculture
All Asia All
TFI (i)
TFI (j)
TFI (l)
Manufacture
All
TFI (a)
TFI (b)
TFI (c)
TFI (d)
TFI (e)
TFI (f)
Asia
TFI (g)

TAD/TC/WP(2012)24
77
Table 17. Latin America and the Caribbean – All sectors
Note: Fixed effects for year and sector are included but not reported. Robust standard errors clustered by country pair. p for Poisson. Significance levels are: ***=1%, **=5%, *=10%. Values for R2 range between 58-64%.
Sector
Importer sample
Exporter sample
reg1p reg2p reg3p reg3bisp reg1p reg2p reg3p reg3bisp reg1p reg2p reg3p reg3bisp0.4726*** 0.3218*** 0.0186* 1.8243*** 0.706** 0.6030** 0.1328* 2.7001*** 0.1549 0.1975 0.3785** 0.5242(-3.3643) (-6.436) (-0.3724) -5.2569 -2.1819 -2.2539 -1.7345 -2.7708 -0.7712 -0.948 -2.0513 -0.5473
0.0226 -0.3857* 0.3402*(-0.2818) (-1.9595) -1.9298
-0.1160** -0.0871 0.4773*** 0.1959 0.3580** 0.3639** 0.5058*** 2.3761*** -0.1369 -0.0826 0.3086* 0.2061(-2.1227) (-1.5660) -7.9414 -1.5197 -2.1378 -2.1256 -7.3636 -6.8485 (-1.0648) (-0.6159) -1.9213 -0.7118
0.5879*** 0.2149 0.3613***-10.4225 -0.8373 -2.5929
0.2283*** 0.2471*** 0.6364*** 0.2164** 0.2276* 0.2447** 0.7305*** 1.0353*** 0.3323*** 0.2373* 0.3832** 0.2048-4.5123 -4.5359 -8.9947 (-2.0842) -1.9093 -2.0152 -8.7538 -2.7361 -2.8096 -1.9023 -2.0924 -0.9843
0.4097*** 0.0466 -0.0838-7.382 -0.272 (-0.6416)
0.023 0.0469 0.2828*** 0.7950*** -0.0805 -0.0821 0.4985*** 3.3183*** -0.3614* -0.3446 -0.1333 0.4861-0.2612 -0.5122 -3.1037 -2.6296 (-0.6869) (-0.6984) -4.9162 -4.5589 (-1.7963) (-1.6289) (-0.5681) -0.6982
0.3232*** -0.0299 0.1595-3.5823 (-0.0886) -0.7754
0.2077** 0.7160*** 1.1432*** -0.3536 -0.0351 -0.0176 0.9172*** 4.1933*** 1.2177*** 1.1626*** 1.4039*** -1.3017-4.1549 -6.8394 -11.9428 (-0.8579) (-0.2636) (-0.1287) -9.141 -7.1736 -6.3244 -5.3902 -5.3091 (-0.7348)
0.8085*** 0.4454 0.7896***-9.7374 -1.0659 -2.8305
0.6703*** 0.2423** 0.4583*** 1.4572*** 0.1468 0.1551 0.6914*** 1.4637*** 0.0003 0.1197 0.5843** 1.1808-7.1212 -2.4661 -4.7719 -4.763 -0.8989 -0.9413 -6.4498 -2.7224 -0.0013 -0.5014 -2.1433 -1.3707
0.3135*** 0.1955 0.7069***-4.1955 -0.5953 -2.9554
-0.2656*** -0.2627*** 0.0358 1.0277*** 0.6037*** 0.6063*** 0.0447 3.1531*** -0.1759 -0.1803 0.6426*** 1.1706***(-4.9221) (-4.8568) -0.5572 -8.1711 -3.637 -3.6457 -0.604 -9.6766 (-1.1744) (-1.1005) -3.0026 -4.578
0.0688 0.3015 -0.0111-1.1183 -1.5069 (-0.0720)
0.7575*** 0.4492*** 1.2058*** 5.2850*** 0.3289* 0.3311* 1.9336*** 7.1951*** 0.8946*** 1.2175*** 0.9714** 2.0714-4.9184 (-3.0849) -7.9032 -7.2325 -1.8568 -1.8589 -12.084 -5.2383 (-2.9056) (-3.3046) (-2.2990) (-1.0748)
1.4099*** -0.0157 0.0189*-12.5134 (-0.0486) (-0.378)
-0.1188** -0.1474*** -0.1204** 0.1675 0.2018* 0.2190** -0.061 1.4251*** -0.1304 -0.2167* -0.3164** -0.1334(-2.3155) (-2.8168) (-2.2615) -1.1003 -1.8733 -2.0336 (-1.0485) -3.747 (-1.1299) (-1.8541) (-2.3012) (-0.3554)
-0.0089 0.0601 -0.1608(-0.1837) -0.3013 (-1.2758)
-0.08 -0.1107 -0.1042 0.0898 -0.0298 -0.0418 0.2201* 0.2053 0.1193 0.3516** 0.3213 0.1987(-1.4048) (-1.5544) (-1.0444) -0.5168 (-0.2183) (-0.2952) -1.9537 -0.5825 (-0.9380) (-2.2935) (-1.2760) -0.5728
-0.0157 -0.1241 -0.0493**(-0.2185) (-0.8737) (-0.986)
0.2356** 0.8136*** 1.0349*** 0.1308 0.2385 0.2685 1.0294*** 4.4344*** 1.3770*** 1.2518*** 1.2745*** -2.5808-2.4177 -4.8736 -8.8988 -0.2215 -1.119 -1.2554 -7.7051 -6.9218 -4.1831 -3.3175 -3.7947 (-1.3316)
0.8137*** 0.7519 0.7402*-7.2817 -1.3155 -1.9427
All LAC LAC
All All All
LAC All LAC
TFI (g)
TFI (h)
TFI (i)
TFI (j)
TFI (l)
TFI (f)
TFI (a)
TFI (b)
TFI (c)
TFI (d)
TFI (e)

TAD/TC/WP(2012)24
78
Table 18. Latin America and the Caribbean – Manufacture and agriculture
Note: Robust standard errors clustered by country pair. p for Poisson. Significance levels are: ***=1%, **=5%, *=10%. Values for R2 range between 55-66%.
Sector
Importer sample
Exporter sample
reg1p reg2p reg3p reg3bisp reg1p reg2p reg3p reg3bisp reg1p reg2p reg3p reg3bisp reg1p reg2p reg3p reg3bisp0.146*** 0.1545* 0.1199*** 1.0347*** 0.7284* -0.0419 -0.0326 3.4023*** 0.0708 0.0608 0.1196 1.6467*** -0.1528 -0.1148 0.5727*** 1.1629***-2.9211 -1.5473 -2.3982 -2.5947 -1.6465 (-0.4289) (-0.3832) -2.79 (-0.7309) (-0.6163) (-1.3795) -4.2895 (-1.3992) (-1.0305) -5.7629 -2.732
0.0165* -0.0202 -0.1384 0.9553***(-0.1631) (-0.2196) (-1.5749) -9.1059
0.025 0.0798 0.7803*** -0.044 0.3462 0.1808*** 0.3228*** 3.4032*** -0.0367 -0.027 0.6682*** -0.0077 0.1956*** 0.2568*** 0.8497*** -0.2247-0.3461 -1.0806 -9.8527 (-0.2752) -1.5384 -2.7225 -4.1438 -7.8218 (-0.5304) (-0.3812) -8.536 (-0.0559) -2.7815 -3.1916 -8.9294 (-1.3903)
0.7689*** 0.1115 0.7792*** 0.8402***-10.1674 -1.4571 -11.3543 -9.3955
0.2894*** 0.3614*** 0.8659*** 0.3950*** 0.3279** 0.1261* 0.5105*** 2.0007*** -0.0064 0.0036 0.3424*** -0.2151* 0.1608** 0.2234*** 1.1148*** 0.4654***-4.4282 -5.3123 -9.943 (-3.1946) -2.0346 -1.9339 -5.6431 -4.6419 (-0.0963) -0.0485 -3.7087 (-1.7603) -2.2264 -2.8955 -10.2201 (-3.2285)
0.5230*** 0.4337*** 0.4087*** 1.0053***-7.5786 -6.0299 -5.9692 -11.4034
-0.0293 0.0103 0.3952*** -0.1053 -0.1723 0.1115 0.5244*** 5.1095*** 0.1375 0.1596 0.3944*** 0.4381 0.0899 0.1317 0.5147*** 0.7698*(-0.2679) -0.0894 -3.5061 (-0.3169) (-0.8784) -1.0117 -4.5134 -5.4261 -1.2811 -1.4094 -3.5444 -1.2532 -0.7441 -1.0472 -3.8492 -1.89
0.5148*** 0.6093*** 0.4019*** 0.5950***-4.611 -5.2876 -3.836 -4.3318
0.3864*** 0.7737*** 1.4690*** -1.8799*** -0.0231 0.3561*** 0.9568*** 6.7151*** 0.4568*** 0.4721*** 0.9909*** 0.2033 0.6494*** 0.4087*** 1.1173*** -1.0124*-3.8104 -5.5645 -11.1835 (-3.9700) (-0.1045) -3.9291 -8.7303 -7.9193 -3.8156 -3.3824 -7.7358 -0.3881 -5.2448 -3.286 -7.4683 (-1.7355)
1.1360*** 1.3878*** 0.7592*** 1.6536***-9.93 -10.535 -6.8159 -9.3853
0.343*** 0.0546 0.9415*** 2.5391*** 0.0762 0.2353*** 0.6700*** 1.4199* 0.165 0.1673 0.1674 0.6503* 0.2150** 0.2279** 0.4988*** 1.4198***-6.8632 -0.4413 -7.6916 -6.5015 -0.3321 -2.668 -5.6189 -1.8484 -1.3796 -1.3779 -1.3567 -1.6596 -2.0628 -2.0952 -3.4594 -3.0957
0.8679*** 0.7899*** 0.0907 0.5067***-9.0387 -6.2487 -0.9409 -3.0498
0.4129*** -0.1007 0.1714** 0.7919*** 1.2864*** -0.116 -0.1760** 4.7236*** -0.2563*** -0.2430*** 0.2231*** 0.8235*** -0.1763** -0.1578* 0.4936*** 0.9971***-8.6831 (-1.3222) -2.0013 -4.9545 -5.2399 (-1.5898) (-2.1513) -12.3643 (-3.6119) (-3.4251) -2.6334 -5.7018 (-2.0455) (-1.8340) -5.0129 -6.5212
0.0466 -0.4586*** 0.2803*** 0.3716***-0.5758 (-6.6494) -3.7766 -4.6859
0.6121*** 0.4686*** 1.6480*** 4.6880*** 0.2379 0.6394*** 1.9457*** 9.1130*** 0.4723*** 0.5148*** 1.3527*** 5.4184*** 0.5097*** 0.5046*** 3.0289*** 3.4162***(-3.5241) (-2.6616) -8.1336 -4.8502 -0.9262 -4.931 -10.9017 -5.2699 (-2.6470) (-2.6916) -6.6245 -5.3849 -3.5751 -3.2211 -12.9108 -2.7467
1.8383*** 1.9805*** 1.6049*** 4.0445***-12.0078 -12.011 -10.6131 -20.1212
-0.1660** -0.1813*** -0.0531 -0.041 0.3327** 0.0308 0.0787 2.3445*** -0.1765*** -0.2004*** -0.2746*** 0.3400* 0.0958 0.0923 -0.0364 0.1383(-2.5672) (-2.7089) (-0.7746) (-0.2140) -2.2174 -0.506 -1.1688 -4.8666 (-2.7603) (-3.0296) (-4.2743) -1.8167 -1.387 -1.2729 (-0.4906) -0.6076
0.1252** 0.0992 -0.1904*** -0.1257*-1.9727 -1.4563 (-3.2353) (-1.6665)
0.2548*** 0.2640*** 0.2301** 0.0172 -0.0305 -0.0593 0.4111*** 0.6485 -0.1055 0.2050** -0.1963 0.2272 -0.0697 0.2333** 0.6147*** -0.0579(-3.5476) (-3.1731) (-2.0545) -0.0835 (-0.1459) (-0.6646) -3.5509 -1.4548 (-1.4764) (-2.1725) (-1.5281) -0.9897 (-0.7919) (-2.0201) -4.0289 (-0.1750)
-0.0214 0.5305*** -0.0534 0.9619***(-0.2563) -5.8213 (-0.5623) -8.1082
0.1029*** 0.9123*** 1.2265*** -2.5181*** 0.5349* 0.3820*** 0.7828*** 7.1054*** 0.6719*** 0.6145*** 1.0468*** -0.0168 0.5522*** 0.5806*** 1.3869*** -0.4702(-2.058) -4.5478 -8.4463 (-4.2473) -1.7192 -2.8448 -5.301 -8.9003 -3.3097 -2.6871 -6.8025 (-0.0237) -4.1049 -3.6155 -7.4757 (-0.5374)
0.9916*** 1.1555*** 0.9444*** 2.2886***-6.9731 -4.9954 -6.7643 -7.6293
TFI (i)
TFI (j)
TFI (l)
TFI (c)
TFI (d)
TFI (e)
TFI (f)
TFI (g)
TFI (h)
TFI (b)
Manufacture Manufacture Agriculture Agriculture
LAC All LAC All
All LAC All LAC
TFI (a)
TAD/TC/WP(2012)24
79
Table 19. Eastern Europe non-OECD and Central Asia – All sectors
Note: Fixed effects for year and sector are included but not reported. Robust standard errors clustered by country pair. p for Poisson. Significance levels are: ***=1%, **=5%, *=10%. Values for R2 range between 59-61%.
Sector
Importer sample
Exporter sample
reg1p reg2p reg3p reg3bisp reg1p reg2p reg3p reg3bisp reg1p reg2p reg3p reg3bisp
0.3011** 0.6775*** 0.0689 0.6017 0.0448 0.041 0.1249 1.1677* 0.2169** 0.2242 0.1849 0.2206
-2.2426 -4.4512 (-0.7582) -1.3213 (-0.3831) (-0.3526) -1.1227 -1.8944 -1.263 -1.2808 -0.9764 (-0.1932)
0.3751*** 0.5498*** 0.0897
(-7.502) -3.9435 -0.4343
0.1701** 0.1786** 0.6683*** -0.2872 0.4014*** 0.3964*** 0.3571*** -0.0862 0.2138*** 0.1897** 0.1368* -0.2484
-2.4765 -2.5411 -9.7667 (-1.4691) -5.6611 -5.2029 -4.5755 (-0.4522) -2.6448 -2.3477 -1.7113 (-0.7452)
0.7611*** 0.1517* 0.0751
-10.6423 -1.8596 -0.7518
0.2050** 0.1912** 0.6573*** 0.325 0.5431*** 0.5199*** 0.4870*** 0.1463 0.1858* -0.161 0.2135** 0.0094
-2.3867 -2.0571 -9.3865 -1.3038 -7.608 -6.9507 -6.2799 -0.5855 (-1.8466) (-1.5553) (-2.1265) -0.0191
0.6969*** 0.2563** -0.1723
-10.2597 -2.5309 (-1.5897)
-0.2165 -0.196 0.0725 1.6112*** -0.061 -0.0315 -0.1475 3.4765*** -0.5225***-0.5524*** -0.6185**2.6218***
(-1.3386) (-1.1496) -0.6217 -3.758 (-0.5557) (-0.2771) (-1.1002) -6.0054 (-5.0405) (-5.2358) (-6.3299) -5.8876
0.1179 -0.3461* -0.5010***
-1.1903 (-1.8101) (-5.2833)
-0.2263***-0.2349***0.2707*** -0.3231 0.5227*** 0.5381*** 0.2167** 0.0313 -0.1352 -0.119 -0.1805* 0.0159
(-2.9814) (-2.7820) -2.9424 (-0.9323) -5.2985 -5.0511 -2.1817 -0.0979 (-1.4537) (-1.1895) (-1.9043) -0.0264
0.7256*** -0.1418 -0.1432
-6.8739 (-1.5341) (-1.3819)
0.5654*** 0.1132*** 0.3696***0.6048** 0.1597 0.1746* 0.4695*** 0.6973** -0.2977***-0.3272*** -0.0796 0.3113
-3.8054 -2.264 -3.4319 -2.087 -1.6185 -1.7095 -4.0725 -2.2825 (-2.7144) (-2.8859) (-0.5747) -0.8483
0.3620*** 0.5553*** 0.1126
-3.8361 -5.1606 -1.0287
0.0794 0.0791 0.098 0.016 0.1593** 0.1596** 0.2378** 0.4812** 0.1132 0.1228 0.2101** 0.8160**
(-0.9095) (-0.9061) (-1.1096) -0.0854 (-2.0446) (-2.0479) (-2.4893) -2.1878 (-1.2010) (-1.2950) (-2.0283) -2.5003
0.0207 -0.0309 -0.2144**
-0.2807 (-0.3117) (-2.2376)
0.7877*** 0.3251** 1.6417***1.8406** 0.6737*** 0.7053*** 1.6173*** 2.0988*** 0.3588*** 0.3165** 0.5665*** 0.666
(-2.7371) -2.3459 -9.8265 -2.4769 -4.7179 -4.537 -9.3393 -2.9126 -2.5907 -2.2249 -2.7002 (-0.8081)
1.6238*** 1.5007*** 0.3905**
-10.8268 -9.5676 -2.5388
-0.0157 -0.0209 -0.0892 -0.1172 -0.0241 -0.026 -0.1278** 0.1285 0.0742 0.0928 0.0309 -0.1759
(-0.2397) (-0.3068) (-1.5304) (-0.6741) (-0.3611) (-0.3893) (-1.9674) -0.662 -1.0781 -1.3193 -0.4192 (-1.0830)
-0.0745 -0.2008*** 0.0095
(-1.2760) (-2.8257) -0.1592
0.0522 0.1146 -0.0402 -0.1469 -0.1447* -0.1785 0.0054 -0.132 0.0155 0.0109 0.0065 -0.2238
-0.6893 -1.1754 (-0.3107) (-0.6777) (-1.7810) (-1.6384) -0.0337 (-0.5147) -0.2322 -0.1552 -0.0628 (-1.2321)
-0.0667 0.3391*** 0.0661
(-0.7494) -2.8313 -0.9233
0.1651*** 0.6711** 0.1031 0.7725 0.5711*** 0.0729 0.5110*** 2.3447** 0.1698 0.1626 -0.0565 0.6603
-3.302 (-2.2677) -1.0807 -0.9672 -4.627 -0.5862 -3.2056 -2.2071 -1.3387 -1.2799 (-0.5047) -1.2765
0.7430*** 0.0786 -0.2484**
-5.2268 (-0.8556) (-2.2862)
TFI (j)
TFI (l)
TFI (d)
TFI (e)
TFI (f)
TFI (g)
TFI (h)
TFI (i)
TFI (c)
All All All
EAC All EAC
All EAC EAC
TFI (a)
TFI (b)

TAD/TC/WP(2012)24
80
Table 20. Eastern Europe non-OECD and Central Asia – Manufacture and agriculture
Note: Robust standard errors clustered by country pair. p for Poisson. Significance levels are: ***=1%, **=5%, *=10%. Values for R2 range between 48-67%.
Sector
Importer sample
Exporter sample
reg1p reg2p reg3p reg3bisp reg1p reg2p reg3p reg3bisp reg1p reg2p reg3p reg3bisp reg1p reg2p reg3p reg3bisp0.2524*** 0.2569 0.0007 0.7751 0.0258 0.0255 -0.0626 0.6487 0.0228 -0.0208 0.149 1.0452* 0.1206 0.1145 0.1991* 1.5527**
-5.0429 -1.6403 (-0.0061) -1.3779 -0.1897 -0.1872 (-0.4852) -0.9129 (-0.1350) (-0.1206) -1.354 (-1.8454) (-0.9411) (-0.9008) -1.5962 -2.26245.08 0.0796 -0.0492 0.2512** 0.8896***
(-0.6791) 15.502 (-0.2741) -2.3372 -5.68870.2683*** 0.2850*** 0.7901*** -0.4267*0.4141*** 0.4118*** 0.1882** 0.3259 0.1053 0.1144 0.8850*** -0.4365* 0.2730*** 0.2383*** 0.3284*** -0.3263
-3.1362 -3.2448 -9.324 (-1.7765) -4.9267 -4.5866 -2.0198 -1.3562 -1.0798 -1.14 -9.3459 (-1.7130) -3.2796 -2.675 -3.5686 (-1.4824)0.8469*** -0.2417** 1.0761*** 0.3708***
-9.5751 (-2.3143) -10.9542 -3.89070.1768 0.158 0.7854*** 0.45930.5803*** 0.5799*** 0.7004*** -0.3242 0.163 0.1474 0.7392*** 0.075 0.4681*** 0.4434*** 0.3700*** 0.1695
-1.62 -1.3305 -9.4087 -1.4906 -7.002 -6.6919 -7.6463 (-1.1650) -1.5276 -1.2978 -7.7927 -0.2589 -5.5795 -4.9338 -3.9765 -0.63530.8540*** 0.7501*** 0.8205*** 0.1372-10.6208 -6.8641 -8.7563 -1.1214
-0.092 -0.0669 0.6176*** 0.7062 -0.0152 0.0175 -0.0171 3.4163*** -0.1415 -0.0741 -0.0193 0.4486 -0.1445 -0.1124 -0.2174 3.9020***(-0.4444) (-0.3081) -4.1112 -1.2875(-0.1184) -0.1346 (-0.1057) -5.3753 (-0.6923) (-0.3363) (-0.1217) -0.7993 (-1.1741) (-0.8787) (-1.4110) -5.9613
0.6163*** -0.2425 -0.03 -0.2465-4.8378 (-1.0819) (-0.2211) (-1.0884)
-0.2779*** -0.2935*** 0.4263*** -0.50270.4130*** 0.4183*** 0.0262 0.528 -0.3490*** -0.3456*** 0.1161 -0.3293 0.4665*** 0.4468*** 0.0362 -0.0459(-2.9987) (-2.9250) -3.8357 (-1.2659) -3.5736 -3.3979 -0.234 -1.3648 (-3.3847) (-2.8975) -0.9183 (-0.7263) -3.9013 -3.4761 -0.2957 (-0.1218)
1.0424*** -0.3662*** 0.5938*** -0.2519**-8.1988 (-3.5371) -4.1503 (-2.2279)
0.3111*** 0.0587 0.8698*** 1.3056*** 0.0354 0.2969*** 0.7765*** 1.2126*** 0.2057* 0.2172* 0.5065*** 0.7952** 0.0009 0.0368 0.4360*** 0.4811-2.7305 -0.4909 -6.7001 -3.8189 -0.2961 -2.6017 -5.9273 -3.5523 -1.6543 -1.7238 -3.454 -2.0049 -0.0073 -0.3082 -3.293 -1.366
0.9846*** 0.8311*** 0.4278*** 0.7450***-9.078 -6.7871 -3.2453 -6.1688
0.0582 0.0586 0.0329 0.1516 0.097 0.1001 0.3694*** 0.6156** 0.0645 0.0577 0.3674*** 0.8512*** 0.1302 0.1288 0.0741 0.4437*-0.5254 -0.5289 (-0.2936) (-0.6144) (-1.0506) (-1.0845) (-3.2412) -2.358 (-0.5630) (-0.5051) -3.2209 (-3.5962) (-1.4558) (-1.4407) (-0.6606) -1.8287
0.0286 -0.3667*** 0.4954*** 0.1643-0.303 (-2.9564) -5.3609 -1.4202
0.4590*** 0.4415** 2.0860*** 2.7770***0.6804*** 0.6866*** 1.5130*** 1.7796** 0.2584 0.3212 2.1082*** 1.5723 0.4963*** 0.5440*** 1.6922*** 1.8291**-2.6935 -2.5788 -10.0927 -3.0885 -4.0591 -3.8943 -7.5412 -2.2583 -1.4222 -1.6191 -9.0318 -1.6394 -2.8656 -2.9342 -8.0256 -2.1792
1.9862*** 1.3565*** 2.1622*** 1.8910***-11.0025 -7.0963 -10.6423 -10.2424
0.0902 0.0857 0.0926 0.2139 0.082 0.0792 -0.0806 0.2239 0.0568 0.0509 -0.1781** -0.5770*** 0.0243 0.0213 -0.1511** 0.1303-1.1313 -1.0326 -1.2535 -0.9198 -1.0759 -1.0397 (-1.0682) -1.0068 -0.6446 -0.5555 (-2.3855) (-2.7064) -0.3248 -0.2855 (-2.0637) -0.587
0.086 -0.2951*** -0.2118*** -0.3070***-1.1293 (-3.6405) (-2.8994) (-3.6853)
-0.0555 0.0724 -0.1419 -0.1948 -0.1538* -0.0837 0.0021 -0.3064 0.1112 0.182 -0.0661 -0.2127 -0.0665 -0.1136 0.0709 -0.1046(-0.6035) -0.6606 (-1.0083) (-0.7346) (-1.6638) (-0.7135) -0.012 (-1.0977) -1.0916 -1.2846 (-0.3584) (-0.6565) (-0.7112) (-0.9201) -0.3757 (-0.3343)
-0.1156 0.2625* -0.1677 0.3463**(-1.0840) -1.9628 (-1.3188) -2.4135
0.192** 0.4373 1.2237*** 0.54530.5371*** 0.5657*** 0.2774 3.2733*** 0.6329 0.4254 0.7102*** -0.7614 0.6097*** 0.7608*** 0.5268*** 3.5436***-3.842 (-1.2277) -6.7216 (-1.5186) -3.6606 -3.2128 -1.4562 -3.0391 (-1.6181) (-0.9595) -3.3578 (-0.6792) -4.3 -4.2262 -2.7399 -2.8517
1.3569*** -1.4055*** 0.7910*** -0.6712-8.0335 (-3.6714) -3.8534 (-1.6017)
TFI (i)
TFI (j)
TFI (l)
TFI (c)
TFI (d)
TFI (e)
TFI (f)
TFI (g)
TFI (h)
TFI (b)
Manufacture Manufacture Agriculture Agriculture
EAC All EAC All
All EAC All EAC
TFI (a)

TAD/TC/WP(2012)24
81
Table 21. APEC – All sectors
Note: Fixed effects for year and sector are included but not reported. Robust standard errors clustered by country pair. p for Poisson. Significance levels are: ***=1%, **=5%, *=10%. Values for R2 range between 61-62%.
Sector
Importer sample
Exporter sample
reg1p reg2p reg3p reg3bisp reg1p reg2p reg3p reg3bisp reg1p reg2p reg3p reg3bisp
0.7777*** 0.7834*** 0.6234*** 0.5071* -0.0505 -0.047 0.2669*** 0.6699*** 1.1914*** 1.2396*** 1.0874*** 0.1886
-7.2743 -7.3404 -7.3891 -1.8567 (-1.6437) (-1.5309) -7.5379 -9.4161 -4.8037 -5.0071 -5.234 -0.2256
0.2535*** 0.2339*** 0.5456**
-3.4038 -7.3226 -2.424
1.0894*** 1.0811*** 0.7891*** 1.2335*** 0.0284 0.0296 0.0184 1.8133*** 1.0710*** 1.2274*** 1.6551*** 2.6804***
-9.5908 -9.3638 -7.5035 -3.1269 (-0.6663) (-0.6805) (-0.4811) -11.0891 -3.4226 -4.0032 -5.3535 (-2.6903)
0.1715 0.0184 1.5276***
-1.6211 -0.4568 -5.7567
0.0585 0.1108 0.3354*** 0.5268** 0.2307*** 0.2635*** 0.8066*** -0.4329*** 0.0459 -0.032 0.147 -0.3004
-0.5277 -0.9055 -3.5365 -2.4218 -8.6259 -9.1092 -21.7349 (-6.8225) (-0.1599) (-0.1091) -0.5369 (-0.4244)
0.2131*** 0.7162*** 0.4607**
-2.989 -22.374 -2.1023
0.8778*** 0.9086*** 0.6723*** 0.2683 0.1506*** 0.1563*** 0.6564*** -0.1506** 1.5636*** 1.7065*** 1.8528*** 2.6898**
-7.9078 -7.9096 -8.656 -0.9069 -5.5533 -5.5007 -20.461 (-2.2788) -6.006 -6.9305 -8.0023 -2.5449
0.4470*** 0.6857*** 1.4807***
-6.3663 -22.1659 -5.349
0.0008 0.0251 0.2982*** 0.3031 0.2351*** 0.2452*** 0.6896*** -0.137 0.3824* 0.2785 0.2413 1.6727**
(-0.0090) -0.2403 -3.1183 -0.7547 -6.3019 -5.7657 -14.9246 (-0.8983) -1.7282 -1.484 -1.5975 -2.521
0.4300*** 0.7025*** 0.1047
-4.2013 -14.8562 -0.6938
1.0297*** 1.0990*** 2.1651*** 1.4688* 0.5099*** 0.5545*** 1.9796*** 2.5747*** 1.7224*** 1.7721*** 2.8778*** 1.3926
-7.4237 -7.5557 -12.1662 -1.7156 -9.4507 -9.696 -26.4449 -7.1316 -5.3745 -5.6053 -7.711 (-0.6421)
1.4361*** 1.7153*** 1.6372***
-10.5303 -28.6101 -5.3628
1.2524*** 1.2814*** 1.5110*** 3.1096*** 0.2047*** 0.2149*** 0.4921*** 1.3106*** 1.9228*** 2.0095*** 2.1641*** 4.0077***
-13.1465 -13.4538 -13.802 -10.1475 -5.3231 -5.5318 -9.9817 -8.6319 -9.7622 -10.2288 -9.056 -5.809
0.6446*** 0.3698*** 0.7659***
-7.1858 -8.9027 -3.4494
1.2320*** 1.1198*** 0.6550*** 1.6521*** 0.026 0.0309 0.2998*** 1.5599*** 0.557 0.497 0.3897 1.4888
-7.1204 -6.4125 -5.8599 -3.5363 -0.5891 -0.6617 -6.5368 -11.0717 -1.2424 -1.1025 -1.0899 -1.3795
0.3500*** 0.3436*** 0.1748
-3.2825 -7.4801 -0.4317
-0.4862*** -0.5198*** -0.2878*** 0.3948* 0.0226 0.0205 -0.0971*** 0.2020*** -0.7580*** -1.0132*** -1.0602*** -0.8058
(-5.3274) (-5.4790) (-3.9101) -1.6606 -0.8985 -0.7895 (-3.5573) -2.621 (-3.3061) (-4.2896) (-4.4891) (-1.0238)
-0.0841 -0.1438*** -0.7407***
(-1.3200) (-5.4043) (-3.4448)
-0.2868*** -0.3087*** -0.2309* 0.1097 -0.0074 -0.0159 -0.0796 0.2698** 0.1265 0.0737 -0.5070** -0.3581
(-3.7604) (-3.1151) (-1.9486) -0.4999 (-0.2270) (-0.3901) (-1.4992) -2.4992 -0.8332 -0.4661 (-2.5185) (-1.0036)
0.0004 -0.1031** -0.5206***
-0.0044 (-2.4775) (-3.8203)
0.2216 0.1629 0.5826*** 1.9979*** 0.4822*** 0.5144*** 0.7672*** 0.5659** 0.5766 0.6673 1.1486*** 0.5877
-1.2871 -0.8517 -4.8865 -4.0621 -9.4385 -8.9776 -14.6513 -2.5664 -1.2421 -1.4753 -3.3654 -0.6009
0.6523*** 0.7409*** 1.5011***
-5.1918 -12.1904 -4.1376
APEC APEC
TFI (g)
TFI (h)
All All
APEC All APEC
TFI (i)
TFI (j)
TFI (l)
All
TFI (a)
TFI (b)
TFI (c)
TFI (d)
TFI (e)
TFI (f)
All

TAD/TC/WP(2012)24
82
Table 22. ECOWAS – All sectors
Note: Fixed effects for year and sector are included but not reported. Robust standard errors clustered by country pair. p for Poisson. Significance levels are: ***=1%, **=5%, *=10%. Values for R2 range between 54-60%.
Sector
Importer sample
Exporter sample
reg1p reg2p reg3p reg3bisp reg1p reg2p reg3p reg3bisp reg1p reg2p reg3p reg3bisp
0.1806 0.1726 0.0602 0.1506 0.0896 0.0887 0.0321 0.2009 0.2427 0.1921 0.4743 0.7261
(-1.5396) (-1.4373) -0.507 (-0.4514) -0.803 -0.7957 (-0.3316) -0.8313 (-0.4873) (-0.3858) -0.8531 -0.959
0.3404*** 0.095 0.4746
-2.9189 (-1.1769) -1.3005
0.5756*** 0.6335*** 0.9358*** -0.2692** 0.1567** 0.1568** 0.2178** 0.0091 1.3975*** 1.3873*** 1.3710** -1.1155**
-5.9958 -6.1628 -7.4391 (-2.0843) -2.3836 -2.3855 -2.2235 -0.0819 -4.3037 -4.1955 -2.1889 (-2.3625)
0.2765*** 0.0111 -0.0837
-3.8188 -0.1298 (-0.3181)
0.6107 0.6523 -0.7079 0.1589 0.0314 0.0285 0.3953 -0.029 1.055 0.067 -0.7565 -1.5959
(-5.9462) (-5.6357) (-4.0982) -0.9351 -0.4439 -0.3063 (-2.6788) (-0.2253) (-3.5159) -0.0454 (-0.7666) (-1.3766)
0.1271 0.2555** 1.3783
-1.0982 (-2.5542) -0.8479
0.2803 0.323 0.2546 1.1040** 0.2916** 0.4832** 0.0531 -0.5211 1.2716 1.1314** 1.1099 0.0822
(-1.2087) (-1.2134) -1.055 (-1.9866) -2.0002 -2.1645 (-0.2766) (-0.8907) (-1.6147) (-2.2063) (-0.7007) -0.0871
0.7228*** -0.5273** 0.7427
-2.8604 (-2.5730) -1.3605
0.7126*** 0.8529*** 0.3557** -0.2277 0.0685 0.0658 -0.2036 0.2075 0.9359* 0.9899* 0.5351 -4.2430*
-3.9598 -4.1388 -1.9854 (-0.5390) -0.6641 -0.5139 (-1.0746) -0.3812 -1.9853 -1.8065 -0.6648 (-1.9973)
-0.0208 -0.4684* 0.0196
(-0.1671) (-1.7617) -0.0294
1.7196*** 1.7199*** 1.3837*** -0.0239 -0.066 -0.0665 0.5679*** 0.0661 2.8529*** 2.9601*** 4.4899*** -3.4854***
-11.1432 -11.1602 -7.6899 (-0.1532) (-0.8555) (-0.8647) -3.6751 -0.4502 -5.8888 -5.9656 -4.7671 (-4.5644)
-0.1390* 0.7268*** 0.9405*
(-1.6791) -4.8843 -1.7568
0.5965*** 0.5960*** 0.8137*** 1.2206*** -0.0273 -0.0245 0.2018* 0.1523 0.8435*** 0.9024*** 0.9330* -1.8412
-6.4128 -6.3313 -6.3869 -3.3223 (-0.2582) (-0.2333) -1.711 -0.4337 -2.6271 -2.7843 -1.9235 (-1.3755)
0.2722** 0.2457*** 0.4321
-2.3166 -2.5813 -1.2709
0.4438* 0.6787*** 1.7241*** -0.541 0.3574** 0.4438*** 1.5347*** 0.9586 -0.6449 -0.1447 1.1878 -9.5771
-1.843 -2.6295 -6.3792 (-0.3839) -2.5373 -2.9573 -6.1703 -0.6953 (-0.8122) (-0.1639) -0.862 (-1.0353)
1.0507*** 1.8213*** 1.5646*
-6.5018 -7.1437 -1.8378
0.3285*** 0.3379*** 0.0824 0.1827 -0.0237 -0.026 -0.0681 0.3315 0.5630* 0.5464* 0.4751 0.5856
-3.7107 -3.7173 -0.9296 -0.84 (-0.3340) (-0.3663) (-0.9286) -1.3576 -1.9204 -1.8586 -1.2586 -0.782
-0.1784** -0.1512* -0.1188
(-2.2716) (-1.7045) (-0.3310)
-0.9759** -1.0265 0.6195 -0.0987 0.0057 0.0724 -0.0194 -0.1632 -2.0237 -9.2592 0.4291 1.2841
(-2.2689) (-1.6199) -1.5675 (-0.2324) -0.0625 -0.3464 (-0.0444) (-0.4292) (-1.4145) (-0.0126) -0.0812 (-0.0013)
0.4124** 1.3907*** 0.0012
-2.1443 -3.4106 (-0.0116)
0.8078*** 0.9044*** 1.0280*** 0.6274* 0.0573 0.0369 0.174 0.6709* 0.6017 0.7316 1.3566 2.6319
-3.0008 -3.1647 -4.61 (-1.6957) (-0.5007) -0.2686 (-0.7514) -1.757 -0.8302 -0.6305 -0.7742 (-1.0725)
0.4377*** 0.5101** 1.0817
-3.2088 (-1.4998) -1.0664
TFI (j)
TFI (l)
TFI (d)
TFI (e)
TFI (f)
TFI (g)
TFI (h)
TFI (i)
TFI (c)
All All All
ECOWAS All ECOWAS
All ECOWAS ECOWAS
TFI (a)
TFI (b)

TAD/TC/WP(2012)24
83
APPENDIX 2. TRADE COSTS REGRESSIONS WITH THE INDIVIDUAL TFI
Table 23. Trade costs regressions (with individual TFIs)
Note: Cross-section with averaged trade costs over the period 2002-05. Robust standard errors clustered by country pair. Significance levels are: ***=1%, **=5%, *=10%. The number of observations ranges between 1600 and 5500. Values for R2
range between 43-55%.
Group
Sample LICs LMICs UMICs SSA MENA Asia LAC EAC
reg4 reg4 reg4 reg4 reg4 reg4 reg4 reg4
-0.0734** 0.0884*** -0.0692*** -0.0626*** -0.0659* -0.0686** -0.03 0.0417
(-2.5483) -2.6934 (-3.2709) (-2.7787) (-1.7308) -2.0669 (-0.9799) -1.4224
-0.0709** -0.0764*** -0.1246*** -0.0830*** -0.2500*** -0.1488*** -0.0114 -0.1081***
(-2.1388) (-3.1010) (-9.5208) (-4.7186) (-6.4484) (-5.6746) -0.3105 -3.9004
-0.0451 -0.1290*** -0.0919*** -0.0832*** -0.0305 -0.1938*** -0.1571*** -0.0965***
-0.6847 (-5.0421) (-5.9166) (-3.3911) (-0.6680) (-6.9736) (-6.3406) (-5.0904)
-0.0827** 0.0132 -0.1406*** -0.1000*** -0.1219* -0.3073*** -0.0397 0.0021
(-2.0186) -0.3667 (-8.8244) (-5.1296) (-1.9124) (-11.4730) -0.6567 -0.0913
-0.0542 -0.0585** -0.1253*** 0.0016 -0.0245 -0.1459*** -0.1612*** -0.0212
(-1.1398) (-2.0273) (-6.8909) -0.045 (-0.8358) (-4.7174) (-5.4148) (-1.0138)
-0.1809*** -0.2613*** -0.0102 -0.1551*** -0.0392 -0.3754*** -0.2271*** -0.1157***
(-5.0468) (-7.5200) (-0.4524) (-4.3635) (-0.9849) (-10.8303) (-7.2894) (-6.4930)
-0.1627*** -0.1979*** -0.2193*** -0.1989*** -0.3019*** -0.3946*** -0.1495*** -0.1624***
(-3.6236) -2.7161 (-10.3756) (-8.2201) (-7.6542) (-14.8890) (-7.4320) (-5.1911)
-0.1207* -0.2585*** -0.2390*** -0.0054 -0.1175*** -0.0931*** -0.3278*** 0.0700*
(-1.7551) (-6.5498) (-10.6154) (-0.2209) (-4.2077) (-2.7019) (-8.8597) -1.6764
-0.0537** -0.0717*** 0.0187 -0.0261* -0.0288 -0.1023*** 0.007 0.0155
(-2.3599) (-3.4792) -1.5109 (-1.7005) (-1.3353) (-4.5060) -0.3649 -0.8907
-0.1215*** -0.0281 -0.04 -0.0912*** 0.0942 0.0202 -0.0488 -0.0681**
(-2.6512) (-0.6660) (-1.5813) (-3.4409) (-0.4981) -0.3957 (-1.5274) (-2.0572)
-0.2940*** -0.1376*** -0.1497*** -0.1785*** -0.0900*** -0.2607*** -0.1629*** -0.0512
(-7.3453) (-6.0643) (-4.7494) (-4.0452) (-3.6560) (-3.8841) (-8.6833) (-1.4544)TFI (l)
Income level Geographic group
TFI (a)
TFI (b)
TFI (c)
TFI (d)
TFI (e)
TFI (f)
TFI (g)
TFI (h)
TFI (i)
TFI (j)