Trade as a measure of innovation performance: Selection ...
40
Dóra Fazekas, Cambridge Econometrics Boglárka Molnár, Cambridge Econometrics February 2021 EN Trade as a measure of innovation performance: Selection and assessment of trade indicators Provision of technical assistance and study to support the development of a composite indicator to track clean-energy innovation performance of EU members
Transcript of Trade as a measure of innovation performance: Selection ...

Dóra Fazekas, Cambridge Econometrics Boglárka Molnár, Cambridge Econometrics February 2021
EN
Trade as a measure of
innovation performance: Selection and assessment of
trade indicators
Provision of technical assistance and study to support
the development of a composite indicator to track
clean-energy innovation performance of EU members
Trade as a measure of innovation performance: Selection and assessment of publication indicators
European Commission
Directorate-General for Research and Innovation
Directorate C — Clean Planet
Unit C.1 — Clean Energy Transition
Contact Daniele Poponi
Email [email protected]
European Commission
B-1049 Brussels
Manuscript completed in February 2021.
This document has been prepared for the European Commission, however it reflects the views only of the authors, and the
European Commission is not liable for any consequence stemming from the reuse of this publication.
More information on the European Union is available on the internet (http://europa.eu).
PDF ISBN 978-92-76-38733-6 doi:10.2777/688327 KI-03-21-271-EN-N
Luxembourg: Publications Office of the European Union, 2021
© European Union, 2021
The reuse policy of European Commission documents is implemented based on Commission Decision 2011/833/EU of 12
December 2011 on the reuse of Commission documents (OJ L 330, 14.12.2011, p. 39). Except otherwise noted, the reuse of
this document is authorised under a Creative Commons Attribution 4.0 International (CC-BY 4.0) licence
(https://creativecommons.org/licenses/by/4.0/). This means that reuse is allowed provided appropriate credit is given and any
changes are indicated.
For any use or reproduction of elements that are not owned by the European Union, permission may need to be sought directly
from the respective rightholders.

3
EUROPEAN COMMISSION
Trade as a measure of innovation performance:
Selection and assessment of
trade indicators
Provision of technical assistance and study to
support the development of a composite indicator
to track clean-energy innovation performance of
EU members
In association with:
Directorate-General for Research and Innovation 2021 Clean Energy Transition EN

2
Table of Contents
1 Introduction ............................................................................................................... 4
2 Trade flows as indicators for measuring innovation performance ....................................... 5
2.1 Key challenges of trade-based indicators 5
2.2 Identification of relevant indicators and approaches 6
3 Mapping of traded goods classifications to the SET Plan structure ..................................... 12
4 Clean energy innovation performance through the lens of trade indicators ......................... 21
4.1 Main developments of CET exports by SET Plan Key Action 21
4.2 Main developments and trend in the domestic value added content of exports 23
4.3 Analysis of trends for the European Union (EU-27) 25
4.4 Key developments by countries: world players and top EU-27 countries 27
5 Conclusions and Recommendations ............................................................................... 34
References ..................................................................................................................... 35

3
Abbreviations
CAGR Compound Average Growth Rate
CCS/U Carbon capture, utilisation and storage
CEII Clean Energy Innovation Indicator
CET Clean Energy Technology
CN Code Combined Nomenclature Code
Eurostat RAMON Eurostat - Reference and Management of Nomenclatures
GDP Gross Domestic Product
HS Codes Harmonised System Codes
JRC Joint Research Centre
OECD Organisation for Economic Co-operation and Development
PPP Purchasing Power Parity
RES Renewable Energy Sources
R & D Research and Development
R & I Research and Innovation
SITC Standard International Trade Classification
Solar PV Solar Photovoltaic
TiVA Trade in Value Added
UN United Nations
WEC World Energy Council

4
1 Introduction
This report is an interim deliverable of the study to support the development of a
composite indicator to track clean energy innovation performance of EU member states
and Mission Innovation members, which contributes to the overarching aim of assessing
progress in clean energy innovation by analysing output-related indicators.
The composite indicator consists of three dimensions: scientific publications, patents and
trade. This report covers the work on using trade as a measure of innovation
performance and aims to provide details on:
1. Assessment of different trade-indicators and selection of those most suitable for
inclusion in the composite indicator;
2. Insights on clean energy innovation performance from the perspective of trade
flows;
3. Deliver the trade dataset for inclusion in composite indicator calculations.
The report is structured according to the above objectives. In chapter 2, we discuss the
main challenges of using trade flows as a measure of innovation performance, identify
the most relevant trade indicators, assess how they mitigate the key challenges, and
finally select the most suitable trade indicator(s) for including in the index. Chapter 3
summarises the methodology of mapping clean energy technology (CET) products to the
structure of the SET Plan Key Actions (KA). In chapter 4, we provide insights on CET
innovation performance for the selected indicator(s). Annex A includes information on the
dataset that will be used as input for the trade dimension of the composite indicator
calculations.
5
2 Trade flows as indicators for measuring innovation performance
In our approach the process of innovation in clean energy technologies (CETs) can be
captured in the context of a flow-concept in global markets, where the international
diffusion of technological advancements has, essentially, three key stages. Scientific
(basic) research forms the basis for CET innovation, a process that often results in
writing research materials and publications (here captured by scientific publications). The
second phase is for applied research and development activities, the success of which is
often indicated by and measured in terms of classical indicators of innovation outputs (in
the composite indicator: proxied by patents). Finally, diffusion of the goods resulting
from the innovation process takes place internationally through trade (in the composite
indicator: proxied by export).
Trade is a key attribute of the CEII composite indicator, which, as a whole, is intended to
be capable of matching and weighting the indicators so that it reflects an unbiased as
possible, robust and credible picture of a country’s progress in innovation in CETs vis-à-
vis its own historic performance and vis-à-vis other countries. Within the CEII indicator,
the trade dimension essentially reflects the ability of an economy, notably resulting from
innovation, to export goods and services with high levels of value added, and successfully
take part in knowledge-intensive global value chains1.
In this chapter, we first discuss the key challenges of trade-based indicators. We then
present several indicators and approaches to mitigate the impacts of the main
challenges. Finally, we compare and assess the results of the most relevant indicators
and select the best trade indicator(s) for measuring innovation performance and for
inclusion in the clean energy innovation index.
2.1 Key challenges of trade-based indicators
When dealing with trade flows data, there are several issues that need to be considered
for proper interpretation of the data. Some of these are more practical challenges that
can be addressed by applying a transparent and consistent approach. Others are
fundamental in nature and are built around the usefulness of trade data for measuring
innovation performance of national economies. This section discusses two key issues.
Practical challenges
A first practical challenge in working with trade data concerns the treatment of re-
exports in the analysis of trade. Re-exports can introduce strong bias in favour of some
countries (e.g. a very low-income country may seem to be a key exporter of airplanes
only because its national airline has sold second-hand planes2). Fortunately, the raw data
that is used to calculate the trade indicators were available in both aggregation types:
including re-exports or excluding them (net exports). Both the export flow data from UN
Comtrade international trade database and the value added in export data series from
the OECD’s Trade in Value Added database make a distinction between these categories -
thus we could take a consistent approach in our analysis by using the trade flow data
ignoring re-exports.
Fundamental issues
A more fundamental issue in building up trade indicators to assess trade in clean energy
technologies is related to the choice of the elemental level of analysis. Essentially,
there are two key approaches to take in researching trade flows: the product approach
1 Vertesy, D (2017) The Innovation Output Indicator 2017. Methodology Report, EUR 28876 EN, Publications Office of the
European Union, Luxembourg, 2017, ISBN 978-92-79-76474-5, doi:10.2760/971852, JRC108942.
https://publications.jrc.ec.europa.eu/repository/bitstream/JRC108942/jrc108942_ioi_2017_report_final.pdf 2 International Trade Centre (na) Trade Competitiveness Map – Trade Performance Index. Technical notes.
https://tradecompetitivenessmap.intracen.org/Documents/TradeCompMap-Trade%20Performance%20Index-
Technical%20Notes-EN.pdf

6
or the sectoral approach. The sectoral approach builds economic indicators on an
aggregation of the economic industries. In the product approach, product categories are
identified and are aggregated based on a combination of final use and other product
characteristics.
In economic analysis, the sectoral approach is generally used for the construction of all
indicators except data on high-tech trade and patents. We consider that the product
approach is more capable of capturing trends in CET-relevant trade for two reasons: it
builds upon a more granular level of observations; and it is more capable of capturing the
presence of technological advancements than the aggregated sector-level data, as these
advancements essentially appear at the level of individual products, instead of whole
economic industries producing a wide range of products. To provide a practical example
of this: while the glass and glassware industry (within the complete manufacturing
sector) cannot be considered an innovation- and technology-driven one as an aggregate
(and thus would likely not be accounted for in terms of CET advancements), some of its
products are key for the insulation of energy efficient systems and buildings, such as the
product category ‘Multiple-walled insulating units of glass’.
2.2 Identification of relevant indicators and approaches
Trade in CETs3 is one of the three dimensions of the CEII. This dimension measures the
diffusion of innovation in CET through trade metrics. We have developed a core list of
three indicators, based on the collected and processed data:
1. High-tech export: High-tech exports / Total exports
2. CET vs GDP: Clean energy technology exports / GDP
3. CET export value added: Domestic value added content in Clean energy
technology exports / Clean energy technology exports.
The first indicator, High-tech export, essentially gives a measure of the actual share of
high-technology4 products’ exports in a national economy within total exports and
reflects the extent to which the country is currently embedded in high-technology
products’ global value chains. Creating, exploiting and commercialising new technologies
is vital for the competitiveness of a country in the modern economy. While this indicator
alone should not be considered as predictive, interpreting it in parallel with other
indicators and assuming that a country can develop the relevant domestic industries, it
may also indicate the potential for a particular national economy to shift in the future
towards high value-added production and potential export of high-tech products,
including CET.
CETs and clean energy products are key drivers for the low-carbon transition, hence
assessing the ability of countries’ to generate competitive capabilities in the production
and export of low-carbon energy technologies is also of great importance – this is the key
rationale behind the second indicator (CET export vs GDP). In order to measure clean
energy innovation performance of a country and to allow for comparison of performance
between countries, the size/budget/industry structure of countries need to be controlled
for; therefore, instead of investigating export value in itself, the country’s export is
expressed relative to GDP value.
3 Our definition of ’clean energy technology’ (CET) has been developed in accordance with the Key Actions set out in the SET Plan: https://ec.europa.eu/energy/sites/ener/files/publication/Complete-A4-setplan.pdf as per the tender specifications.
In a nutshell, the notion refers to technologies related to the exploration, integration and operation of clean energy forms
(presented in more detail later in the report). 4 Our definition of ‘high-technology’ is in accordance with Eurostat’s latest classification list for High-tech products aggregation,
available here: Eurostat (2020a) Eurostat indicators on High-tech industry and Knowledge – intensive services - Annex 5: High-
tech aggregation of products by SITC Rev.4. Available at:
https://ec.europa.eu/eurostat/cache/metadata/Annexes/htec_esms_an5.pdf
The classification includes technical products the manufacturing of which involved a high intensity of R&D.

7
The first and the second indicators provide an overall assessment of the relative
importance of high-tech and CET product exports of a country, relative to trade volumes
and economic activity (total exports and GDP), thereby also reflecting technological
competitiveness of a given country in these fields. It is important to highlight that while
the group of high-tech products and the CET products do have overlaps in terms of
products (around one-fifth of the set of 6-digit HS codes classified as CET are also
present in the high-tech definition), they are not subsets of each other, nor are they
disjoint sets. In this regard, the High-tech export indicator, and the CET export vs GDP
indicator both capture relevant, yet different angles of the relative export
competitiveness of a country’s innovative industries. It is important to note, however,
that these indicators (the High-tech export indicator and the CET export vs GDP
indicator) cannot account for the location of the R&D activity performed, as the export
component also captures the export of manufactured products whose R&D has been
performed elsewhere than the specific country.
Finally, the indicator CET export value added (Domestic value added content in Clean
energy technology exports / Clean energy technology exports) aims to measure the
extent to which the given economy provides an individual contribution to global clean
energy supply chains. Trade in value added considers the value added by each country in
the production of goods and services that are consumed worldwide5. Pioneering new
products and services can provide substantial margins for first movers, thereby securing
competitive advantage in the longer run; furthermore, the agglomeration effect provides
the possibility of extending the first-mover advantage in a CET to a whole ecosystem of
related products and services in the future.
These indicators build upon existing approaches developed for the European Innovation
Scoreboard6 and the Innovation Output Indicator7.
It should be noted that while no indicator can be calculated for all the in-scope countries
that would reflect the ratio of exports versus domestic production for all the relevant
product categories, such an indicator can be calculated for EU member countries and is
discussed later in more detail.
The tables (1-3) below provide summaries of the three key indicators to be used for the
construction of the trade dimension of the CEII, as well as a fourth indicator that only
covers 28 countries (EU-27 + the United Kingdom) due to data availability. Its inclusion
in the composite index will be decided in the final calculation of the composite index.
Table 1 Indicator 1: High-tech exports as a share of total product exports
Aspect Description
Indicator Exports of high-technology product exports as a share of total product
exports
Numerator Value of high-technology products export, in USD and current prices;
specifically, value of exports of the HS 6-digit product codes classified
as high-technology in Table 3-2.
Denominator Value of total product exports, in USD and current prices
Description The indicator can be used to measure the technological competitiveness
5 OECD (2020) Trade in Value Added. Available at: https://www.oecd.org/sti/ind/measuring-trade-in-value-added.htm 6 European Commission (2019) European Innovation Scorecard – Main report. Available at:
https://ec.europa.eu/docsroom/documents/38781 7 Vertesy, D (2017) The Innovation Output Indicator 2017. Methodology Report, EUR 28876 EN, Publications Office of the
European Union, Luxembourg, 2017, ISBN 978-92-79-76474-5, doi:10.2760/971852, JRC108942.
https://publications.jrc.ec.europa.eu/repository/bitstream/JRC108942/jrc108942_ioi_2017_report_final.pdf

8
of the observed countries, i.e. the ability to commercialise the results of
research and development (R&D) and innovation in international
markets.
In general, this indicator could reflect a country’s ‘potential’ with
respect to advanced technologies – i.e., how well developed its high-
tech trade offering is. The overall expectation is that if a country tends
to perform strongly in high-tech trade, this capacity could be turned
towards CET production.
Rationale / relevance High technology products are in general characterised by high value
added and high-paid employment, hence are key drivers for economic
growth, productivity and welfare. In addition, trade intensity of a
country in these products can be considered a proxy for the country’s
progress in the diffusion of pioneer technologies.
Comparability The indicator allows for proper comparison across the selected countries
(EU-27 member states and countries with Mission Innovation
membership).
Data availability UN Comtrade database. Coverage: for all requested countries, for all
requested years, at HS 6-digit level.
Assessment The indicator, in general, reflects how well developed a country’s high-
tech trade offering is. It can be the case, however, that a country
scores high in this indicator due to its strong specialisation in a very
specific set of high-tech product exports, but performs poorly in trade
relevant to CET, and no robust assumption can be made with regards to
turning this capacity towards clean energy production in the future. This
type of bias in assessing the countries’ innovation performance will
have to be accounted for in designing the statistical aggregation
method and the weighting of the indicator in the final CEII.
Table 2 Indicator 2: Clean energy technology exports as a share of GDP
Aspect Description
Indicator Clean energy technology-related product exports as a share of GDP
Numerator CET product exports, in USD and current prices, specifically, value of
exports of the HS 6-digit product codes classified as CET in Table 3-1.
Denominator GDP, PPP
Description This indicator measures the export performance of a country relative to
its productive capacities available (the output of which is GDP), with a
special focus on CET exports (i.e., it reflects a country’s ability to

9
commercialise results of R&D and innovation in international markets).
Rationale / relevance The key rationale behind this indicator is a view that CET exports are an
indication of successful innovation performance in the sector. The
indicator shows the size of the CET exports relative to the size of the
country’s economy; and through reflecting the relative importance of
international trade (of clean energy technologies) in the economy of a
country, it is also a proxy for the country’s position in global clean
energy value chains.
Comparability The indicator allows for comparison across the selected countries (EU-
27 member states and countries with Mission Innovation membership).
Data availability CET exports: UN Comtrade database. GDP: World Bank.
Coverage: for all requested countries, for all requested years, exports
at HS 6-digit level.
Assessment CET exports as a proportion of GDP provides an overall measure of
innovation performance in CET fields.
Table 3 Indicator 3: Domestic value-added content of clean energy technology exports as a share of clean energy technology exports
Aspect Description
Indicator Domestic value-added content of energy technology-related product
exports as a share of total CET product exports
Numerator Value of domestic value added embedded in CET products exports, in
USD and current prices, reflecting value added content of exports of
CET products.
Denominator Value of total CET products exports
Description The indicator measures the domestic contribution to traded CET
products, measured against the value of total CET exports.
Rationale / relevance The indicator gives a proxy of current embeddedness in global value
chains of CETs. It also reflects the domestic value-added content of CET
exports, and provides insight regarding a country’s actual ability for
local production and related to that, the future deployment of CETs.
This indicator can provide an insight into the potential for future
domestic industry development.
Comparability The indicator allows for comparison across the selected countries (EU-
27 member states and countries with Mission Innovation membership).
Data availability OECD Trade in Value Added database. Coverage: for all requested
10
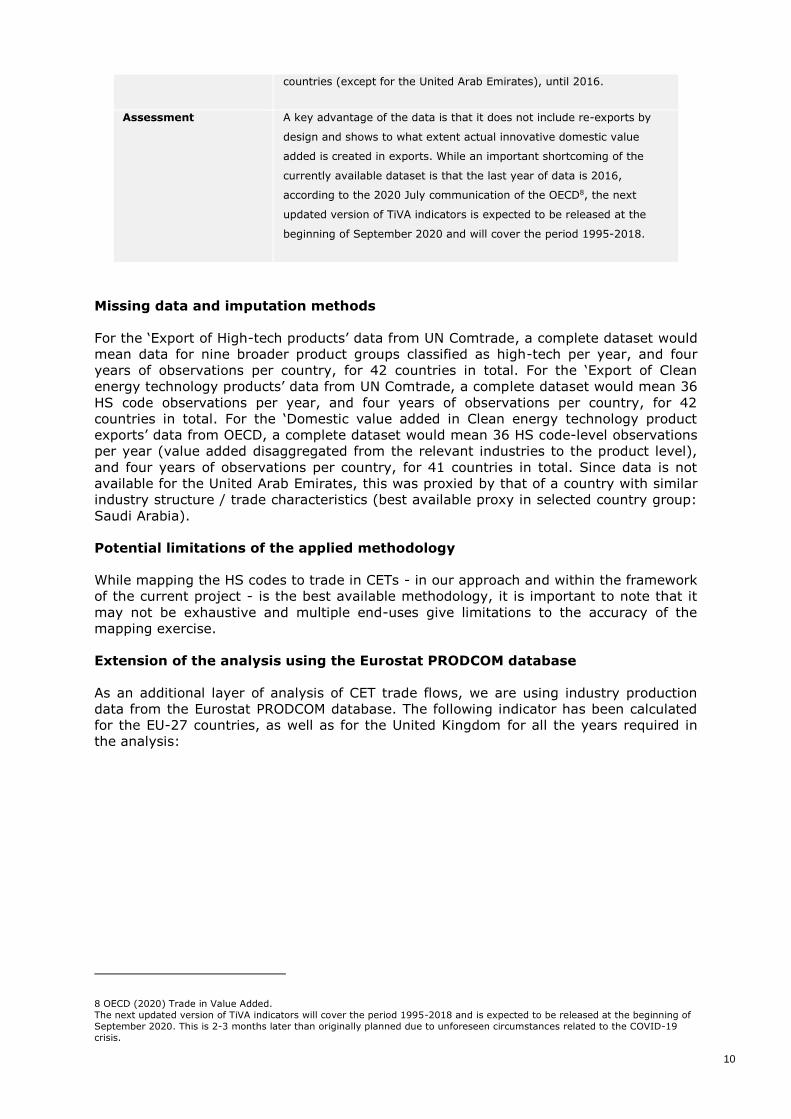
countries (except for the United Arab Emirates), until 2016.
Assessment A key advantage of the data is that it does not include re-exports by
design and shows to what extent actual innovative domestic value
added is created in exports. While an important shortcoming of the
currently available dataset is that the last year of data is 2016,
according to the 2020 July communication of the OECD8, the next
updated version of TiVA indicators is expected to be released at the
beginning of September 2020 and will cover the period 1995-2018.
Missing data and imputation methods
For the ‘Export of High-tech products’ data from UN Comtrade, a complete dataset would
mean data for nine broader product groups classified as high-tech per year, and four
years of observations per country, for 42 countries in total. For the ‘Export of Clean
energy technology products’ data from UN Comtrade, a complete dataset would mean 36
HS code observations per year, and four years of observations per country, for 42
countries in total. For the ‘Domestic value added in Clean energy technology product
exports’ data from OECD, a complete dataset would mean 36 HS code-level observations
per year (value added disaggregated from the relevant industries to the product level),
and four years of observations per country, for 41 countries in total. Since data is not
available for the United Arab Emirates, this was proxied by that of a country with similar
industry structure / trade characteristics (best available proxy in selected country group:
Saudi Arabia).
Potential limitations of the applied methodology
While mapping the HS codes to trade in CETs - in our approach and within the framework
of the current project - is the best available methodology, it is important to note that it
may not be exhaustive and multiple end-uses give limitations to the accuracy of the
mapping exercise.
Extension of the analysis using the Eurostat PRODCOM database
As an additional layer of analysis of CET trade flows, we are using industry production
data from the Eurostat PRODCOM database. The following indicator has been calculated
for the EU-27 countries, as well as for the United Kingdom for all the years required in
the analysis:
8 OECD (2020) Trade in Value Added.
The next updated version of TiVA indicators will cover the period 1995-2018 and is expected to be released at the beginning of
September 2020. This is 2-3 months later than originally planned due to unforeseen circumstances related to the COVID-19
crisis.

11
Indicator 4: CET export vs production: Clean energy technology exports / Clean
energy technology Total Sold Production9
The indicator reflects to what extent domestic production of a specific CET is exported –
in other words, how export-driven the production process of a country is, with respect to
clean energy technologies.
The dataset only covers EU countries, therefore we see two options for the treatment of
this indicator, calculated for a subset of countries, in order to add value to the analysis,
while not diminishing the indicator’s robustness (due to the limited coverage of
countries):
The indicator can be included in the computation of the composite indicator, but the
weights used in computing the composite indicator based on sub-indicators need to be
different for EU countries and for non-EU countries. This needs to be developed at the
later stage of weighting and aggregation of indicators.
The indicator is not included in the computation of the composite indicator, but is
provided separately, in a format to be agreed upon later, calculated and assessed for
EU countries only. Additionally, based on the assessment of this indicator, insights
with regards to EU countries’ industrial competitiveness will be drawn and written up
in the final report as part of the analysis of CET trade dimension.
Approach to enable trade data to be used in combination with publication and
patent data for composite indicator
As will be done for the publications and patent data, the data for the trade indicators will
be consolidated and weighted before feeding into the CEII. The key requirement for this
step is that a normalised value has to be created. The normalised value is expected to be
a combination of all the proposed indicators in the trade dimension, which will allow for
capturing all the trade aspects of key relevance to the SET Plan implementation, while
avoiding redundancy across the underlying indicators.
9 Total Sold Production data covers the production sold outside the enterprises during the reference period. While total
production would include both the production sold and the production retained for reuse by the enterprises as inputs to the
manufacture of other products, which may also be informative with regards to the industrial competitiveness in international
markets; since products that are not sold cannot easily be valued, only the volume of Total Sold Production can be reported and
thus is available from the PRODCOM database. For further details please refer to the PRODCOM Data User Guide:
Eurostat (2017) Statistics on production of manufactured goods (PRODCOM). Available at:
https://ec.europa.eu/eurostat/documents/120432/4433294/europroms-user-guide.pdf

12
3 Mapping of traded goods classifications to the SET Plan structure
A concordance framework has been developed, linking the relevant clean energy
technologies (CETs) to classifications often used in assessing trade in products data (the
latest Harmonised System Codes, HS classification). Our mapping approach draws on
discussions with the JRC team involved in the project, as well as on the review of some
relevant preceding sources: JRC reports10,11, a recent academic study12 building on these
reports and expanding on their mapping structures (mostly with regards to ‘Wind’ energy
technology), relevant studies13,14,15 commissioned by international organisations, as well
as a proposed list of goods for inclusion under the Environmental Goods Agreement
(EGA), developed by the World Energy Council (WEC)16 in 2010.
While it should be noted that some of these studies and this latter report from the WEC
are not very recent and therefore might be considered as outdated, the changes in the
technologies and related products have not been that substantial that the suggestions of
these sources cannot still be considered valid. However, it might be the case that some
categories, which were not included in earlier works, are now included in our analysis: for
example, in the previously referred WEC report, there is no mention of ‘Energy Storage &
Electric powertrains’ as a distinct technology domain, but some of the HS codes related
to ‘Transformers’ that in the WEC report are allocated under ‘Energy efficiency in power
distribution and plant-level consumption’ (i.e. HS codes 8504.2X, 8504.3X) are in this
report allocated to ‘Energy Storage & Electric powertrains’. To end up with a
comprehensive categorisation, in such cases sources needed to be synthesised: in this
case, for example, HS codes 8504.2X, 8504.3X (other than 8504.31) have remained
included under CET category ‘Energy Storage & Electric powertrains’ within SET Plan KA
’Competitive in the global battery sector (E-mobility)’; and based on another relevant
study17, out of the 8504.XX HS group only 8504.31 has been included under CET ‘Wind’
within the SET Plan KA ‘Performant renewable technologies integrated in the system’, as
this is the only Transformer category that should be considered as of key relevance for
‘Wind’ (based on our own expert judgement).
Where needed, harmonisation of different HS code classifications was based on the
concordance tables available in Eurostat’s RAMON18 metadata.
Importantly, there is no clear one-to-one mapping between the investigated SET
Plan KAs and the product-level 6-digit HS codes. Certain product categories, while
being highly relevant for the assessed CETs, capture trade in products which are
also relevant to trade in several other non-CET product categories. The clearest
example of this appears to be in the SET Plan KA ‘CCS/U’ where some of the key
products are likely to capture trade in natural gas and chemical industry, too, for
example. Some of the codes, e.g., HS 2012 841861, 841950, or 850431) might
apply to more than one CET type. However, for the sake of consistency and
additivity (for the calculation of the ‘total’ indicator, based on the sub-indicators
per different CETs and per different SET Plan KAs), in these cases the HS codes
10 Pasimeni, F (2017) EU energy technology trade: Import and export. EUR 28652 EN, Publications Office of the European
Union, Luxembourg, 2017, ISBN 978-92-79-69670-1, doi:10.2760/607980, JRC107048. 11 Fiorini, A et al (2017) Monitoring R&I in Low-Carbon Energy Technologies. Methodology for the R&I indicators in the States of
the Energy Union Report – 2016 edition. EUR 28446 EN. doi: 10.2760/447418 12 Read, E A (2019) The technology transfer reality behind Costa Rica’s renewable Electricity. EKHS34 Master’s Thesis, Lund
University, School of Economics and Management, Sweden. Available at:
http://lup.lub.lu.se/luur/download?func=downloadFile&recordOId=8993611&fileOId=8993612 13 Wind, I (2010) HS Codes and the Renewable Energy Sector. International Centre for Trade and Sustainable Development.
Available at: https://www.files.ethz.ch/isn/111414/2010_01_hs-codes-and-the-renewable-energy-sector.pdf 14 Wind, I (2010) HS Codes and the Transport Sector. International Centre for Trade and Sustainable Development. Available
at: https://www.files.ethz.ch/isn/139135/hs-code-study-transport.pdf 15 Jacob, A – Møller, M K (2017), Policy landscape of trade in environmental goods and services. ARTNeT Working Paper Series
No. 166, April 2017, Bangkok, ESCAP. Available at: https://www.unescap.org/sites/default/files/AWP%20No.%20166.pdf 16 World Energy Council (2010) Proposed list of goods for inclusion under the Environmental Goods Agreement (EGA). Available
at: https://www.worldenergy.org/assets/images/imported/2012/09/20100914_wec_envtl_goods_list.pdf 17 Jacob, A – Møller, M K (2017), Policy landscape of trade in environmental goods and services. ARTNeT Working Paper Series
No. 166, April 2017, Bangkok, ESCAP. Available at: https://www.unescap.org/sites/default/files/AWP%20No.%20166.pdf 18 Eurostat (2020c) Reference And Management Of Nomenclatures. Available at:
https://ec.europa.eu/eurostat/ramon/index.cfm?TargetUrl=DSP_PUB_WELC

13
have been exclusively allocated to one CET. This way the indicators, when
aggregated up to SET Plan KA level and to ‘total’, show a comprehensive picture
of a country’s progress in CET trade and there is no risk of double-counting a
specific product category under more than one CET. In these cases, i.e. where one
product (as defined by one HS code) might have been relevant to more than one
technology or SET Plan KA, the final allocation of the code was based on a) the
reviewed literature sources (listed in the footnotes) and b) the observed relative
importance of the HS code in question within all the HS codes associated with the
specific CET (in terms of the share of trade value captured by the HS code in
question compared to total trade value of all HS codes associated with the specific
CET).
The concordance between the key topics of the Energy Union R&I and
Competitiveness priorities, the SET Plan KAs, the selected CETs and the
corresponding HS codes (to assess trade) is summarised in Table 4 below.
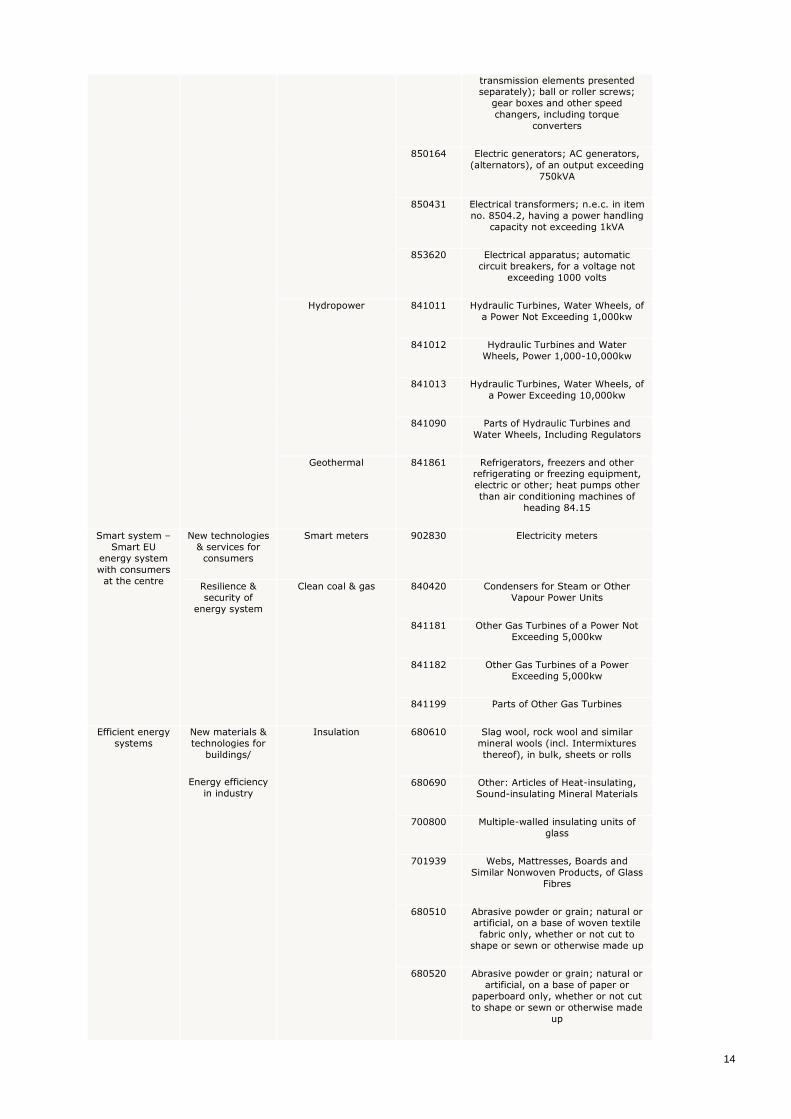
Table 4 Concordance between topics within the Energy Union R&I and Competitiveness priorities, SET key actions and HS product codes for clean energy technologies
Number 1 in
Renewables
Performant
renewable
technologies
integrated in the
system
Solar PV 854140 Diodes, transistors and similar
semiconductor devices;
photosensitive semiconductor
devices, including photovoltaic cells,
whether or not assembled in modules
or made up into panels; light-
emitting diodes; mounted
piezoelectric crystals
850440 Electrical transformers, static
converters (for example, rectifiers)
and inductors
Solar Thermal 841919 Instantaneous or storage water
heaters, non-electric (excl.
instantaneous gas water heaters and
boilers or water heaters for central
heating)
850239 Electric generating sets; (excluding
those with spark-ignition or
compression-ignition internal
combustion piston engines), other
than wind powered
841950 Heat Exchanger Units
Wind 730820 Towers and lattice masts, of Iron or
Steel
850231 Generating Sets, Electric, Wind-
powered
841381 Pumps for liquids, whether or not
fitted with a measuring device; other
pumps
841290 Engines; parts, for engines and motors of heading no. 8412 (reaction
engines, hydraulic power engines,
pneumatic power engines)
848210 Ball bearings
848340 Gears and gearing; (not toothed
wheels, chain sprockets and other
Energy Union R&I
priority
SET Plan (key
actions)
Corresponding clean energy technology
HS code (6- or
4-
digit)
HS code description
14
transmission elements presented separately); ball or roller screws;
gear boxes and other speed
changers, including torque
converters
850164 Electric generators; AC generators,
(alternators), of an output exceeding
750kVA
850431 Electrical transformers; n.e.c. in item
no. 8504.2, having a power handling
capacity not exceeding 1kVA
853620 Electrical apparatus; automatic
circuit breakers, for a voltage not
exceeding 1000 volts
Hydropower 841011 Hydraulic Turbines, Water Wheels, of
a Power Not Exceeding 1,000kw
841012 Hydraulic Turbines and Water
Wheels, Power 1,000-10,000kw
841013 Hydraulic Turbines, Water Wheels, of
a Power Exceeding 10,000kw
841090 Parts of Hydraulic Turbines and
Water Wheels, Including Regulators
Geothermal 841861 Refrigerators, freezers and other refrigerating or freezing equipment,
electric or other; heat pumps other
than air conditioning machines of
heading 84.15
Smart system –
Smart EU
energy system
with consumers
at the centre
New technologies
& services for
consumers
Smart meters 902830 Electricity meters
Resilience &
security of
energy system
Clean coal & gas 840420 Condensers for Steam or Other
Vapour Power Units
841181 Other Gas Turbines of a Power Not
Exceeding 5,000kw
841182 Other Gas Turbines of a Power
Exceeding 5,000kw
841199 Parts of Other Gas Turbines
Efficient energy
systems
New materials &
technologies for
buildings/
Energy efficiency
in industry
Insulation 680610 Slag wool, rock wool and similar
mineral wools (incl. Intermixtures
thereof), in bulk, sheets or rolls
680690 Other: Articles of Heat-insulating,
Sound-insulating Mineral Materials
700800 Multiple-walled insulating units of
glass
701939 Webs, Mattresses, Boards and
Similar Nonwoven Products, of Glass
Fibres
680510 Abrasive powder or grain; natural or artificial, on a base of woven textile
fabric only, whether or not cut to
shape or sewn or otherwise made up
680520 Abrasive powder or grain; natural or
artificial, on a base of paper or
paperboard only, whether or not cut
to shape or sewn or otherwise made
up

15
680530 Abrasive powder or grain; natural or artificial, on a base of materials
n.e.c. in heading no. 6805, whether
or not cut to shape or sewn or
otherwise made up
Sustainable
transport
Renewable fuels Biofuels 220710 Ethyl Alcohol (Alcoholic Strength 80
degrees or More)
220720 Ethyl Alcohol, Other Spirits
(Denatured)
Fuel cells 850680 Cells and batteries; primary, (other
than manganese dioxide, mercuric
oxide, silver oxide, lithium or air-
zinc)
850690 Cells and batteries; primary, parts
thereof
Hydrogen technology 280410 Hydrogen
840510 Generators; producer gas, water gas,
acetylene gas and similar water
process gas generators, with or
without their purifiers
840590 Generators; parts of producer gas,
water gas, acetylene gas and similar water process gas generators, with
or without their purifiers
731100 Containers for compressed or
liquefied gas, of iron or steel
761300 Aluminium; containers for
compressed or liquefied gas
Competitive in
the global
battery sector
(E-mobility)
Energy Storage &
Electric powertrains
850300 Electric motors and generators; parts
suitable for use solely or principally
with the machines of heading no.
8501 or 8502
850421 Electrical transformers; liquid
dielectric, having a power handling
capacity not exceeding 650kVA
850422 Electrical transformers; liquid
dielectric, having a power handling
capacity exceeding 650kVA but not
exceeding 10,000kVA
850423 Electrical transformers; liquid
dielectric, having a power handling
capacity exceeding 10,000kVA
850432 Transformers; n.e.c. in item no.
8504.2, having a power handling
capacity exceeding 1kVA but not
exceeding 16kVA
850433 Transformers; n.e.c. in item no.
8504.2, having a power handling
capacity exceeding 16kVA but not
exceeding 500kVA
850434 Transformers; n.e.c. in item no.
8504.2, having a power handling
capacity exceeding 500kVA
850720 Electric accumulators; lead-acid,
(other than for starting piston
engines), including separators, whether or not rectangular (including
square)

16
850650 Cells and batteries; primary, lithium
850710 Lead-acid Accumulators, of a Kind
Used for Starting Piston Engines
850730 Nickel-cadmium Accumulators
850740 Nickel-iron Accumulators
Carbon capture,
utilisation and
storage (CCS/U)
Carbon capture,
utilisation and
storage (CCS/U)
Carbon capture,
utilisation and storage
(CCS/U)19
730630 Tubes, Pipes And Hollow Profiles,
Seamless, Of Iron (Other Than Cast
Iron) Or Steel
841490 Parts of air or other gas compressors
841480 Air or other gas compressors CCS
841990 Parts of apparatus for treatment of
materials by temperature
841989 Other apparatus for treatment of
materials by temperature
Nuclear safety Nuclear safety Nuclear energy 840110 Nuclear reactors
840120 Machinery and apparatus; for
isotopic separation, and parts thereof
840140 Nuclear reactors; parts thereof
Source: Mapping of technologies and HS product codes based on Pasimeni, F (2017), Fiorini (2017), Read, E A (2019) and the
World Energy Council (2010). Mapping of R&I priorities adapted from the JRC’s “Monitoring R&I in low-carbon energy technologies,” 2017, allocation was applied to the extent made possible by the structure and granularity of publicly available
data on product-level trade.
Classification of high-tech industries
Our definition of high-tech industries is based on that applied in Eurostat’s “high-tech
statistics”20. In their statistical methodology, there are two main approaches used to
identify technology-intensity: the sectoral approach and the product approach. The
sectoral approach builds on an aggregation of the manufacturing industries according to
their technological intensity (R&D expenditure divided by value added). In this approach,
manufacturing activities are grouped using the Statistical Classification of Economic
Activities in the European Community (NACE Rev.2) at the 2- or 3-digit level to:
‘high-technology’ (e.g., Manufacture of basic pharmaceutical products and
pharmaceutical preparations),
‘medium high-technology’ (e.g., Manufacture of electrical equipment),
‘medium low-technology’ (e.g., Manufacture of rubber and plastic products) and
‘low-technology’ (e.g., Manufacture of beverages)21.
19 The HS codes most relevant to CCS/U technology have been selected based on the proposed list of goods for inclusion under
the Environmental Goods Agreement (EGA) developed by the World Energy Council in 2010. Available at:
https://www.worldenergy.org/assets/images/imported/2012/09/20100914_wec_envtl_goods_list.pdf. Out of all HS product codes marked to be partly or fully linked to CCS/U in the referred source, we have selected the five most
relevant HS codes based on their share in total exports of products that are marked to be partly or fully linked to CCS/U of EU-
28 countries to the world in 2016 (five most relevant products accounting for ~50% of this export). Export data taken from the
UN Comtrade products export database. May be revised/extended based on the referred source. 20 Eurostat (2020a) Eurostat indicators on High-tech industry and Knowledge – intensive services - Annex 5: High-tech
aggregation of products by SITC Rev.4. https://ec.europa.eu/eurostat/cache/metadata/Annexes/htec_esms_an5.pdf 21 Eurostat (2020d) Glossary:High-tech. Available at: https://ec.europa.eu/eurostat/statistics-
explained/index.php/Glossary:High-tech

17
In the product approach, product groups are classified as high-technology products
depending on their R&D intensity (R&D expenditure divided by total sales) and are
aggregated on the basis of the Standard International Trade Classification (SITC).
According to the metadata source of Eurostat referred to above, the sectoral approach is
generally used for the construction of all indicators except data on high-tech trade and
patents. As industrial sectors that are characterised by a limited number of high-
technology products may also produce a range of low-technology products, the product
approach is more capable of capturing trends in high-tech trade, as it is built up from a
more granular level of observations and reflects the presence of technological
advancements in trade metrics better than the aggregated sector-level data.
In accordance with Eurostat’s latest classification list for High-tech products
aggregation22, high-technology trade is defined as exports and imports of a subset of
products defined according to the Standard International Trade Classification (SITC –
Rev. 4). The classification, presented in Table 5 below contains technical products the
manufacturing of which involved a high intensity of R&D.
Table 5 High-tech aggregation of products by SITC Rev.4
Group Code Title23
Aerospace (714-714.89-714.99)+
Lead-acid Accumulators, of a Kind Used for Starting Piston Engines
792.1+ Helicopters
792.2+792.3+792.4+ Aeroplanes and other aircraft, mechanically-propelled (other than helicopters)
792.5+ Spacecraft (including satellites) and spacecraft launch vehicles
792.91+ Propellers and rotors and parts thereof
792.93+ Undercarriages and parts thereof
874.11 Direction finding compasses; other navigational instruments and appliances
Computers, office machines
751.94+ Multifunction office machines, capable of connecting to a computer or a network
751.95+ Other office machines, capable of connecting to computer or a network
752+ Computers
759.97 Parts and accessories of group 752
Electronics, telecommunications
763.31+ Sound recording or reproducing apparatus operated by coins, bank cards, etc
763.8+ Video apparatus
(764-764.93-
764.99)+
Telecommunications equipment, excluding 764.93
and 764.99
772.2+ Printed circuits
22 Eurostat (2020a) Eurostat indicators on High-tech industry and Knowledge – intensive services - Annex 5: High-tech
aggregation of products by SITC Rev.4. Available at:
https://ec.europa.eu/eurostat/cache/metadata/Annexes/htec_esms_an5.pdf 23 In some cases, the titles have been shortened. For full description see: United Nations (2020) Classifications on Economic
Statistics. Available at: http://unstats.un.org/unsd/cr/registry
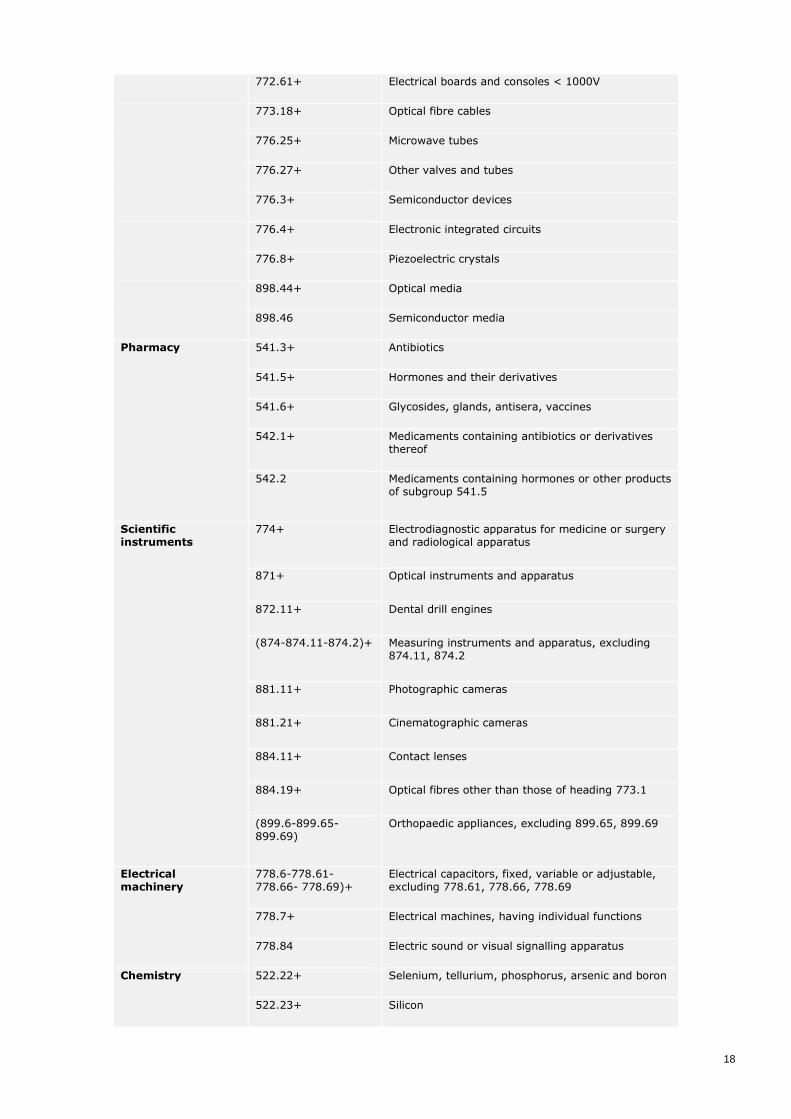
18
772.61+ Electrical boards and consoles < 1000V
773.18+ Optical fibre cables
776.25+ Microwave tubes
776.27+ Other valves and tubes
776.3+ Semiconductor devices
776.4+ Electronic integrated circuits
776.8+ Piezoelectric crystals
898.44+ Optical media
898.46 Semiconductor media
Pharmacy 541.3+ Antibiotics
541.5+ Hormones and their derivatives
541.6+ Glycosides, glands, antisera, vaccines
542.1+ Medicaments containing antibiotics or derivatives thereof
542.2 Medicaments containing hormones or other products of subgroup 541.5
Scientific instruments
774+ Electrodiagnostic apparatus for medicine or surgery and radiological apparatus
871+ Optical instruments and apparatus
872.11+ Dental drill engines
(874-874.11-874.2)+ Measuring instruments and apparatus, excluding 874.11, 874.2
881.11+ Photographic cameras
881.21+ Cinematographic cameras
884.11+ Contact lenses
884.19+ Optical fibres other than those of heading 773.1
(899.6-899.65-899.69)
Orthopaedic appliances, excluding 899.65, 899.69
Electrical machinery
778.6-778.61-778.66- 778.69)+
Electrical capacitors, fixed, variable or adjustable, excluding 778.61, 778.66, 778.69
778.7+ Electrical machines, having individual functions
778.84 Electric sound or visual signalling apparatus
Chemistry 522.22+ Selenium, tellurium, phosphorus, arsenic and boron
522.23+ Silicon

19
522.29+ Calcium, strontium and barium
522.69+ Other inorganic bases
525+ Radioactive materials
531+ Synthetic organic colouring matter and colour lakes
574.33+ Polyethylene terephthalate
591 Insecticides, disinfectants
Non-electrical machinery
714.89+ Other gas turbines
714.99+ Part of gas turbines
718.7+ Nuclear reactors and parts thereof, fuel elements, etc
728.47+ Machinery and apparatus for isotopic separation
731.1+ Machine-tools working by laser or other light or photon beam, etc
731.31+ Horizontal lathes, numerically controlled
731.35+ Other lathes, numerically controlled
731.42+ Other drilling machines, numerically controlled
731.44+ Other boring-milling machines, numerically controlled
731.51+ Milling machines, knee-type, numerically controlled
731.53+ Other milling machines, numerically controlled
731.61+ Flat-surface grinding machines, numerically controlled
731.63+ Other grinding machines, numerically controlled
731.65+ Sharpening machines, numerically controlled
733.12+ Bending, folding, straightening or flattening machines, numerically controlled
733.14+ Shearing machines, numerically controlled
733.16+ Punching machines, numerically controlled
735.9+ Parts and accessories of 731 and 733
737.33+ Machines and apparatus for resistance welding of metal, fully or partly automatic
737.35 Machines and apparatus for arc welding of metal, fully or partly automatic
Armament 891 Arms and ammunition
Source: Eurostat (2020a)24
24 Eurostat (2020a) Eurostat indicators on High-tech industry and Knowledge – intensive services - Annex 5: High-tech
aggregation of products by SITC Rev.4. https://ec.europa.eu/eurostat/cache/metadata/Annexes/htec_esms_an5.pdf

20
Concordance between traded goods categories (by HS codes) and SITC Rev.4
classification
As high-technology trade is defined as exports and imports of products according to the
Standard International Trade Classification (SITC – Rev. 4), while the initial dataset on
international trade (UN Comtrade data) sorts traded goods data according to Harmonised
System Codes (HS classification), it is necessary to map the above SITC commodities to
HS codes to the relevant industries. The relevant correspondence table for this
conversion can be found on the Eurostat RAMON25 site. Initially, traded goods data for
the more recent years is provided in the HS 2017 classification version, while earlier
years are reported in HS 2012 classification, thus in order to have a single set of HS
codes to use for the analysis, everything has been mapped to HS 2017 classification.
Concordance between traded goods categories (by CN codes) and HS
classification
Production of manufactured goods data available from the PRODCOM database26 uses
the CN-code classification by NACE Rev. 2 categories. To allow for linking it to the
identified clean energy technologies, another correspondence table was developed by
Cambridge Econometrics that allows for a matching of CN product codes to HS product
codes and finally, to clean energy technologies.
The correspondence tables used for these conversions can be found in the accompanying
dataset including all the indicators (Synthesised Trade Analysis_Input
data_Graphs_20201111.xlsx).
25 Eurostat (2020c) RAMON – Reference and Management of Nomenclatures. Available at:
https://ec.europa.eu/eurostat/ramon/relations/index.cfm?TargetUrl=LST_REL&StrLanguageCode=EN&IntCurrentPage=1 26 Eurostat (2020b) Statistics on the production of manufactured goods (prodcom). Available at:
https://ec.europa.eu/eurostat/web/prodcom/data/database

21
4 Clean energy innovation performance through the lens of trade indicators
This chapter provides a high-level analysis of the main developments regarding
international trade in clean energy technologies (CETs). First, aggregate performance of
the investigated countries (and groups of countries such as the EU) for all SET Plan KAs is
assessed for the relevant indicators. Second, the country performance is assessed across
various renewable technologies that are sub-categories of SET Plan KA “Performant
renewable technologies”. Finally, the performance of world players across the years is
investigated in more detail, with a focus on exploring trends in specialisation per country.
4.1 Main developments of CET exports by SET Plan Key Action
Export volumes of CET products of in-scope countries have been largely stagnant
between 2012 and 2018; the total CET export volume increased from 0.302 B USD in
2012 to 0.304 B USD in 2018, with a CAGR (compound average growth rate) of 0.1%.
Figure 1 presents total export volumes across the top three largest SET Plan KA categories.
The top five largest CET product exporters, in volume terms and as of 2018 were (larger
to smaller): China, Germany, US, Japan and Italy. Based on 2018 data, out of all the in-
scope countries, Mission Innovation members, as a group (23 countries out of 42 in
total), accounted for as much as 87% of total CET exports.
Figure 1 Clean energy technology export volumes across the top 3 largest SET Plan Key Actions, in-scope countries total (1000 USD)
Data Source: United Nations (2020)27
Figure 4-2 presents the distribution of CET products exports across all SET Plan KAs. The
chart illustrates the relative sectoral importance in the dimension of traded goods in in-
scope countries (EU member states and non-EU Mission Innovation members
aggregated).
27 United Nations (2020) UN Comtrade Database. Available at: https://comtrade.un.org/
22
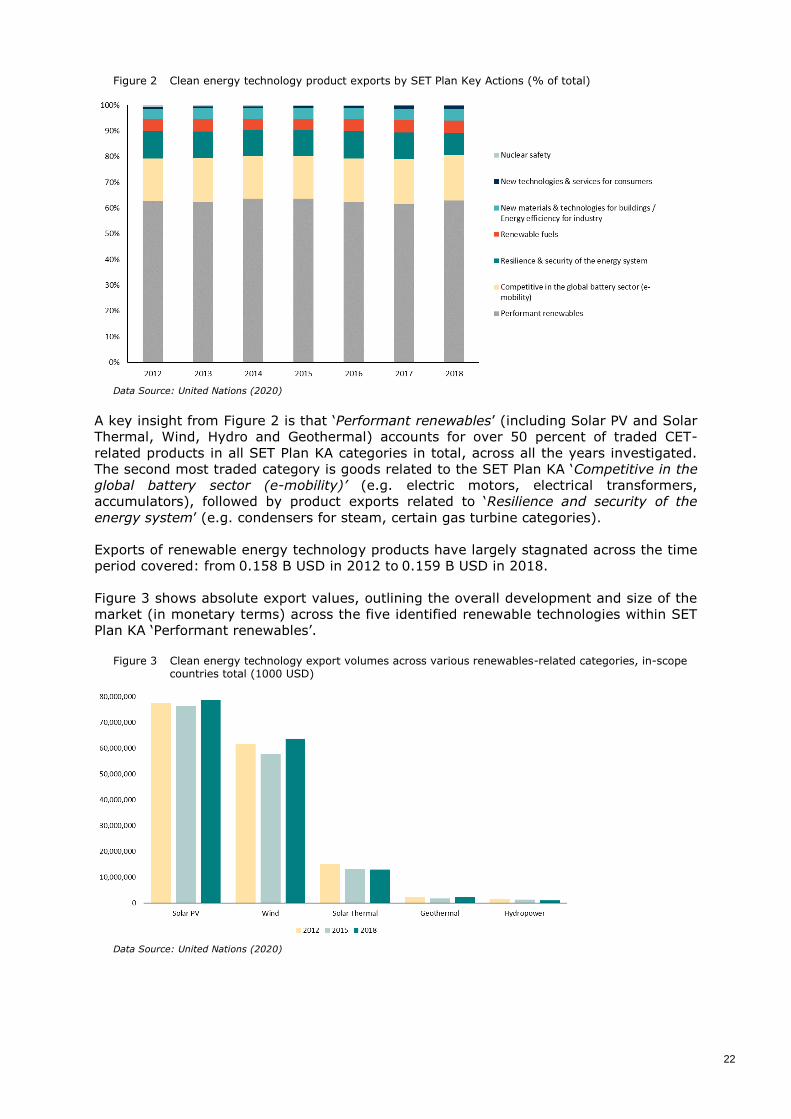
Figure 2 Clean energy technology product exports by SET Plan Key Actions (% of total)
Data Source: United Nations (2020)
A key insight from Figure 2 is that ‘Performant renewables’ (including Solar PV and Solar
Thermal, Wind, Hydro and Geothermal) accounts for over 50 percent of traded CET-
related products in all SET Plan KA categories in total, across all the years investigated.
The second most traded category is goods related to the SET Plan KA ‘Competitive in the
global battery sector (e-mobility)’ (e.g. electric motors, electrical transformers,
accumulators), followed by product exports related to ‘Resilience and security of the
energy system’ (e.g. condensers for steam, certain gas turbine categories).
Exports of renewable energy technology products have largely stagnated across the time
period covered: from 0.158 B USD in 2012 to 0.159 B USD in 2018.
Figure 3 shows absolute export values, outlining the overall development and size of the
market (in monetary terms) across the five identified renewable technologies within SET
Plan KA ‘Performant renewables’.
Figure 3 Clean energy technology export volumes across various renewables-related categories, in-scope countries total (1000 USD)
Data Source: United Nations (2020)
23
4.2 Main developments and trend in the domestic value added content of exports
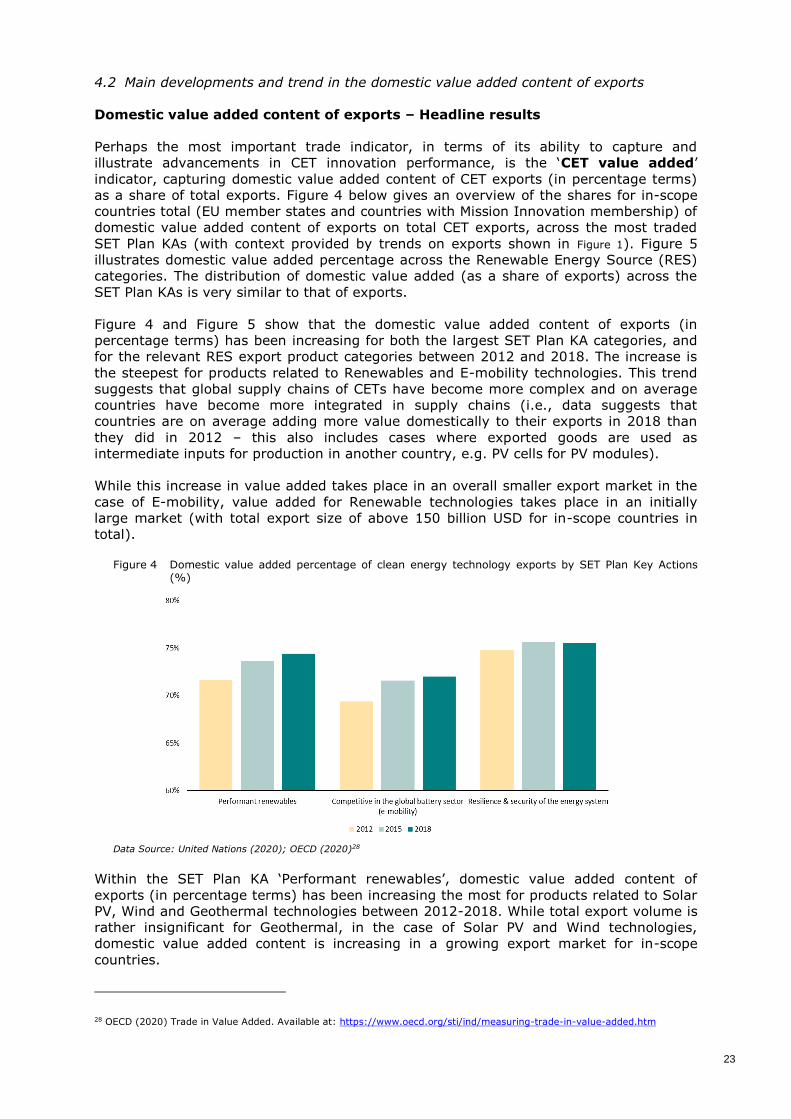
Domestic value added content of exports – Headline results
Perhaps the most important trade indicator, in terms of its ability to capture and
illustrate advancements in CET innovation performance, is the ‘CET value added’
indicator, capturing domestic value added content of CET exports (in percentage terms)
as a share of total exports. Figure 4 below gives an overview of the shares for in-scope
countries total (EU member states and countries with Mission Innovation membership) of
domestic value added content of exports on total CET exports, across the most traded
SET Plan KAs (with context provided by trends on exports shown in Figure 1). Figure 5
illustrates domestic value added percentage across the Renewable Energy Source (RES)
categories. The distribution of domestic value added (as a share of exports) across the
SET Plan KAs is very similar to that of exports.
Figure 4 and Figure 5 show that the domestic value added content of exports (in
percentage terms) has been increasing for both the largest SET Plan KA categories, and
for the relevant RES export product categories between 2012 and 2018. The increase is
the steepest for products related to Renewables and E-mobility technologies. This trend
suggests that global supply chains of CETs have become more complex and on average
countries have become more integrated in supply chains (i.e., data suggests that
countries are on average adding more value domestically to their exports in 2018 than
they did in 2012 – this also includes cases where exported goods are used as
intermediate inputs for production in another country, e.g. PV cells for PV modules).
While this increase in value added takes place in an overall smaller export market in the
case of E-mobility, value added for Renewable technologies takes place in an initially
large market (with total export size of above 150 billion USD for in-scope countries in
total).
Figure 4 Domestic value added percentage of clean energy technology exports by SET Plan Key Actions (%)
Data Source: United Nations (2020); OECD (2020)28
Within the SET Plan KA ‘Performant renewables’, domestic value added content of
exports (in percentage terms) has been increasing the most for products related to Solar
PV, Wind and Geothermal technologies between 2012-2018. While total export volume is
rather insignificant for Geothermal, in the case of Solar PV and Wind technologies,
domestic value added content is increasing in a growing export market for in-scope
countries.
28 OECD (2020) Trade in Value Added. Available at: https://www.oecd.org/sti/ind/measuring-trade-in-value-added.htm

24
Figure 5 Domestic value added percentage of renewables-related exports (%)
Data Source: United Nations (2020); OECD (2020)
The following chart (Figure 6) further zooms in compared to previous charts, and
presents the domestic value added content of exports across five identified categories
within ‘Performant renewables’ SET Plan KA: Solar PV, Solar Thermal, Geothermal,
Hydropower and Wind. The chart illustrates the relative importance of different
renewable technologies in traded goods across the years.
Of the five ‘Performant renewables’ identified in traded goods categories, Solar PV and
Wind are the two most important with regards to their share of domestic value added
content in total product exports, accounting for around 50 percent and 35 percent of
total exports respectively, the ratios being relatively unchanged across the years 2012-
2018. Domestically sold production of the same renewable-related trade products for EU-
27 countries has been decreasing across the same time period (from 50 000 M EUR to 41
000 M EUR). This is largely explained by much less available product-level trade data for
the later years (2016-2018) than for the years 2012-2015.
Figure 6 Domestic value added of clean energy technology exports across "Performant renewable technologies integrated in the system" (% of total)
Data Source: United Nations (2020); OECD (2020)

25
4.3 Analysis of trends for the European Union (EU-27)
A few important insights can be made with regards to EU-27 countries’ average
performance over the period 2012-2018 in the four indicators assessed.
First, changes in the distribution of CET domestic sold production across SET Plan KAs in
in-scope countries (EU-27 members and the UK) suggest that there is a tendency for
some of the categories to gain relative importance vis-á-vis other categories, primarily at
the expense of goods belonging to Performant renewables. However, it also needs to be
stressed that the methodology applied (i.e., assessing CET trade based on product-level
export data) implies that some of the product categories, while being highly relevant to
CETs, capture trade in products which are also relevant to trade in other energy
technologies applying to fossil fuels. The clearest example of this appears to be in CCS/U
where the relatively high performance is likely to relate to trade in the natural gas and
chemical industry, etc. However, the existence of exports in this sector may suggest the
capacity to take advantage of any future growth in CCS/U. In order to present an
accurate picture of the technologies vis-á-vis each other and to allow for proper
comparison, CCS/U figures have been excluded from the charts presented here (they are
included in the full Trade dataset).
EU-27 countries, on average, have increased their High-tech exports / Total exports (%)
ratio over the period covered: from an average 9.9% in 2012 to 10.9% in 2018, with the
underlying high-tech export volume increasing by 20% in the same period. The countries
with the largest percentage point increase in their High-tech exports / Total exports ratio
are Ireland (21.1% in 2012 and 32.9% in 2018) and Latvia (6% in 2012 and 12.5% in
2018).
With regards to the ratio of CET exports to GDP, the average for EU-27 countries has
slightly decreased (see Figure 7): from 0.8% in 2012 to 0.75% in 2018. The EU-27
average has largely stagnated for all specific SET Plan KAs, with minor changes over the
period. Ratios related to the SET Plan KAs ‘CCS/U’, ‘New materials & technologies for
buildings / Energy efficiency for industry’, and ‘New technologies & services for
consumers’ slightly increased over the period.
Figure 7 Exports / GDP ratio, SET Plan Key Actions total and per SET Plan Key Action, EU-27 average
Data Source: United Nations (2020); World Bank (2020)29
29 World Bank (2020) World Development Indicators - GDP. Available at: https://databank.worldbank.org/source/world-
development-indicators
26
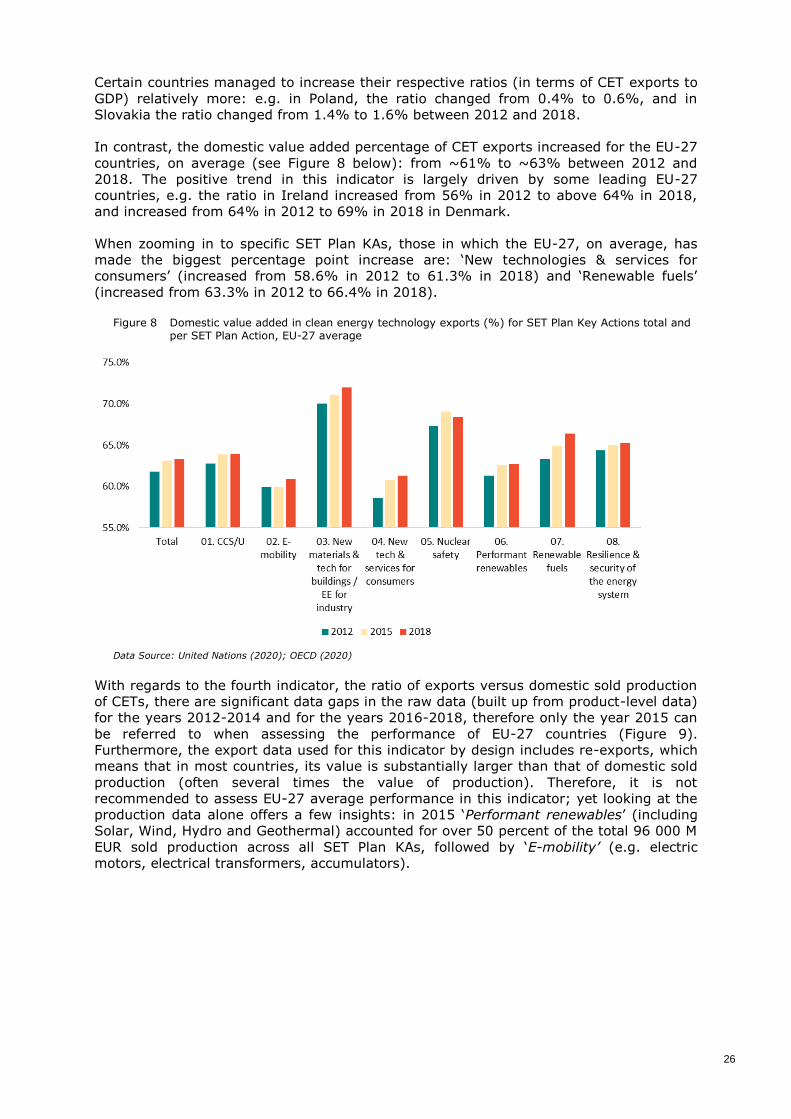
Certain countries managed to increase their respective ratios (in terms of CET exports to
GDP) relatively more: e.g. in Poland, the ratio changed from 0.4% to 0.6%, and in
Slovakia the ratio changed from 1.4% to 1.6% between 2012 and 2018.
In contrast, the domestic value added percentage of CET exports increased for the EU-27
countries, on average (see Figure 8 below): from ~61% to ~63% between 2012 and
2018. The positive trend in this indicator is largely driven by some leading EU-27
countries, e.g. the ratio in Ireland increased from 56% in 2012 to above 64% in 2018,
and increased from 64% in 2012 to 69% in 2018 in Denmark.
When zooming in to specific SET Plan KAs, those in which the EU-27, on average, has
made the biggest percentage point increase are: ‘New technologies & services for
consumers’ (increased from 58.6% in 2012 to 61.3% in 2018) and ‘Renewable fuels’
(increased from 63.3% in 2012 to 66.4% in 2018).
Figure 8 Domestic value added in clean energy technology exports (%) for SET Plan Key Actions total and per SET Plan Action, EU-27 average
Data Source: United Nations (2020); OECD (2020)
With regards to the fourth indicator, the ratio of exports versus domestic sold production
of CETs, there are significant data gaps in the raw data (built up from product-level data)
for the years 2012-2014 and for the years 2016-2018, therefore only the year 2015 can
be referred to when assessing the performance of EU-27 countries (Figure 9).
Furthermore, the export data used for this indicator by design includes re-exports, which
means that in most countries, its value is substantially larger than that of domestic sold
production (often several times the value of production). Therefore, it is not
recommended to assess EU-27 average performance in this indicator; yet looking at the
production data alone offers a few insights: in 2015 ‘Performant renewables’ (including
Solar, Wind, Hydro and Geothermal) accounted for over 50 percent of the total 96 000 M
EUR sold production across all SET Plan KAs, followed by ‘E-mobility’ (e.g. electric
motors, electrical transformers, accumulators).

27
Figure 9 Clean energy technology domestic sold production by SET Plan Key Actions, % of total, 2015
Data Source: Eurostat (2020b)30
4.4 Key developments by countries: world players and top EU-27 countries
The following sections illustrate the development of countries classified as ‘world players’
(China, Japan, South Korea, United States and EU-27) in the four indicators of interest
over the period covered. For all the indicators, the performance of the ‘top EU-27 players’
(based on their average performance value across the years) is also presented. In order
to control for the extreme differences in scale (which would otherwise not allow for a
proper comparison of countries’ performance) the group of the ‘top EU players’ have
been selected from a subset of countries, including the sufficiently large EU countries
only (in terms of total export volume). The following countries fall in the bottom 20% in
terms of 2018 export volumes, and have not been considered for the major EU countries
subset: Croatia, Cyprus, Estonia, Latvia, Luxembourg, Malta.
4.4.1 Indicator 1. High-tech exports / Total exports31
In terms of high-tech product exports32, South Korea has clearly made great progress to
become the top amongst world player countries (with a share of high-tech product
exports of total exports above 30%), followed by China, Japan, and the US (Figure 10).
The top EU-27 country on this measure is Ireland (also above 30% - most likely due to
the tax regime providing advantageous conditions for IT companies and products in
Ireland33), followed by France and Czechia (both scoring higher than Japan or the US
from the world players) (Figure 11).
While the overall high-tech export volume of Czechia is about a quarter of the size of the
exports of France, its high-tech to total export ratio is very similar, largely driven by a
high share of products related to ‘Electronics’ and ‘Telecommunication’ within total
exports. Central- and Eastern European countries’ economies can be seen as becoming
more and more export-oriented across the years, with increasing export volumes in both
high-technology products and CET exports. The performance of Czechia in this indicator
30 Eurostat (2020b) Statistics on the production of manufactured goods (prodcom). Available at:
https://ec.europa.eu/eurostat/web/prodcom/data/database 31 It is to be noted that both high-tech exports and total exports cover total world exports, that is, intra- and extra-EU trade are
also accounted for in the calculation of the indicator - to be considered when assessing the performance of countries (Figure 1-
13). 32 According to 2018 data, the top eight countries in terms of High-tech export absolute volumes are (larger to smaller): China, Germany, US, South Korea, France, Japan, the Netherlands and the UK. Countries with the lowest absolute volumes are
(smaller to larger): Cyprus, Saudi Arabia, Chile, Luxembourg, Malta, Croatia, Latvia and Greece. The ranking order has
essentially been unchanged between 2012-2018, but the growth rates are substantial with 20% total export volume growth
from 2012 to 2018 (in-scope countries total), and certain countries growing even more (e.g. the UAE 2018 export volume is
seven times its 2012 export volume; also Latvia, Poland, Ireland and South Korea all demonstrate strong volume growth over
the period). 33 See e.g.: Keane, J (2020) Ireland stands by its iconic 12.5% tax rate as OECD races for reforms. CNBC online. Available at:
https://www.cnbc.com/2020/11/03/ireland-stands-by-its-corporate-tax-rate-as-oecd-races-for-reforms-.html

28
provides a good example of typical trends. Overall, EU member countries have relatively
low high-tech export ratios, with the average being around 10% of total exports, while
countries in the Rest of the World score relatively lower across all years, stagnating at
around 4-5% of total exports. All in-scope countries, on average, score 10.7% in this
indicator in the year 2018.
Figure 10 High-tech exports / Total exports (%) across world players, EU-27 average, Mission Innovation countries’ average and Rest of the World average
Data Source: United Nations (2020)
Figure 11 High-tech exports / Total exports (%) across top five EU-27 countries
Data Source: United Nations (2020)
4.4.2 Indicator 2. Clean energy technology exports / GDP
This indicator (ratio of CET exports34 vs GDP) reflects the relative significance of CET
exports in a specific country’s economy, measured against its GDP (thereby reflecting the
country’s “economic scale”, which is likely to be correlated with the RD&I “resources”
34 According to 2018 data, the top eight countries in terms of CET export absolute volumes are (larger to smaller): China,
Germany, US, Japan, Italy, South Korea, France and the Netherlands. Countries with the lowest absolute volumes are (smaller
to larger): Cyprus, Malta, Chile, Latvia, Luxembourg, Saudi Arabia, Greece and Lithuania. The ranking order has essentially
been unchanged between 2012-2018, similar to total export volumes (in-scope countries total), while some countries
demonstrate strong volume growth over the period, e.g.: the 2018 UAE export volume is five times its 2012 volume, while
Poland, Romania and Portugal are also seen to have increased their absolute volumes considerably (30-50% between 2012 and
2018).

29
(RD&I investments, research personnel, subsidies) deployed to commercialise results of
R&D and innovation in international markets).
Amongst “world players”, in 2018 the US had the highest value of CET exports to GDP
(about 1%), followed by the EU (0.8%), South Korea (0.6%), Japan (0.4%) and China
(0.3%). Figure 12 below suggest that while most of the world players (e.g. the US or
South Korea) tend to show declining tendency in their CET export vs. GDP ratio across
the period investigated (2012-2018), the performance of EU countries on average has
partially recovered from 2015 to 2018, reaching around 0.8% by 2018, following a
decline between 2012 and 2015. The EU-27 average outperforms Mission Innovation
members’ average in all the years; while the Rest of the World countries, on average,
have a relatively low score in this dimension.
Figure 12 Clean energy technology exports / GDP ratio across world players, EU-27 average and Mission Innovation countries' average
Data Source: United Nations (2020); World Bank (2020)
Country ranking per SET Plan Key Action
Figure 13 below presents the top five country scores in terms of export / GDP ratio for
each of the identified SET Plan KAs, based on 2018 data (SET Plan KAs displayed in
alphabetic order). The chart shows that the percentages fall between 0 to 1.6%. To note,
out of the 40 countries ranked in Figure 13 across the 8 Set Plan KAs, 35 are EU
members. With regards to specific SET Plan KAs, individual countries have the lowest,
essentially zero percentages related to Nuclear Safety product exports, while Performant
renewables prove to be the most relevant SET Plan KA category in terms of product
exports compared to country GDP. An important insight from the chart is that Central-
and Eastern European (CEE) countries (e.g. Slovakia, Hungary, Czechia, Slovenia) tend
to appear in relation to almost all SET Plan KAs – which illustrates that these countries
are often relatively small, export-oriented countries where the contribution of export to
GDP is substantial, and the countries are considered to be strongly integrated in global
supply chains. These countries also tend to have relatively high scores in indicator 1, in
High-tech export to Total export ratio, too (10-18%). At the same time, larger countries
are not well represented in these rankings per SET Plan KA.
30
Figure 13 Exports / GDP ratio per SET Plan Key Actions, top five countries, 2018
Data Source: United Nations (2020); World Bank (2020)
Performance of EU-27 countries
The top EU-27 countries score between 1 and 2 in this indicator, the top players being
Slovenia, Denmark and Slovakia in the year 2018. Exports of Denmark and Slovakia are
largely driven by Performant renewable products (and within that, mostly Wind in the
case of Denmark and Wind and Solar PV in the case of Slovakia), while Slovenia’s CET
exports are dominated by products related to E-mobility. Data Source: United Nations
(2020); World Bank (2020)
presents the ranking of EU-27 countries in this indicator across the years (ordered by
2018 values).
Table 6 Clean energy technology exports / GDP ratio in EU-27 countries, 2012 to 2018
Country 2012 2015 2018
Slovenia 2.1% 1.8% 2.2%
Denmark 2.2% 2.2% 2.0%
Slovakia 1.4% 1.2% 1.6%
Hungary 1.6% 1.3% 1.4%
Czechia 1.3% 1.0% 1.2%
Netherlands 1.1% 0.9% 1.0%
Belgium 1.4% 0.9% 1.0%
Finland 1.0% 1.0% 0.9%
Austria 1.0% 0.9% 0.9%
Germany 1.1% 0.8% 0.9%
Sweden 1.0% 0.8% 0.8%
Italy 0.7% 0.7% 0.7%
Poland 0.4% 0.5% 0.6%
Bulgaria 0.5% 0.4% 0.5%

31
Country 2012 2015 2018
Portugal 0.4% 0.4% 0.5%
Romania 0.4% 0.4% 0.5%
Lithuania 0.3% 0.4% 0.4%
France 0.5% 0.4% 0.4%
Spain 0.4% 0.3% 0.4%
Latvia 0.2% 0.2% 0.2%
Ireland 0.3% 0.3% 0.1%
Greece 0.1% 0.1% 0.1%
Data Source: United Nations (2020); World Bank (2020)
4.4.3 Indicator 3. Domestic value added content in Clean energy technology exports /
Clean energy technology exports
Domestic value added content of the exported products classified as CET-related
products35, aggregated, is relatively high, but largely stagnating for world-player
countries across the years; but while the top performer (Japan) achieves around 90%, it
is much smaller and ‘only’ around 60% for the EU-27 average (Figure 14). In the case of
Japan, the high score is largely driven by the high share of ‘Machinery and equipment’
products, the domestic value added content of which, in the case of Japan is around 87-
89% in all the years. Several potential explanations can be made to explain this
performance, e.g. the domestic labour market (including regulations) may provide Japan
with a competitive advantage compared to neighbouring countries, or Japan may have a
much more effective industrial strategy aimed at maximising local content of exported
products. As a result, Japan’s integrated supply chain that allows the country to excel in
terms of local value added for this broad product category. The same metric for the US is
only around 80% in 2018, and is lower for the top EU countries (e.g. 72% in France and
78% in Germany).
Figure 14 Domestic value added in clean energy technology exports (%) across world players, EU-27 average and Mission Innovation countries' average36
35 According to 2018 data, the top eight countries in terms of CET value added in export, absolute volumes is the same set of
countries as in the case of CET export volumes (top countries, larger to smaller): China, Germany, US, Japan, Italy, South
Korea, France and the Netherlands. The ranking order has essentially been unchanged between 2012-2018, the only change in the top countries has been in that in 2012 UK was included as the eight, in volume terms, and not the Netherlands. 36 Unlike in the case of Indicator 1 and 2, Rest of the World average has not been calculated for Indicator 3 for two reasons.
First and most importantly, the OECD’s Trade in Value Added dataset covers only 64 selected economies (while the data
sources for Indicator 1 and 2 cover a much broader set of countries), thus the Rest of the World average could not be
calculated in a consistent way across indicators, and therefore would not provide a proper comparison to in-scope countries in
the dimension of Indicator 3, either. Second, domestic value added content of exports indicator needs to be calculated on a
country-by-country basis, followed by process of aggregation and calculation of average values for each years, the calculation
of which for the Rest of the World category is out of the scope of the current study.

32
Data Source: United Nations (2020); OECD (2020)
For some of the key EU countries, the domestic value added share of exports is the
highest for the product category ‘Other non-metallic mineral products’, which primarily
includes products related to the SET Plan KA ‘New materials & technologies for buildings’
and ‘Energy efficiency for industry’ (above 80%) – suggesting that leading EU countries’
economies tend to focus on having higher domestic value added in these product
categories.
Compared to world players, there is much less volatility amongst the top countries of the
EU-27 and the United Kingdom: Germany, Romania, United Kingdom, France and Spain
(in descending order by 2018 indicator value) all score between 70-75% in all the years
(Figure 15). Out of these countries, France and the United Kingdom also perform
amongst the top countries of the EU-27 and the United Kingdom in terms of high-tech
export ratio (Indicator 1), thereby reflecting an overall more sophisticated and developed
export market with large domestic value added at the same time.
Figure 15 Domestic value added in clean energy technology exports (%) across top five EU-27 countries
Data Source: United Nations (2020); OECD (2020)
4.4.4 Indicator 4. CET export vs production: Clean energy technology exports / Clean
energy technology domestic sold production (%)
Indicator 4 was calculated to reflect the share of CET exports vis-á-vis domestically sold
production. For the sake of consistency, the indicator was calculated using data on export
and on domestically sold production from the same data source, the PRODCOM dataset
(described in more detail above). As the export data used in the PRODCOM dataset
includes re-exports, in most countries, its value is substantially larger than that of

33
domestic sold production (often several times the value of production). There are
significant data gaps in the raw data (built up from product-level data) for the years
2012-2014 and for the years 2016-2018. For this reason, only the year 2015 is
suggested to be referred to when comparing country performance, and the indicator is
not suggested for inclusion in the CEII, as it only provides additional insight in terms of
individual countries’ performance in CET innovation. Figure 16 below presents data for
EU-27 countries, for the year 2015, excluding countries for which the export and/or
production dataset was incomplete even for the year 2015 (Ireland, Cyprus,
Luxembourg, Malta). There is clearly a volume size difference between the best and
worst performing countries; and while the aggregate indicator captures country
performance in one figure, it is often the case that individual SET Plan KA categories
within a given country have different export / production ratios than the aggregate
category. For example, the indicator for the Netherlands is primarily driven by large
‘Performant renewables’ and ‘E-mobility’ product export volumes. At the same time,
while the local production of ‘Renewable fuels’ is the second most important production
category, it does not shape the indicator to a large extent due to relatively low export
volumes. The performance of the Netherlands is likely to be primarily explained by the
phenomena of the ‘Rotterdam effect’37, that is, by quasi-transit trade, in which goods
arriving to the Netherlands as extra-EU imports and dispatched from the Netherlands to
other EU member states (the actual destination) are accounted for as exports made by
the Netherlands. The phenomena of quasi-transit is known to have a greater impact on
imports, but exports are also affected, as Figure 16 below illustrates.
Figure 16 Clean energy technology exports vs domestic sold production (%) across EU-27 countries, 2015
Data Source: United Nations (2020); Eurostat (2020b)
37 European Commission (2020e) International Trade in Goods: Frequently Asked Questions. Available at:
https://ec.europa.eu/eurostat/web/international-trade-in-goods/faq

34
5 Conclusions and Recommendations
In the first part of this report, we identified three potentially suitable indicators for
inclusion in the Clean Energy Innovation Index (CEII), to capture the perspective of trade
in clean energy technology (CET): High-tech export (High-tech exports / Total exports),
CET export vs GDP (Clean energy technology exports / GDP) and CET export value added
(Domestic value added content in Clean energy technology exports / Clean energy
technology exports). A more detailed assessment was performed for these three
indicators, which aimed to better understand the merits of including each in the CEII and
to provide insight into innovation performance from the perspective of trade.
The assessment of the three indicators revealed that there are five world players in terms
of CET export volume as a percentage of total country GDP. For all SET plan key actions
in aggregate, these are (starting from the largest ratio): the US, EU, Korea, Japan and
China. Together, these countries/regions account for more than 88% of all exports within
the scope of SET plan key actions.
The following four SET plan key actions account for the majority (~90%) of CET export
volumes:
Performant renewables.
CCS/U.
Competitive in the global battery sector (e-mobility).
Resilience & security of the energy system.
It should be stressed that the methodology applied (i.e., assessing CET trade based on
product-level export data) implies that some of the product categories, while being highly
relevant to CETs, capture trade in products which are also relevant to other energy
technologies. The clearest example of this appears to be CCS/U, where the relatively high
share in CET exports is likely to relate to trade in products related to the natural gas and
chemical industry, etc. Nevertheless, the existence of exports in this sector suggests the
capacity to take advantage of any future growth in CCS/U. If the CCS/U-related product
export volumes are excluded the other three SET plan actions account for around 92% of
total CET export volumes in each year.
The CET export value added indicator provides additional insights on who the most
specialised players are, in terms of domestic value added to exports. Based on 2018
ratios, Japan has the highest domestic value added percentage in all the three of the
most important SET plan actions: renewables (88%), batteries (86%) and energy system
security (89%). Japan is closely followed by the US in the renewables and the battery
categories. Several potential explanations can be made to explain this performance, e.g.
the domestic labour market (including regulations) may provide Japan with a competitive
advantage compared to neighbouring countries, or Japan may have a much more
effective industrial strategy allowing it to maximise the local content of exported
products. For EU countries, the same ratio is lower, with an EU-27 average of around
60%. This means that EU exports of CETs have, on average, a higher percentage of
imported intermediate products or other inputs.
Overall, we conclude that all three indicators (High-tech export, CET exports, and CET
export value added) provide different and complementary insights and therefore have
added value. However, as the first indicator (High-tech export), is only available at the
country level, but cannot be further computed by the specific Set Plan KAs, it is only
included in the dashboard supporting the CEII, and we recommend that only the other
two indicators are included in the CEII.
35
References
European Commission (2015) Communication from the Commission - Towards an integrated Strategic Energy Technology Plan: Accelerating the European energy system transformation.
C(2015) 6317 final. Available at: https://ec.europa.eu/energy/sites/ener/files/publication/Complete-A4-setplan.pdf
Eurostat (2017) Statistics on production of manufactured goods (PRODCOM). Available at: https://ec.europa.eu/eurostat/documents/120432/4433294/europroms-user-guide.pdf
European Commission (2019) European Innovation Scorecard – Main report. Available at: https://ec.europa.eu/docsroom/documents/38781
Eurostat (2020a) Eurostat indicators on High-tech industry and Knowledge – intensive services -
Annex 5: High-tech aggregation of products by SITC Rev.4. https://ec.europa.eu/eurostat/cache/metadata/Annexes/htec_esms_an5.pdf
Eurostat (2020b) Statistics on the production of manufactured goods (prodcom). Available at:
https://ec.europa.eu/eurostat/web/prodcom/data/database
Eurostat (2020c) RAMON - Reference and Management of Nomenclatures. Available at: https://ec.europa.eu/eurostat/ramon/index.cfm?TargetUrl=DSP_PUB_WELC
Eurostat (2020d) Glossary:High-tech. Available at: https://ec.europa.eu/eurostat/statistics-
explained/index.php/Glossary:High-tech
European Commission (2020e) International Trade in Goods: Frequently Asked Questions. Available at: https://ec.europa.eu/eurostat/web/international-trade-in-goods/faq
Fiorini, A et al (2017) Monitoring R&I in Low-Carbon Energy Technologies. Methodology for the R&I indicators in the States of the Energy Union Report – 2016 edition. EUR 28446 EN. doi: 10.2760/447418
International Trade Centre (na) Trade Competitiveness Map – Trade Performance Index. Technical
notes. https://tradecompetitivenessmap.intracen.org/Documents/TradeCompMap-Trade%20Performance%20Index-Technical%20Notes-EN.pdf
Jacob, A – Møller, M K (2017) Policy landscape of trade in environmental goods and services. ARTNeT Working Paper Series No. 166, April 2017, Bangkok, ESCAP. Available at: https://www.unescap.org/sites/default/files/AWP%20No.%20166.pdf
Keane, J (2020) Ireland stands by its iconic 12.5% tax rate as OECD races for reforms. CNBC
online. Available at: https://www.cnbc.com/2020/11/03/ireland-stands-by-its-corporate-tax-rate-as-oecd-races-for-reforms-.html
OECD (2020) Trade in Value Added. Available at: https://www.oecd.org/sti/ind/measuring-trade-in-value-added.htm
Pasimeni, F (2017) EU energy technology trade: Import and export. EUR 28652 EN, Publications Office of the European Union, Luxembourg, 2017, ISBN 978-92-79-69670-1, doi:10.2760/607980, JRC107048.
Read, E A (2019) The technology transfer reality behind Costa Rica’s renewable Electricity. EKHS34 Master’s Thesis, Lund University, School of Economics and Management, Sweden. Available at: http://lup.lub.lu.se/luur/download?func=downloadFile&recordOId=8993611&fileOId=8993612
United Nations (2020) UN Comtrade Database. Available at: https://comtrade.un.org/
United Nations (2020) Classifications on Economic Statistics. Available at: http://unstats.un.org/unsd/cr/registry

36
Vertesy, D (2017) The Innovation Output Indicator 2017. Methodology Report, EUR 28876 EN,
Publications Office of the European Union, Luxembourg, 2017, ISBN 978-92-79-76474-5, doi:10.2760/971852, JRC108942.
https://publications.jrc.ec.europa.eu/repository/bitstream/JRC108942/jrc108942_ioi_2017_report_final.pdf
Wind, I (2010) HS Codes and the Renewable Energy Sector. International Centre for Trade and Sustainable Development. Available at: https://www.files.ethz.ch/isn/111414/2010_01_hs-codes-
and-the-renewable-energy-sector.pdf
Wind, I (2010) HS Codes and the Transport Sector. International Centre for Trade and Sustainable Development. Available at: https://www.files.ethz.ch/isn/139135/hs-code-study-transport.pdf
World Bank (2020) World Development Indicators - GDP. Available at: https://databank.worldbank.org/source/world-development-indicators
World Energy Council (2010) Proposed list of goods for inclusion under the Environmental Goods Agreement (EGA). Available at:
https://www.worldenergy.org/assets/images/imported/2012/09/20100914_wec_envtl_goods_list.pdf

Getting in touch with the EU
IN PERSON All over the European Union there are hundreds of Europe Direct information centres.
You can find the address of the centre nearest you at: https://europa.eu/european-union/contact_en
ON THE PHONE OR BY EMAIL Europe Direct is a service that answers your questions about the European Union.
You can contact this service: – by freephone: 00 800 6 7 8 9 10 11 (certain operators may charge for these calls),
– at the following standard number: +32 22999696, or
– by email via: https://europa.eu/european-union/contact_en
Finding information about the EU
ONLINE Information about the European Union in all the official languages of the EU is available on the Europa
website at: https://europa.eu/european-union/index_en
EU PUBLICATIONS You can download or order free and priced EU publications from:
https://op.europa.eu/en/publications. Multiple copies of free publications may be obtained by
contacting Europe Direct or your local information centre (see https://europa.eu/european-
union/contact_en)
EU LAW AND RELATED DOCUMENTS For access to legal information from the EU, including all EU law since 1952 in all the official language versions, go to EUR-Lex at: http://eur-lex.europa.eu
OPEN DATA FROM THE EU The EU Open Data Portal (http://data.europa.eu/euodp/en) provides access to datasets from the EU.
Data can be downloaded and reused for free, for both commercial and non-commercial purposes.

The Clean Energy Innovation Index (CEII) is a composite index
designed to track progress in achieving the SET Plan key actions,
as measured through the lens of scientific publications, patents
and trade. This report focuses on the trade aspect of the CEII. The
report provides details on the assessment of different trade-
indicators and selection of those most suitable ones for inclusion in
the composite indicator; insights on CET innovation performance
from the perspective of trade flows; and details on the trade
dataset for inclusion in composite indicator calculations.
Studies and reports