Trade and Migration in North America: The Role of...
34
1 Trade and Migration in North America: The Role of NAFTA James F. Hollifield Tower Center for Political Studies Department of Political Science and Thomas Osang Department of Economics Southern Methodist University Dallas, TX 75275 March 2006 JEL Classification: F1, F22 Abstract: This paper examines the impact of NAFTA on trade as well as migration flows between Mexico, Canada, and the United States. Several questions are being investigated: Can the increase in trade volume among NAFTA countries be attributed to the reduction in trade barriers since 1994? Is there evidence for a significant shift in the pattern of migration within North American since 1994? Is there evidence that observed changes in trade flows on the one hand and migration flows on the other are linked, and to what extent did NAFTA affect this potential link? Our findings point to a positive impact of NAFTA on aggregate trade flows between all three countries, and in particular between Mexico and the United States. However, at a more disaggregate level, NAFTA appears to have a positive trade impact on no more than half of the industries analyzed. With regard to legal migration, we do not find a noticeable NAFTA impact on long-term trends, while the short-run impact is more difficult to assess due to competing factors such as changes in immigration laws and business cycle patterns. Finally, there is little evidence for a positive or negative relationship between the change in trade flows and the change in legal migration patterns both before and after NAFTA went into effect.
Transcript of Trade and Migration in North America: The Role of...

1
Trade and Migration in North America: The Role of NAFTA
James F. Hollifield Tower Center for Political Studies Department of Political Science
and
Thomas Osang
Department of Economics
Southern Methodist University Dallas, TX 75275
March 2006
JEL Classification: F1, F22
Abstract: This paper examines the impact of NAFTA on trade as well as migration flows between Mexico, Canada, and the United States. Several questions are being investigated: Can the increase in trade volume among NAFTA countries be attributed to the reduction in trade barriers since 1994? Is there evidence for a significant shift in the pattern of migration within North American since 1994? Is there evidence that observed changes in trade flows on the one hand and migration flows on the other are linked, and to what extent did NAFTA affect this potential link? Our findings point to a positive impact of NAFTA on aggregate trade flows between all three countries, and in particular between Mexico and the United States. However, at a more disaggregate level, NAFTA appears to have a positive trade impact on no more than half of the industries analyzed. With regard to legal migration, we do not find a noticeable NAFTA impact on long-term trends, while the short-run impact is more difficult to assess due to competing factors such as changes in immigration laws and business cycle patterns. Finally, there is little evidence for a positive or negative relationship between the change in trade flows and the change in legal migration patterns both before and after NAFTA went into effect.

2
1. Introduction At the end of 2003, the North American Free Trade Agreement turned 10 years old. With two-thirds of its implementation period passed, one may ask whether NAFTA served its main purpose – to facilitate and strengthen the flow of goods and services between Canada, Mexico, and the United States. A related question concerns the impact NAFTA may have had on the flow of immigrants between its three member countries. After all, a commonly made assertion among those policy makers supporting NAFTA was that increased commercial relations in North-America, and in particular between the United States and Mexico, should and would reduce incentives for South-North migration both legal and illegal. The ten year anniversary of NAFTA brings up a third issue closely related to the previous two: has the process of trade liberalization set in motion by NAFTA improved the living standards of the 430 million people living in North-America. The public debate over the impact of NAFTA (and other trade agreements) often centers on non-informative and sometimes even misleading facts and figures. Proponents of NAFTA typically refer to the growth in the volume of trade, the rise in border-crossings, and the increase in jobs and income as evidence for the beneficial impact of NAFTA (see, for example, a recently produced pamphlet (Trade Facts, 2003) published by the Office of the United States Trade Representative). Critics of free trade agreements such as NAFTA, on the other side, point to equally information-void numbers showing the recent decline in jobs and output in select industries such as furniture, textiles, and steel and interpreting the observed decline as evidence for the adverse effects of NAFTA (see, for example, statements by the AFL-CIO Executive Council on NAFTA and similar agreements (After NAFTA, FTAA Could Bring More Disaster, 2002)). Simple changes in aggregate indicators are insufficient evidence for or against free trade agreements for at least three reasons: (1) Since economies are typically growing over time, we expect the volume of trade, employment, and income to grow as well; (2) For the last couple of decades, we observe a worldwide increase in the volume of exports and imports relative to gross domestic product (GDP), the so-called trade share. Therefore, a post-agreement rise in the trade share by itself cannot be used as evidence in support of trade agreements; (3) Both at the aggregate and disaggregate level factors other than trade agreements – such as changes in exchange rates, transport costs, and technological change, need to be controlled for before we can come to more definite conclusions about the impact of NAFTA and similar agreements. In this paper, we compare and contrast trade and migration indicators for pre- and post-NAFTA periods. To avoid some of the previously mentioned pitfalls, we construct trade and migration ratios rather than using levels. Next, to control for existing secular trends in this ratios we calculate the change of trade and migration ratios. Next, we construct average annual growth rates for both pre-and post-NAFTA periods. Finally, we compare the after-1994 with the pre-1994 average annual growth rate. Positive NAFTA effects on trade and migration are then consistent with a larger post-NAFTA annual growth rate (i.e., a positive growth between the two growth rates), while the reverse is true for smaller post-1994 growth rate. Where available, we compare our findings to multi-variate regression estimates from existing empirical studies. These more elaborate studies have the advantage that they can include factors not controlled for in our analysis that vary substantially between pre- and the post-NAFTA periods. Our findings point to a positive impact of NAFTA on aggregate trade flows between all three countries, and in particular between Mexico and the United States. However, at a more

3
disaggregate level, NAFTA appears to have a positive trade impact on no more than half of the industries analyzed. With regard to legal migration, we do not find a noticeable NAFTA impact on long-term trends, while the short-run impact is more difficult to assess due to competing factors such as changes in immigration laws and business cycle patterns. Finally, there is little evidence for a positive or negative relationship between the change in trade flows and the change in legal migration patterns both before and after NAFTA went into effect. 2. Impact of NAFTA – Literature Survey The empirical literature of the economic impact of NAFTA, and in particular on trade in goods and services, is only beginning to emerge. Recent econometric studies that examined the economic impact of trade agreements such as NAFTA include Frankel (1997), Gould (1998), Krueger (1999), Baier and Bergstrand (2001) Romalis (2001), Agama and Daniels (2003), and USITC (2003). These studies estimate models that relate trade measures (such as the growth in the volume of trade or the ratio of imports from a select country to overall imports) to a set of explanatory factors that vary from model to model. However, all specifications have in common that they include some direct or indirect measure of barriers to trade. The estimated coefficient on the trade-barrier variable can then be used to gauge the impact of a specific trade agreement on the chosen trade measure. It is fair to say that recent empirical studies of NAFTA produced somewhat mixed results with regard to the trade impact of NAFTA. While some show gains in the volume of regional trade among all Parties (Romalis, 2001), others find little evidence that NAFTA increased North American trade at the aggregate level at all (Krueger, 1999). In between these extremes are studies that find NAFTA to be effective in stimulating U.S. – Mexico trade in both directions, while leaving Canada-U.S. and Mexico-Canada trade essentially unchanged (USITC (1997, 2003); Gould (1998); Agama and McDaniel (2003)). The finding that NAFTA had little impact on Canada-U.S. trade may not be that surprising given that the two countries had already lowered or even eliminated many trade barriers before NAFTA became effective due to their bilateral free trade agreement (CUSFTA)1. 3. Changes in Trade Flows 3.1. Aggregate Change Figure 1 shows the ratio of total trade (sum of exports and imports) to GDP for the three NAFTA countries from 1965 to 2001. Clearly, there is more or less steady increase in the trade share in all countries. Interestingly, the share begins to rise more rapidly in Canada from 1992 onward and in Mexico after 1995. In contrast, the U.S. trade share shows no noticeable jump or change in slope throughout the nineties. Table 1 gives average annual growth rates of trade shares over the entire sample period (1965-2001) as well as for pre-NAFTA (1965-1993) and post-NAFTA (1994-2001) years. Notice first that the average annual growth rate of the trade share is quite similar across three countries, ranging from 2.3% in Canada to 2.7% in the U.S. with the Mexican rate in between these two at 2.5%. However, this similarity breaks down when we compare the two sub-periods. The U.S. trade share growth rate is twice as high during the pre-NAFTA period compared to the post-NAFTA period (3% versus 1.5%), while the opposite is true for both
1 For studies that analyze the impact of CUSFTA, see Trefler (2001) and Causing (2001).

4
Mexico and Canada. Both countries’ post-NAFTA growth rate is more than twice as high as the pre-NAFTA rate (4.7% versus 1.9% in Mexico, 3.9% versus 1.9% in Canada). Removal of the year 2001, characterized by a strong decline of trade flows relative to GDP in all three countries, produces an even more striking picture. During the 1994-2000 period, the Mexican trade share grew at an average rate 6.1% per year, more than three times its pre-NAFTA value, while the Canadian share grew at an annual rate of 5.2%, more than two and half times its pre-1994 rate. Without 2001, even the U.S. trade share grew at rate that was slightly above its pre-1994 value. Figures 2a-c show the time profile of U.S. exports, imports, and total trade with Mexico and Canada, relative to exports, imports, and total trade with all countries (including NAFTA partners) over the 1985-2003 period. Figure 2a and b clearly show the greater importance of the Canadian market for U.S. exports and imports with shares that exceed 14% in every period, while Mexican shares are typically below 10%. However, while Canadian export and import shares are mostly flat over time, the Mexican shares trend upward, with beginning values around 4% and ending values close to 10%. A similar pattern holds for the U.S. total trade shares with Canada and Mexico depicted in Figure (Figure 2c). The rise in the NAFTA total trade share (defined as U.S. exports and imports with both Canada and Mexico relative to U.S. exports and imports with all countries) from values that hover around 20% to values around 25% begins more or less at the time NAFTA came into effect. Table 2 provides further clarification on the issue. For the entire sample period from 1986 to 2003, U.S. import, export and total trade shares with Mexico grew at an average annual rate of 4%, while the corresponding rates with Canada are essentially zero or even slightly negative. A comparison of pre- with post-1994 annual rates reveals that U.S. export share with Mexico were unaffected by NAFTA, while import share growth almost doubled (from 2.4% pre to 5% post). Post-NAFTA export and import share growth rates with Canada are larger (positive or less negative) than pre-94 rates, but the difference is not very pronounced (an absolute change of +1.2% for the export share and +0.4% for the import share). Driven by the strong increase in imports from Mexico, the U.S. total trade share with NAFTA partners grew at an average annual rate of 1.4% post-1994, a seven-fold increase over the 0.2% annual growth rate from 1986 to 1993. Excluding the impact of the recent global recession, the post-NAFTA annual growth rate of the U.S. total trade share with Canada and Mexico is even more impressive at 2.7%. Our previous analysis fails to control for certain factors that influence trade shares such as exchange rate fluctuations and changes in transport costs. As long as average annual changes in these variables are similar over the pre-and post 1994 periods, our analysis is still valid even if we included these other factors. However, it is quite possible that the secular decline in transport costs may have accelerated since the mid-nineties, and the decline in the value of the peso against the dollar beginning with the 1994 peso crises is a well established fact. A simple empirical model that tries to capture tariff and other effects on trade is given in equation (1), taken from USITC (2003):
)/(/ MWorld
MMex
USWorld
USMex PPfMM = (1)
Equation (1) gives the ratio of imports of a particular product from a foreign country (say Mexico) by the U.S. to imports of that product from all countries as a function of the ratio between the Mexican and the world market price. Each import price itself is a function four components (see equation (2)): the actual price of the imported product ( *P ); the tariff applied to the imported product (T); the markup due to transport costs (TR); and the exchange rate that translates the foreign price into U.S. dollars (E).

5
),,,( * ETRTPfP M = (2) The empirical model that is actually estimated is often augmented by additional covariates such as the tariff level (to control for the fact that industries with high tariff barriers have smaller import share regardless of the relative tariff differential between Mexico and the world), a lagged dependent variable (to control for the fact that markets need time to adjust after a policy change occurred), and higher-level industry dummies (to control for unobserved industry heterogeneity). The results reported in USITC (2003) are reproduced in Table 3. The estimation results clearly indicate that tariff preference (defined as the tariff differential between the tariffs on world imports and the tariff on Mexican imports) had a positive and significant impact on U.S. imports from Mexico. Furthermore, this effect was even stronger in post-NAFTA years, just as expected from our previous analysis. Industries with high absolute tariff levels had lower import shares, as expected. This adverse relationship was slightly less pronounced in the post-NAFTA period. Transportation costs had the expected strong negative impact on Mexico’s import share, while lagged imports had small positive, though highly statistical significant impact on current import. An increase in the peso-dollar exchange rate, equivalent to a depreciation of the peso against the dollar makes Mexican imports relative cheaper and improves the Mexican import share. Similarly, a rise in the effective exchange rate makes world imports cheaper and thus lowers U.S. imports from Mexico. A higher Mexican export price lowers the Mexican share of the U.S. import market, as one would expect. The only unexpected sign of any coefficient estimate is the decline in the Mexican export share as the result of an increase in the world market price, perhaps the result of some interdependence between the world market and the Mexican market. Figures 3a-c depict the share of U.S. and Mexican merchandise imports and exports in the Canadian market for the period 1988-2001. The discrepancy between the importance of the Mexican versus the U.S. market for Canadian trade relations is evident and well known. However, for our purpose, changes over time are more important than cross-country differences in levels. While the percentage of Canadian exports to the U.S. market is rising steadily (from 70% in 1988 to more than 80% in 2001), the U.S. share of Canadian import market appears to be flat at best, with values between 60% and 70%. The opposite is true for Canada-Mexico trade relations. The Mexican share of the Canadian import market is rising steadily (from less than 1% in 88 to about 4% in 2001), but the share of Canadian exports going to Mexico is persistently less than 1% throughout the sample period. Therefore, increases in Canadian exports to the U.S. and Canadian imports from Mexico are what drives the changes in the Canada’s total trade share with NAFTA partners (Figure 3c). Table 4 provides the corresponding average annual growth rates for Canada’s trade shares. Between 88 and 01, Canada’s export share with the U.S. grew at annual rate of 1.5%, while the import share growth rate was slightly negative. As a result, the total trade share grew at a small positive annual rate of 0.7%. Clearly, NAFTA did not speed up the process of trade integration for Canada, with both import and export share growth lower during the post-1994 period. As a result, the annual growth rate the Canadian total trade share with the United States after 1994 was only half its previous value, falling from 1% per year to 0.5%. The results for trade share growth with Mexico are mixed. For the 94-01 period, the share of Canada’s export to Mexico grew at rate that was almost twice its pre-94 value (7.7% per year versus 4.3%). However, import share growth declined, from 13.9% per year pre-94 to 7% thereafter. As a result, the growth rate of Canada’s total trade share with Mexico also declined. With both post-94 growth rates lower than the pre-94 rates, it comes as no surprise that Canada’s total share growth with NAFTA partners was lower during the NAFTA period (0.6% compared to 1.1% from 88-93). were flat or even

6
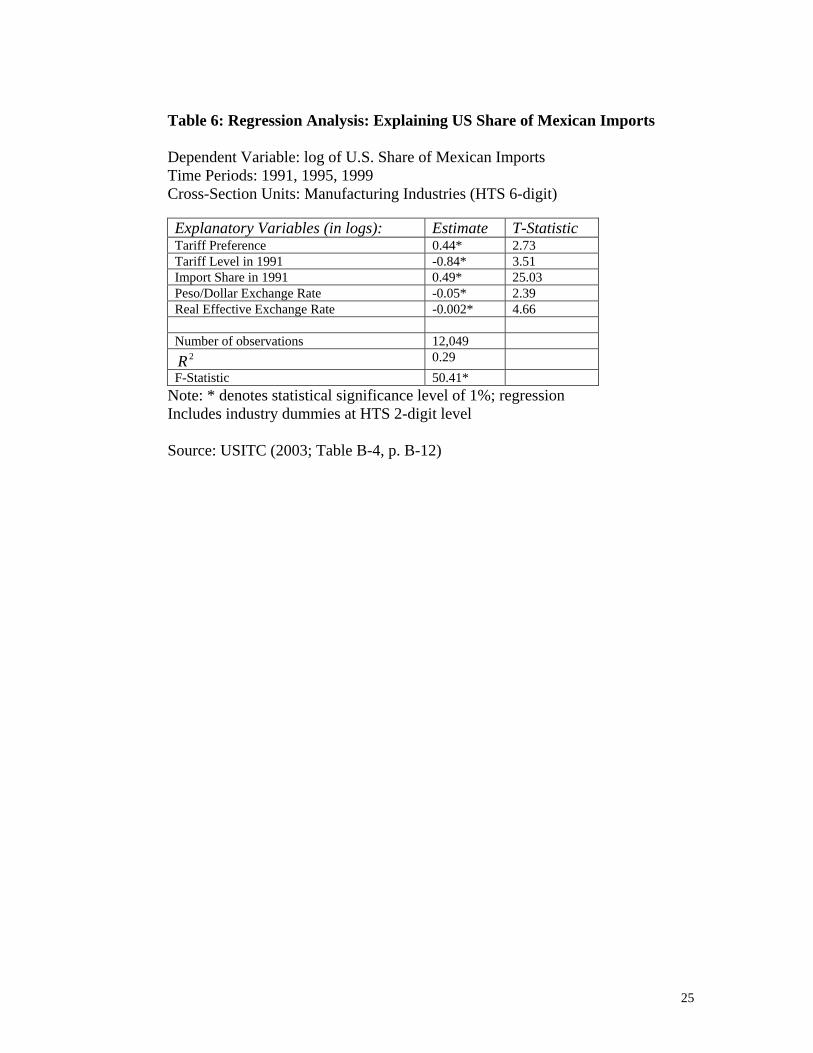
Figures 4a-c depict the pre-and post-NAFTA experience for Mexico in terms of changes in trade shares. As is the case with Canada, the importance of the U.S. market for Mexican exports and imports stands in strong contrast to the small size of the trade volume with Canada (unfortunately, data for trade in goods and services with Canada were only available from 1994 onward). Figures 4a and b indicate an inverse pattern for Mexico’s trade with the U.S.: while the share of Mexican goods exported to the U.S. market grew steadily (from 60% in 1985 to almost 80% in 2002), the U.S. share of the Mexican import market is more or less stable, with values between 50% and 60%. Thus, driven by export share growth, the Mexico’s NAFTA trade share is growing over time (Figure 4c). Data on annualized growth rates are given in Table 5. Both export and import share growth rates for U.S.-Mexican trade are higher during the 94-02 period, with export share growth at 0.8% per year prior to 94 and 2% afterwards. Import share growth rate are negative both before and after 1994, but the decline is somewhat smaller during the NAFTA period. In addition, if the recession years 2001-02 are excluded, the import growth rate is strongly positive, with a value of 1.1% per year. With regard to Canada, Mexico experienced a decline of 3.1% per year of the Canadian share of its export market in the post-94 period. In contrast, the share of Canadian imports in the Mexican import market grew by 5.5% annually between 94 and 02. Overall, total trade shares with the U.S. grew at 1.1% during the NAFTA period, compared to zero growth for the pre-NAFTA period. Mexico’s total trade with Canada and with both NAFTA partners grew at 0.9% and 1%, respectively, during the 94-02 period. Table 6 shows estimation results, reported in USITC (2003), explaining the determinants of the U.S. share of the Mexican import market. As in Table 3, only manufacturing industries at the 6-digit HTS level are considered. Due to data restrictions, only three time periods are being included in the sample: 1991, 1995, 1999. Also, data limitations restrict the number of covariates to 5 (in contrast to Table 3, transport costs and import prices variables are not included). Despite these shortcomings, Table 6 shows that after controlling for past tariff levels, past import shares, and exchange rate effects, higher relative tariffs on world imports increase the U.S. share of the Mexican market. Table 6 also explains why the U.S. market share in Mexico did not grow faster than 2.5 % between 91 and 99 despite substantial reductions in Mexican tariff rates on U.S. imports of about 10% over the same time period. Multiplying the estimated elasticity of the peso-dollar exchange rate of –0.05 by 230 (the % decline of the peso against the dollar during the 91-99 period) yields -11.5%. Thus, the peso devaluation took away 11.5% from the combined effect of tariff preference and lower tariff levels, leaving a total effect of 2.5%. 3.2. Sector-specific change While aggregate analysis of trade agreements is a natural first choice, a sector-specific approach is equally important to gain knowledge about the distribution of trade policy induced changes across industries. Following the USITC report (2003), we consider pre-and post NAFTA trade share indicators for 10 industries: Agriculture, forest and fishery products, chemical and allied products, energy and fuel products, minerals and metal products, transport equipment, textiles and apparel, machinery and electronic products, services, and misc. products. Tables 6a-c rank these 10 industries by the absolute change in the growth rate of NAFTA export, import and total trade shares for the U.S. between the 87-93 period and the 94-01 period. A positive sign indicates that the particular industries managed to accelerate the growth rate of its NAFTA trade share, while a negative sign implies the opposite. Table 6a shows that the industry with the strongest pre-to post NAFTA export growth gain was energy and fuel products (+18.95%), followed by minerals and metal products (+7%) and transport equipment (+4.4%). Interestingly, five industries had post-NAFTA period growth rates below pre-94 period averages,

7
with misc. products experiencing the strongest absolute % decline (-9.9%), followed by agriculture (-8.2%) and chemical and allied products (-4.1%). Surprisingly, the U.S. textiles and apparel industry, one of the “loser” industries according to AFL-CIO documents, was able to expand its NAFTA exports share at a faster pace in the post-94 period than in the previous period. Of the ten industries, only two (services and misc. products) had a NAFTA period export share growth rate that was negative (i.e., U.S. firms exported less services and misc. products to NAFTA partners relative to all countries in 2001 than in 1994). The results may indicate that trade liberalization in services (and misc. products) progressed at a faster pace outside of North America. Table 6b shows the corresponding ranking of U.S. industries by changes in the import share growth rate. Except for services, all industries experienced a positive average annual growth rate of import shares with NAFTA partners. However, the pace of the regional integration process slowed down in six of the ten industries during the NAFTA-period compared to the pre-NAFTA period. The strongest growth gain in the post-to pre NAFTA comparison occurred in machinery and electronic products (+3%) followed by forest and fishery (+1.5%) and services (+1.2%). On the other end of the distribution, the process of U.S. import integration with NAFTA partners slowed down most severely during the NAFTA period for textiles and apparel (-7.9%), agriculture (-6.1%) and transport and equipment (-4.9%). Table 6c ranks industries by changes in the growth rate of the total trade share. Only one industry (services) experienced a declining NAFTA total trade share during the NAFTA period, but seven industries saw a slow-down in growth during the 94-01 period. Forest and fishery products (+3.4%) saw the strongest acceleration of total trade share growth during the NAFTA years, while textiles and apparel saw the strongest slowdown (-10.5%). NAFTA trade, in particular with Canada, accounts for a substantial fraction of overall trade in U.S. forestry and fishery products. In 2001, more than four fifths of U.S. sector imports came from Canada and Mexico, and more than two fifths of U.S. exports went to NAFTA partners. In comparison, U.S. sector exports to Canada and Mexico accounted for slightly more than half of total exports in 1993, while sector imports from the two countries made up less than one third of total imports. This strong growth in sector trade with NAFTA partners stands in contrast to a decline in trade with non-NAFTA countries. Between 1993 and 2001, U.S. sector exports to Non-NAFTA countries declined by more than 50%, while imports fell by more than 20%. This diversion of trade flows cannot be explained by a change in U.S. tariff rates since rates were close to zero before NAFTA came into effect. With respect to exports, the U.S. textile and apparel industry is strongly NAFTA dependent with about half of total exports going to either Canada or Mexico in 2001. The picture is different for imports: less than one fifth of sector imports come from NAFTA countries. However, imports from NAFTA partners grew at more than twice the rate of exports to NAFTA partners between 1993 and 2001, mostly due to strong increases in apparel imports from Mexico. In contrast, the U.S textile industry has benefited from NAFTA by expanding exports to both Mexico and Canada, especially of high-quality textiles. The strong slowdown in total trade share growth during 1994-01 is in part the result of the extremely high growth rates of the pre-NAFTA period, where total trade share with NAFTA partners grew at average annual rate of 18.5%, far higher than for any other U.S. industry (mean reversion effect).

8
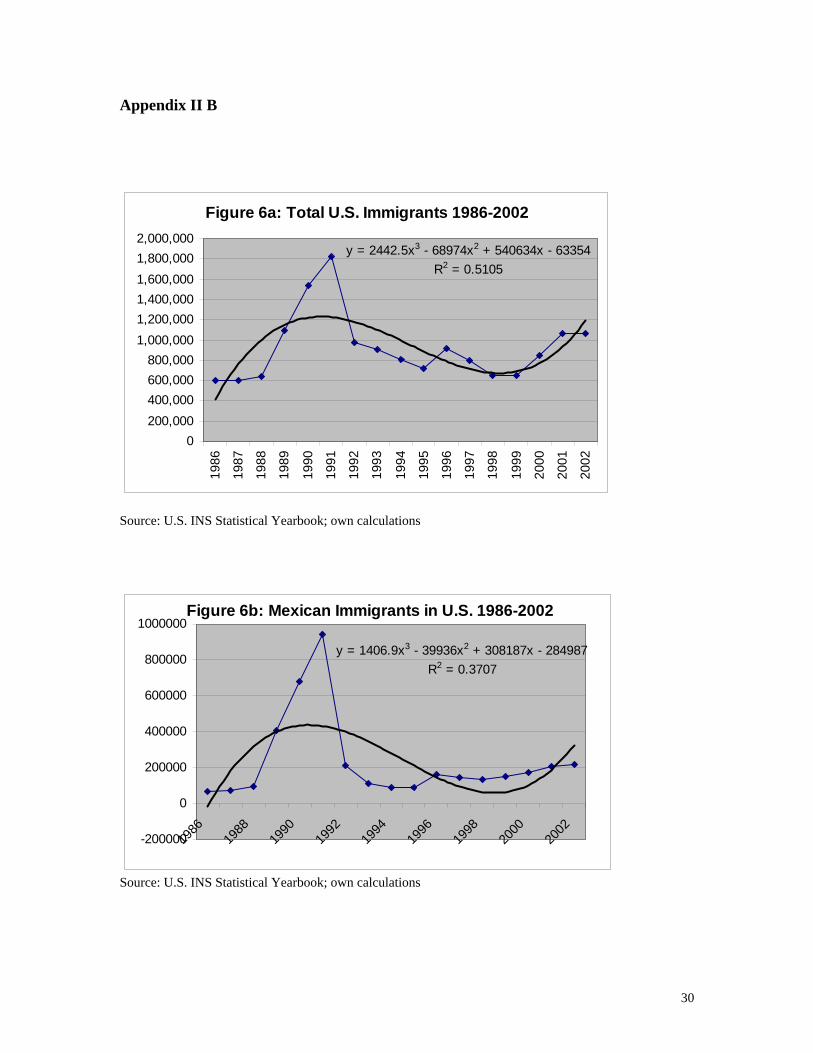
Changes in Migration Flows 4.1. Long-run Changes in Legal Immigration from Canada and Mexico to the US Figure 5a shows the time profile of the Canadian and Mexican share of all legal U.S. immigrants per decade for the period 1820 to 2000. Canadian immigration peaked in the decade between 1921 and 1930, reaching a share of 22.5%, but has been on a steady decline since. The share of Canadian and Mexican immigration to the US has changed dramatically in the last century and a half, with Canadians being far more important in the Third Wave from roughly the mid-nineteenth century until the end of the 1950s. Both Mexican and Canadian immigration to the US increased in the early twentieth century as steps were taken to halt the influx of Asians (Chinese Exclusion in 1882) and Europeans (World War I and the advent of the National Origins Quota system in 1924). In the last two decades of the 20th century, the Canadian immigration share was flat at 2.1%. In contrast, the Mexican share of U.S. immigrants was close to zero throughout the 19th century, but has been rising steadily, with one exception, since 1900. After a local peak of 11.2% in 1921-30, the Mexican immigrant share fell to 4.2% during the subsequent decade of international disintegration. Since then it has been rising in each decade reaching its all time high of 24.7% during the ‘90s. Adding up the Mexican and Canadian immigrant shares creates what could be called the “NAFTA” share of U.S. immigrants (Figure 5b). After reaching its all time high of close to 35% in 21-30, the “NAFTA” share has been rather stable - with the exception of the ‘60s – at a level around 25%. It is safe to say that Canada and Mexico became the most important sources of immigrant labor for the US as the two World Wars cut the US off from its traditional supplies of labor in Europe, and policy became increasingly restrictive in the 1920s (see Figure 5b). Even during the Great Depression, as immigration came to a near halt, Mexico and Canada remained important source countries. After World War II, with the Bracero program in full swing and the US economy booming, we see a reversal in the shares of Mexican and Canadian immigration to the US (see Figure 5a), with Mexico quickly surpassing Canada in the 1960s. Canadian shares fall to an almost negligible level in the 1970s as the source of immigrants began to diversify following passage of the Hart-Celler Act in 1965. By the 1980s, Asia had become increasingly important as a sending region, but as we can see from Figure 5c, the overall share of the Americas rises continually from the beginning to the end of the twentieth century. 4.2. Short-Run Change Focusing only on the Fourth Wave, particularly the decade or so pre- and post-Nafta, we see a sharp rise in total levels of legal immigration (Figure 6a) due to the IRCA legalization of 1986, and then the numbers stabilize around 1 million/year throughout the 1990s. What these trends do not capture, of course, are the levels of illegal immigration (the elephant in the room!), with Mexico being the predominant source country. Estimates are that approximately 300,000 unauthorized immigrants entered the country (or overstayed their visas) each year during this period. Given the relative short period of 6 years during which NAFTA may have had an impact on legal immigration flows (and the lack of reliable data on flows of illegals), it is too early to tell whether

9
a structural break occurred in the time series of the NAFTA share around in 19942. However, given the modest increase in the “NAFTA”-immigration share during the ‘90s, it seems unlikely at this point that NAFTA triggered such a structural break. Figure c supports this view. The “Americas” share of U.S. immigrants is the ratio of all U.S. immigrants from North, Central, and South America to all U.S. immigrants. In three of the last four decades, this share has been close to 50% (with a local trough in the ‘60s), a pattern that mirrors that of the “NAFTA” share. Thus, long-run immigration shares seem to follow a pattern that is not easily altered by regional free trade agreements. Figures 6a presents the short run time profile of total legal U.S. immigrants from 1986 to 2002. The cyclical nature of this flow of immigrants over the short run is made evident by the fitted third degree polynomial also shown in the graph. Clearly, U.S. immigration is on the rise after reaching a local trough in 1998-99, but immigration was rising even stronger from 1986 to 1991, mainly due the effect of IRCA (1986) that granted amnesty to illegal aliens in the United States. Figures 6b and c show a similar cyclical pattern for U.S. immigrants from Mexico and Canada, respectively. In both cases, third degree polynomials fit the observed pattern rather well. The main difference between Canadian and Mexican immigration to the U.S. occurred in the early 90s where Mexican illegal immigrants took advantage of the amnesty program, while Canadian immigration numbers were flat due to the lack of a large number of illegal Canadian immigrants. Figures 6d and e depict the share of Mexican and Canadian immigrants among U.S. immigrants from 1986 to 2002. For Mexican immigration shares, we observe the same cyclical pattern that we find for immigration levels, both overall and for Mexico. This indicates that while Mexican immigration patterns are in line with overall immigration flows, the number of Mexican immigrants seems to fluctuate more than overall immigration. As a result, the share of Mexican immigrants went from a low near 10% in 1986 to a maximum of more than 50% in 1991 to a low of another low near 10% in 1994 before settling around its current 20% level. Again, it is important to keep in mind that we are looking only at legal immigration from Mexico. The Canadian immigration share displays an altogether different pattern. First of all, it is more stable than the Mexican share varying mostly between 1% and 2% of overall U.S. immigration. Secondly, it reached a overall minimum in 1991 with a value close to 0.5%. Finally, there are three local maxima in 1987, in 1994, and in 2001, all of them near the 2% mark. Thus fitted 4th order polynomial is mostly flat after 1994, with a small increase after 1999. As with long-term analysis, it is difficult to tell whether NAFTA caused a structural break in pattern of Mexican and Canadian immigration to the United States. However, given the relative modest changes we observe since 1994 compared to the pre-94 period, it appears that changes in immigration policies such as the amnesty program of the late ‘80s are more likely candidates for break points than the implementation of NAFTA in 1994. Table 8 compares pre- and post-NAFTA annual average growth rates of immigration shares for Mexico, Canada, and NAFTA. All immigration shares grew at positive rate from 86-02, with Mexico’s immigration share growth rate of 11.2% almost three times as high as that of Canada (4.2%). During the pre-NAFTA period (1986-93), Mexico’s immigration share grew at an annual
2 Note that parametric tests for structural tests such CUSUM (Brown at al, 1975) have typically low power against local shifts of parameters in small samples. Bayesian flat prior tests for an unknown structural break (Kim, 1991) have relatively good small sample properties, but the reliability of the test is poor at the sample border (the case of testing for a NAFTA-induced structural break).

10
rate of almost 17%, compared to rate of almost 7% during the post-94 period. A similar pattern emerges for Canada – strong average growth rates of the immigration share between 86 and 93 (8.5%) compared to anemic growth thereafter (0.8%). Growth of the NAFTA immigration share follows the pattern of the Canadian and Mexican shares , with average annual growth rates almost three times higher during the pre-NAFTA period. While the results in Table 8 do not rule out that NAFTA played a positive role in stimulating Canadian and Mexican immigration shares due to the lack of controls for other determinants of migration flows such as changes in immigration laws, changes in transport costs, business cycle effects, it seems unlikely that controlling for these factors would reverse our principal finding that so far NAFTA had no discernable influence on migration trends in North-America. What about the contemporaneous relationship between trade and migration? Figure 7a shows a scatter plot of the growth rate of the Mexican share of U.S. immigrants against the growth rate of the Mexican trade share in total U.S. trade. Figure 7b does the same for Canada. If changes in immigration shares and changes in trade shares were strongly correlated, we would expect all data points to be located in the upper right and lower left quadrant. However, the two graphs reveal that there is no clear pattern in the scatter plot since observations are distributed across all four quadrants. Table 8 confirms this result. First, the correlation coefficient for the 85-02 period is small (0.19 for Mexico and 0.09 for Canada). Second, while the estimated bivariate relationship between trade and immigration share growth is positive, it is not significantly different from 0. Did NAFTA change this non-relationship? Clearly not, as Table 8 reveals. Neither during the pre-1994 nor during the post-94 period was there a statistically significant positive correlation between these two growth rates. In addition, in the case of Canada, the correlation was even negative during the post-94 period, though again not significant. While it is possible that a multi-variate approach could come to a different conclusion, it seems unlikely that this would happen given the weakness of the bivariate correlation. 5. Winners and Losers: the Impact of Nafta on Growth, Illegal Immigration, and Income Inequality in Mexico As shown in section 3, Nafta has had a significant, positive effect on the volume of trade between Mexico and the US, reinforcing pre-existing trends. Moreover in section 4 we find no discernible impact on levels of legal immigration from Mexico. Nonetheless, Philip Martin (2004) predicts that increased economic integration will lead to a “migration hump,” where emigration from Mexico will increase rapidly in the short to medium term, then fall just as quickly as factor-prices begin to equalize. Another way of stating this “hump argument” is that trade and migration are complements in the short term, but substitutes in the long term. While these two findings appear contradictory, they can be reconciled if we take into account the potentially important impact of illegal immigration. Our working hypothesis is that illegal immigration is more sensitive to wage or income inequalities than legal immigration. Inequalities both within and between the three Nafta countries, especially Mexico and the US, are likely to grow with the initial integration of factor markets, which will provoke shifts in comparative advantage, followed by a rapid cycle of industrialization in some regions, especially along the US-Mexican border, and a rural exodus from very poor agricultural areas in central and southern Mexico. The logical way for markets to adjust (clear) is for unskilled workers, particularly farmers leaving the agricultural sector in Mexico, to move to the cities, especially the

11
capitol, Mexico City, then to the border areas, and on to the US. In this scenario, migration, most of it illegal, will play a much larger role in factor-price equalization than will trade (Hatton and Williamson, 1998). This out-migration of unskilled workers will cause wages to rise for the unskilled in Mexico, while wages for the unskilled in the US will fall. The migrants themselves will see their incomes rise, and those left behind in Mexico will be compensated by higher wages and remittances. Critics of Nafta (and free trade agreements more generally) argue that it will lead to a “race to the bottom,” as wages for the least skilled fall. But this is not the case for workers in the sending country (Mexico). Those most heavily affected will be unskilled workers in unskilled, labor-intensive sectors (such as textiles and apparel and agriculture, see above) in the receiving countries (US and Canada). Sorting out the distributional effects of free trade (and illegal migration) is tricky, because much will depend on how quickly factor markets are integrated. Capital markets are especially important, because if they are quickly integrated, and exchange rate crises can be avoided (as with the collapse of the Peso in 1994), they can lead to higher levels of FDI, building of infrastructure, diffusion of technologies; all of which can help to close the productivity gaps between the US and Mexico. We already see considerable evidence in the post-Nafta period that capital is becoming cheaper and more readily available in Mexico, despite the run-up in interest rates following the Peso crisis in the mid-1990s. Another major problem in understanding the impact of Nafta on growth and inequality in Mexico is the fact that Mexico began its move towards freer trade and investment precisely at the time in the 1980s and ‘90s that Asian countries were entering the GATT/WTO. Competitive winds, which would have been strong just with the opening of markets in North America, were intensified by competition from labor-intensive, Asian manufactures, especially China. During the Salinas liberalization (1985-90), Mexico had to compete with a flood of cheap Asian goods. The Maquilladora sector in particular took a big hit, leading at the end of the 1990s to a sharp decline in these border industries, which had been the mainstay of Mexican industrialization over a two-three decade period. Recent evidence indicates that this sector is beginning to recover, however, as capital and investments return from Asia to Mexico. Rather than a “race to the bottom” we are witnessing a “race to the middle” in Mexico, as living standards rise and a Mexican middle class is emerging. Migration, trade, and the integration of capital markets in the pre- and post-Nafta period have raised output and living standards in Mexico (Hanson and Harrison 1999). But there is no doubt that Mexico has experienced a terms of trade shock with accompanying radical shifts in comparative advantage. One of the short-term consequences of this, as Martin (2004) points out, is an increase in illegal migration. Here it is important to look at rising and declining sectors in the Mexican economy to see where adjustment will be most difficult. Despite the fears of a collapse in Mexican agriculture (particularly the corn sector), evidence presented above shows that Mexico has held its own in agricultural exports to the US (in the fruits and vegetables sector). As Mexico industrializes and modernizes agriculture, we are likely to see increased inequalities and more illegal migration in the short term. The paradox is that this divergence in development patterns is a necessary prelude to the convergence (between the US, Canada, and Mexico) that will follow—things will get worse before they get better. From a policy standpoint, the crucial questions are (1) how long will this transition phase last and (2) will there be enough political support in all three countries to sustain the move to freer trade and investment during this period?

12
6. Conclusion and Policy Implications Based on our analysis of trade and migration patterns in North-America over the last two decades (and longer in some cases) we conclude that NAFTA did what is was supposed to do—increase the flow of goods and services between NAFTA partners, but having no discernable impact on the flow of legal migrants. 6.1 No easy tradeoff between trade and migration. Income convergence in North America depends heavily on the continuing integration of factor markets, particularly labor markets. The movement of labor has a larger impact on factor prices, inequality and income than trade, at least in the short term. This means that there will be big pressures for illegal migration to continue, and trade will be a complement, not a substitute (see also Martin 2004). Migration, therefore, is likely to be the motor for reducing inequality and alleviating poverty in Mexico for the foreseeable future. Demand-pull forces in the US economy remain strong, and supply-push—especially demographic forces in Mexico—are likely to persist for at least another 10-20 years. Families in Mexico will continue to see migration to the US as an important strategy for developing and diversifying their income streams. Networks between the receiving and sending societies operate like a cable connecting the two poles of demand-pull and supply-push. The question (addressed below) is how to manage the increasing pressure to migrate. 6.2 Advancing the free trade agenda and the Nafta process. If, as the evidence strongly indicates, freer trade accelerates the process of development, raising output, leading to a convergence of relative commodity prices, and ultimately reducing poverty and inequality in all three countries, then it is important to push the Nafta process forward, institutionalize it, and extend it to the rest of the hemisphere. Not only does free trade have positive social and economic benefits, it also has important political benefits. By more closely integrating the North American economies, Mexico in particular is locked into a development path that should lead to greater freedom and democracy, as well as closer cooperation with the US and Canada on a range of foreign policy and security issues (Krugman 1993). The important question then is what are the forces that would prevent further integration in North America? Reasons for protectionism are many and varied, ranging from the eternal search for an optimal tariff that will deliver the most favorable terms of trade, while enhancing government (tariff) revenues, protecting infant industries, etc., to narrow but well placed interests that are able to subvert the policymaking and legislative process, serving specific groups, but spreading the costs across society as a whole. One thing is clear, however, the integration process cannot be moved forward without political leadership (government 101!) and the elimination of corruption, securing of contracts and property rights, the reduction of distorting internal taxation policies, and the creation of a favorable climate for foreign investment. But, if the Europeans are able to achieve greater regional integration, with the economic benefits that this brings, why cannot the same be done in North America, and eventually throughout the hemisphere (FTAA)? Do such regional agreements aid or hinder the multilateral trade regime (WTO)? Or as Sidney Weintraub (2002) puts it, are they “stumbling blocks or stepping stones?” In the current political and economic climate, it will be difficult to push the free trade agenda. A political backlash against greater economic openness has been building throughout the Americas

13
since the late 1990s, and it seems to be reaching its apogee in the 2004 American elections. Demands for protectionism and immigration restriction have been building throughout the OECD world, both on the right (cultural conservatives) and the left (trade unionists). In the developing world, particularly in Latin America, the danger of a nationalist backlash and a new round of beggar-thy-neighbor policies is ever present. It will take considerable political skills and leadership to resist these populist pressures. 6.3 Managing the transition in Mexico and caring for the losers. Until Mexico begins to close the development gap with the US and Canada, migration will continue at historically high levels. Managing this movement of people (and the border more generally) will be the biggest policy problem in the US-Mexican relationship for many years to come. It has less importance for Canada, because so few Mexicans are able or willing to cross two international borders. Many attempts have been made to achieve greater (unilateral) control over illegal immigration from Mexico, including stepped up border enforcement, greater internal controls (employer sanctions and the like), and even rolling back some rights for immigrants, particularly access to welfare and entitlement programs. But none of these measures has substantially reduced the flow of unauthorized immigrants, which responds more to the business cycles in the US and Mexico than to anything else. Since it is unacceptable in a liberal democracy to have millions of people living indefinitely outside of the social contract and working in the informal sector (black market), legalization or amnesty is often the only policy option. The problem with this solution is that it is temporary and may actually increase the level of illegal immigration. Currently there are estimated to be 10-12 million unauthorized immigrants living in the US, of which 5-6 million are Mexican. The administration of George W. Bush, along with several members of Congress from both sides of the aisle, have proposed various guest worker schemes, some involving earned legalization. But the Bush proposal in particular, by avoiding any link between participation in this program and legalization or amnesty, fudges the crucial issue of status. Even if every illegal immigrant in the US were allowed to apply for a green card, under the current system—which limits the number of green cards or immigrant visas to 140,000/year—it could take as long as 50 years to legalize every unauthorized immigrant in the queue (Martin 2004). Cynics point out that Bush may have made this proposal to curry favor with Hispanic voters in the run-up to the 2004 election. A more charitable interpretation is that he was making a gesture to Mexico and President Vicente Fox, knowing that it would be difficult, if not impossible to pass immigration reform in an election year. In migration policy as with trade, it takes at least two to tango. Controlling and managing migration—not to mention protecting against terrorist infiltration and attacks—will require greater cooperation. Such cooperation is an ongoing strategic game, not a one-off decision. Each state must find an equilibrium point between economic growth (the benefits that come from openness with respect to migration and trade), social and political stability, and national security. Openness may increase levels of inequality in the short term, leading to social instability and political backlash. The tolerance that each society has for higher levels of inequality will vary, with Mexico having the highest tolerance, Canada the lowest, and the US somewhere in between. Canada should be best situated to cope with the disruptions and instabilities that may accompany freer trade and higher levels of immigration, because Canada has a more developed welfare state and progressive tax system, with a range of

14
automatic stabilizers that help cushion the impact of openness on the losers (mostly unskilled, but also some highly skilled workers). Mexico, on the other hand, has an almost non-existent welfare state, with few automatic stabilizers (unemployment compensation and the like), so we would expect integration to have the greatest, disruptive effect in Mexico. Finally, it is important to point out that the US has one huge advantage, which is its size. Anti-Nafta rhetoric notwithstanding, the impact of North American integration on the US economy and society is fairly minimal, with the glaring exception of illegal immigration from Mexico, which is more of a social and political than an economic problem.
15
References Agama, Laurie-Ann and Christine A. McDaniel. 2003. “The NAFTA Preference and U.S.-Mexico Trade: Aggregate Level Analysis,” The World Economy. 26: 939-955. Baier, Scott L. and Jeffrey H. Bergstrand. 2001. “The Growth of World Trade: Tariffs, Transport Costs and Income Similarity.” Journal of International Economics. 53: 1-27. Brown, R.L., J. Durbin, and J.M. Evans. 1975. “Techniques for Testing the Constancy of Regression Relationships over Time.” Journal of the Royal Statistical Society. Series B. 37: 149-192. Clausing, Kim A. 2001. “Trade Creation and Trade Diversion in the Canada-U.S. Free Trade Agreement,” Canadian Journal of Economics. 34(3): 676-696.
Ferrantino, Michael. 2001. “Evidence of Trade, Income, and Employment Effects of NAFTA.” Industry Trade and Technology Review. U.S. International Trade Commission Publication 3483.
Fukao, Kyoji, Toshihiro Okuba and Robert M. Stern. 2003. An Econometric Analysis of Trade Diversion under NAFTA.” The North American Journal of Economics and Finance. 14(1): 3-24.
Gould, David M. 1998. “Has NAFTA Changed North American Trade?” Federal Reserve Bank of Dallas Economic Review. First quarter: 12-23.
Hanson, Gordon and Ann Harrison. 1999. “Trade Liberalization and Wage Inequality in Mexico.” Industrial and Labor Relations Review. 52: 271-88.
Hatton, Timothy J. and Jeffrey G. Williamson. 1998. The Age of Mass Migration, Oxford University Press: New York.
Hillberry, Russell and Christine McDaniel. 2002. “A Decomposition of Trade Growth since NAFTA.” U.S. International Trade Commission. Office of Economics Working Paper No. 2002-12A.
Karemara, David and Kalu Ojah. 1998. “An Industrial Analysis of Trade Creation and Diversion Effects of NAFTA.” Journal of Economic Integration. 13: 400-425.
Kim, I.-M. 1991. “Structural Change and Unit Roots. PhD dissertation, University of Florida. Gainsville, Fla.: UMI Dissertation Services.
Krueger, Anne. 1999. “Trade Creation and Trade Diversion under NAFTA.” National Bureau of Economic Research Working Paper No. 7429.
Krueger, Anne. 2000. “NAFTA’s Effects: A Preliminary Assessment.” The World Economy. 23(6): 761-775.
Krugman, Paul. 1993. “The Uncomfortable Truth about Nafta.” Foreign Affairs. November/December: 13-19.
Martin, Philip L. 2004. “Nafta and Mexico-US Migration: Policy Options in 2004.” Paper prepared for the conference on North American Integration, sponsored by the IRPP and the Tower Center, Ottawa, Canada.

16
Romalis, John. 2001. “NAFTA’s Impact on North American Trade.” University of Chicago Graduate School of Business Working Paper.
Trefler, Daniel, 2001. “The Long and Short of the U.S.-Canada Free Trade Agreement,” American Economic Review. 94: 870-895.
U.S. International Trade Commission. 1997. The Impact of the North American Free Trade Agreement on the U.S Economy and Industries: A Three-Year Review. Publication 3045.
U.S. International Trade Commission. 2003. The Impact of Trade Agreements: Effect of the Tokyo Round, U.S.-Israel FTA, U.S.-Canada FTA, NAFTA, and the Uruguay Round on the U.S. Economy. Publication 3621.
Wall, Howard J. 2003. “NAFTA and the Geography of North American Trade.” Federal Reserve Bank of St. Louis Review. 85(2): 13-26. Weintraub, Sidney. 2002. CSIS Issues in International Political Economy. October (http://www.csis.org/simonchair/issues200210.pdf).

17
Appendix I A
Figure 1: Total Trade as % of GDP: Canada, Mexico, and U.S.
0.010.020.030.040.050.060.070.080.090.0
100.0
1965
1968
1971
1974
1977
1980
1983
1986
1989
1992
1995
1998
2001
U.S.MexicoCanada
Source: World Bank (2003) Table 1: Annual % Change of Total Trade to GDP
Source: World Bank (2003); own calculation
USA Mexico Canada 1965-2001 0.027 0.025 0.023 1965-1993 0.030 0.019 0.019 1994-2001 0.015 0.047 0.039 1994-2000 0.033 0.061 0.052

18
Source: U.S. Census Bureau; own calculation
Source: U.S. Census Bureau; own calculation
Figure 2a: US Export Shares 1985-2003
0 0.02 0.04 0.06 0.08
0.1 0.12 0.14 0.16 0.18
0.2
1985 1987 1989 1991 1993 19951997 1999 2001 2003
Mexico
Canada
Figure 2b: US Import Shares 1985-2003
0
0.02
0.04
0.06
0.08
0.10.12
0.14
0.16
0.18
1985 1987 1989 1991 1993 1995 1997 1999 2001 2003
Mexico
Canada

19
Source: U.S. Census Bureau; own calculation Table 2: Growth Rates of United States' Export, Import and Total Trade Shares Export Share Growth: Import Share Growth: TT Share Growth: Mexico Canada Mexico Canada Mexico Canada NAFTA 86-03 0.040 0.001 0.038 -0.007 0.039 -0.004 0.009 86-93 0.040 -0.006 0.024 -0.009 0.032 -0.008 0.002 94-03 0.040 0.006 0.050 -0.005 0.045 0.000 0.014 94-00 0.070 0.010 0.077 0.003 0.073 0.006 0.027 Source: U.S. Census Bureau; own calculation
Figure 2c: US Total Trade Shares 1985-2003
0
0.05
0.1
0.15
0.2
0.25
0.3
1985 1987 1989 1991 1993 1995 1997 1999 2001 2003
TT Share MexicoTT Share CanadaTT Share NAFTA

20
Table 3: Regression Analysis: Explaining Mexico’s Share in U.S. Imports
Dependent Variable: log of Mexico’s Share in U.S. Imports Time Period: 1989-2001 Units: Manufacturing Industries (HTS 6-digit)
Explanatory Variables (in logs): Estimate T-Statistic Tariff Preference 2.09* 2.80 Tariff Preference * NAFTA Dummy 2.37* 2.96 Tariff Level -2.47* -4.89 Tariff Level * NAFTA Dummy -1.97* -2.64 Transport Costs -6.67* -12.35 Lagged Import Share 0.21* 76.15 Peso/Dollar Exchange Rate 0.11* 3.00 Mexican Export Price -0.14* -11.63 Nominal Effective Exchange Rate -002* -19.38 World Export Price -0.03* -2.80 Number of Observations 27,809
2R .041 F-Statistic 191.9*
Note: * denotes statistical significance level of 1%; regression includes industry dummies at HTS 2-digit level Source: USITC (2003; Table B-2, p. B-10)

21
Figure 3a: Canada's Export Shares 1988-01
0
0.1
0.2
0.3
0.4
0.5
0.6
0.7
0.8
0.9
1988
1989
1990
1991
1992
1993
1994
1995
1996
1997
1998
1999
2000
2001
USMexico
Figure 3b: Canada's Import Shares 1988-01
0.000
0.100
0.200
0.300
0.400
0.500
0.600
0.700
0.800
1988
1989
1990
1991
1992
1993
1994
1995
1996
1997
1998
1999
2000
2001
USMexico

22
Figure 3c: Canada's Total Trade Shares 1988-01
0.000
0.100
0.200
0.300
0.400
0.500
0.600
0.700
0.800
0.900
1988
1989
1990
1991
1992
1993
1994
1995
1996
1997
1998
1999
2000
2001
USMexicoNAFTA
Source: Statistics Canada; own calculation Table 4: Growth Rate of Canada's Export, Import and Total Trade Shares Export Share Growth: Import Share Growth: TT Share Growth: US Mexico US Mexico US Mexico NAFTA 88-01 0.015 0.059 -0.003 0.107 0.007 0.090 0.009 88-93 0.016 0.043 0.002 0.139 0.010 0.109 0.011 94-01 0.013 0.077 -0.008 0.070 0.005 0.068 0.006
94-00 0.016 0.034 -0.002 0.112 0.008 0.090 0.010 Source: Statistics Canada; own calculation

23
Figure 4a: Mexico's Export Shares 1985-2002
0.0000.1000.2000.3000.4000.5000.6000.7000.8000.900
1985
1987
1989
1991
1993
1995
1997
1999
2001
U.S.Canada
Source: World Bank (2003), IMF Financial Statistics, U.S. Census Bureau, Banco de Mexico; own calculation
Figure 4b: Mexico's Import Shares 1985-2002
0.000
0.100
0.200
0.300
0.400
0.500
0.600
0.700
1985
1987
1989
1991
1993
1995
1997
1999
2001
U.S.Canada
Source: World Bank (2003), IMF Financial Statistics, U.S. Census Bureau, Banco de Mexico; own calculation

24
Figure 4c: Mexico's Total Trade Shares 1985-2002
0.000
0.100
0.200
0.300
0.400
0.500
0.600
0.700
0.800
1985
1987
1989
1991
1993
1995
1997
1999
2001
U.S.CanadaNAFTA
Source: World Bank (2003), IMF Financial Statistics, U.S. Census Bureau, Banco de Mexico; own calculation Table 5: Growth Rate of Mexico's Export, Import and Total Trade Shares Export Share Growth: Import Share Growth: TT Share Growth: US Canada US Canada US Canada NAFTA 85-02 0.015 n/a -0.004 n/a 0.005 n/a n/a 85-93 0.008 n/a -0.007 n/a 0.000 n/a n/a 94-02 0.020 -0.031 -0.002 0.055 0.011 0.009 0.010 94-00 0.022 -0.021 0.011 0.049 0.018 0.008 0.017 Source: World Bank (2003), IMF Financial Statistics, U.S. Census Bureau, Banco de Mexico; own calculation
25
Table 6: Regression Analysis: Explaining US Share of Mexican Imports
Dependent Variable: log of U.S. Share of Mexican Imports Time Periods: 1991, 1995, 1999 Cross-Section Units: Manufacturing Industries (HTS 6-digit)
Explanatory Variables (in logs): Estimate T-Statistic Tariff Preference 0.44* 2.73 Tariff Level in 1991 -0.84* 3.51 Import Share in 1991 0.49* 25.03 Peso/Dollar Exchange Rate -0.05* 2.39 Real Effective Exchange Rate -0.002* 4.66 Number of observations 12,049
2R 0.29 F-Statistic 50.41*
Note: * denotes statistical significance level of 1%; regression Includes industry dummies at HTS 2-digit level Source: USITC (2003; Table B-4, p. B-12)

26
Appendix I B
Table 7a: US Export Share with NAFTA Partners by Sector
NAFTA exports (as % of all)
Rank 1987 1993 2001
Annual % change in NAFTA export share 87-93
Annual % change in NAFTA export share 93-01
Absolute Change in % change of NAFTA export share between 87-93 and 93-01
1 Energy+Fuel prod 21.78 22.39 48.49 0.47 19.42 18.952 Miner.+metals 44.48 38.40 49.32 -2.28 4.74 7.023 Transport. Equip. 40.53 36.03 41.52 -1.85 2.54 4.394 Textiles+Apparel 26.99 35.59 50.09 5.31 6.79 1.485 Forest+Fishery 22.07 30.10 42.98 6.06 7.13 1.076 Machine.+Electron. 26.68 29.18 30.97 1.56 1.02 -0.547 Services 15.46 15.97 14.60 0.66 -1.44 -2.108 Chem+Allied Prod 20.91 29.56 34.51 6.90 2.79 -4.109 Agriculture 9.77 18.97 27.52 15.70 7.51 -8.19
10 Misc. products 17.95 27.04 24.60 8.44 -1.50 -9.94 Source: USITC (2003); own calculations
Table 7b: US Import Share with NAFTA Partners by Sector
NAFTA imports (as % of all)
Rank 1987 1993 2001
Annual % change in NAFTA import share 87-93
Annual % change in NAFTA import share 93-01
absolute change in the % change of NAFTA import share between 87-93 and 93-01
1 Machine.+Electron. 13.07 15.86 24.13 3.55 6.52 2.972 Forest+Fishery 42.92 55.99 85.37 5.07 6.56 1.493 Services 16.57 15.41 15.13 -1.40 -0.23 1.164 Misc. products 7.75 10.05 14.96 4.95 6.10 1.155 Miner.+metals 29.38 32.32 32.57 1.67 0.10 -1.586 Energy+Fuel prod 23.80 35.03 51.90 7.87 6.02 -1.857 Chem+Allied Prod 20.72 25.78 27.83 4.07 0.99 -3.088 Transport. Equip. 31.49 42.27 44.86 5.71 0.76 -4.949 Agriculture 21.23 32.20 38.78 8.62 2.55 -6.07
10 Textiles+Apparel 4.02 8.82 17.31 19.88 12.03 -7.85 Source: USITC (2003); own calculations

27
Table 7c: US Total Trade Share with NAFTA Partners by Sector
NAFTA total trade (as % of all)
Rank 1987 1993 2001
Annual % change in NAFTA total trade share 87-93
Annual % change in NAFTA total trade share 93-01
absolute change in the % change of NAFTA total trade share between 87-93 and 93-01
1 Forest+Fishery 35.49 43.99 69.98 3.99 7.39 3.402 Energy+Fuel prod 23.49 33.08 51.58 6.81 6.99 0.183 Miner.+metals 33.81 35.13 38.99 0.65 1.37 0.724 Machine.+Electron. 18.66 21.92 26.96 2.90 2.88 -0.036 Services 15.95 15.76 14.82 -0.25 -0.74 -0.505 Transport. Equip. 34.51 39.53 43.63 2.42 1.30 -1.137 Chem+Allied Prod 20.83 27.90 31.03 5.66 1.40 -4.258 Agriculture 14.51 23.73 32.39 10.60 4.56 -6.059 Misc. products 10.63 15.91 18.14 8.28 1.75 -6.53
10 Textiles+Apparel 6.67 14.06 23.01 18.47 7.97 -10.50 Source: USITC (2003); own calculations

28
Appendix II A
Figure 5a: Canadian and Mexican Share of US Immigrants 1820-2000
0.000
0.050
0.100
0.150
0.200
0.250
0.300
1821
-30
1841
-50
1861
-70
1881
-90
1901
-10
1921
-30
1941
-50
1961
-70
1981
-90 Canada Mexico
Source: U.S. INS Statistical Yearbook; own calculations
Figure 5b: "Nafta" Share of US Immigrants 1821-2000
0.0000.0500.1000.1500.2000.2500.3000.3500.400
1821
-30
1841
-50
1861
-70
1881
-90
1901
-10
1921
-30
1941
-50
1961
-70
1981
-90
Source: U.S. INS Statistical Yearbook; own calculations

29
Figure 5c: "Americas" Share of US Immigrants 1821-2000
0.000
0.100
0.200
0.300
0.400
0.500
0.600
1821
-30
1841
-50
1861
-70
1881
-90
1901
-10
1921
-30
1941
-50
1961
-70
1981
-90
Source: U.S. INS Statistical Yearbook; own calculations
30
Appendix II B
Figure 6a: Total U.S. Immigrants 1986-2002
y = 2442.5x3 - 68974x2 + 540634x - 63354R2 = 0.5105
0200,000400,000600,000800,000
1,000,0001,200,0001,400,0001,600,0001,800,0002,000,000
1986
1987
1988
1989
1990
1991
1992
1993
1994
1995
1996
1997
1998
1999
2000
2001
2002
Source: U.S. INS Statistical Yearbook; own calculations
Figure 6b: Mexican Immigrants in U.S. 1986-2002
y = 1406.9x3 - 39936x2 + 308187x - 284987R2 = 0.3707
-200000
0
200000
400000
600000
800000
1000000
1986
1988
1990
1992
1994
1996
1998
2000
2002
Source: U.S. INS Statistical Yearbook; own calculations

31
Figure 6c: Canadian Immigrants in U.S. 1986-2002
y = 21.46x3 - 562.2x2 + 4259.5x + 5420.2R2 = 0.5062
0
5,000
10,000
15,000
20,000
25,000
1986
1987
1988
1989
1990
1991
1992
1993
1994
1995
1996
1997
1998
1999
2000
2001
2002
Source: U.S. INS Statistical Yearbook; own calculations
Figure 6d: Share of Mexican Immigrants 1986-2002
y = 0.0007x3 - 0.0188x2 + 0.1455x - 0.0342R2 = 0.3167
0.000
0.100
0.200
0.300
0.400
0.500
0.600
1986
1987
1988
1989
1990
1991
1992
1993
1994
1995
1996
1997
1998
1999
2000
2001
2002
Source: U.S. INS Statistical Yearbook; own calculations

32
Figure 6e: Share of Canadian Immigrants 1986-2002
y = 3E-06x4 - 0.0001x3 + 0.0018x2 - 0.0091x + 0.0287R2 = 0.35360.000
0.005
0.010
0.015
0.020
0.025
1986
1987
1988
1989
1990
1991
1992
1993
1994
1995
1996
1997
1998
1999
2000
2001
2002
Source: U.S. INS Statistical Yearbook; own calculations Table 8: Average Annual Growth Rate of U.S. Immigrant Shares 1986-2002
Mexican Canada "NAFTA" 86-02 0.112 0.042 0.094 86-93 0.168 0.085 0.139 94-02 0.068 0.008 0.058
94-00 0.087 0.014 0.076
Source: U.S. INS Statistical Yearbook; own calculations

33
Appendix II C
Figure 7a: Immigration vs Trade Share Growth - Mexico - US 1985-02
-0.050
0.000
0.050
0.100
0.150
-1.000 -0.500 0.000 0.500 1.000 1.500 2.000
Immigration share growth
Trad
e sh
are
grow
th
Source: U.S. INS Statistical Yearbook; own calculations
Figure 7b: Immigration vs Trade Share Growth - Canada - US 1985-02
-0.040
-0.020
0.000
0.020
0.040
0.060
-0.500 0.000 0.500 1.000 1.500
Immigration Share Growth
Trad
e Sh
are
Gro
wth
Source: U.S. INS Statistical Yearbook; own calculations

34
Table 9: Relation between Immigration and Total Trade Share Growth Mexico-US Canada-US Mexico-US Canada-US Correlation Coefficient Estimate T-statistic Estimate T-statistic n 85-02 0.185 0.085 1.766 0.703 1.197 0.318 16 85-93 0.301 0.252 6.101 0.707 4.512 0.582 7 94-02 0.193 -0.414 0.552 0.521 -3.157 -1.205 9 Source: U.S. INS Statistical Yearbook; own calculations