Improving Competition in the Non-Tradable Goods and Labour ...
ISSN: 1439-2305
Number 270 – December 2015
TRADABLE DEVELOPMENT RIGHTS
UNDER UNCERTAINTY:
AN EXPERIMENTAL APPROACH
Till Proeger
Lukas Meub
Kilian Bizer
1
Tradable development rights under uncertainty:
an experimental approach
Till Proeger a, *, Lukas Meub b, Kilian Bizer c
a,b,c Faculty of Economic Sciences, Chair of Economic Policy and SME Research, University
of Goettingen, Platz der Goettinger Sieben 3, 37073, Goettingen, Germany,
* Corresponding author, [email protected];
phone: +49 551 39 12330; fax: +49 551 39 19558.
Revised Version June 2017
Abstract: Tradable development rights (TDR) are discussed as a mechanism to reduce land
consumption while ensuring an efficient implementation of profitable building projects. We
present a novel laboratory experiment on the feasibility of TDR and simulate the acquisition
and trading of development rights. In particular, we investigate the effects of uncertainty in
the revenues of land consumption projects. Overall, we find that TDR are reallocated as
suggested by theory, although higher uncertainty has substantial detrimental effects on the
distribution of land consumption projects and thus aggregate welfare. This enables us to
formulate distinct policy implications for the design of TDR systems.
Keywords: auction, economic experiment, land consumption, tradable planning permits,
urban sprawl
JEL Classification: C91; C92; D8
2
1. Introduction
Tradable development rights (TDR) are discussed as a policy instrument to reduce urban
sprawl and foster a more sustainable land use. Such market-oriented planning instruments are
increasingly considered in scientific and political discourses as a viable extension of urban
containment strategies (van der Veen et al., 2010), suggesting that they show superior
efficiency in achieving reductions of land consumption (Miller, 1999; Nuissl and Schroeter-
Schlaack, 2009). Implementing a quantitative constraint - i.e. a cap - on development rights
along with a trading mechanism and floating prices would constitute a system enabling
policy-makers to accomplish reductions in land use with near-perfect precision at minimal
cost. Furthermore, planners and land-owners are expected to use land more efficiently in a
system of TDR, fostering inner-city development and gaining a greater awareness of the
ecological problems that stem from excessive urban sprawl (Levinson, 1997; Henger and
Bizer, 2010).
The United States was the first nation to implement TDR on a large scale in more than 30
federal states from the 1970s onwards, within very different regional and institutional contexts
(Pruetz, 1997). The heterogeneity of the programs in question makes overarching evaluations
of their efficacy challenging. While several studies have provided initial empirical results on
universal success factors for TDR (e.g. Kaplowitz et al., 2008; Pruetz and Standridge, 2009;
Tan and Beckman, 2010; Chan and Hou, 2015), the empirical evidence that can be utilized for
providing generalizable policy advice remains limited (Bengston et al., 2004; Kopits et al.,
2008). This is problematic as TDR are increasingly considered as a means of establishing
sustainable land use policies in numerous developed nations, including the Netherlands
(Janessen-Jansen, 2008), Italy (Micelli, 2003), Australia (Harman and Choy, 2011),
Switzerland (Mengini et al., 2015), China (Wang et al., 2009) and Germany (Henger and
3
Bizer, 2010), where the current administration has decided to develop and test a nation-wide
system of TDR (Coalition Treaty, 2013).
In this paper, we argue that empirical evidence derived from economic laboratory studies can
be considered a worthwhile addition to the existing purely theoretical analyses, local case
studies and supra-regional surveys. Laboratory experiments can answer specific
counterfactual research questions that remain inaccessible for theoretical and empirical
studies relying on field data (Greenstone and Gayer, 2009; Falk and Heckman, 2009; Chetty,
2015). Therefore, we propose a research design that enables us to simulate a system of TDR
and measure agents’ reactions to changes in core institutional parameters. This is achieved
through a novel experimental design that simulates the allocation and trading of development
rights as well as the ensuing realization of building projects using the development rights
acquired beforehand in the game. Our setting implements a fairly general concept of a TDR
system applicable to different institutional and national contexts. In addition to providing
evidence on the overall efficiency and welfare implications of a TDR system, we investigate a
key feature of land consumption projects, namely the investment risk associated with
acquiring, trading and using development rights. This research question builds upon a broad
strand of literature in experimental economics showing that individual decision-making under
risk leads to substantially different outcomes than those predicted by benchmarks of rational
decision-making (see e.g. Camerer et al., 2011). Consequently, we ask how subjects and the
overall system react when the revenues of land consumption projects are prone to uncertainty
and potentially yield negative returns compared to a situation with fixed, positive returns. This
enables us to show whether markets cease to allocate development rights efficiently when
faced with uncertainty in future revenues as a crucial property of investments in TDR and thus
fail to maximize welfare. Consequently, the overall viability of a TDR market may depend on
a specific sector’s volatility in revenues.
4
The subsequent section of this paper justifies our methodological choice and reviews the
relevant literature, while our experimental design and benchmark model are outlined in
sections three and four, respectively. The experimental results are presented in section five,
before section six discusses our results and provides a conclusion.
2. TDR and laboratory experiments
Evaluating the policy options of implementing TDR on a large scale is associated with the
lack of generalizable empirical evidence presented to justify the choice of specific
institutional mechanisms. While a number of theoretical publications have laid out the
potential advantages of TDR (for a basic setup, see Thorsnes and Simons, 1999; recent
theoretical contributions are provided by Ward, 2013; Vejchodska, 2015), few specific
institutional implications can be derived from these studies due to their level of abstraction
and the ubiquitous assumption of rational agents that forms the basis for the optimistic
predictions about the efficiency of TDR. At the same time, a similarly large body of overview
studies for heterogeneous institutional and social contexts has been presented, providing
determinants of successful implementations of TDR (for studies based on qualitative
measures, see e.g. Santos et al., 2015; Harman et al., 2015; Kaplowitz et al., 2008; Machemer
and Kaplowitz, 2002; Pruetz and Standridge, 1999; Danner, 1997; studies primarily using
quantitative measures include Menghini et al., 2015; Kopits et al., 2008; Lynch and Musser,
2001; Lynch and Lovell, 2003). While an overall consensus has been established in the
literature concerning a number of success factors of TDR systems (such as strong demand for
additional development zones and receiving areas customized to the demands of the
respective communities (Pruetz and Standridge, 2009)), we argue that these conclusions
remain closely tied to specific regional and institutional contexts. Accordingly, they are not
fully generalizable and often inapplicable to other nations’ implementation of TDR.
5
We suggest that laboratory experiments can provide additional insights into the policy-
oriented discussion of TDR and fruitfully complement the existing literature. Laboratory
experiments can effectively provide a link between theoretical studies with a perfect internal
validity yet disputable external validity in a world of non-rational agents and case studies with
a perfect external validity yet a lower generalizability. Proponents of laboratory studies in
policy-related discussions argue that experimental evidence combines a high internal validity
(ensured by controlling all environmental factors) with a high external validity by testing
actual human behavioral patterns in situations that resemble certain institutions relevant for
policy-makers (see e.g. Charness and Fehr, 2015 and Santos, 2011 for comprehensive
discussions as well as Greenstone and Gayer, 2009 with a focus on environmental policy).1 A
successful example of this approach - i.e. using laboratory experiments to provide policy-
makers with information on the effects of different potential institutional choices – can be
found conducted in the run-up to the 2005 implementation of tradable CO2 certificates within
the European emissions trading system (ETS). A long-standing scientific discussion was
established that built upon theoretical modeling of the trading system and subsequently
provided experimental evidence from which distinct policy implications could be deducted
(see Convery, 2009 as well as Grimm and Illieva, 2013 for comprehensive overviews of the
discussion as well as Stranlund et al., 2014 for a recent experimental contribution). Another
recent example is the experimental investigation of water quality trading markets, furthered
e.g. by Jones and Vossler (2014).
Our paper aims to contribute similarly to the study of the optimal design of TDR. We present
empirical evidence on the validity of theoretical assumptions concerning individual behavior
1 The debate on the merits and potential disadvantages of applying behavioral economics to the design of public
policies has been conducted for more than a decade by now. Among the central contributions are Falk and Fehr
(2003), Falk and Heckman (2009), Madrian (2014) and Chetty (2015), who present the core arguments.
6
within a TDR system and deduct more general behavioral patterns applicable to policy-
making. We can build upon a small number of previous papers that have tested specific
aspects of a system of TDR. For instance, Henger (2013) compares the performance of
student participants and municipal planners, finding that both groups achieve a fairly efficient
allocation of certificates. Moreover, Meub et al. (2017) consider the influence of political
business cycles within a TDR system, while Meub et al. (2017) investigate the efficiency of
different mechanisms for allocating development rights, Meub et al. (2016) show the impact
of macroeconomic shocks on a system of TDR and Proeger et al. (2016) experimentally
consider the influence of communication regimes on the efficiency of TDR schemes.
The experiment reported in this paper extends the previous studies by providing evidence on
individual decision-making under risk and its consequences for the overall efficiency within a
TDR system. Decision-making under uncertainty has been among the primary subjects for
experimental economists examining the validity of neoclassical assumptions on rational
behavior. It has become a standard assumption that subjects’ behavior can substantially
deviate from benchmark models of rational decision-making assuming risk-neutral behavior
in numerous economic and institutional contexts (see e.g. Camerer et al., 2011 and Cox and
Harrison, 2008 for introductions to the literature; see Charness et al., 2013 and Crosetto and
Filippin, 2013 for the state of research on risk preferences). These more realistic insights
about dealing with risk necessarily imply very different policy recommendations than those
derived from theoretical models merely assuming risk-neutral agents. Therefore, it remains an
open question whether and how agents in an actual TDR system will successfully cope with
the uncertainties associated with investing resources in development rights to conduct
building projects. Risk preferences might substantially influence the distribution of TDR,
auction and market prices and consequently overall efficiency. Our experimental design can
7
shed light upon this question by investigating subjects’ reactions to uncertainty in future
revenues while implementing the core features of a TDR system.
3. Experimental design
3.1 Implementation of TDR in an experimental framework
Our experimental design aims to implement a fairly general concept of TDRs, enabling the
transfer of insights to different national or institutional contexts. Our basic approach
resembles the cap & trade system for CO2 emissions, whereby certificates are issued by a
public authority and used by different agents for their production. Whenever the expected
income from a production does not compensate the costs of the number of certificates
required, the production will not be undertaken. Overall, given a redistribution of issued
certificates through a trading system, only the most profitable units of productions are
realized.
This approach is transferred to land consumption, whereby we assume that agents aim to
realize building projects that yield revenue in the future. These agents could potentially be
municipalities, firms or individual residents. There is an authority – most likely a public
institution or large private landowner – who sets a cap on overall land consumption and
allocates certificates (i.e. development rights) in accordance with the cap. Similar to CO2
markets, certificates are issued in two distinct ways: a certain amount is allocated for free
(“grandfathered”) by a predetermined allocation formula and the remaining certificates are
auctioned. Hence, all agents receive a number of TDR by default and bid on additional ones,
both of which they can subsequently use to realize their building projects or – if more
profitable – sell to other agents. Accordingly, “sending sites” and “receiving sites” are
determined in a market process, optimally by redistributing TDR to the most profitable sites.
We further assume heterogeneous agents within a market, which simulates different sizes of
8
the public institutions or landowners and translates to a different number of projects available
and certificates grandfathered to the respective agents.
Besides providing evidence on the working mechanism of a laboratory-based TDR-scheme,
we investigate the element of risk in the context of acquiring and using certificates for land
consumption. We argue that the uncertain outcome of investing and conducting building
projects within a system of TDR could substantially alter its feasibility and distort the
efficient allocation of certificates. This basic feature of land use decisions is implemented by
assigning different degrees of profitability to each project, which are equally likely to realize
at the end of the game. We thus assert how participants react to varying degrees of
profitability as one representation of underlying risk.
3.2 Overview of the game
Note that the general experimental design uses the framework introduced by Meub et al.
(2016). In the game, groups (“markets”) of six participants are matched to interact for 15
periods. These subjects generate payoffs by realizing projects and trading certificates. There
are two types of projects available. First, there are Type A projects, which generate between
0- and 100ECU, whereby 100ECU converts to 1€ at the end of the game. These projects
require eight certificates to be realized and thus represent land consuming building projects.
Independent of their distinct value, all Type A projects require the same number of
certificates, whereby this simplification is intended to keep the game comprehensible for the
participants. Second, an outside option is given by Type B projects that always pay 10ECU.
Prior to the first period, subjects are randomly assigned to a specific player type determining
their endowment of available projects and certificates. Independent of the player type, all
subjects are initially endowed with a budget of 700ECU. Each period of the game comprises
three stages.
9
Within the first stage, subjects accumulate certificates that are required to conduct Type A
projects. Half of the 24 certificates issued in each period are grandfathered, whereas the other
half are auctioned in a uniform price auction with sealed bids. Accordingly, subjects’ bids for
certain quantities are ranked by price and the lowest bid that is granted certificates determines
the uniform price.
A double auction market constitutes the second stage of each period, during which subjects
can simultaneously buy and sell certificates within their budget constraint, i.e. there is no
borrowing to buy certificates. The secondary market is open for two minutes and there are no
transaction costs. This setting enables subjects to gamble and try to generate income by taking
advantage of price dynamics and thus expand or reduce their budget and stock of certificates.
At the end of each period, subjects have to choose between using certificates to realize a
project of Type A or relying on the outside option of realizing a Type B project, meaning that
they had to choose Type B if they chose not to conduct a Type A project. Only one project
can be realized per period. While participants can conduct projects in each period, their payoff
is not granted until the final period. This design choice implements a core feature of building
projects – namely their duration and the delay until investments pay off – and again provides
funds that can be invested anew. Certificates can be kept across periods, i.e. our design allows
for banking of certificates. However, all remaining certificates lose their value after the final
period. Subjects receive feedback on their decisions after each period.
Table 1 summarizes the properties of the game by listing all player types with their available
projects and certificates.
10
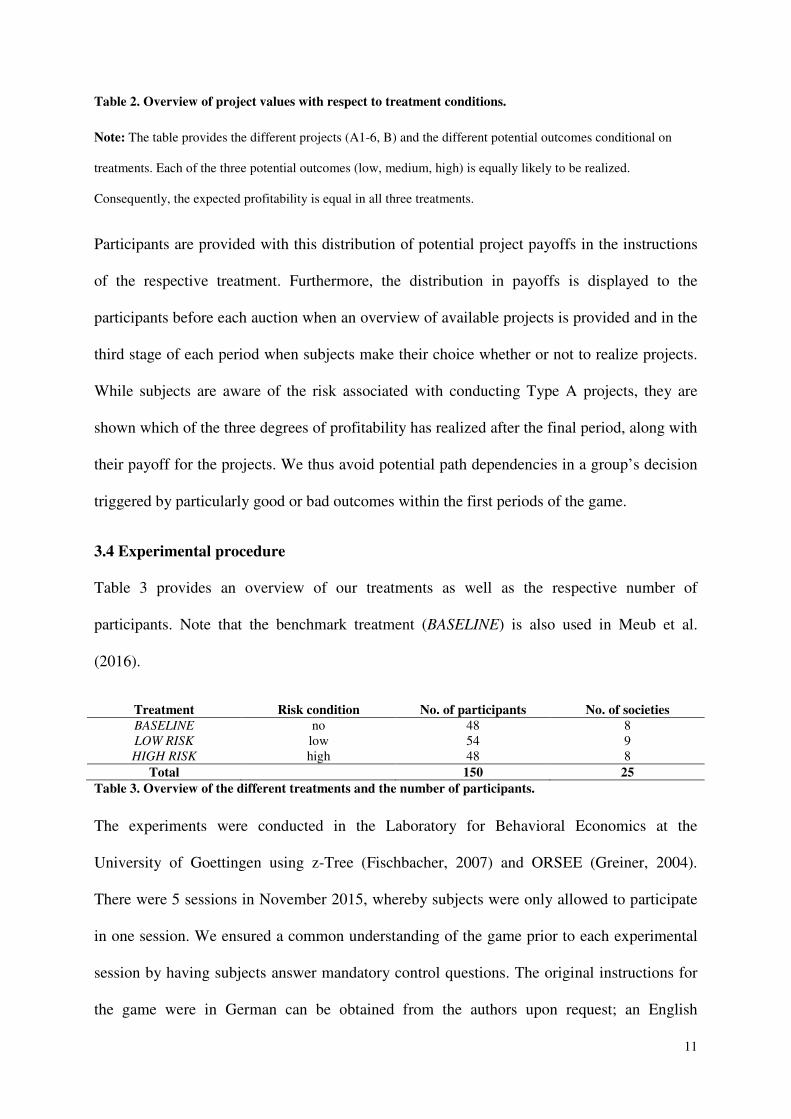
Table 1. Overview of the different player and project types as well as the respective certificates.
Note: The table first provides details on the different projects, whereby six Type A projects with different values
are available, each requiring eight certificates. The Type B project is the outside option in each period and thus
does not require certificates. Furthermore, the table shows details on the different player types (on the lower left
half): there are six player types, endowed with varying numbers of projects. Overall, each player type has 45
projects available. The lower right hand side shows the number of certificates provided to the respective player
type in each period and - in brackets - during the entire game.
3.3 Treatment conditions
Our treatments introduce risk in project revenues as a key feature of all investment projects,
which similarly translates to land consumption projects that typically take some time before
revenues are realized. Risk has to be considered to hold outstanding importance as it
potentially distorts the efficient allocation of certificates in a cap & trade system.
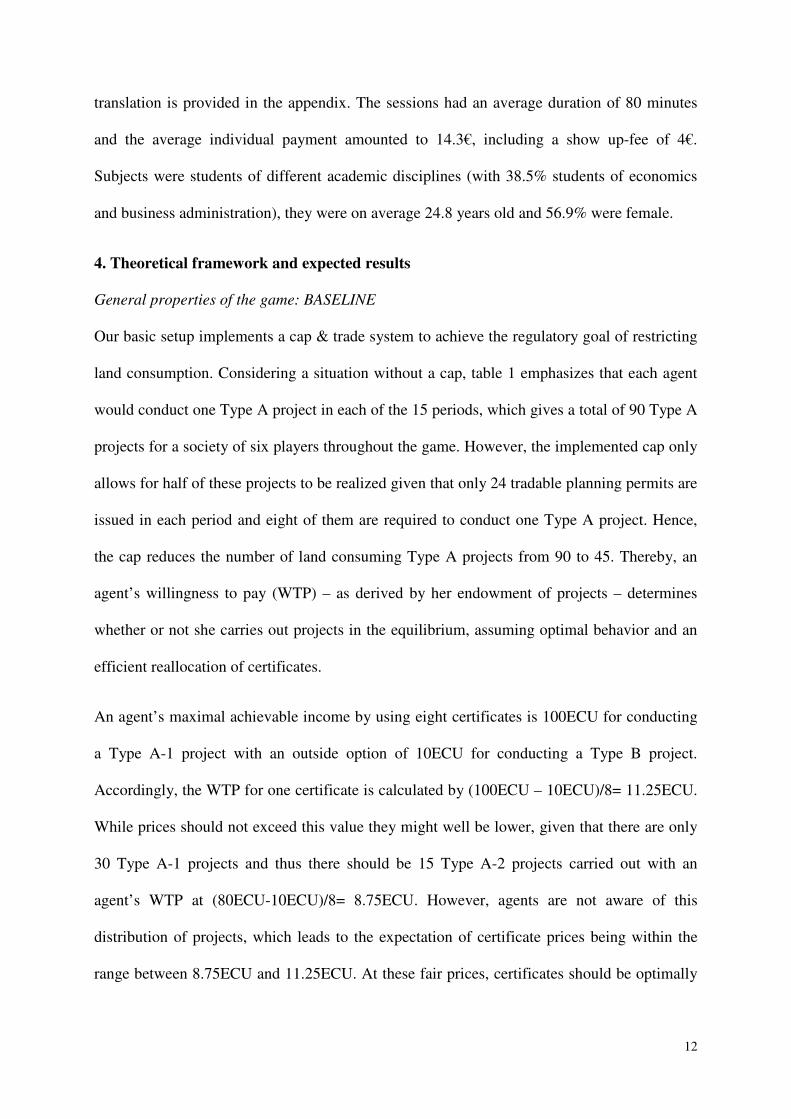
The two treatments LOW RISK and HIGH RISK differ in terms of the associated risk in
project revenues, which is summarized in table 2. The three degrees of profitability for each
period are equally likely to realize, i.e. with a probability of 1/3.
Project BASELINE LOW RISK HIGH RISK
low medium high low medium high low medium high
A-1 - 100 - 50 100 150 -100 100 300
A-2 - 80 - 40 80 120 -80 80 240
A-3 - 60 - 30 60 90 -60 60 180
A-4 - 40 - 20 40 60 -40 40 120
A-5 - 20 - 10 20 30 -20 20 60
A-6 - 0 - 0 0 0 0 0 0
B - 10 - 10 10 10 10 10 10
project type A-1 A-2 A-3 A-4 A-5 A-6 B
value 100 80 60 40 20 0 10
certificates 8 8 8 8 8 8 0
total certificates period (total)
#grandfathered #auctioned
agent 1 10 8 6 4 2 0 15 45 4(60) -
2 8 10 6 4 2 0 15 45 3(45) -
3 6 8 10 4 2 0 15 45 2(30) -
4 4 6 8 10 2 0 15 45 1(15) -
5 2 4 6 8 10 0 15 45 1(15) -
6 0 2 4 6 8 10 15 45 1(15) -
total 30 38 40 36 26 10 90 270 12(180) 12(180)
11
Table 2. Overview of project values with respect to treatment conditions.
Note: The table provides the different projects (A1-6, B) and the different potential outcomes conditional on
treatments. Each of the three potential outcomes (low, medium, high) is equally likely to be realized.
Consequently, the expected profitability is equal in all three treatments.
Participants are provided with this distribution of potential project payoffs in the instructions
of the respective treatment. Furthermore, the distribution in payoffs is displayed to the
participants before each auction when an overview of available projects is provided and in the
third stage of each period when subjects make their choice whether or not to realize projects.
While subjects are aware of the risk associated with conducting Type A projects, they are
shown which of the three degrees of profitability has realized after the final period, along with
their payoff for the projects. We thus avoid potential path dependencies in a group’s decision
triggered by particularly good or bad outcomes within the first periods of the game.
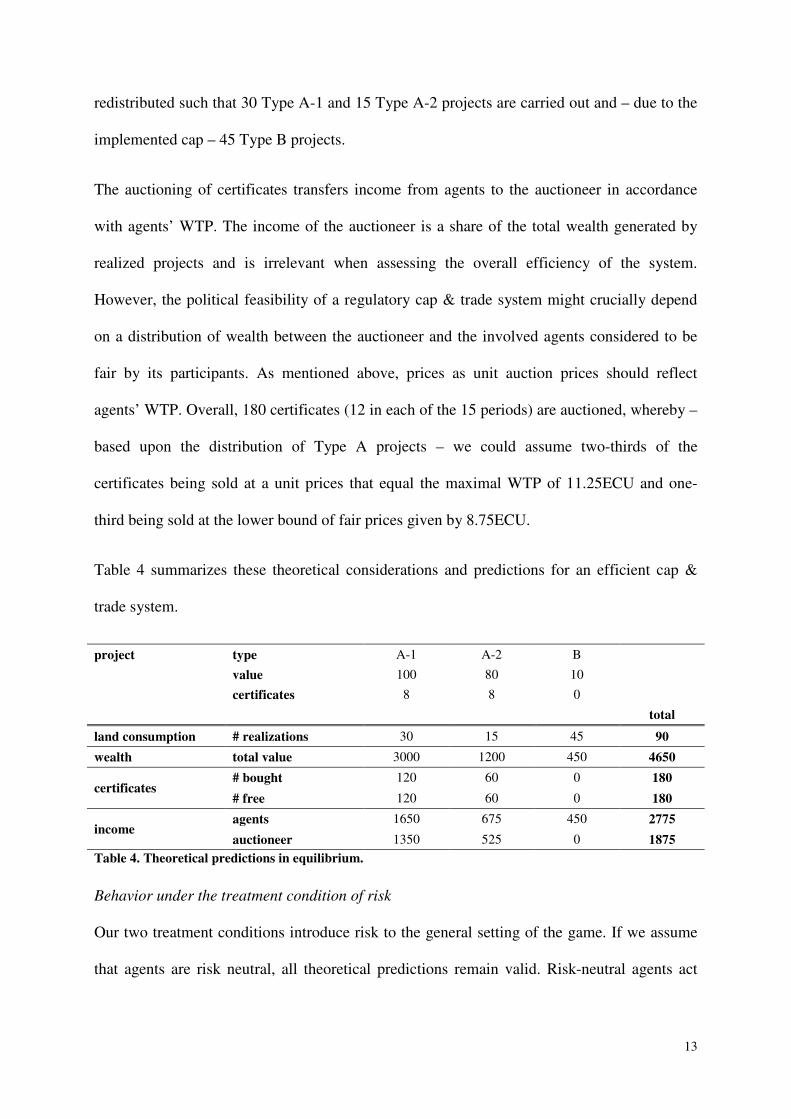
3.4 Experimental procedure
Table 3 provides an overview of our treatments as well as the respective number of
participants. Note that the benchmark treatment (BASELINE) is also used in Meub et al.
(2016).
Treatment Risk condition No. of participants No. of societies
BASELINE no 48 8
LOW RISK low 54 9
HIGH RISK high 48 8
Total 150 25
Table 3. Overview of the different treatments and the number of participants.
The experiments were conducted in the Laboratory for Behavioral Economics at the
University of Goettingen using z-Tree (Fischbacher, 2007) and ORSEE (Greiner, 2004).
There were 5 sessions in November 2015, whereby subjects were only allowed to participate
in one session. We ensured a common understanding of the game prior to each experimental
session by having subjects answer mandatory control questions. The original instructions for
the game were in German can be obtained from the authors upon request; an English
12
translation is provided in the appendix. The sessions had an average duration of 80 minutes
and the average individual payment amounted to 14.3€, including a show up-fee of 4€.
Subjects were students of different academic disciplines (with 38.5% students of economics
and business administration), they were on average 24.8 years old and 56.9% were female.
4. Theoretical framework and expected results
General properties of the game: BASELINE
Our basic setup implements a cap & trade system to achieve the regulatory goal of restricting
land consumption. Considering a situation without a cap, table 1 emphasizes that each agent
would conduct one Type A project in each of the 15 periods, which gives a total of 90 Type A
projects for a society of six players throughout the game. However, the implemented cap only
allows for half of these projects to be realized given that only 24 tradable planning permits are
issued in each period and eight of them are required to conduct one Type A project. Hence,
the cap reduces the number of land consuming Type A projects from 90 to 45. Thereby, an
agent’s willingness to pay (WTP) – as derived by her endowment of projects – determines
whether or not she carries out projects in the equilibrium, assuming optimal behavior and an
efficient reallocation of certificates.
An agent’s maximal achievable income by using eight certificates is 100ECU for conducting
a Type A-1 project with an outside option of 10ECU for conducting a Type B project.
Accordingly, the WTP for one certificate is calculated by (100ECU – 10ECU)/8= 11.25ECU.
While prices should not exceed this value they might well be lower, given that there are only
30 Type A-1 projects and thus there should be 15 Type A-2 projects carried out with an
agent’s WTP at (80ECU-10ECU)/8= 8.75ECU. However, agents are not aware of this
distribution of projects, which leads to the expectation of certificate prices being within the
range between 8.75ECU and 11.25ECU. At these fair prices, certificates should be optimally
13
redistributed such that 30 Type A-1 and 15 Type A-2 projects are carried out and – due to the
implemented cap – 45 Type B projects.
The auctioning of certificates transfers income from agents to the auctioneer in accordance
with agents’ WTP. The income of the auctioneer is a share of the total wealth generated by
realized projects and is irrelevant when assessing the overall efficiency of the system.
However, the political feasibility of a regulatory cap & trade system might crucially depend
on a distribution of wealth between the auctioneer and the involved agents considered to be
fair by its participants. As mentioned above, prices as unit auction prices should reflect
agents’ WTP. Overall, 180 certificates (12 in each of the 15 periods) are auctioned, whereby –
based upon the distribution of Type A projects – we could assume two-thirds of the
certificates being sold at a unit prices that equal the maximal WTP of 11.25ECU and one-
third being sold at the lower bound of fair prices given by 8.75ECU.
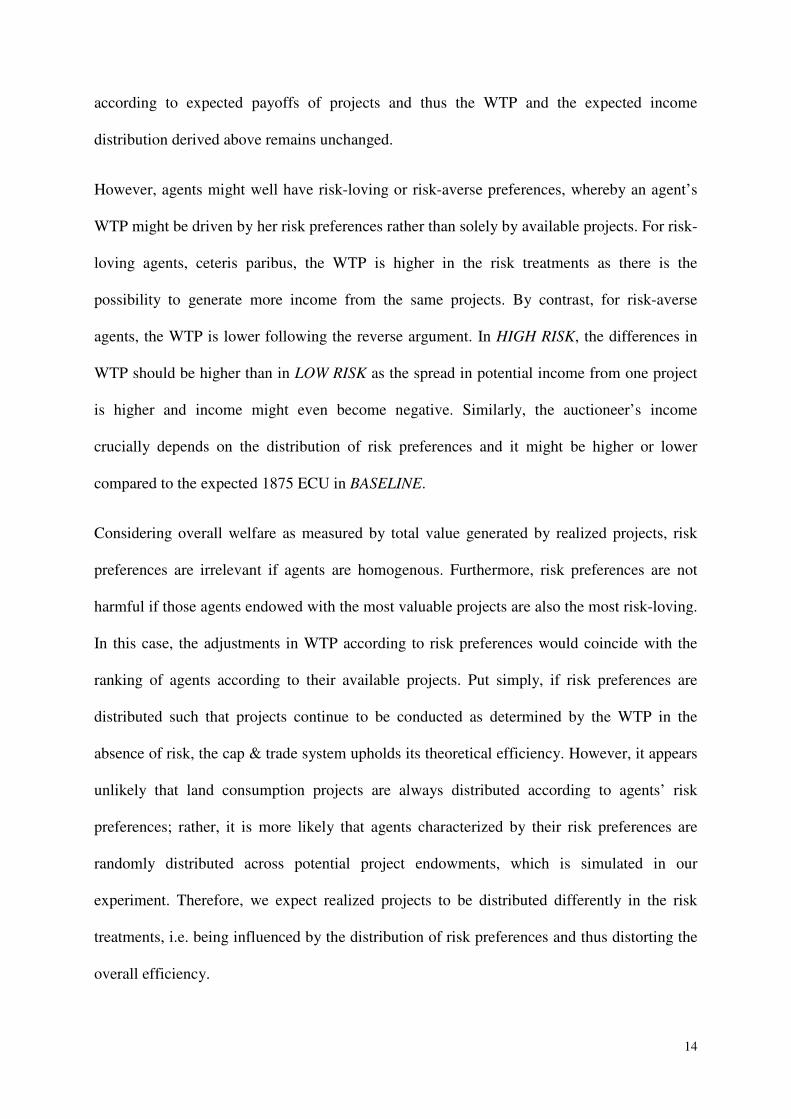
Table 4 summarizes these theoretical considerations and predictions for an efficient cap &
trade system.
Table 4. Theoretical predictions in equilibrium.
Behavior under the treatment condition of risk
Our two treatment conditions introduce risk to the general setting of the game. If we assume
that agents are risk neutral, all theoretical predictions remain valid. Risk-neutral agents act
project type A-1 A-2 B
value 100 80 10
certificates 8 8 0
total
land consumption # realizations 30 15 45 90
wealth total value 3000 1200 450 4650
certificates # bought 120 60 0 180
# free 120 60 0 180
income agents 1650 675 450 2775
auctioneer 1350 525 0 1875
14
according to expected payoffs of projects and thus the WTP and the expected income
distribution derived above remains unchanged.
However, agents might well have risk-loving or risk-averse preferences, whereby an agent’s
WTP might be driven by her risk preferences rather than solely by available projects. For risk-
loving agents, ceteris paribus, the WTP is higher in the risk treatments as there is the
possibility to generate more income from the same projects. By contrast, for risk-averse
agents, the WTP is lower following the reverse argument. In HIGH RISK, the differences in
WTP should be higher than in LOW RISK as the spread in potential income from one project
is higher and income might even become negative. Similarly, the auctioneer’s income
crucially depends on the distribution of risk preferences and it might be higher or lower
compared to the expected 1875 ECU in BASELINE.
Considering overall welfare as measured by total value generated by realized projects, risk
preferences are irrelevant if agents are homogenous. Furthermore, risk preferences are not
harmful if those agents endowed with the most valuable projects are also the most risk-loving.
In this case, the adjustments in WTP according to risk preferences would coincide with the
ranking of agents according to their available projects. Put simply, if risk preferences are
distributed such that projects continue to be conducted as determined by the WTP in the
absence of risk, the cap & trade system upholds its theoretical efficiency. However, it appears
unlikely that land consumption projects are always distributed according to agents’ risk
preferences; rather, it is more likely that agents characterized by their risk preferences are
randomly distributed across potential project endowments, which is simulated in our
experiment. Therefore, we expect realized projects to be distributed differently in the risk
treatments, i.e. being influenced by the distribution of risk preferences and thus distorting the
overall efficiency.
15
To illustrate these expected changes due to the treatment conditions, consider the simplified
case of two agents in LOW RISK or HIGH RISK: agent cautious has a Type A-1 project with
an expected payoff of 100ECU and agent gambler has a Type A-2 project with an expected
payoff of 80ECU.
Without risk, agent cautious would bid 11.25ECU per certificate in an auction, leaving her
with a minimum profit of 10ECU when granted the certificates, which is equal to the outside
option. Under risk, her WTP might be considerably lower as the expected payoff of 10ECU is
less favorable than the 10ECU certain profit of the outside option; accordingly, her WTP
becomes (11.25ECU – risk premiumcautious).
Agent gambler would bid 8.75ECU per certificate in the absence of risk, again leaving her
with a certain profit equal to the outside option of 10ECU. However, as gambler favors risk,
she is willing to pay more per certificate if there is an upside outcome of more than the
80ECU, even if it is mirrored by a symmetric downside outcome; accordingly, her WTP
becomes (8.75ECU + risk premiumgambler). Consequently, the efficiency of the certificate
allocation only holds if (11.25ECU – risk premiumcautious) > (8.75ECU + risk premiumgambler).
If this condition is violated, the less valuable project is realized and a loss in expected
aggregate income of 20ECU results.
As the expected aggregate income of all participants is the main policy objective, a cap &
trade system might lose the core advantage assumed by its proponents, i.e. efficiency in the
allocation of certificates. Our experiment investigates these potential distortions and allows us
to identify additional effects and problems associated with risk in land consumption project
revenues.
Despite heterogeneous risk preferences, our theoretical framework only considers
homogenous agents, i.e. endowed with identical cognitive abilities, as well as perfect
16
foresight and understanding of the game. This precludes speculation motives and path
dependencies in auction or market prices as subjects are fully capable of a perfect ex-ante
analysis and rational decision-making. Although these assumptions are highly unlikely to be
met by experimental participants, the predictions deducted above serve as useful benchmarks
in evaluating the observed behavior and identifying typical behavioral patterns that might
explain distortions to the system’s efficiency.
5. Results
We present our results in the order of the game’s three stages and according to the treatment
conditions: first, we investigate auction prices and distributional effects between agents and
the auctioneer; second, price dynamics and trade volumes in the secondary market are
analyzed; and third, we illustrate which projects are carried out and which land consumption
results. To provide an overarching conclusion, we assess the overall efficiency of the cap &
trade system and evaluate differences in income with respect to agent types.
5.1 Auctioning of certificates
In each period, half of the issued certificates are auctioned in a uniform price auction. As
shown in our theoretical analysis (section 4), prices should not exceed the fair value of
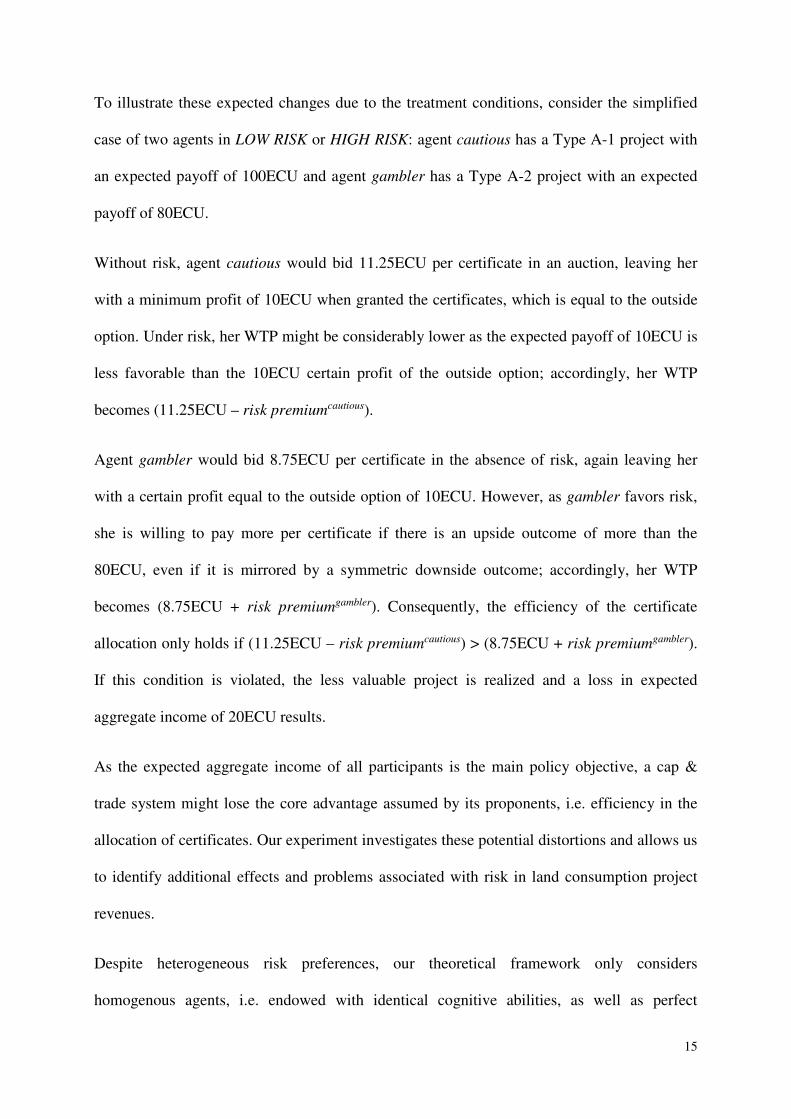
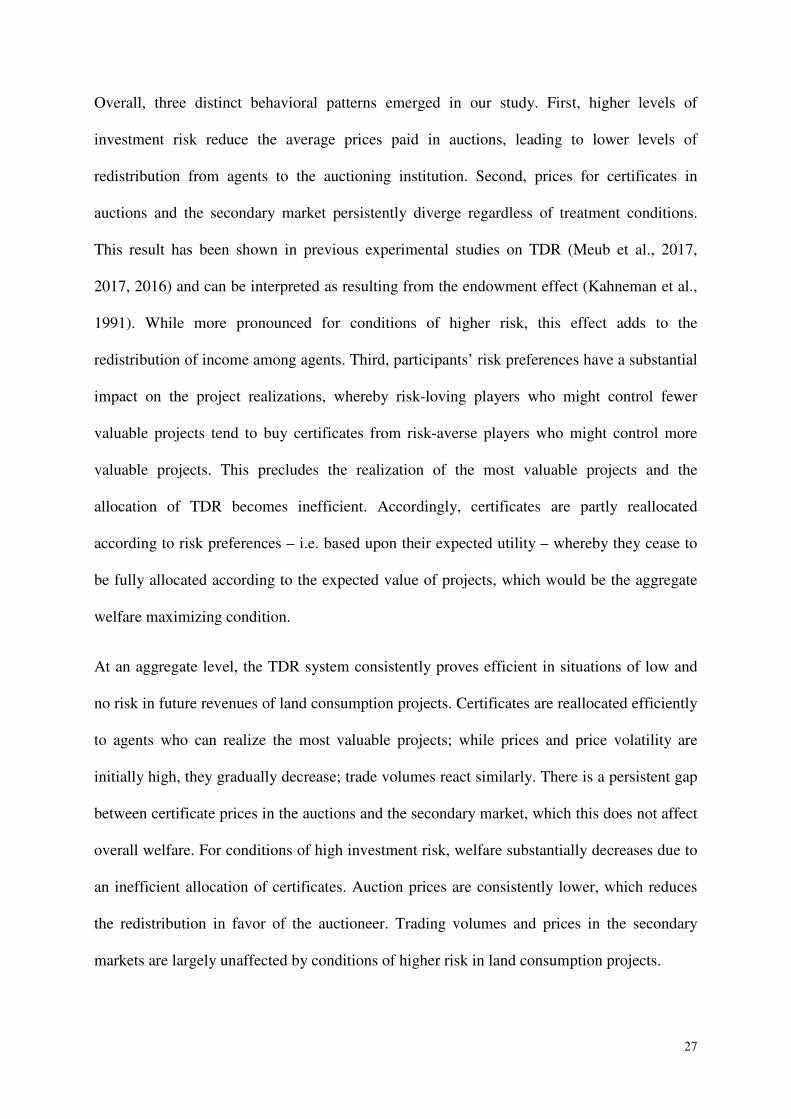
11.25ECU, assuming agents are risk neutral. Figure 1 illustrates auction prices over periods
with respect to treatment conditions.
17
Figure 1. Price dynamics in auctions by treatments
It can be seen that price dynamics across periods are fairly similar. Prices significantly exceed
the fair value at the beginning, before gradually decreasing to a level further below the fair
value. The decrease in prices initially appears to be rather steep yet it becomes weaker from
about period 7 onwards. Table 5 summarizes the unit auction prices at the society level and
provides statistical evidence.
BASELINE LOW RISK HIGH RISK
unit prices period<=7 20.99
(2.23)
22.78
(8.11)
19.5
(5.01)
period >7 8.43
(2.12)
6.54
(3.18)
5.00**
(3.18)
overall 14.29
(1.55)
14.12
(2.70)
11.77**
(1.71)
Table 5. Averages and standard deviations of unit auction prices by treatment
Note: Applying a Wilcoxon-Rank-Sum test against BASELINE where *, ** and *** indicate p-values smaller
than 0.1, 0.05 and 0.01, respectively; standard deviations in parentheses. Unless mentioned otherwise, all
calculations and tests are carried out at the society level.
For all treatments, prices are substantially lower in the second half of the game (Wilcoxon-
Sign-Rank test; for BASELINE z=2.521 and p=.0117, for LOW RISK z=2.666 and p=.0077,
0
5
10
15
20
30
40
50
60
1 5 10 15 1 5 10 15 1 5 10 15
BASELINE LOW RISK HIGH RISK
society average
unit p
rice
period
18
for HIGH RISK z=2.521 and p=.0117). On average, prices in HIGH RISK are closest to our
theoretical predictions and, more interestingly, they are significantly lower than in BASELINE
and LOW RISK.
Result 1a: Independent of the underlying risk in project revenues, unit auction prices initially
exceed fair values, yet tend to gradually decrease in a TDR system. High underlying risk
reduces auction prices.
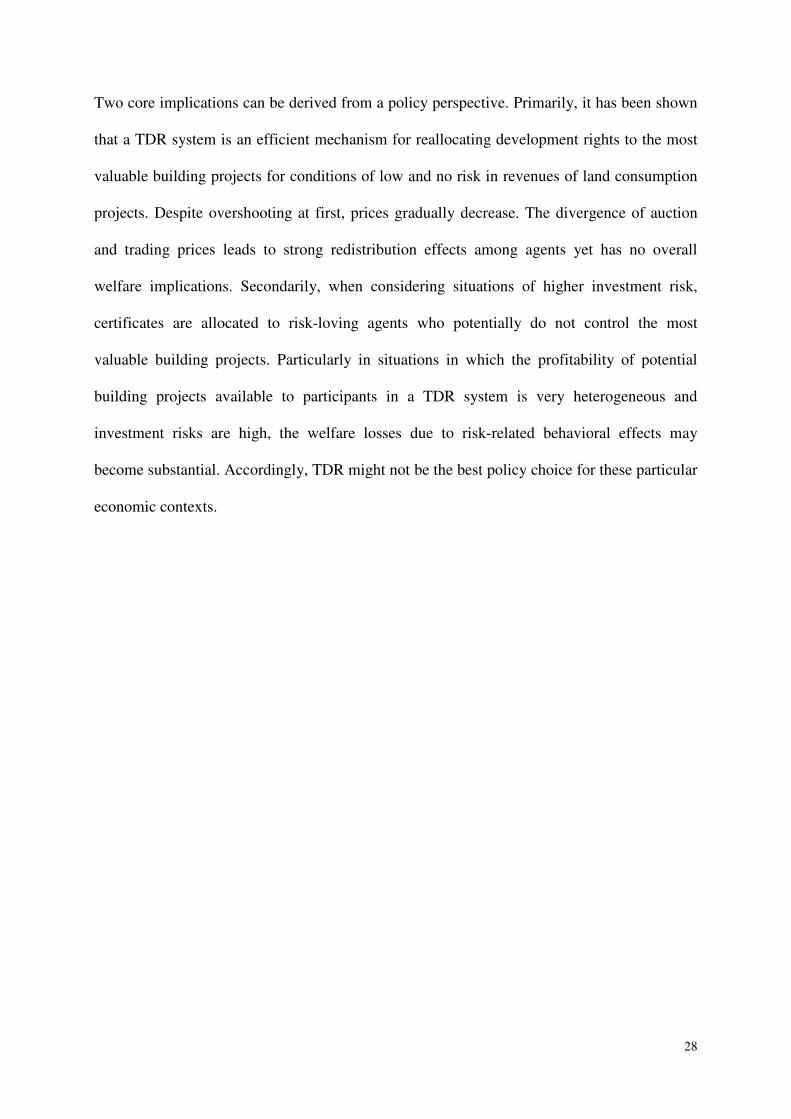
Recall that all payments in auctions transfer to income for the public authority auctioning the
certificates. Figure 2 depicts the auctioneer’s and societies’ total expected income relative to
the theoretical values derived above. A society’s total expected income is derived by
aggregating the expected values of realized projects and subtracting aggregate payments in
the auctions.
Figure 2. Distribution of income between auctioneer and societies by treatment
It can be seen that the auctioneer outperforms the theoretical benchmark, while societies
perform worse. This finding corresponds to Figure 1 and provides evidence of fairly high
050
10
015
020
0re
lative
expe
cte
d in
com
e
BASELINE LOW RISK HIGH RISK
auctioneer societies
19
prices in the initial periods, which benefit the auctioneer to a greater extent than the lower
prices during later periods diminish her income. Another interesting result from this
illustration is the substantially lower income discrepancy in HIGH RISK compared to
BASELINE or LOW RISK. It appears that agents confronted with a high level of uncertainty
become more cautious throughout the game when bidding in the auction to accumulate
certificates, which in turn substantially reduces the auctioneer’s income. Overall, these
findings can be explained by the prevalence of risk-averse behavior among agents.
Result 1b: Auctions in a TDR system redistribute income from agents to the auctioneer to a
much greater extent than suggested by theory. This effect is weaker when the underlying risk
is high as agents bid less and show risk-averse behavior.
5.2 Trading of certificates
In a secondary market, agents are able to buy and sell certificates at any price, restricted only
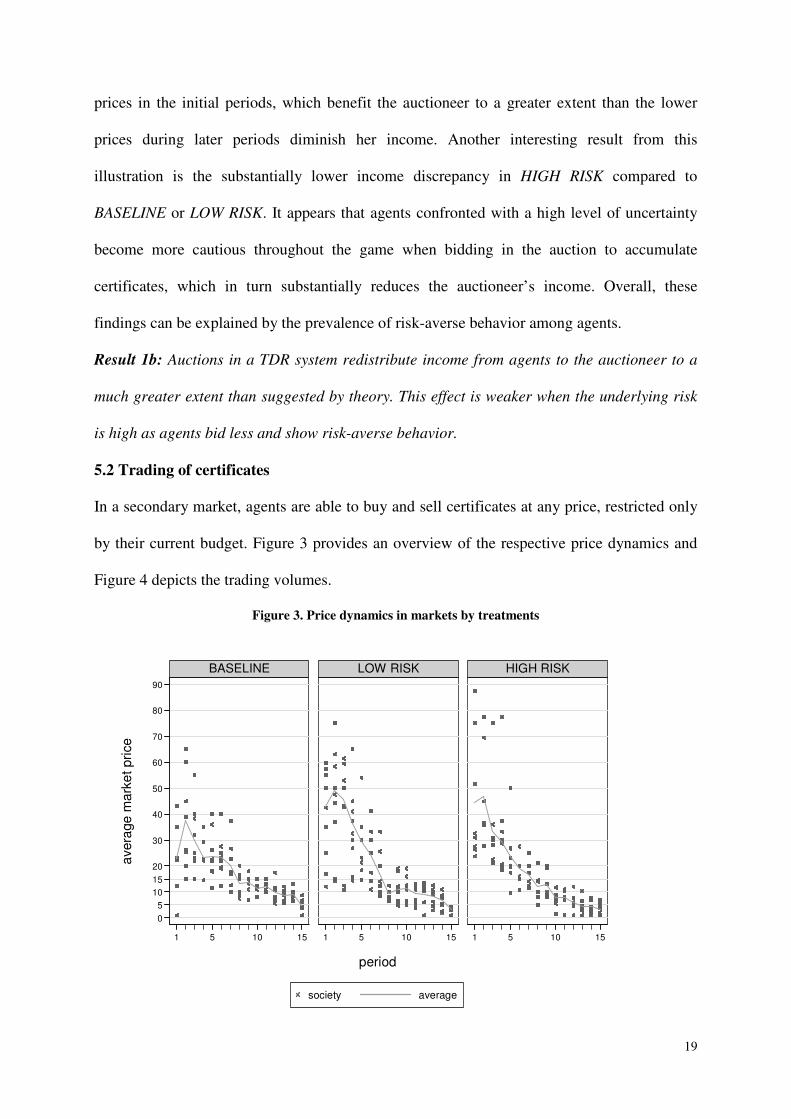
by their current budget. Figure 3 provides an overview of the respective price dynamics and
Figure 4 depicts the trading volumes.
Figure 3. Price dynamics in markets by treatments
0
5
10
15
20
30
40
50
60
70
80
90
1 5 10 15 1 5 10 15 1 5 10 15
BASELINE LOW RISK HIGH RISK
society average
avera
ge
ma
rke
t pri
ce
period
20
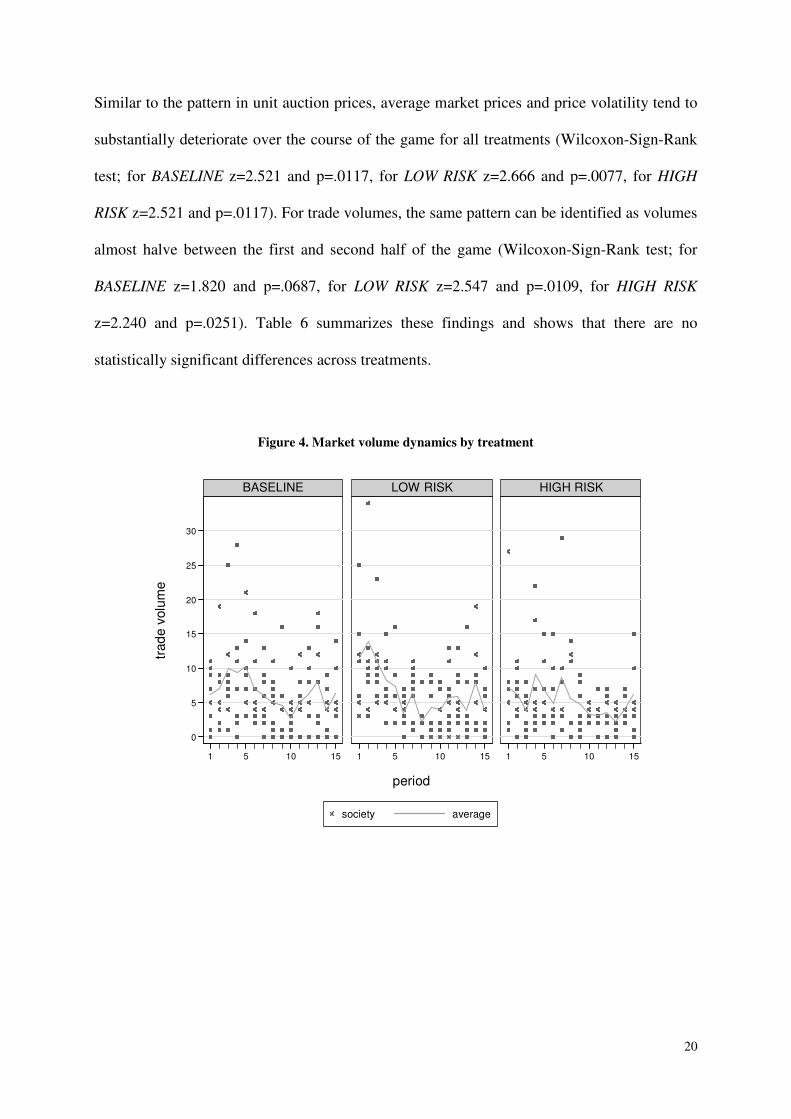
Similar to the pattern in unit auction prices, average market prices and price volatility tend to
substantially deteriorate over the course of the game for all treatments (Wilcoxon-Sign-Rank
test; for BASELINE z=2.521 and p=.0117, for LOW RISK z=2.666 and p=.0077, for HIGH
RISK z=2.521 and p=.0117). For trade volumes, the same pattern can be identified as volumes
almost halve between the first and second half of the game (Wilcoxon-Sign-Rank test; for
BASELINE z=1.820 and p=.0687, for LOW RISK z=2.547 and p=.0109, for HIGH RISK
z=2.240 and p=.0251). Table 6 summarizes these findings and shows that there are no
statistically significant differences across treatments.
Figure 4. Market volume dynamics by treatment
0
5
10
15
20
25
30
1 5 10 15 1 5 10 15 1 5 10 15
BASELINE LOW RISK HIGH RISK
society average
trad
e v
olu
me
period
21
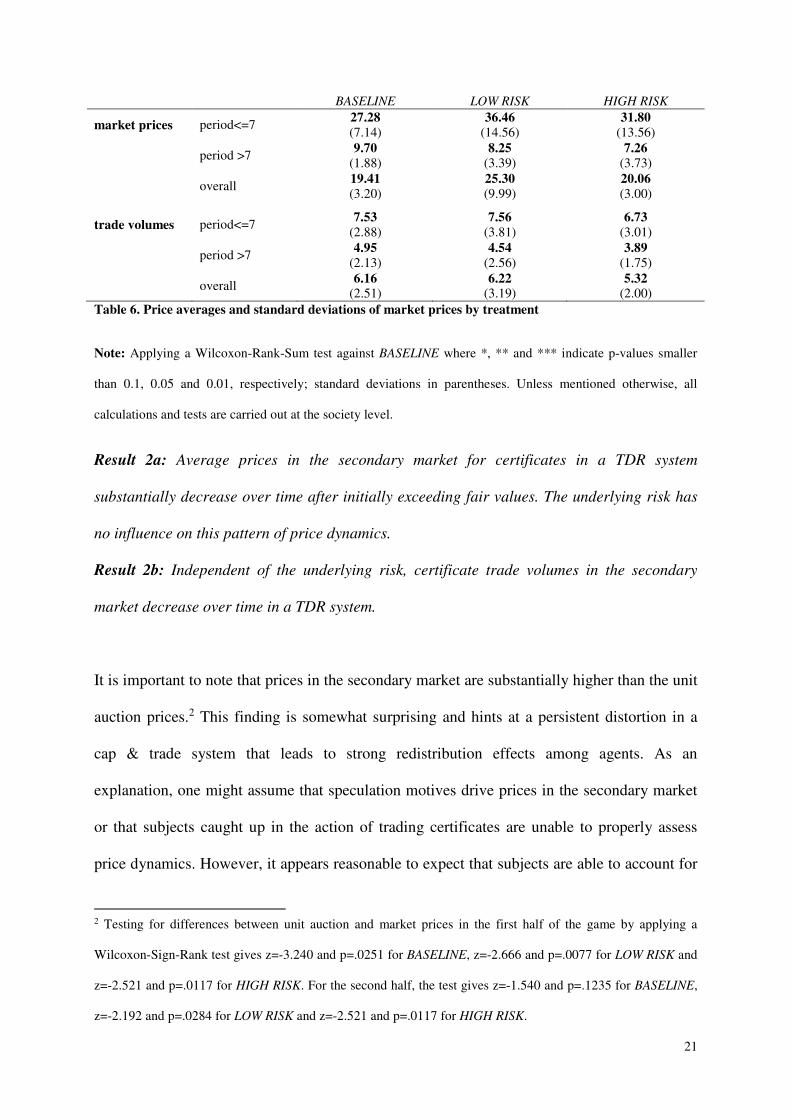
BASELINE LOW RISK HIGH RISK
market prices period<=7 27.28
(7.14)
36.46
(14.56)
31.80
(13.56)
period >7 9.70
(1.88) 8.25
(3.39) 7.26
(3.73)
overall 19.41
(3.20)
25.30
(9.99)
20.06
(3.00)
trade volumes period<=7 7.53
(2.88)
7.56
(3.81)
6.73
(3.01)
period >7 4.95
(2.13)
4.54
(2.56)
3.89
(1.75)
overall 6.16
(2.51) 6.22
(3.19) 5.32
(2.00)
Table 6. Price averages and standard deviations of market prices by treatment
Note: Applying a Wilcoxon-Rank-Sum test against BASELINE where *, ** and *** indicate p-values smaller
than 0.1, 0.05 and 0.01, respectively; standard deviations in parentheses. Unless mentioned otherwise, all
calculations and tests are carried out at the society level.
Result 2a: Average prices in the secondary market for certificates in a TDR system
substantially decrease over time after initially exceeding fair values. The underlying risk has
no influence on this pattern of price dynamics.
Result 2b: Independent of the underlying risk, certificate trade volumes in the secondary
market decrease over time in a TDR system.
It is important to note that prices in the secondary market are substantially higher than the unit
auction prices.2 This finding is somewhat surprising and hints at a persistent distortion in a
cap & trade system that leads to strong redistribution effects among agents. As an
explanation, one might assume that speculation motives drive prices in the secondary market
or that subjects caught up in the action of trading certificates are unable to properly assess
price dynamics. However, it appears reasonable to expect that subjects are able to account for
2 Testing for differences between unit auction and market prices in the first half of the game by applying a
Wilcoxon-Sign-Rank test gives z=-3.240 and p=.0251 for BASELINE, z=-2.666 and p=.0077 for LOW RISK and
z=-2.521 and p=.0117 for HIGH RISK. For the second half, the test gives z=-1.540 and p=.1235 for BASELINE,
z=-2.192 and p=.0284 for LOW RISK and z=-2.521 and p=.0117 for HIGH RISK.
22
overshooting prices in the secondary market by bidding more in the auctions to gather
certificates. Nonetheless, differences remain rather constant over time as for BASELINE/LOW
RISK/ HIGH RISK market prices in the second half of the game remain about 16%/26%/45%
higher than unit auction prices. Another plausible explanation is the endowment effect
(Kahneman et al., 1991). This well-established behavioral bias involves agents valuing some
good in their possession higher than the same good when they do not possess it, i.e. a
persistent divergence of a person’s willingness to pay and willingness to accept. Accordingly,
certificates acquired in the auction and passing in the possession of a particular agent might be
valued at a premium and might thus only be offered at higher prices than those paid in the
auctions. Following this interpretation, the persistent divergence of prices does not result from
speculation motives, but rather from the behavioral effect of agents perceiving that they
should receive a subjectively appropriate compensation for their loss in property.
Result 2c: Prices in the secondary market persistently exceed unit auction prices, which
points to a potentially inherent distortion in TDR systems.
5.3 Project realizations and land consumption
As outlined in section 3, agents can only carry out one project in each period of Type A or B.
Type A projects require the use of certificates and generate certain expected payoffs. Type B
projects are of a uniform value, yet their realization does not require certificates. Figure 5
summarizes the average number of projects actually carried out by treatment, as well as
depicting the theoretical optimum that maximizes aggregate welfare, which is given at 30
Type A-1 projects, 15 Type A-2 projects and 45 Type B projects per society.
23
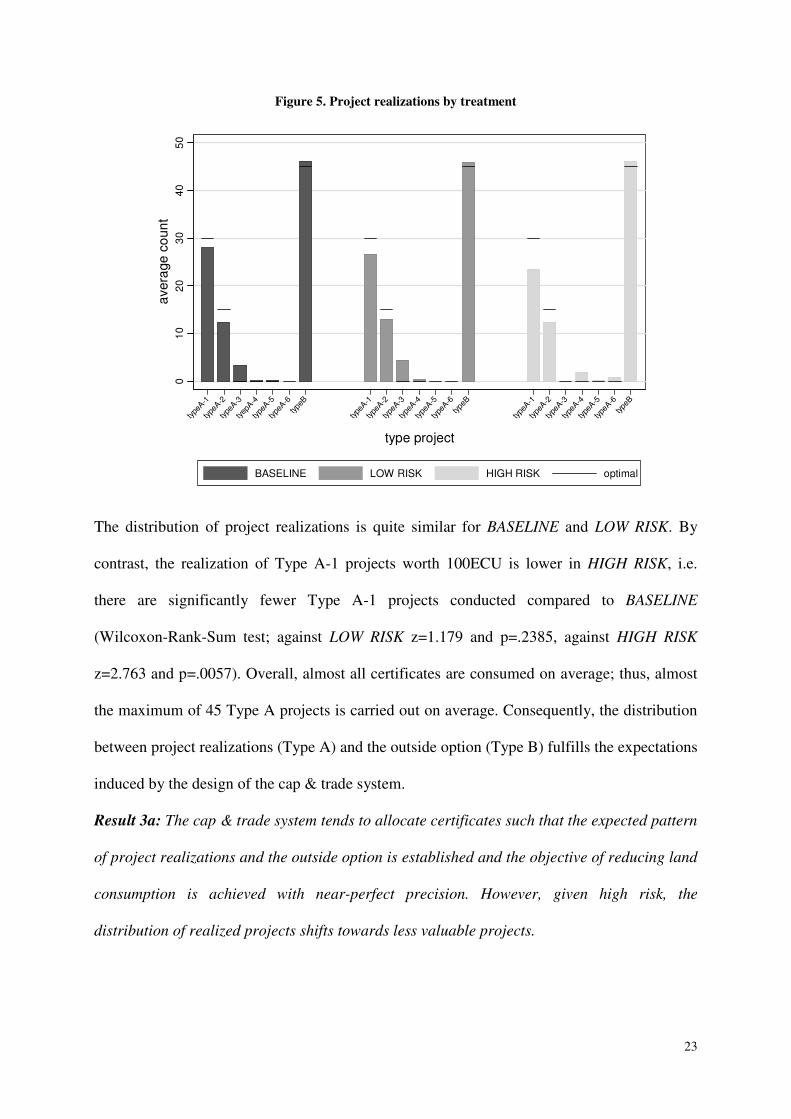
Figure 5. Project realizations by treatment
The distribution of project realizations is quite similar for BASELINE and LOW RISK. By
contrast, the realization of Type A-1 projects worth 100ECU is lower in HIGH RISK, i.e.
there are significantly fewer Type A-1 projects conducted compared to BASELINE
(Wilcoxon-Rank-Sum test; against LOW RISK z=1.179 and p=.2385, against HIGH RISK
z=2.763 and p=.0057). Overall, almost all certificates are consumed on average; thus, almost
the maximum of 45 Type A projects is carried out on average. Consequently, the distribution
between project realizations (Type A) and the outside option (Type B) fulfills the expectations
induced by the design of the cap & trade system.
Result 3a: The cap & trade system tends to allocate certificates such that the expected pattern
of project realizations and the outside option is established and the objective of reducing land
consumption is achieved with near-perfect precision. However, given high risk, the
distribution of realized projects shifts towards less valuable projects.
01
02
03
04
05
0
avera
ge
co
un
t
type
A-1
type
A-2
type
A-3
tyep
A-4
type
A-5
type
A-6
type
B
type
A-1
type
A-2
type
A-3
type
A-4
type
A-5
type
A-6
type
B
type
A-1
type
A-2
type
A-3
type
A-4
type
A-5
type
A-6
type
B
type project
BASELINE LOW RISK HIGH RISK optimal
24
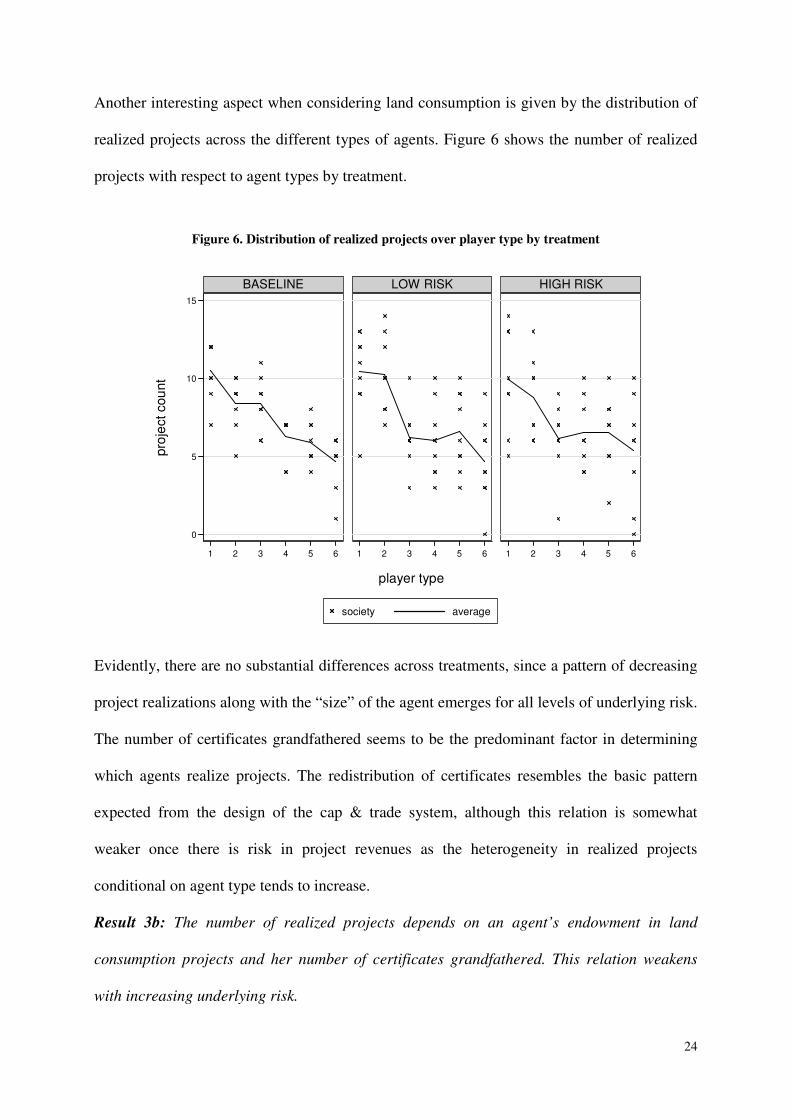
Another interesting aspect when considering land consumption is given by the distribution of
realized projects across the different types of agents. Figure 6 shows the number of realized
projects with respect to agent types by treatment.
Figure 6. Distribution of realized projects over player type by treatment
Evidently, there are no substantial differences across treatments, since a pattern of decreasing
project realizations along with the “size” of the agent emerges for all levels of underlying risk.
The number of certificates grandfathered seems to be the predominant factor in determining
which agents realize projects. The redistribution of certificates resembles the basic pattern
expected from the design of the cap & trade system, although this relation is somewhat
weaker once there is risk in project revenues as the heterogeneity in realized projects
conditional on agent type tends to increase.
Result 3b: The number of realized projects depends on an agent’s endowment in land
consumption projects and her number of certificates grandfathered. This relation weakens
with increasing underlying risk.
0
5
10
15
1 2 3 4 5 6 1 2 3 4 5 6 1 2 3 4 5 6
BASELINE LOW RISK HIGH RISK
society average
pro
ject cou
nt
player type
25
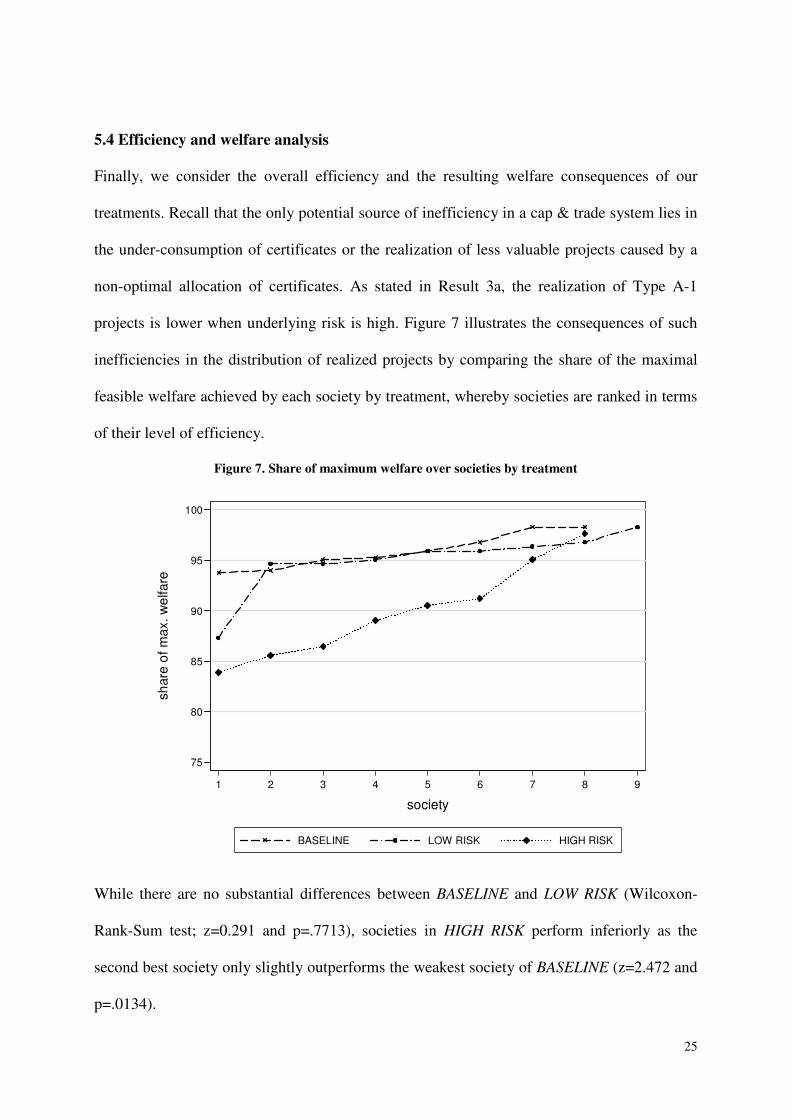
5.4 Efficiency and welfare analysis
Finally, we consider the overall efficiency and the resulting welfare consequences of our
treatments. Recall that the only potential source of inefficiency in a cap & trade system lies in
the under-consumption of certificates or the realization of less valuable projects caused by a
non-optimal allocation of certificates. As stated in Result 3a, the realization of Type A-1
projects is lower when underlying risk is high. Figure 7 illustrates the consequences of such
inefficiencies in the distribution of realized projects by comparing the share of the maximal
feasible welfare achieved by each society by treatment, whereby societies are ranked in terms
of their level of efficiency.
Figure 7. Share of maximum welfare over societies by treatment
While there are no substantial differences between BASELINE and LOW RISK (Wilcoxon-
Rank-Sum test; z=0.291 and p=.7713), societies in HIGH RISK perform inferiorly as the
second best society only slightly outperforms the weakest society of BASELINE (z=2.472 and
p=.0134).
75
80
85
90
95
100
sh
are
of m
ax. w
elfare
1 2 3 4 5 6 7 8 9
society
BASELINE LOW RISK HIGH RISK
26
Result 4: A TDR system to reduce land consumption achieves lower levels of aggregate
welfare when the associated risk in revenues of land consumption projects is high. This is due
to an inefficient distribution of certificates, which leads to a realization of projects with
inferior value.
6. Discussion and conclusion
In this study, we suggest that experimental empirical evidence can contribute to studying the
determinants of successful TDR systems by providing complementary insights to previous
theoretical- and case study-based investigations. This methodological approach to the
question of an optimal design of TDR systems necessarily has certain restrictions. For
instance, given that laboratory experiments require a number of assumptions and
simplifications to achieve a high degree of internal validity and understanding among
participants, not all complexities of real-world applications of TDR can be implemented.
Similarly, student participants might act differently than actual agents in charge of land use
decisions. While both of these aspects place certain limitations on the direct applicability of
our results, we nonetheless argue that the counterfactual results of experimental studies
providing ceteris paribus analyses of the impact of core parameters to a system of TDR yield
valuable insights unattainable by field data. We suggest that the uncertainty associated with
obtaining, trading and using TDR constitutes is one of these key features in land use decisions
and needs to be taken into account when considering policy options and institutional designs.
Therefore, we use a novel experimental design that captures the core aspects of a TDR
system. Two additional treatments are conducted to assess the impact of varying degrees of
investment risk. Our experimental setting enables us to observe the individual and overall
market effects of the treatment variable and formulate policy implications for the design of
TDR systems in economic contexts associated with different degrees of risk.
27
Overall, three distinct behavioral patterns emerged in our study. First, higher levels of
investment risk reduce the average prices paid in auctions, leading to lower levels of
redistribution from agents to the auctioning institution. Second, prices for certificates in
auctions and the secondary market persistently diverge regardless of treatment conditions.
This result has been shown in previous experimental studies on TDR (Meub et al., 2017,
2017, 2016) and can be interpreted as resulting from the endowment effect (Kahneman et al.,
1991). While more pronounced for conditions of higher risk, this effect adds to the
redistribution of income among agents. Third, participants’ risk preferences have a substantial
impact on the project realizations, whereby risk-loving players who might control fewer
valuable projects tend to buy certificates from risk-averse players who might control more
valuable projects. This precludes the realization of the most valuable projects and the
allocation of TDR becomes inefficient. Accordingly, certificates are partly reallocated
according to risk preferences – i.e. based upon their expected utility – whereby they cease to
be fully allocated according to the expected value of projects, which would be the aggregate
welfare maximizing condition.
At an aggregate level, the TDR system consistently proves efficient in situations of low and
no risk in future revenues of land consumption projects. Certificates are reallocated efficiently
to agents who can realize the most valuable projects; while prices and price volatility are
initially high, they gradually decrease; trade volumes react similarly. There is a persistent gap
between certificate prices in the auctions and the secondary market, which this does not affect
overall welfare. For conditions of high investment risk, welfare substantially decreases due to
an inefficient allocation of certificates. Auction prices are consistently lower, which reduces
the redistribution in favor of the auctioneer. Trading volumes and prices in the secondary
markets are largely unaffected by conditions of higher risk in land consumption projects.
28
Two core implications can be derived from a policy perspective. Primarily, it has been shown
that a TDR system is an efficient mechanism for reallocating development rights to the most
valuable building projects for conditions of low and no risk in revenues of land consumption
projects. Despite overshooting at first, prices gradually decrease. The divergence of auction
and trading prices leads to strong redistribution effects among agents yet has no overall
welfare implications. Secondarily, when considering situations of higher investment risk,
certificates are allocated to risk-loving agents who potentially do not control the most
valuable building projects. Particularly in situations in which the profitability of potential
building projects available to participants in a TDR system is very heterogeneous and
investment risks are high, the welfare losses due to risk-related behavioral effects may
become substantial. Accordingly, TDR might not be the best policy choice for these particular
economic contexts.
29
Literature
Bengston, D.N., Fletcher, J.O., Nelson, K.C. (2004). Public policies for managing urban
growth and protecting open space: policy instruments and lessons learned in the
United States. Landscape and urban planning 69 (2), 271-286.
doi:10.1016/j.landurbplan.2003.08.007
Camerer, C.F., Loewenstein, G., Rabin, M. (Eds.). (2011). Advances in behavioral
economics. Princeton: Princeton University Press.
Chan, E.H.W., Hou, J. (2015). Developing a framework to appraise the critical success factors
of transfer development rights (TDRs) for built heritage conservation, Habitat
International 46, 35-43. doi: 10.1016/j.habitatint.2014.10.018
Charness, G., Fehr, E. (2015). From the lab to the real world. Laboratory experiments provide
precise quantitative predictions of peer effects in the field. Science 350 (6260), 512-
513. doi: 0.1126/science.aad4343
Charness, G., Gneezy, U., Imas, A. (2013). Experimental methods: Eliciting risk preferences.
Journal of Economic Behavior & Organization 87, 43-51. doi:
10.1016/j.jebo.2012.12.023
Chetty, R. (2015). Behavioral economics and public policy: A pragmatic perspective.
American Economic Review 105(5), 1-33. doi: 10.1257/aer.p20151108
Coalition treaty between the CDU/CSU and SPD (2013). English translation retrieved from:
http://www.kas.de/wf/doc/kas_36853-544-2-30.pdf?140820093605
Convery, F.J. (2009). Reflections - the emerging literature on emissions trading in Europe.
Review of Environmental Economics and Policy 3(1), 121-137. doi:
10.1093/reep/ren020
Cox, J.C., Harrison, G.W. (Eds.) (2008). Risk aversion in experiments. Bingley: Emerald
Group Publishing.
Crosetto, P., Filippin, A. (2013). The “bomb” risk elicitation task. Journal of Risk and
Uncertainty 47(1), 31-65. doi: 10.1007/s11166-013-9170-z
Danner, J.C. (1997). TDRs-great idea but questionable value. Appraisal Journal 65(2), 133-
142.
Falk, A., Fehr, E. (2003). Why labour market experiments?. Labour Economics 10(4), 399-
406. doi:10.1016/S0927-5371(03)00050-2
Falk, A., Heckman, J.J. (2009). Lab experiments are a major source of knowledge in the
social sciences. Science 326(5952), 535-538. doi: 10.1126/science.1168244
30
Fischbacher, U. (2007). z-Tree: Zurich toolbox for ready-made economic experiments.
Experimental Economics, 10 (2), 171-178. doi: 10.1007/s10683-006-9159-4
Greenstone, M., Gayer, T. (2009). Quasi-experimental and experimental approaches to
environmental economics. Journal of Environmental Economics and Management 57,
21-44. doi:10.1016/j.jeem.2008.02.004
Greiner, B. (2004). An online recruiting system for economic experiments. In Kremer, K.,
Macho, V. (Eds.), GWDG Bericht 63 (79-93). Goettingen: Gesellschaft für Wiss.
Datenverarbeitung.
Grimm, V., Ilieva, L. (2013). An experiment on emissions trading: the effect of different
allocation mechanisms. Journal of Regulatory Economics, 44 (3), 308-338. doi:
10.1007/s11149-013-9222-y
Harman, B., Choy, D.L. (2011). Perspectives on tradable development rights for ecosystem
service protection: lessons from an Australian peri-urban region. Journal of
Environmental Planning and Management 54(5), 617-635. doi:
10.1080/09640568.2010.526405
Harman, B., Pruetz, R., Houston, P. (2015). Tradeable development rights to protect peri-
urban areas: lessons from the United States and observations on Australian practice.
Journal of Environmental Planning and Management 58(2), 357-381. doi:
10.1080/09640568.2013.859130
Henger, R. (2013). Tradable Planning Permits to Control Land Development in Germany: A
Laboratory Testbed Experiment. Journal of Environmental Policy & Planning, 15(2),
843-852. doi: 10.1080/1523908X.2013.766578
Henger, R., Bizer, K. (2010). Tradable planning permits for land-use control in Germany.
Land Use Policy, 27, 843-852. doi:10.1016/j.landusepol.2009.11.003
Janssen-Jansen, L.B. (2008). Space for Space, a transferable development rights initiative for
changing the Dutch landscape. Landscape and Urban Planning 87(3), 192-200.
doi:10.1016/j.landurbplan.2008.06.002
Jones, L.R., Vossler, C.A. (2014). Experimental tests of water quality trading markets. Journal
of Environmental Economics and Management 68, 449-462. doi:
10.1016/j.jeem.2014.08.001
Kahneman, D., Knetsch, J.L., Thaler, R.H. (1991). Experimental Test of the Endowment
Effect and the Coase Theorem. Journal of Political Economy 98(6), 1325-1348.
31
Kaplowitz, M. D., Machemer, P., Pruetz, R. (2008). Planners’ experiences in managing
growth using transferable development rights (TDR) in the United States. Land Use
Policy 25(3), 378-387. doi:10.1016/j.landusepol.2007.07.004
Kopits, E., McConnell, V., Walls, M. (2008). Making markets for development rights work:
What determines demand?. Land Economics 84(1), 1-16.
Levinson, A. (1997). Why oppose TDRs?: Transferable development rights can increase
overall development. Regional Science and Urban Economics 27(3), 283-296.
Lynch, L., Lovell, S. J. (2003). Combining spatial and survey data to explain participation in
agricultural land reservation programs. Land Economics 79(2), 259-276.
Lynch, L., Musser, W.N. (2001). A relative efficiency analysis of farmland preservation
programs. Land Economics 77(4), 577-594.
Machemer, P.L., Kaplowitz, M.D. (2002). A framework for evaluating transferable
development rights programmes. Journal of Environmental Planning and Management
45(6), 773-795. doi: 10.1080/0964056022000024334
Madrian, B.C. (2014). Applying insights from behavioral economics to policy design.
National Bureau of Economic Research Working Paper No. w20318.
Menghini, G., Gemperle, F., Seidl, I., Axhausen, K.W. (2015). Results of an agent-based
market simulation for transferable development rights (TDR) in Switzerland.
Environment and Planning B: Planning and Design 42(1), 157-183. doi:
10.1068/b120066p
Meub, L., Proeger, T., Bizer, K., Henger, R. (2017). The political economy of certificates for
land use in Germany. Experimental evidence, forthcoming in: Journal of
Environmental Policy & Planning. Doi: 10.1080/1523908X.2016.1266932.
Meub, L., Proeger, T., Bizer, K., Henger, R. (2017). Die Effizienz von
Zuteilungsmechanismen bei Flächenzertifikaten zwischen Versteigerung und
Grandfathering – experimentelle Evidenz. Zeitschrift für Wirtschaftspolitik 66(1), 80-
109.
Meub, L., Proeger, T., Bizer, K., Henger, R. (2016). Experimental evidence on the resilience
of a cap & trade system for land use in Germany. Land Use Policy 51, 95-108. doi:
10.1016/j.landusepol.2015.10.018
Micelli, E. (2002). Development rights markets to manage urban plans in Italy. Urban Studies
39(1), 141-154. doi: 10.1080/00420980220099122
Miller, A. J. (1999). Transferable development rights in the constitutional landscape: Has
Penn Central failed to weather the storm. Natural Resources Journal 39, 459-516.
32
Nuissl, H., Schroeter-Schlaack, C. (2009). On the economic approach to the containment of
land consumption. Environmental Science and Policy 12, 270-280.
Proeger, T., Meub, L., Bizer, K. (2016). The role of communication on an experimental
market for tradable development rights. Cege Discussion Paper 271, University of
Goettingen.
Pruetz, R. (1997). Saved by Development: Preserving Environmental Areas, Farmland and
Historic Landmarks with Transfer of Development Rights. Burbank: Arje Press.
Pruetz, R., Standridge, N. (2008). What makes transfer of development rights work? Success
factors from research and practice. Journal of the American Planning Association
75(1), 78-87. doi: 10.1080/01944360802565627
Pruetz, R., Standridge, N. (2009). What makes transfer of development rights work?: Success
factors from research and practice. Journal of the American Planning Association
75(1), 78-87. doi: 10.1080/01944360802565627
Santos, A.C. (2011). Behavioural and experimental economics: are they really transforming
economics?. Cambridge Journal of Economics 35(4), 705-728.
Santos, R., Schroeter-Schlaack, C., Antunes, P., Ring, I., Clemente, P. (2015). Reviewing the
role of habitat banking and tradable development rights in the conservation policy
mix. Environmental Conservation 42(4), 1-12. doi: 10.1017/S0376892915000089
Stranlund, J.K., Murphy, J.J., Spraggon, J.M. (2014). Price controls and banking in emissions
trading: An experimental evaluation. Journal of Environmental Economics and
Management 68, 71-86. doi: 10.1016/j.jeem.2014.04.002
Tan, R., Beckmann, V. (2010). Diversity of practical quota systems for farmland preservation:
a multicountry comparison and analysis. Environment and planning. C, Government &
policy 28(2), 211-224. doi: 10.1068/c09174
Thorsnes, P., Simons, G.P. (1999). Letting the market preserve land: The case for a market‐
driven transfer of development rights program. Contemporary Economic Policy 17(2),
256-266. Doi: DOI: 10.1111/j.1465-7287.1999.tb00680.x
Van der Veen, M., Spaans, M., Janssen-Jansen, L. (2010). Using compensation instruments as
a vehicle to improve spatial planning: Challenges and opportunities. Land Use Policy
27(4), 1010-1017. doi: 10.1016/j.landusepol.2010.01.003
Vejchodskáa, E. (2015). Tradable planning permits versus auctioned tradable development
rights: different trading agents, different policy outcomes. Journal of Environmental
Planning and Management. doi: 10.1080/09640568.2015.1077105

33
Wang, H., Tao, R., Tong, J. (2009). Trading land development rights under a planned land use
system: the “Zhejiang Model”. China & World Economy 17(1), 66-82.
Ward, P. (2013). On the use of tradable development rights for reducing flood risk. Land Use
Policy 31, 576-583. doi: 10.1016/j.landusepol.2012.09.004
34
Appendix: Instructions for the BASELINE treatment. The differences for LOW/HIGH
RISK are indicated in braces.
OVERVIEW OF THE GAME
You can earn money in this game by realizing projects and trade with certificates. At the
beginning, you will be randomly assigned to a group of 6 players, which will remain constant
during the 15 periods of the game. All prices and values in the game will be paid in ECU with
up to two positions after decimal point. 100 ECU convert to 1€ for your payoff.
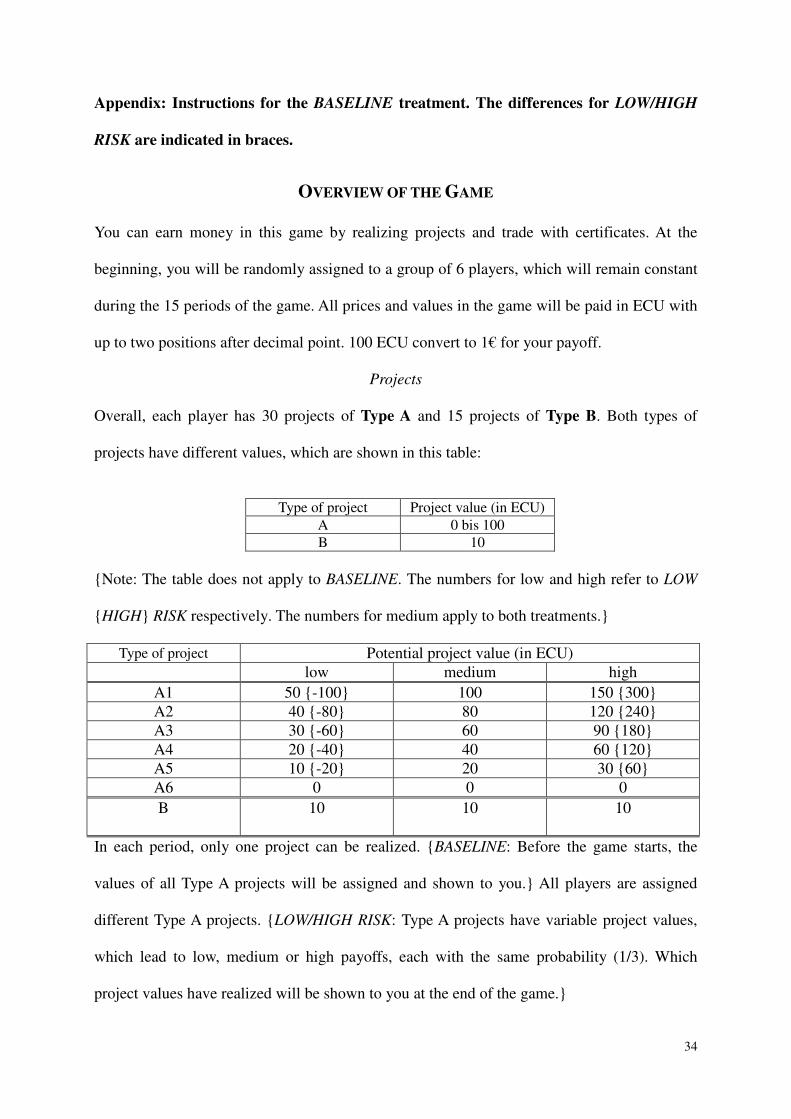
Projects
Overall, each player has 30 projects of Type A and 15 projects of Type B. Both types of
projects have different values, which are shown in this table:
Type of project Project value (in ECU)
A 0 bis 100
B 10
{Note: The table does not apply to BASELINE. The numbers for low and high refer to LOW
{HIGH} RISK respectively. The numbers for medium apply to both treatments.}
Type of project Potential project value (in ECU)
low medium high
A1 50 {-100} 100 150 {300}
A2 40 {-80} 80 120 {240}
A3 30 {-60} 60 90 {180}
A4 20 {-40} 40 60 {120}
A5 10 {-20} 20 30 {60}
A6 0 0 0
B 10 10 10
In each period, only one project can be realized. {BASELINE: Before the game starts, the
values of all Type A projects will be assigned and shown to you.} All players are assigned
different Type A projects. {LOW/HIGH RISK: Type A projects have variable project values,
which lead to low, medium or high payoffs, each with the same probability (1/3). Which
project values have realized will be shown to you at the end of the game.}

35
Certificates
For the realization of Type A projects, you need 8 certificates each, Type B projects do not
require certificates. Certificates are assigned to you at the beginning of each period and
auctioned. Additionally, certificates can be traded among the players. In the game, you receive
an endowment of 700 ECU which you can use to buy certificates at the auction and from the
other players. You can also sell certificates and thus increase your payoff.
Your payoff
The payoffs you receive in the course of the game, as well as the sum of all {LOW/HIGH
RISK: actually} realized projects add up to your final payoff. Further, a basic payoff of 400
ECU will be added.
COURSE OF THE GAME
Each of the 15 periods follows an identical course, which consists of three phases.
Phase 1: Allocation and auctioning of certificates
At the beginning of each period, 12 certificates are allocated. The number of certificates a
player receives is determined randomly at the beginning of the game and does not change
during the game.
Additionally, after the allocation, 12 certificates are auctioned. Depending on your current
funds, you can bid for a number of certificates of your choosing at a unitary price. The 12
highest bids will receive the certificates to the price of the lowest successful bid.
Phase 2: Trading of certificates
Following the allocation and auctioning, this phase lets you trade with the other five players,
i.e. buy and sell certificates. You can offer a trade yourself and also accept offers from other
players. To clarify this, you see the respective screen of the trading phase below:

36
Offering a trade
In the lower box, you can enter a price (in ECU) and the respective amount of certificates that
you would like to buy.
� By clicking “searching”, all players are shown your buying desire in the left box.
Once another player agrees to your offer, you will receive the respective number of
certificates. The total value (price x quantity) of the trade will be withdrawn from your
funds.
� By clicking “offering”, all players are shown your sell offer in the box on the right.
Once another player accepts your offer, you sell the respective number of certificates.
The total value (price x quantity) of the trade will be added to your funds.
Accepting another player’s offer
In the boxes on the right and left side, you can see all current buy and sell offers for
certificates. If you choose an offer and click on “sell now!” or “buy now!”, you make the
trade with the respective player.
You are allowed to trade as often as you please. You can also make multiple sell and buy
offers at the same time. The trading phase ends automatically once 2 minutes have passed.

37
Phase 3: Realizing projects
In the third phase of the game, you can realize one of your projects. You will receive the
respective payoffs ({LOW/HIGH RISK: actually realized} project value in ECU) at the end of
the game. After the third phase, the next period begins. Certificates that are not used in one
period can be saved for subsequent periods. Note, however, that you will not receive a payoff
for certificates that remain unused until the end of period 15!