TRACKS-#64210991-v1-742 GOLD COAST WATER AND WASTE … · 8/30/2017 · Surfers Paradise . 742nd...
50
742 Adopted Report of the Gold Coast Water and Waste Committee Meeting held on Wednesday 30 August 2017 at 2 pm City of Gold Coast Council Chambers 135 Bundall Road Surfers Paradise
Transcript of TRACKS-#64210991-v1-742 GOLD COAST WATER AND WASTE … · 8/30/2017 · Surfers Paradise . 742nd...

742
Adopted Report of the
Gold Coast Water and Waste Committee Meeting
held on
Wednesday 30 August 2017
at
2 pm
City of Gold Coast Council Chambers 135 Bundall Road Surfers Paradise

742nd Council Meeting 5 September 2017 2 Gold Coast Water And Waste Committee Meeting 30 August 2017 Adopted Report
Index 742
Adopted Report
Meeting
Item Direct. File Page Subject
Presentations:
- Proposed Recycled Water Network Improvement and Expansion
- Gold Coast Water and Waste Connections Policy and Procedure
1
GCWW CM787/788/06/01(P1) 4 Gold Coast Water and Waste Committee
Action List and Forward Planning Schedule
2
GCWW WSS1125/1227/02(P1) 8 Gold Coast Water and Waste Annual
Register of Council Directions
3
GCWW FN334/252/18(P1) 10 Water and Sewerage Services Financial
Performance as at 31 July 2017
4
GCWW FN334/252/18(P1) 31 Waste Services Financial Performance as
at 31 July 2017
5
GCWW WSS1125/324(P1) /
LG314/621/18/010 43 Gold Coast Water and Waste Customer
Satisfaction Survey 2017
General Business
KEY: OCEO - Office of the Chief Executive Officer GCWW - Gold Coast Water & Waste CI - City Infrastructure OCOO - Office of the Chief Operating Officer CS - Community Services OS - Organisational Services EDMP - Economic Development & Major Projects PE - Planning & Environment

742nd Council Meeting 5 September 2017 3 Gold Coast Water And Waste Committee Meeting 30 August 2017 Adopted Report ADOPTED AT COUNCIL 5 SEPTEMBER 2017
RESOLUTION G17.0905.029 moved Cr Taylor seconded Cr PJ Young That the Report of the Gold Coast Water & Waste Committee’s Recommendations of Wednesday, 30 August 2017, numbered WW17.0830.001 to WW17.0830.005, be adopted.
CARRIED
ATTENDANCE Cr P Taylor (Chairperson) Cr K Boulton Cr R La Castra Cr PJ Young Cr G Tozer Cr PC Young Cr G O’Neill Mr P Heaton Director Gold Coast Water and Waste APOLOGY / LEAVE OF ABSENCE PRESENTATIONS - Proposed Recycled Water Network Improvement and Expansion - Gold Coast Water and Waste Connections Policy and Procedure

742nd Council Meeting 5 September 2017 4 Gold Coast Water And Waste Committee Meeting 30 August 2017 Adopted Report ITEM 1 GOLD COAST WATER AND WASTE GOLD COAST WATER AND WASTE COMMITTEE ACTION LIST AND FORWARD PLANNING SCHEDULE CM787/788/06/01(P1)
Proposed Date
Subject Action Officers
Action
September 2017
Community Partnerships (includes Water Watch Program)
Joshua Evans/ Kathy Baker
September 2017
Smart Metering of Community Title Scheme (units and complexes).
Chris Owen / Scott Emmonds
Following a request from Cr Taylor.
October 2017 Site Tour of Gold Coast Water and Waste facilities
Wendy Nelson Proposed date 27 October 2017.
November 2017
Recycled Water Master Plan and Pricing Principles Recommendation: WW17.0315.006
Kevin Page / Anthony Ottaway
Council notes that a detailed master plan and program for the potential recycled water system upgrades will be brought back to Council in late 2017.
December 2017
Improved Control and Access to Waste and Recycling Facilities Resolution: G17.0621.014
Matt Fraser 6 That Council endorses assessment of potential electronic access control at Council’s waste and recycling facilities, with a report to be presented by the end of 2017 on a proposed approach.
7 That Council endorses assessment for potential improved control of inappropriate behaviours and issue of infringement notices at waste and recycling centres, with a report to be presented by the end of 2017 on a proposed approach.
May 2018 Commercial Food Waste Agenda Item Mairead Lenihan

742nd Council Meeting 5 September 2017 5 Gold Coast Water And Waste Committee Meeting 30 August 2017 Adopted Report ITEM 1 GOLD COAST WATER AND WASTE GOLD COAST WATER AND WASTE COMMITTEE ACTION LIST AND FORWARD PLANNING SCHEDULE CM787/788/06/01(P1)
Proposed Date
Subject Action Officers
Action
June 2018 Improved Control and Access to Waste and Recycling Facilities Resolution: G17.0621.014
Matt Fraser That Council endorses assessment of the potential for designation of waste and recycling centres into domestic waste only, and full waste facilities, with a report to be presented on the proposal by the end of 2017-18 financial year.
July 2018 Scientific Services Delivery Model – Implementation Plan
Tim Beales That the Director Gold Coast Water and Waste report back to Council in July 2018 on progress associated with the Scientific Services Implementation Plan.
To be confirmed
Metering and Leakage Recommendation: WW16.0720.004
Scott Emmonds
Council notes that further consideration is being given to residential meter location and other issues to support ongoing development of Council’s Concealed Leakage Remission Policy, which will be brought to Council at a later date.

742nd Council Meeting 5 September 2017 6 Gold Coast Water And Waste Committee Meeting 30 August 2017 Adopted Report ITEM 1 (CONTINUED) GOLD COAST WATER AND WASTE COMMITTEE ACTION LIST AND FORWARD PLANNING SCHEDULE CM787/788/06/01(P1)
Proposed Date
Subject Action Officers
Action
To be confirmed
Overview of Measures to Mitigate the Impact of Plastic Waste on the Marine Environment Recommendation: WW16.1109.005
Joshua Evans 1. That Council undertake a marine debris data analysis of the materials collected through the City’s canal cleaning program. The results of this analysis will determine the following:
a) Whether a targeted public awareness through education is likely to be effective;
b) Identification of the number of additional Stormwater Quality Improvement Devices required to be retrofitted into the existing stormwater network.
c) Improve the collaboration of volunteer groups to ensure their efforts are effective in reducing marine debris.
3. That consideration at a more appropriate time is given to the provision of a green waste collection service to all residents to reduce the impact of illegal dumping of green waste (which comprises of over 70% of collected materials) into the City’s Canals. 4. That a Litter and Illegal Dumping Management Plan is developed by Environmental Health, Compliance and Lifeguard Services (in accordance with the Solid Waste Strategy 2024). 5. That Council investigate feasibility of a further roll-out of drinking water refill stations to reduce the need for residents and visitors to purchase bottled water and the resulting litter.

742nd Council Meeting 5 September 2017 7 Gold Coast Water And Waste Committee Meeting 30 August 2017 Adopted Report ITEM 1 (CONTINUED) GOLD COAST WATER AND WASTE COMMITTEE ACTION LIST AND FORWARD PLANNING SCHEDULE CM787/788/06/01(P1)
Proposed Date
Subject Action Officers
Action
December 2018
Alternate Billing Options for Water and Sewerage Utility Charges
Recommendation: WW17.0426.006
Anthony Ottaway
2 That in view of the benefits to customers, Council endorses a future transition to rolling billing for water and sewerage utility charges with both fixed and variable charges billed in arrears.
3 The proposed future transition to rolling billing to be scheduled to align with the establishment of a new utility billing system.
4 That a report to be provided back to Council by December 2018 providing details of on the proposed transition plan.
RECOMMENDATION It is recommended that Council resolve as follows:
That the Action List and Forward Planning Schedule for Gold Coast Water and Waste Committee be noted.
Authorised by:
Paul Heaton iSPOT#37409759 Director Gold Coast Water and Waste
COMMITTEE RECOMMENDATION WW17.0830.001 moved Cr PJ Young seconded Cr O’Neill
That the Action List and Forward Planning Schedule for Gold Coast Water and Waste Committee be noted.
CARRIED
742nd Council Meeting 5 September 2017 8 Gold Coast Water And Waste Committee Meeting 30 August 2017 Adopted Report ITEM 2 GOLD COAST WATER AND WASTE GOLD COAST WATER AND WASTE ANNUAL REGISTER OF COUNCIL DIRECTIONS WSS1125/1227/02(P1)
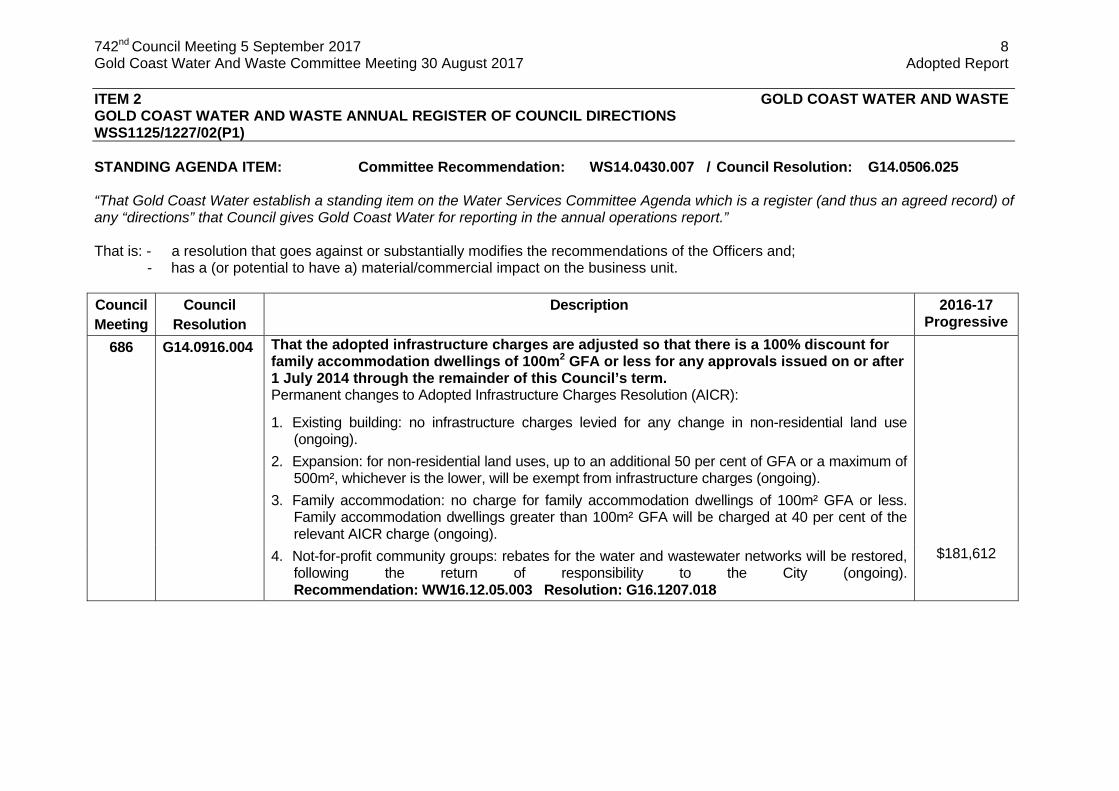
STANDING AGENDA ITEM: Committee Recommendation: WS14.0430.007 / Council Resolution: G14.0506.025 “That Gold Coast Water establish a standing item on the Water Services Committee Agenda which is a register (and thus an agreed record) of any “directions” that Council gives Gold Coast Water for reporting in the annual operations report.” That is: - a resolution that goes against or substantially modifies the recommendations of the Officers and;
- has a (or potential to have a) material/commercial impact on the business unit. Council Meeting
Council Resolution
Description 2016-17 Progressive
686 G14.0916.004 That the adopted infrastructure charges are adjusted so that there is a 100% discount for family accommodation dwellings of 100m2 GFA or less for any approvals issued on or after 1 July 2014 through the remainder of this Council’s term. Permanent changes to Adopted Infrastructure Charges Resolution (AICR):
1. Existing building: no infrastructure charges levied for any change in non-residential land use (ongoing).
2. Expansion: for non-residential land uses, up to an additional 50 per cent of GFA or a maximum of 500m², whichever is the lower, will be exempt from infrastructure charges (ongoing).
3. Family accommodation: no charge for family accommodation dwellings of 100m² GFA or less. Family accommodation dwellings greater than 100m² GFA will be charged at 40 per cent of the relevant AICR charge (ongoing).
4. Not-for-profit community groups: rebates for the water and wastewater networks will be restored, following the return of responsibility to the City (ongoing). Recommendation: WW16.12.05.003 Resolution: G16.1207.018
$181,612

742nd Council Meeting 5 September 2017 9 Gold Coast Water And Waste Committee Meeting 30 August 2017 Adopted Report ITEM 2 (Continued) GOLD COAST WATER AND WASTE ANNUAL REGISTER OF COUNCIL DIRECTIONS WSS1125/1227/02(P1) RECOMMENDATION It is recommended that Council resolve as follows: That the Gold Coast Water and Waste Annual Register of Council Directions be noted. Authorised by:
Paul Heaton iSPOT#43956542 Director Gold Coast Water and Waste
COMMITTEE RECOMMENDATION WW17.0830.002 moved Cr PJ Young seconded Cr O’Neill That the Gold Coast Water and Waste Annual Register of Council Directions be noted.
CARRIED

742nd Council Meeting 5 September 2017 10 Gold Coast Water And Waste Committee Meeting 30 August 2017 Adopted Report ITEM 3 GOLD COAST WATER AND WASTE WATER AND SEWERAGE SERVICES FINANCIAL PERFORMANCE AS AT 31 JULY 2017 FN334/252/18(P1) Attachment 1: Detailed Income Statement 1 BASIS FOR CONFIDENTIALITY Not Applicable. 2 EXECUTIVE SUMMARY Not Applicable. 3 PURPOSE OF REPORT The purpose of this report is to provide the Gold Coast Water and Waste Committee with an update of Water and Sewerage Services financial performance as at 31 July 2017. Comparisons are against Council’s Initial Adopted Budget. 4 PREVIOUS RESOLUTIONS Not Applicable. 5 DISCUSSION 5.1 High Level Financial Summary
Table 1 – Water & Sewerage Services - Year to Date Financial Summary
Table 1 above shows the financial position for Water and Sewerage Services as at 31 July is 2.3% or $0.48 million above forecast. Main contributing factor to this favourable variance is Controllable operating expenditure below forecast by $1.09 million. This is offset by unfavourable variances of:
Operating revenue – below forecast by $0.31 million, and Capital revenue – below forecast by $0.27 million.
Actual Initial Budget Var Var
Initial Budget
Month ended 31 July 2017 ($M) ($M) ($M) % ($M)
Operating Revenue 41.34 41.65 (0.31) (0.7%) 507.86
Flow -Dependant Expenditure 15.45 15.42 (0.03) (0.2%) 192.02
Operating Revenue net of Flow Dependant Expenditure 25.89 26.23 (0.34) (1.3%) 315.84
Gross Margin 0.66 0.66 0.66
Total Controllable Operating Expenditure 7.43 8.53 1.09 12.8% 105.08
Loss on Sale of Assets 0.00 0.00 0.00 0.0% 5.00
Net Profit before Capital Revenue 18.46 17.70 0.75 4.2% 205.76
Total Capital Revenue 3.07 3.34 (0.27) (8.2%) 60.13
EBITDA 21.53 21.05 0.48 2.3% 265.88
Year to Date Full YearWater & Sewerage Services Financial Summary

742nd Council Meeting 5 September 2017 11 Gold Coast Water And Waste Committee Meeting 30 August 2017 Adopted Report ITEM 3 (Continued) WATER AND SEWERAGE SERVICES FINANCIAL PERFORMANCE AS AT 31 JULY 2017 FN334/252/18(P1) Major variances will be discussed in the following paragraphs with a detailed Income Statement contained in Attachment 1 to the report. 5.2 Operating Revenue ($0.31 million Unfavourable) 5.2.1 Rates Revenue Financial Summary ($0.46 million Unfavourable)
Table 2 – Water and Sewer Rates Revenue Forecast
Rates revenue is $0.46 million lower than the initial budget, with service charges being below forecast by $0.87 million (4.3%) and volumetric charges being greater than forecast by $0.46 million (2.0%). Service Charges
Year-to-date water service charges are lower than the initial budget by $0.30 million, due to lower than forecast connections. Total water service connections at 31 July 2017 are 252,748.
Year-to-date sewerage service charges are $0.57 million lower than the initial budget, due to lower than forecast connections. Total sewerage service connections at 31 July 2017 are 240,731.
Volumetric Charges Volumetric charges are reflective of:
Billable demand for July being lower than the initial budget by 48ML, influencing the unfavourable variance of $0.18 million.
Sewage volumetric charges for July being higher than the initial budget by $0.55 million.
Non-drinking water volumetric charges being lower than the initial budget by of $0.01 million, reflective of lower demand of 7ML for July.
Concealed leakage remissions being lower than the initial budget by $0.04 million Concealed leakage remissions are discussed further in Section 5.9.2.
Water & Sewerage Rates RevenueActual Initial
Budget Var Var
Initial Budget
Month ended 31 July 2017 ($M) ($M) ($M) % ($M)
Service Charges
Water 5.31 5.61 (0.30) (5.3%) 66.62
Sew erage 14.15 14.71 (0.57) (3.9%) 174.86
Total Service Charges 19.46 20.33 (0.87) (4.3%) 241.48
Volumetric Charges
Water - gross 17.19 17.38 (0.19) (1.1%) 217.32
Sew erage - gross 3.45 2.90 0.55 19.0% 36.28
Non-Drinking Water 0.07 0.08 (0.01) (15.1%) 0.97
Less: Concealed Leakage (0.11) (0.17) 0.06 34.2% (2.07)
Total Volumetric Charges 20.60 20.19 0.41 2.0% 252.49
Total Rates Revenue 40.06 40.52 (0.46) (1.1%) 493.98
Full YearYear to Date

742nd Council Meeting 5 September 2017 12 Gold Coast Water And Waste Committee Meeting 30 August 2017 Adopted Report ITEM 3 (Continued) WATER AND SEWERAGE SERVICES FINANCIAL PERFORMANCE AS AT 31 JULY 2017 FN334/252/18(P1) 5.2.2 Other Operating Revenue ($0.01 million Favourable) Interest on outstanding rates is $0.01 million above forecast due to June interest not being processed until July. Processing of the June interest was delayed as a result the implementation of Local Government Platform. 5.3 Flow Dependant Expenditure ($0.03 million Unfavourable) Bulk Water Purchases ($0.03 million Unfavourable)
The actual bulk water demands for July 2017 was slightly higher than the initial budget by 9ML.
The below graphical representation compares water supplied versus the demand forecast adopted for the purpose of the initial budget. Rainfall recorded each month is also incorporated.
Graph 2 Analysis of Water Supplied versus Demand Forecast

742nd Council Meeting 5 September 2017 13 Gold Coast Water And Waste Committee Meeting 30 August 2017 Adopted Report ITEM 3 (Continued) WATER AND SEWERAGE SERVICES FINANCIAL PERFORMANCE AS AT 31 JULY 2017 FN334/252/18(P1) 5.4 Controllable Expenditure ($1.09 million Favourable) At a whole of business unit level, Controllable Expenses are $1.09 million (12.8%) below year to date forecast. Variances at individual line item level will be further explained below. Employee Expenses ($0.17 million Favourable) Employee expenses are $0.17 million or 4.4% below forecast. Favourable variance is due to the number of vacancies across the business. Materials and Services ($0.75 million Favourable) Materials and Services are $0.75 million or 34% below forecast, largely due to delays in receipting of July expenses. With the finalisation of the 2016-17 financial year, the ability to receipt expenses back in the month of June is extended until mid-July. The consequence of this is that the recognition of expenses for the month of July is generally lower. Consultants ($0.16 million Favourable) Consultants are $0.16 million or 99.6% below forecast. Contract award and scoping of works is being progressed for condition assessment programs with these being the main contributors to the variance. This underspend should be addressed over the coming months. 5.5 Loss on Sale of Assets Asset processing for the 2017-18 financial year is not expected to begin until the second quarter due to finalisation of the 2016-17 accounts. 5.6 Capital Revenue ($0.27 million Unfavourable) Developer contributions are $0.27 million or 7.9% below forecast. Developer contributions are dependent on the level of development activity across the City which fluctuates over the year. In line with the forecast no contributed assets were processed during July with processing expected to resume in the second quarter following finalisation of the 2016-17 accounts.

742nd Council Meeting 5 September 2017 14 Gold Coast Water And Waste Committee Meeting 30 August 2017 Adopted Report ITEM 3 (Continued) WATER AND SEWERAGE SERVICES FINANCIAL PERFORMANCE AS AT 31 JULY 2017 FN334/252/18(P1) 5.7 Community Returns Income Tax ($0.54 million Unfavourable) Water and Sewerage Services is a commercialised business unit subject to the Local Government Taxation Equivalents Regime (LGTER). As part of this regime, a PAYG Instalment Activity Statement must be prepared and submitted on a monthly basis, with payment a PAYG instalment. Current instalment rate as issued by our tax assessors is 7.91%. The instalment rate is applied to total revenue generated to derive the amount of PAYG tax payable each month. Taxation expense recorded to date represents the total of PAYG instalments calculated for the first month of the financial year, based upon revenue recognised for the period. At year end, a final taxation return will be prepared, based upon taxable income and utilising the company taxation rate of 30% to calculate total taxation payable for the year. Relevant adjustments will be made to record this annual tax liability to Council.

742nd Council Meeting 5 September 2017 15 Gold Coast Water And Waste Committee Meeting 30 August 2017 Adopted Report ITEM 3 (Continued) WATER AND SEWERAGE SERVICES FINANCIAL PERFORMANCE AS AT 31 JULY 2017 FN334/252/18(P1) 5.8 Capital Program 5.8.1 Capital Expenditure
The Water and Sewerage Services initial capital program consists of 59 projects totalling $75.1 million.
Table 3 – Capital Expenditure ($‘000’s)
Year to date capital expenditure of $2.11 million represents a variance of 15.5% below the year to date forecast of $2.49 million. Product Variances Sewerage The sewerage program is $0.32 million (17.0%) below forecast. The following projects are the main contributors to the variance:
Sewage Treatment Plant Process Tank Refurbishment (STP) - $0.11 million below
forecast. This project is tracking below forecast due to failure of the Coombabah aeration rotor which required priority repairs, delaying other project works.
Benowa A102 Sewer Rising Main Stage 1 - $0.10 million below forecast. This project is tracking below forecast due to lower than anticipated design, contract, procurement and supervision costs.
Sewer Gravity Main Asset Renewals 2017-18 - $0.09 million below forecast. This project is
tracking below forecast due a later than anticipated award of the contract.
Water The Water program is $0.18 million (66.1%) above forecast. The following projects are the main contributors to the variance: Reservoir Priority Roof - $0.12 million above forecast. This project is tracking above
forecast due to the installation of the roof sheet at reservoir SP1 and the structural steel supporting members at reservoir WG1 being ahead of the original schedule.
Non-Core Water The non-core water program is $0.25 million (77.2%) below forecast due to ongoing transitional arrangements associated with the newly awarded holistic metering contract.
Product Full Year
Actual Expenditure ($M)
Revised Forecast ($M)
Variance($M)
Variance%
Initial Budget ($M)
Sewerage 1.56 1.88 0.32 17.0% 61.29
Water 0.46 0.28 (0.18) (66.1%) 8.46
Non-Core Water 0.07 0.32 0.25 77.2% 5.27
Corporate 0.01 0.01 0.00 10.6% 0.08
Total Capital 2.11 2.49 0.39 15.5% 75.10
Water and Sewerage Services Capital Expenditureas at 31 July 2017
Year to Date
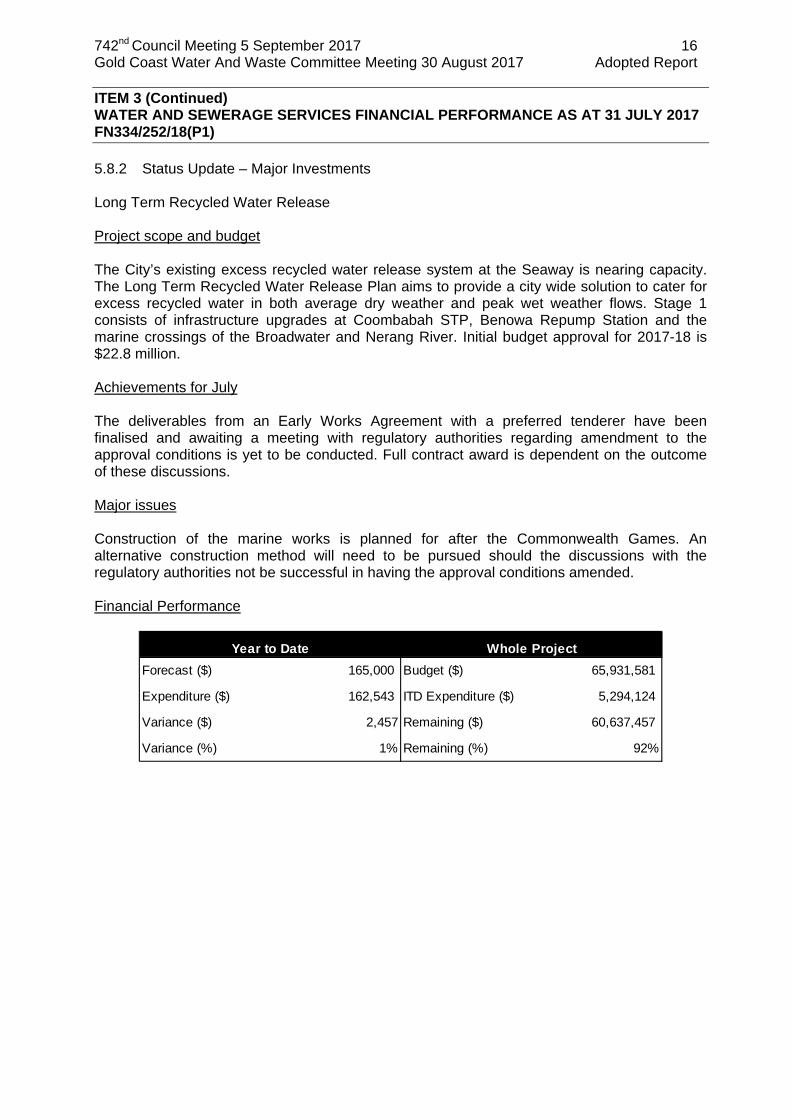
742nd Council Meeting 5 September 2017 16 Gold Coast Water And Waste Committee Meeting 30 August 2017 Adopted Report ITEM 3 (Continued) WATER AND SEWERAGE SERVICES FINANCIAL PERFORMANCE AS AT 31 JULY 2017 FN334/252/18(P1) 5.8.2 Status Update – Major Investments Long Term Recycled Water Release Project scope and budget The City’s existing excess recycled water release system at the Seaway is nearing capacity. The Long Term Recycled Water Release Plan aims to provide a city wide solution to cater for excess recycled water in both average dry weather and peak wet weather flows. Stage 1 consists of infrastructure upgrades at Coombabah STP, Benowa Repump Station and the marine crossings of the Broadwater and Nerang River. Initial budget approval for 2017-18 is $22.8 million. Achievements for July The deliverables from an Early Works Agreement with a preferred tenderer have been finalised and awaiting a meeting with regulatory authorities regarding amendment to the approval conditions is yet to be conducted. Full contract award is dependent on the outcome of these discussions. Major issues Construction of the marine works is planned for after the Commonwealth Games. An alternative construction method will need to be pursued should the discussions with the regulatory authorities not be successful in having the approval conditions amended. Financial Performance
Forecast ($) 165,000 Budget ($) 65,931,581
Expenditure ($) 162,543 ITD Expenditure ($) 5,294,124
Variance ($) 2,457 Remaining ($) 60,637,457
Variance (%) 1% Remaining (%) 92%
Year to Date Whole Project

742nd Council Meeting 5 September 2017 17 Gold Coast Water And Waste Committee Meeting 30 August 2017 Adopted Report ITEM 3 (Continued) WATER AND SEWERAGE SERVICES FINANCIAL PERFORMANCE AS AT 31 JULY 2017 FN334/252/18(P1) Benowa A102 Sewer Rising Main Stage 1 Project scope and budget This project aims to provide flexibility in the operations of the southern portion of the Eastern and Western Force Main and to provide the ability to efficiently and economically maintain the main. This project will provide adequate sewage system infrastructure to support system operations leading up to the Commonwealth Games, provide the ability to shutdown A102 sewerage rising main for up to 24 hours to facilitate emergency repairs, new construction or downtime during sustained power outages and provide infrastructure that is resilient and fit for system conditions. The approved Initial Budget is $5.52 million. Achievements for July Construction is progressing as scheduled, with 350m of pipeline completed. Major issues Construction sequencing has had to be amended to accommodate major events undertaken in the precinct. Financial Performance
Forecast ($) 500,000 Budget ($) 6,080,034
Expenditure ($) 396,998 ITD Expenditure ($) 955,032
Variance ($) 103,002 Remaining ($) 5,125,002
Variance (%) 21% Remaining (%) 84%
Year to Date Whole Project
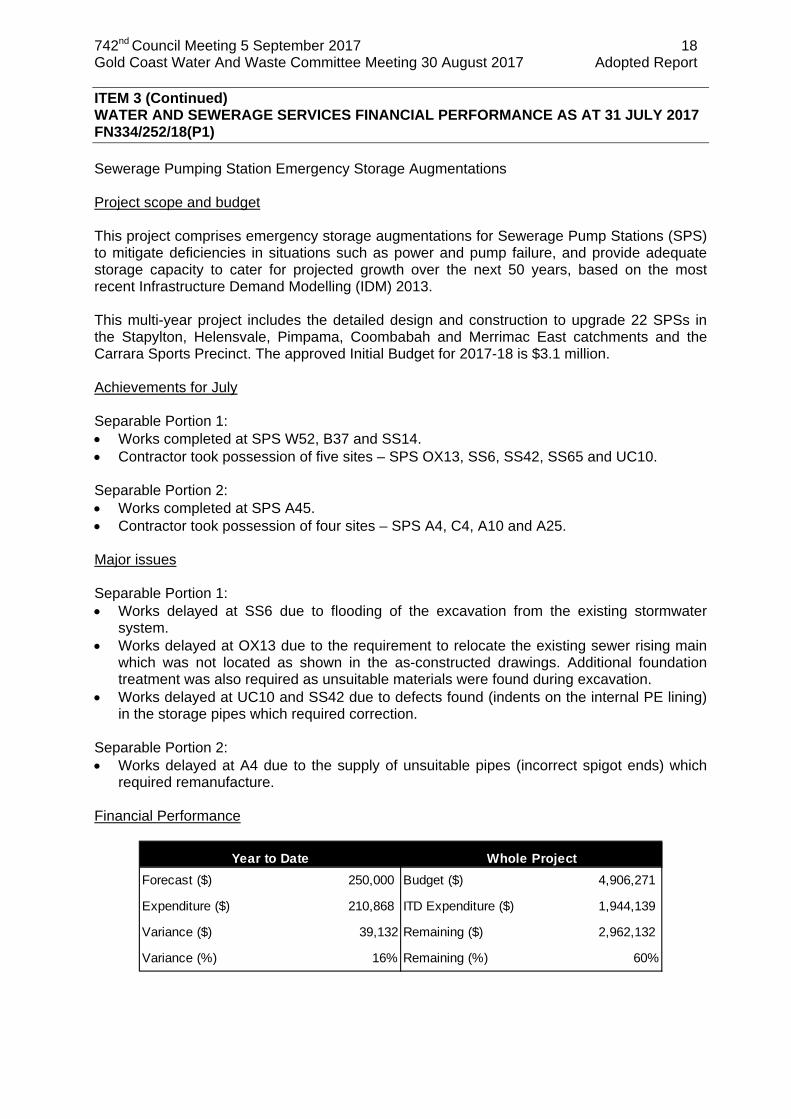
742nd Council Meeting 5 September 2017 18 Gold Coast Water And Waste Committee Meeting 30 August 2017 Adopted Report ITEM 3 (Continued) WATER AND SEWERAGE SERVICES FINANCIAL PERFORMANCE AS AT 31 JULY 2017 FN334/252/18(P1) Sewerage Pumping Station Emergency Storage Augmentations Project scope and budget This project comprises emergency storage augmentations for Sewerage Pump Stations (SPS) to mitigate deficiencies in situations such as power and pump failure, and provide adequate storage capacity to cater for projected growth over the next 50 years, based on the most recent Infrastructure Demand Modelling (IDM) 2013. This multi-year project includes the detailed design and construction to upgrade 22 SPSs in the Stapylton, Helensvale, Pimpama, Coombabah and Merrimac East catchments and the Carrara Sports Precinct. The approved Initial Budget for 2017-18 is $3.1 million. Achievements for July Separable Portion 1: Works completed at SPS W52, B37 and SS14. Contractor took possession of five sites – SPS OX13, SS6, SS42, SS65 and UC10.
Separable Portion 2: Works completed at SPS A45. Contractor took possession of four sites – SPS A4, C4, A10 and A25. Major issues Separable Portion 1: Works delayed at SS6 due to flooding of the excavation from the existing stormwater
system. Works delayed at OX13 due to the requirement to relocate the existing sewer rising main
which was not located as shown in the as-constructed drawings. Additional foundation treatment was also required as unsuitable materials were found during excavation.
Works delayed at UC10 and SS42 due to defects found (indents on the internal PE lining) in the storage pipes which required correction.
Separable Portion 2: Works delayed at A4 due to the supply of unsuitable pipes (incorrect spigot ends) which
required remanufacture.
Financial Performance
Forecast ($) 250,000 Budget ($) 4,906,271
Expenditure ($) 210,868 ITD Expenditure ($) 1,944,139
Variance ($) 39,132 Remaining ($) 2,962,132
Variance (%) 16% Remaining (%) 60%
Year to Date Whole Project

742nd Council Meeting 5 September 2017 19 Gold Coast Water And Waste Committee Meeting 30 August 2017 Adopted Report ITEM 3 (Continued) WATER AND SEWERAGE SERVICES FINANCIAL PERFORMANCE AS AT 31 JULY 2017 FN334/252/18(P1) Elanora STP Digester A and Sludge Heater Refurbishment Project scope and budget This project includes the refurbishment of digester A and replacement of the non-compliant gas pipework, railings, roof seal and digester heaters at Elanora Sewage Treatment Plant (STP) including opportunistic replacement of internal mechanical, electrical and civil components. The approved Initial Budget is $1.73 million. Achievements for July Specification drafting for construction tender progressed and is expected to be completed by the end of August 2017. Major issues No major issues. Financial Performance
Forecast ($) 3,500 Budget ($) 2,053,604
Expenditure ($) 3,266 ITD Expenditure ($) 26,870
Variance ($) 234 Remaining ($) 2,026,734
Variance (%) 7% Remaining (%) 99%
Year to Date Whole Project

742nd Council Meeting 5 September 2017 20 Gold Coast Water And Waste Committee Meeting 30 August 2017 Adopted Report ITEM 3 (Continued) WATER AND SEWERAGE SERVICES FINANCIAL PERFORMANCE AS AT 31 JULY 2017 FN334/252/18(P1) Water Loss Management – Establishment of New District Metered Areas Project scope and budget This project involves the design and construction of new District Metered Areas (DMA) to increase DMA coverage of the potable water network from 35% to 70% across the City. The increased coverage will provide additional network monitoring and data for focussing active and targeted leak detection in order to deliver repairs and associated leakage reductions. The approved Initial Budget is $1.24 million. Achievements for July Tender evaluation complete with contract award expected in early August. Major issues Tender prices exceeded estimates used for Business Case however projected water loss savings still significantly exceed revised project estimate and warrants project to proceed. Financial Performance
Forecast ($) 10,000 Budget ($) 2,873,451
Expenditure ($) 8,453 ITD Expenditure ($) 136,904
Variance ($) 1,547 Remaining ($) 2,736,547
Variance (%) 15% Remaining (%) 95%
Year to Date Whole Project

742nd Council Meeting 5 September 2017 21 Gold Coast Water And Waste Committee Meeting 30 August 2017 Adopted Report ITEM 3 (Continued) WATER AND SEWERAGE SERVICES FINANCIAL PERFORMANCE AS AT 31 JULY 2017 FN334/252/18(P1) Refurbishment of Process Tanks at Elanora and Coombabah Sewage Treatment Plants Project scope and budget This project involves the refurbishment of six process tanks and three pumping facilities at Elanora and Coombabah Sewage Treatment Plants (STP) including process tank structures and mechanical and electrical components. The assets will be replaced or renewed to “as new” condition in order to comply with operational safety standards and Department of Environment and Heritage Protection (DEHP) licence requirements. The construction contract was awarded to Aquatec Maxcon Pty Ltd on 30 June 2015. The need to ensure the treatment plants continue to operate effectively throughout construction adds significant complexity to this project. The approved Initial Budget for 2017-18 is $1.0 million. Achievements for July Elanora DAF scraper bridge refurbishment is nearing completion. Major issues Failure of the Coombabah aeration rotor required re-prioritisation of contract works and request to undertake rotor repair works a variation. Financial Performance
Forecast ($) 120,000 Budget ($) 8,347,880
Expenditure ($) 13,048 ITD Expenditure ($) 7,360,929
Variance ($) 106,952 Remaining ($) 986,952
Variance (%) 89% Remaining (%) 12%
Year to Date Whole Project

742nd Council Meeting 5 September 2017 22 Gold Coast Water And Waste Committee Meeting 30 August 2017 Adopted Report ITEM 3 (Continued) WATER AND SEWERAGE SERVICES FINANCIAL PERFORMANCE AS AT 31 JULY 2017 FN334/252/18(P1) Coombabah STP Stage 6 Upgrade Project scope and budget This project involves the upgrade of Coombabah Sewage Treatment Plant (STP) to provide additional treatment capacity to cater for growth and meet licence requirements. Coombabah catchment is expected to experience significant growth over the coming years – the transit corridor, Commonwealth Games and Southport Priority Development Area are some of the major developments in this catchment. The approved Initial Budget for 2017-18 is $1.0 million. Achievements for July Works continued on finalisation of preferred options and preparation of the Business Case. Major issues No major issues experienced. Financial Performance
Forecast ($) - Budget ($) 70,000,000
Expenditure ($) - ITD Expenditure ($) -
Variance ($) - Remaining ($) 70,000,000
Variance (%) - Remaining (%) 100%
Year to Date Whole Project
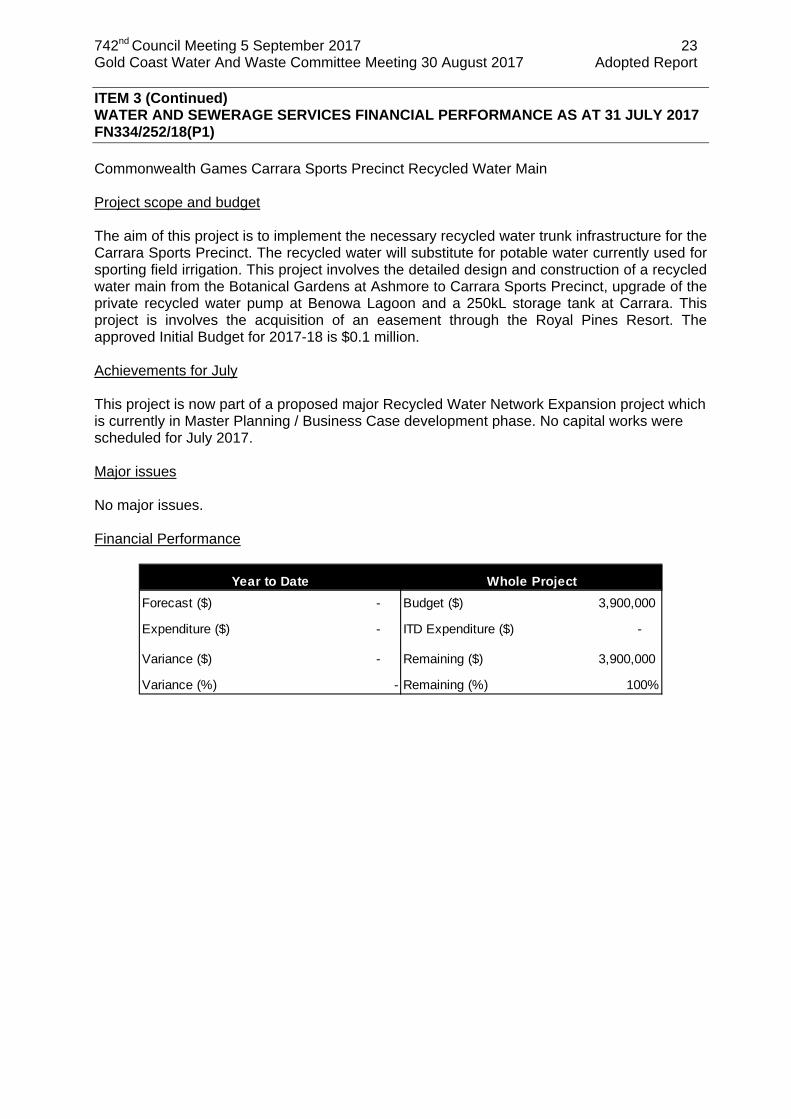
742nd Council Meeting 5 September 2017 23 Gold Coast Water And Waste Committee Meeting 30 August 2017 Adopted Report ITEM 3 (Continued) WATER AND SEWERAGE SERVICES FINANCIAL PERFORMANCE AS AT 31 JULY 2017 FN334/252/18(P1) Commonwealth Games Carrara Sports Precinct Recycled Water Main Project scope and budget The aim of this project is to implement the necessary recycled water trunk infrastructure for the Carrara Sports Precinct. The recycled water will substitute for potable water currently used for sporting field irrigation. This project involves the detailed design and construction of a recycled water main from the Botanical Gardens at Ashmore to Carrara Sports Precinct, upgrade of the private recycled water pump at Benowa Lagoon and a 250kL storage tank at Carrara. This project is involves the acquisition of an easement through the Royal Pines Resort. The approved Initial Budget for 2017-18 is $0.1 million. Achievements for July This project is now part of a proposed major Recycled Water Network Expansion project which is currently in Master Planning / Business Case development phase. No capital works were scheduled for July 2017. Major issues No major issues. Financial Performance
Forecast ($) - Budget ($) 3,900,000
Expenditure ($) - ITD Expenditure ($) -
Variance ($) - Remaining ($) 3,900,000
Variance (%) - Remaining (%) 100%
Year to Date Whole Project

742nd Council Meeting 5 September 2017 24 Gold Coast Water And Waste Committee Meeting 30 August 2017 Adopted Report ITEM 3 (Continued) WATER AND SEWERAGE SERVICES FINANCIAL PERFORMANCE AS AT 31 JULY 2017 FN334/252/18(P1) 5.9 Other Financial Activities 5.9.1 Community Service Obligations
In accordance with Sections 23 and 24 of the Local Government Regulation 2012: …The cost of carrying out community service obligations, less any revenue received from performing the obligations must be treated as revenue for the significant business activity. {Section 23} (and) …A community service obligation is an obligation the local government imposes on a business entity to do something that is not in the commercial interests of the business entity to do. Example of a community service obligation – giving a price concession to a particular group of customers, including pensioners, seniors and students {Section 24} 5.9.1.1 Community Service Obligations – Infrastructure Charges Waivers Detailed information is not currently reported with regard to the permanent discounting of infrastructure charges for “existing buildings”, “expansion” and “family accommodation” development applications. For the 2017-18 year to date, no foregone revenue in the form of waived infrastructure charges under the City’s Non-Profit Community Group Rebate system has been identified. 5.9.1.2 Community Service Obligations – Catchment Management Unit Catchment Management Unit activity protects human health in recreational waters by monitoring the state of the City’s water environments and providing rapid reporting of the health status of primary contact recreation areas. It supports the maintenance of legislated environmental values in the City’s water environments through catchment and stormwater planning and the implementation of appropriate environmental restoration actions. These activities are funded by way of a Community Service Obligation (CSO). At adoption of Council’s initial budget, the total value of this CSO is $4,465,110. Expenditure deferrals of $850,000 were identified as part of the 2016-17 March review, resulting in a revised CSO of $5,315,110 for 2017-18 expenditure. As shown in Table 4 (below), operational business as usual activities for the Catchment Management Unit are continuing, with expenditure for those activities at 31 July 2017 being slightly below budget. Full year operating project program has been developed with expenditure against these projects expected to ramp up over the coming months.

742nd Council Meeting 5 September 2017 25 Gold Coast Water And Waste Committee Meeting 30 August 2017 Adopted Report ITEM 3 (Continued) WATER AND SEWERAGE SERVICES FINANCIAL PERFORMANCE AS AT 31 JULY 2017 FN334/252/18(P1)
Table 4 – Summary of Catchment Management Unit – Operational Expenses
The major capital project being undertaken is to provide foreshore stabilisation around the lake within Damian Leeding Memorial Park. This project continues from the 2016-17 financial year and budget of $850,000 was deferred to 2017-18 at the March 2017 budget review for this purpose. Year to date expenditure is in line with forecast.
Table 5 – Summary of Catchment Management Unit – Capital Projects
Initial Budget ($)
Revised Budget ($)
YTD Actuals ($)
Spent (%)
CMU Operations 1,200,000 1,200,000 16,547 1.4%
Catchment Activities 1,502,880 1,502,880 90,781 6.0%
Healthy Waterways Contribution 330,000 330,000 0 0.0%
WaterSafe Monitoring & Investigations 247,650 247,650 8,926 3.6%
Laboratory Testing Services 500,000 500,000 33,905 6.8%
Community Action Support 155,000 155,000 0 0.0%
Water Cycle Implementation 110,000 110,000 0 0.0%
SLA for Corporate Services 419,580 419,580 34,965 8.3%
4,465,110 4,465,110 185,125 4.1%
Catchment Management Unit - Operational
Initial Budget ($)
Revised Budget ($)
YTD Actuals ($)
Spent (%)
71330 Damian Leeding Foreshore Stabilisation 850,000 850,000 13,418 1.6%
Sub-Total 850,000 850,000 13,418 1.6%
850,000 850,000 13,418 1.6%
Catchment Management Unit - Capital
742nd Council Meeting 5 September 2017 26 Gold Coast Water And Waste Committee Meeting 30 August 2017 Adopted Report ITEM 3 (Continued) WATER AND SEWERAGE SERVICES FINANCIAL PERFORMANCE AS AT 31 JULY 2017 FN334/252/18(P1) 5.9.2 Water and Sewage Leakage Relief
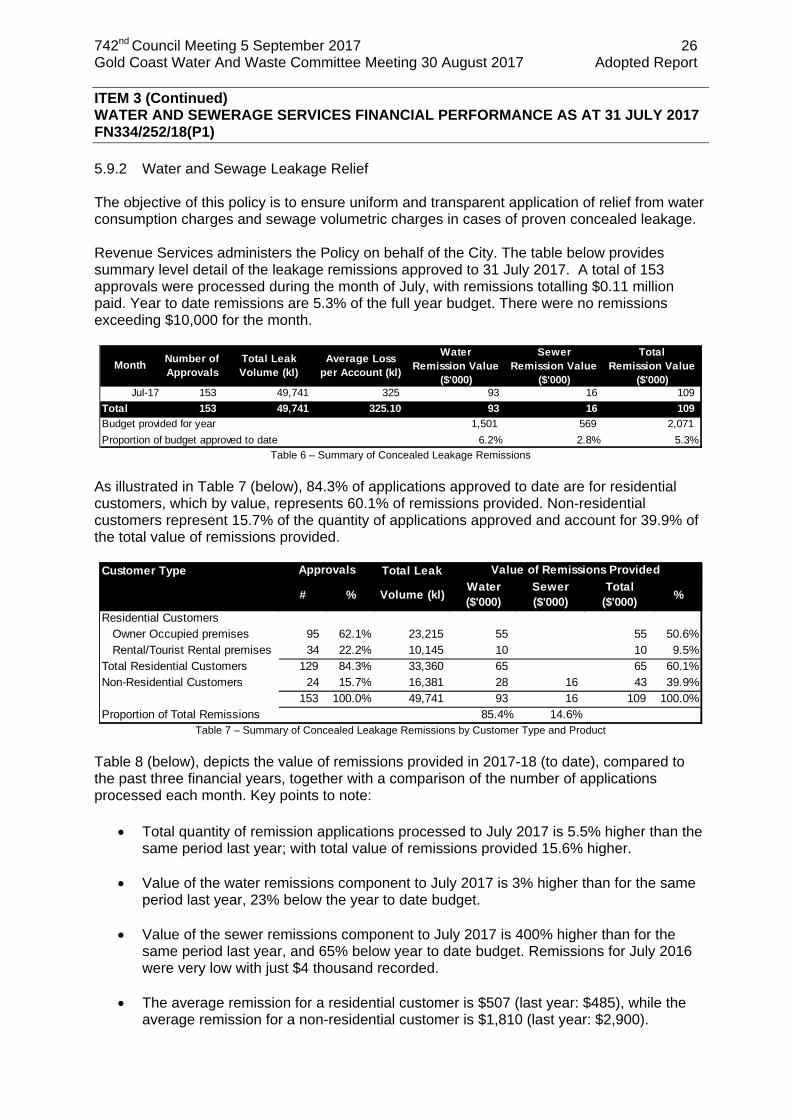
The objective of this policy is to ensure uniform and transparent application of relief from water consumption charges and sewage volumetric charges in cases of proven concealed leakage. Revenue Services administers the Policy on behalf of the City. The table below provides summary level detail of the leakage remissions approved to 31 July 2017. A total of 153 approvals were processed during the month of July, with remissions totalling $0.11 million paid. Year to date remissions are 5.3% of the full year budget. There were no remissions exceeding $10,000 for the month.
Table 6 – Summary of Concealed Leakage Remissions
As illustrated in Table 7 (below), 84.3% of applications approved to date are for residential customers, which by value, represents 60.1% of remissions provided. Non-residential customers represent 15.7% of the quantity of applications approved and account for 39.9% of the total value of remissions provided.
Table 7 – Summary of Concealed Leakage Remissions by Customer Type and Product
Table 8 (below), depicts the value of remissions provided in 2017-18 (to date), compared to the past three financial years, together with a comparison of the number of applications processed each month. Key points to note:
Total quantity of remission applications processed to July 2017 is 5.5% higher than the same period last year; with total value of remissions provided 15.6% higher.
Value of the water remissions component to July 2017 is 3% higher than for the same
period last year, 23% below the year to date budget.
Value of the sewer remissions component to July 2017 is 400% higher than for the same period last year, and 65% below year to date budget. Remissions for July 2016 were very low with just $4 thousand recorded.
The average remission for a residential customer is $507 (last year: $485), while the average remission for a non-residential customer is $1,810 (last year: $2,900).
MonthNumber of Approvals
Total Leak Volume (kl)
Average Loss per Account (kl)
Water Remission Value
($'000)
Sewer Remission Value
($'000)
Total Remission Value
($'000)Jul-17 153 49,741 325 93 16 109
Total 153 49,741 325.10 93 16 109
Budget provided for year 1,501 569 2,071
Proportion of budget approved to date 6.2% 2.8% 5.3%
Customer Type Total Leak
# % Volume (kl)Water ($'000)
Sewer ($'000)
Total ($'000)
%
Residential Customers Owner Occupied premises 95 62.1% 23,215 55 55 50.6% Rental/Tourist Rental premises 34 22.2% 10,145 10 10 9.5%Total Residential Customers 129 84.3% 33,360 65 65 60.1%Non-Residential Customers 24 15.7% 16,381 28 16 43 39.9%
153 100.0% 49,741 93 16 109 100.0%Proportion of Total Remissions 85.4% 14.6%
Approvals Value of Remissions Provided

742nd Council Meeting 5 September 2017 27 Gold Coast Water And Waste Committee Meeting 30 August 2017 Adopted Report ITEM 3 (Continued) WATER AND SEWERAGE SERVICES FINANCIAL PERFORMANCE AS AT 31 JULY 2017 FN334/252/18(P1)
Table 8 – Comparison of Concealed Leakage Remissions to prior years
5.9.3 Procurement Savings In April 2017 (GA17.0419.007), Council resolved as follows: “That effective from 1 July 2017, the current model of procurements savings being a separate component of the cash surplus target required to underpin the budget each year be discontinued, however the corporate (overall) budget surplus target be retained.”– Procurement Savings identified by OCPO- 2017-18 financial year
Gold Coast Water and Waste’s budget process incorporates a total review of all operating costs, identifying any potential savings or efficiencies, and all capital works estimates, addressing actual contract costs. Accordingly, procurement and efficiency savings are captured through this review process. Any identified savings are transferred to the Water and Sewerage Infrastructure Reserve. 5.10 Future Budgetary Trends There are no future budgetary trends identified at this early stage of the financial year’s operations.
Applications Cumulative TotalsProcessed July Aug Sept Oct Nov Dec Jan Feb Mar Apr May June2014-15 319 537 913 1,141 1,503 1,790 1,953 2,142 2,365 2,615 2,826 3,005 2015-16 124 345 597 786 967 1,109 1,299 1,437 1,674 1,895 2,187 2,411 2016-17 145 493 902 1,155 1,514 1,616 1,793 1,994 2,250 2,451 2,670 2,911 2017-18 153 % Movement 5.5% (100.0%) (100.0%) (100.0%) (100.0%) (100.0%) (100.0%) (100.0%) (100.0%) (100.0%) (100.0%) (100.0%)
Remissions Cumulative Totals
Provided ($'000) July Aug Sept Oct Nov Dec Jan Feb Mar Apr May June14-15 Water 180 400 677 891 1,095 1,290 1,403 1,498 1,645 1,773 1,897 2,005 14-15 Sewer 115 356 524 634 654 749 786 807 907 930 995 1,080 Total 2014-15 295 756 1,201 1,525 1,749 2,039 2,189 2,304 2,552 2,704 2,892 3,085 15-16 Water 56 129 237 337 425 498 580 667 783 883 986 1,130 15-16 Sewer 15 38 76 126 159 193 220 248 270 371 413 453 Total 2015-16 72 167 313 464 584 691 800 915 1,053 1,254 1,399 1,583 16-17 Water 90 330 581 753 972 1,024 1,127 1,253 1,394 1,486 1,648 1,817 16-17 Sewer 4 66 123 146 189 293 331 364 414 420 500 546 Total 2016-17 94 396 705 899 1,161 1,317 1,458 1,617 1,807 1,906 2,149 2,363 17-18 Water 93 17-18 Sewer 16 Total 2017-18 109 - - - - - - - - - - - % Movement(17-18 vs 16-17)
15.6% (100.0%) (100.0%) (100.0%) (100.0%) (100.0%) (100.0%) (100.0%) (100.0%) (100.0%) (100.0%) (100.0%)

742nd Council Meeting 5 September 2017 28 Gold Coast Water And Waste Committee Meeting 30 August 2017 Adopted Report ITEM 3 (Continued) WATER AND SEWERAGE SERVICES FINANCIAL PERFORMANCE AS AT 31 JULY 2017 FN334/252/18(P1) 6 ALIGNMENT TO THE CORPORATE PLAN, CORPORATE STRATEGIES AND
OPERATIONAL PLAN Not Applicable. 7 GOLD COAST 2018 COMMONWEALTH GAMES IMPACT There are no identified connections to the 2018 Commonwealth Games (GC2018). 8 FUNDING AND RESOURCING REQUIREMENTS Not Applicable. 9 RISK MANAGEMENT The following risk assessment applies to this report:
Risk Number Description
Risk No. CO000435
Failure to achieve a sustainable long term financial position leading to negative impacts on Council’s ability to deliver on its key focus area commitments.
10 STATUTORY MATTERS Not Applicable. 11 COUNCIL POLICIES
The following policies have been taken into account when preparing this report:
Gold Coast Water Capital Structure and Community Returns Policy
Revenue Policy
City of Gold Coast Budget Review Policy
Water and Sewage Leakage Relief Policy. 12 DELEGATIONS Not Applicable. 13 COORDINATION AND CONSULTATION Name and/or Title of the Stakeholder Consulted
Directorate or Organisation
Is the Stakeholder Satisfied With Content of Report and Recommendations (Yes/No) (comment as appropriate)
Marilyn Hildebrandt Executive Coordinator Directorate Finances
Office of the CEO Yes

742nd Council Meeting 5 September 2017 29 Gold Coast Water And Waste Committee Meeting 30 August 2017 Adopted Report ITEM 3 (Continued) WATER AND SEWERAGE SERVICES FINANCIAL PERFORMANCE AS AT 31 JULY 2017 FN334/252/18(P1) 14 STAKEHOLDER IMPACTS Not Applicable. 15 TIMING Not Applicable. 16 CONCLUSION Water and Sewerage Services Earnings before Interest and Tax (EBIT) for the period to 31 July 2017 is 3.6% or $0.48 million above forecast. Main contributing factor to this favourable variance is Controllable operating expenditure below forecast by $1.09 million. This is offset by unfavourable variances of:
Operating revenue – below forecast by $0.31 million, and Capital revenue – below forecast by $0.27 million.
Performance will continue to be monitored to ensure controllable expenditure is minimised. This is achieved through rigorous internal processes which include detailed review of all projects to ensure only prudent and efficient expenditure is incurred. 17 RECOMMENDATION It is recommended that Council resolves as follows: That Council notes the Water and Sewerage Services Monthly Financial Report for the period ended 31 July 2017. Author: Authorised by: Karen O’Brien Paul Heaton Manager Business Performance Director Gold Coast Water and Waste 22 August 2017 TRACKS REF: #64051662
COMMITTEE RECOMMENDATION WW17.0830.003 moved Cr PJ Young seconded Cr O’Neill That Council notes the Water and Sewerage Services Monthly Financial Report for the period ended 31 July 2017.
CARRIED

742nd Council Meeting 5 September 2017 30 Gold Coast Water And Waste Committee Meeting 30 August 2017 Adopted Report
Attachment 3.1
Financial Management Report – 31 July 2017
Full Year
Act Initial Budget
Var Var Initial Budget
Month ended 31 July 2017 $000's $000's $000's % $000's
Revenue
Service Charges 19,462 20,328 (867) (4.3%) 241,484
Volumetric Charges 20,710 20,358 352 1.7% 254,564
Less: Concealed Leakage (109) (166) 57 34.2% (2,071)
Interest on Outstanding Rates 225 133 91 68.4% 1,600
Interest on Investments 661 661 - 0.0% 7,928
Fees and Charges 392 334 58 17.3% 4,352
Total Operating Revenue 41,340 41,649 (309) (0.7%) 507,858
Operating Expenditure
FLOW-DEPENDANT EXPENDITURE
Bulk Water Purchases 14,004 13,978 (26) (0.2%) 174,727
Electricity 824 826 3 0.3% 9,941
Biosolids Disposal 364 322 (42) (12.9%) 3,867
Chemicals 257 290 33 11.4% 3,480
Total Flow-Dependant Expenditure
15,448 15,417 (32) (0.2%) 192,016
Operating Revenue net of Flow-Dependant Expenditure
25,891 26,232 (341) (1.3%) 315,842
Gross Margin 0.7 0.7 0.7
CONTROLLABLE EXPENDITURE
Employee Expenses 3,694 3,865 171 4.4% 48,470
Services 978 1,821 843 46.3% 22,126
Council Corporate SLAs 1,560 1,560 0 0.0% 18,717
Internal Directorate SLA (273) (273) - 0.0% (3,279)
Materials 475 379 (95) (25.2%) 4,532
Council Fleet and Plant 353 343 (10) (2.9%) 4,078
Sew age Treatment Charge 282 285 3 1.1% 3,417
Insurance Premiums 157 157 (0) (0.0%) 1,885
Other Expenditure 208 208 (0) (0.0%) 2,500
Consultants 1 162 161 99.6% 2,370
Regulatory Expenses - 19 19 100.0% 268
Total Controllable Expenditure 7,435 8,527 1,092 12.8% 105,084
Total Operating Expenditure 22,883 23,944 1,061 4.4% 297,099
Loss on Sale of Assets - - - 0.0% 5,000
Net Profit before Capital Revenue 18,457 17,705 752 4.2% 205,758
Capital Revenue
Developers Contributions 3,069 3,333 (265) (7.9%) 40,000
Contributions and Donations Received 1 10 (10) (94.7%) 125
Contributed Assets - - - 0.0% 20,000
Total Capital Revenue 3,069 3,344 (275) (8.2%) 60,125
EBITDA 21,526 21,049 477 2.3% 265,883
Depreciation 7,667 7,667 0 0.0% 92,000
EBIT 13,859 13,382 477 3.6% 173,883
Interest Expense (QTC Loan) 233 233 0 0.0% 2,796
Interest Margin Expense 73 73 0 0.0% 881
Shareholder Interest Expense 7,402 7,402 - 0.0% 88,824
Income Tax Equivalents 3,551 3,011 (540) (17.9%) 36,133
NPAT 2,600 2,663 (63) (2.4%) 45,248
Participation Return 603 7,235 6,632 91.7% 7,235
Retained earnings impact after participation return
1,997 (4,572) 6,569 (143.7%) 38,013
Year to DateWater & Sewerage Services Income Statement

742nd Council Meeting 5 September 2017 31 Gold Coast Water And Waste Committee Meeting 30 August 2017 Adopted Report ITEM 4 GOLD COAST WATER AND WASTE WASTE SERVICES FINANCIAL PERFORMANCE AS AT 31 JULY 2017 FN334/252/18(P1) Attachment 1: Detailed Income Statement 1 BASIS FOR CONFIDENTIALITY Not Applicable. 2 EXECUTIVE SUMMARY Not Applicable. 3 PURPOSE OF REPORT The purpose of this report is to provide the Gold Coast Water and Waste Committee with an update of Waste Services financial performance as at 31 July 2017. Comparisons are against the Initial 2018 Adopted Budget. 4 PREVIOUS RESOLUTIONS Not Applicable. 5 DISCUSSION 5.1 High Level Financial Summary
Table 1 - Waste Services - Year to Date Financial Summary
Table 1 above shows Waste Services financial position as at 31 July is $0.19 million (7.7%) ahead of forecast with Operating Revenue being $0.04 million below of forecast and Operating Expenses being $0.23 million below forecast. Significant variances will be discussed in the following paragraphs with a detailed Income Statement contained in Attachment 1 to the report.
ActualInitial
BudgetVar Var
Initial Budget
Month ended 31 July 2017 $M $M $M % $M
Operating Revenue 7.98 8.02 (0.04) (0.5%) 100.05
Operating Expenses 5.30 5.53 0.23 4.2% 73.28
Total Operating Profit 2.68 2.49 0.19 7.7% 26.77
Loss on Sale of Assets 0.00 0.00 0.00 0.0% 0.00
EBITDA 2.68 2.49 0.19 7.7% 26.77
Year to Date Full YearWaste Services Financial Summary

742nd Council Meeting 5 September 2017 32 Gold Coast Water And Waste Committee Meeting 30 August 2017 Adopted Report ITEM 4 (Continued) WASTE SERVICES FINANCIAL PERFORMANCE AS AT 31 JULY 2017 FN334/252/18(P1) 5.2 Operating Revenue ($0.037 million unfavourable) Operating revenue is $0.037 million behind budget and is influenced by the following:
Waste Utility Rate Revenue - $0.108 million unfavourable: The waste utility rate revenue received for the year is slightly behind budget, influenced by timing delays in issuing rating notices on the changeover to the new Local Government Platform.
Refuse tipping fees - $0.066 million favourable: Refuse tipping fees are ahead of
budget for July 2017 due to increased disposals at landfills.
Internal tipping charges - $0.052 million favourable: Internal tipping fees are slightly ahead of budget for July 2017.
Fees and charges - $0.043 million unfavourable: Fees and charges revenue is slightly behind budget for July 2017.
Table 2 shows the total number of waste collection bins at as 31 July 2017 and the growth this financial year.
Table 2 - Waste Collection Services
Waste collection binsBins in
service as at 31/07/2017
Bins in service as at 30/06/17
Bin increase\ (decrease) %
General waste (weekly)
Domestic w heelie bins 186,660 186,206 454 0.2%
Commercial w heelie bins 6,991 7,003 (12) -0.2%
Bulk bins (dommestic and commercial) 2,842 2,860 (18) -0.6%
Total weekly general waste services 196,493 196,069 424 0.2%
Recyclable waste (weekly)
Commercial w heelie bins 350 349 1 0.3%
Bulk bins (dommestic and commercial) 1,471 1,475 (4) -0.3%
Total weekly recyclable waste services 1,821 1,824 (3) -0.2%
Recyclable waste (fortnightly)
Domestic w heelie bins 178,329 177,869 460 0.3%
Commercial w heelie bins 2,406 2,401 5 0.2%
Total forntightly recyclable waste services 180,735 180,270 465 0.3%
Other (fortnightly)
Green w aste 23,734 23,533 201 0.9%
Total forntightly other services 23,734 23,533 201 0.9%
Year to Date

742nd Council Meeting 5 September 2017 33 Gold Coast Water And Waste Committee Meeting 30 August 2017 Adopted Report ITEM 4 (Continued) WASTE SERVICES FINANCIAL PERFORMANCE AS AT 31 JULY 2017 FN334/252/18(P1) 5.3 Operating Expenditure ($0.23 million Favourable) At a whole business unit level, operating expenses are $0.23 million (4.2%) below forecast. Variances at individual line item level are further explained below. 5.3.1 Services ($0.50 million Favourable) Services are currently $0.5 million below forecast, largely due to delays in receipting of July expenses. With the finalisation of the 2016-17 financial year, the ability to receipt expenses back in the month of June is extended until mid-July. The consequence of this is that the recognition of expenses for the month of July is generally lower. In addition, the following variances have been identified:
a. Leachate Removal - $0.09 million below forecast. The removal of leachate from the Stapylton landfill site is below forecast due to a lower volume of leachate removed from the site. For comparative purposes, volume removed is 34% lower than the same period last financial year.
b. Landfill Resource Recovery Program - $0.09 million below forecast. The lower than
anticipated result is due to a 45% reduction in green waste tonnage removed from the Molendinar waste and recycling centre against the same period last year. This is predominantly due to drier weather conditions throughout the City.
c. E-waste and hazardous waste - $0.05 million below forecast. This forecast incorporates funding that has not been incurred for the extension of the Household Hazardous Waste program to the Reedy Creek and Molendinar facilities. The implementation of this program is being considered as part of overall review of the City’s waste and recycling centres. The introduction of the product stewardship scheme for the disposal of paint has also influenced the lower than forecast expenditure.
5.3.2 Waste Collection Payments ($0.28 million Unfavourable) Waste collection payments are ahead of forecast by $0.28 million or 15%. The 2017-18 kerbside clean-up program began at the end of July with Division 13, whereas the Initial forecast had the program commencing in September. General waste collection costs are also ahead of forecast in line with additional bin services.
5.3.3 Council Fleet and Plant ($0.19 million Unfavourable) Council Fleet and Plant is ahead of forecast by $0.19 million or 32%. It has been identified that an Excavator at the Reedy Creek landfill has been incorrectly charged to the site. The issue has been reported to Fleet and Plant and is anticipated to be resolved before the end of August. A review of all heavy plant being charged to Reedy Creek and Stapylton Landfills is currently underway.
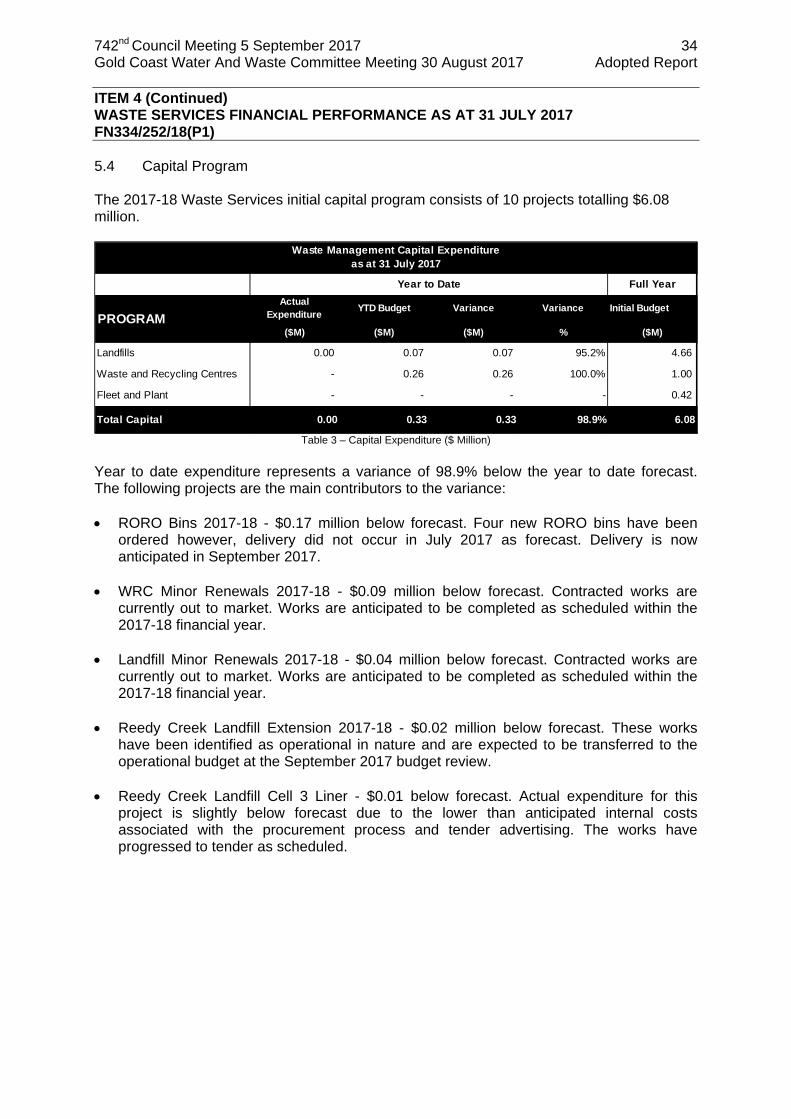
742nd Council Meeting 5 September 2017 34 Gold Coast Water And Waste Committee Meeting 30 August 2017 Adopted Report ITEM 4 (Continued) WASTE SERVICES FINANCIAL PERFORMANCE AS AT 31 JULY 2017 FN334/252/18(P1) 5.4 Capital Program The 2017-18 Waste Services initial capital program consists of 10 projects totalling $6.08 million.
Table 3 – Capital Expenditure ($ Million)
Year to date expenditure represents a variance of 98.9% below the year to date forecast. The following projects are the main contributors to the variance: RORO Bins 2017-18 - $0.17 million below forecast. Four new RORO bins have been
ordered however, delivery did not occur in July 2017 as forecast. Delivery is now anticipated in September 2017.
WRC Minor Renewals 2017-18 - $0.09 million below forecast. Contracted works are currently out to market. Works are anticipated to be completed as scheduled within the 2017-18 financial year.
Landfill Minor Renewals 2017-18 - $0.04 million below forecast. Contracted works are currently out to market. Works are anticipated to be completed as scheduled within the 2017-18 financial year.
Reedy Creek Landfill Extension 2017-18 - $0.02 million below forecast. These works have been identified as operational in nature and are expected to be transferred to the operational budget at the September 2017 budget review.
Reedy Creek Landfill Cell 3 Liner - $0.01 below forecast. Actual expenditure for this project is slightly below forecast due to the lower than anticipated internal costs associated with the procurement process and tender advertising. The works have progressed to tender as scheduled.
Actual Expenditure
YTD Budget Variance Variance Initial Budget
($M) ($M) ($M) % ($M)
Landfills 0.00 0.07 0.07 95.2% 4.66
Waste and Recycling Centres - 0.26 0.26 100.0% 1.00
Fleet and Plant - - - - 0.42
Total Capital 0.00 0.33 0.33 98.9% 6.08
Waste Management Capital Expenditureas at 31 July 2017
Year to Date Full Year
PROGRAM

742nd Council Meeting 5 September 2017 35 Gold Coast Water And Waste Committee Meeting 30 August 2017 Adopted Report ITEM 4 (Continued) WASTE SERVICES FINANCIAL PERFORMANCE AS AT 31 JULY 2017 FN334/252/18(P1) 5.5 Status Updates - Major Investments The following major investments have been identified for delivery in 2017-18. 5.5.1 Tugun Landfill Capping and Remediation Program scope and budget As part of the City’s environmental obligations associated with the operation of landfill sites, we have a legislative requirement to monitor and remediate the environmental impacts of these sites, both during their active life and following cessation of their utilisation as a landfill. Environmental approvals for landfills require post closure monitoring for a period of thirty (30) years. The Tugun landfill site remains a licensed landfill site and has been closed to the public for several years. Capping design and post closure management plan for the site has been completed. A budget allocation was provided in the 2016-17 financial to undertake capping works at the site, which was subsequently deferred to the 2017-18 financial year. These works are currently on hold, pending ongoing investigations into the most effective strategy for future utilisation and remediation of the site. Current status Project on hold pending negotiated assessment of the best ultimate use of the site. No works or expenditure to date on this project. Major Issues No major issues identified. Financial Performance
Actual Expenditure
YTD Budget Variance Variance Initial Budget
($M) ($M) ($M) % ($M)
Tugun Landfill Capping and Remediation - - - 1.93
Total Transfer Stations 0.00 0.00 0.00 - 1.93
CAPPING & REMEDIATION

742nd Council Meeting 5 September 2017 36 Gold Coast Water And Waste Committee Meeting 30 August 2017 Adopted Report ITEM 4 (Continued) WASTE SERVICES FINANCIAL PERFORMANCE AS AT 31 JULY 2017 FN334/252/18(P1) 5.5.2 Landfill Resource Recovery - $0.09 below forecast Program scope and budget City of Gold Coast supports a waste management system that operates on the principles of waste hierarchy. Recycling and recovery are two of the easiest alternatives to landfill disposal and they represent the majority of actions in the City’s Solid Waste Strategy 2024. This includes recycling of clean, separated, high-value materials (such as metals, plastics and concrete), recovering nutrients from organic wastes (to create composts and fertilisers) and potential energy production from waste materials. The aim of this program is to promote reuse and recycling of these products thereby reducing waste to landfill. The major waste streams targeted in this program are concrete and greenwaste however other construction and demolition wastes are also reprocessed. Greenwaste is reused through two main programs; mulching and re-use on-site and transported off-site for composting. The amount of green waste presented at the Waste and Recycling Centre (WRC) varies with the prevailing weather conditions. Concrete is stockpiled and crushed on site at the City’s landfills. Currently the majority of this material is re-used on-site, however opportunities for sale of this product are under investigation. As per Solid Waste Strategy 2024, the total waste resource recovery (recovered or recycled) target for 2017-18 is 43.75%, with a domestic waste recovery target of 33.5%. Current Status
Total waste resource recovery achieved for July is below the set target by 0.95% at 42.8%.
Domestic waste resource recovery is currently 24.6%, 8.9% lower than the target of 33.5%.
45% reduction in green waste tonnage removed from the Molendinar waste and recycling centre against the same period last year.
Major Issues
Concrete crushing contractor has gone into liquidation. Specifications currently being updated to go to market for new contract. As an interim measure, quotes are being sourced for one-off processing of material
currently stockpiled. This matter is not currently creating operational issues for the landfill sites and is not
expected to create operational issues in the medium term. Financial Performance
Actual Expenditure
YTD Budget Variance Variance Initial Budget
($M) ($M) ($M) % ($M)
Landfill Resource Recovery 0.14 0.22 0.09 38.7% 3.14
Total 0.14 0.22 0.09 38.7% 3.14

742nd Council Meeting 5 September 2017 37 Gold Coast Water And Waste Committee Meeting 30 August 2017 Adopted Report ITEM 4 (Continued) WASTE SERVICES FINANCIAL PERFORMANCE AS AT 31 JULY 2017 FN334/252/18(P1) 5.5.3 Kerbside Clean-up - $0.12 million above forecast Program scope and budget During Council’s 2016-17 budget deliberations it was determined that a kerbside clean up service would be provided for the entire City over a two year period. This service was provided to Divisions 1 to 7 in the 2016-17 financial year. Divisions 8 to 14 will receive service in the 2017-18 financial year. This program provides residents the opportunity to have unwanted items removed (free of charge) that may be difficult to dispose of via other mechanisms. Current Status Divisions 8 to 14 scheduled for 2017-18. Division 4 and 6 scheduled for 2017-18 funded by Local Area Works funding. Division 13 collection was completed in July.
Major Issues No major issues identified. Financial Performance
Actual Expenditure
YTD Budget Variance Variance Initial Budget
($M) ($M) ($M) % ($M)
Kerbside Collection 0.12 - (0.12) - 1.07
Total 0.12 0.00 (0.12) - 1.07
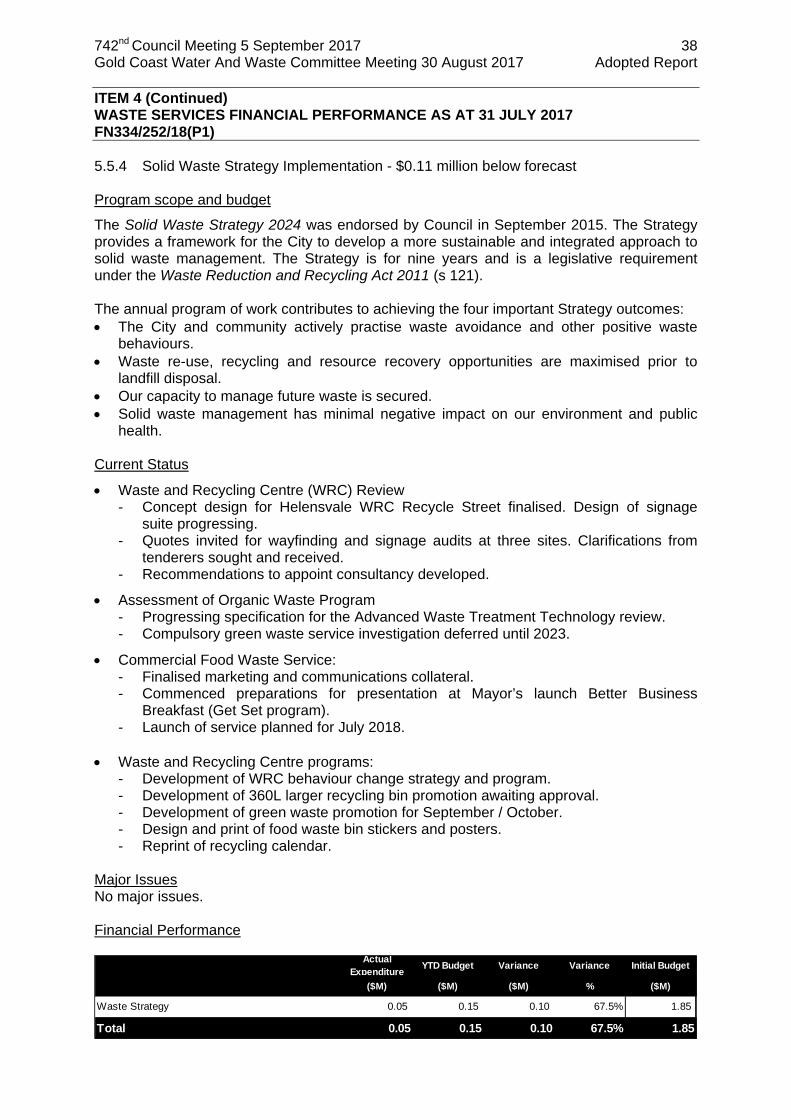
742nd Council Meeting 5 September 2017 38 Gold Coast Water And Waste Committee Meeting 30 August 2017 Adopted Report ITEM 4 (Continued) WASTE SERVICES FINANCIAL PERFORMANCE AS AT 31 JULY 2017 FN334/252/18(P1) 5.5.4 Solid Waste Strategy Implementation - $0.11 million below forecast Program scope and budget
The Solid Waste Strategy 2024 was endorsed by Council in September 2015. The Strategy provides a framework for the City to develop a more sustainable and integrated approach to solid waste management. The Strategy is for nine years and is a legislative requirement under the Waste Reduction and Recycling Act 2011 (s 121). The annual program of work contributes to achieving the four important Strategy outcomes: The City and community actively practise waste avoidance and other positive waste
behaviours. Waste re-use, recycling and resource recovery opportunities are maximised prior to
landfill disposal. Our capacity to manage future waste is secured. Solid waste management has minimal negative impact on our environment and public
health.
Current Status
Waste and Recycling Centre (WRC) Review - Concept design for Helensvale WRC Recycle Street finalised. Design of signage
suite progressing. - Quotes invited for wayfinding and signage audits at three sites. Clarifications from
tenderers sought and received. - Recommendations to appoint consultancy developed.
Assessment of Organic Waste Program - Progressing specification for the Advanced Waste Treatment Technology review. - Compulsory green waste service investigation deferred until 2023.
Commercial Food Waste Service: - Finalised marketing and communications collateral. - Commenced preparations for presentation at Mayor’s launch Better Business
Breakfast (Get Set program). - Launch of service planned for July 2018.
Waste and Recycling Centre programs:
- Development of WRC behaviour change strategy and program. - Development of 360L larger recycling bin promotion awaiting approval. - Development of green waste promotion for September / October. - Design and print of food waste bin stickers and posters. - Reprint of recycling calendar.
Major Issues No major issues. Financial Performance
Actual Expenditure
YTD Budget Variance Variance Initial Budget
($M) ($M) ($M) % ($M)
Waste Strategy 0.05 0.15 0.10 67.5% 1.85
Total 0.05 0.15 0.10 67.5% 1.85

742nd Council Meeting 5 September 2017 39 Gold Coast Water And Waste Committee Meeting 30 August 2017 Adopted Report ITEM 4 (Continued) WASTE SERVICES FINANCIAL PERFORMANCE AS AT 31 JULY 2017 FN334/252/18(P1) 5.5.5 Reedy Creek Landfill Cell 3 Liner - $0.01 million behind forecast Program scope and budget The Environmental Authority for the Reedy Creek landfill requires that all landfill cells have an appropriately designed and constructed landfill liner system so as to provide adequate protection against possible environmental impacts such as contamination of local ground water by landfill leachate. The Reedy Creek landfill cell 3 presents particular design and construction challenges in that it will be located in a corner between the currently active cell 1 and cell 2 and a steep batter to the north and a steep knoll face to the north-east. The knoll contains pockets of acid pyritic rock which will need to be appropriately managed during construction, in accordance with procedures that were adopted during the construction of cell 1 and cell 2.
Filling of cell 1 and cell 2 is monitored to be progressing at a rate at or potentially faster than the rate assumed in the site master-planning report of 120,000 cubic metres per 12 month period. Cell 3 will be required within the nominated timeframe in order to preserve site operability and avoid constraints that will lead to operational inefficiency, increased operational costs, and potentially increased site safety and environmental risk. Current Status Tender for the procurement of the design consultancy has been advertised. Major Issues No major issues identified. Financial Performance
Actual Expenditure
YTD Budget Variance Variance Initial Budget
($M) ($M) ($M) % ($M)
Reedy Creek Landfill Cell 3 Liner 0.00 0.01 0.01 64.8% 0.50
Total 0.00 0.01 0.01 64.8% 0.50

742nd Council Meeting 5 September 2017 40 Gold Coast Water And Waste Committee Meeting 30 August 2017 Adopted Report ITEM 4 (Continued) WASTE SERVICES FINANCIAL PERFORMANCE AS AT 31 JULY 2017 FN334/252/18(P1) 5.6 Community Returns 5.6.1 Income Tax ($0.06 million Unfavourable) Waste Services is subject to the Local Government Taxation Equivalents Regime (LGTER). As part of this regime, a PAYG Instalment Activity Statement must be prepared and submitted on a monthly basis, with payment of a PAYG instalment. Our current instalment rate issued by our tax assessors is 7.18%. The instalment rate is applied to total revenue generated to derive the amount of PAYG tax payable each month. Taxation expense recorded to date represents the total of PAYG instalments calculated for the first month of the financial year, based upon revenue recognised for the period. At year end, a final taxation return will be prepared, based upon Waste Services taxable income and utilising the company taxation rate of 30% to calculate total taxation payable for the year. Relevant adjustments will be made to record Waste Services annual tax liability to Council. 5.7 Procurement Savings In April 2017 (GA17.0419.007), Council resolved as follows: “That effective from 1 July 2017, the current model of procurements savings being a separate component of the cash surplus target required to underpin the budget each year be discontinued, however the corporate (overall) budget surplus target be retained.”
b9 – Procurement Savings identified by OCPO- 2017-18 financial year
Gold Coast Water and Waste’s budget process incorporates a total review of all operating costs, identifying any potential savings or efficiencies, and all capital works estimates, addressing actual contract costs. Accordingly, procurement and efficiency savings are captured through this review process. Any identified savings are transferred to the Waste Management Reserve.

742nd Council Meeting 5 September 2017 41 Gold Coast Water And Waste Committee Meeting 30 August 2017 Adopted Report ITEM 4 (Continued) WASTE SERVICES FINANCIAL PERFORMANCE AS AT 31 JULY 2017 FN334/252/18(P1) 5.8 Community Service Obligations
In accordance with Sections 23 and 24 of the Local Government Regulation 2012: …The cost of carrying out community service obligations, less any revenue received from performing the obligations must be treated as revenue for the significant business activity. {Section 23} (and) …A community service obligation is an obligation the local government imposes on a business entity to do something that is not in the commercial interests of the business entity to do. Example of a community service obligation – giving a price concession to a particular group of customers, including pensioners, seniors and students {Section 24} Table 9 (below) provides a summary of the Community Service Obligations (CSO) currently provided within Waste Services, together with the annual expenditure budget and actual year-to-date expenses incurred for delivery of those CSOs. Revenue for these CSOs is recognised on a monthly basis throughout the year, with revenue recognised to July of $0.26 million, as reflected in Attachment 1.
Table 10 – Community Service Obligations - 2017-18 financial year
5.9 Future Budgetary Trends 5.9.1 Materials Recovery Facility (MRF)
The MRF is a recycling facility currently owned and operated under contract by Visy Industries for the City. The current contract is based on a revenue share arrangement, with recyclable materials sorted and sold based on commodity prices. The current contract contains a ceiling and floor base recovery cost per tonne. When commodity prices are high, the City receives revenue, conversely, when commodity prices fall, cost to the City increases. Current forecasts suggest commodity prices will remain at low levels for the remainder of the year. The likely annual impact is currently under assessment.
Community Service Obligation2017-18
Initial Budget ($M)
2017-18 YTD Expenditure
($M)
% of Budget
Comment
Refuse Charge Donations 0.55 0.23 42%
Free Tipping Donations 0.47 0.04 8%
Kerbside Collection 1.07 0.12 11%
Stradbroke Island Waste Disposal - Expenditure
0.51 0.04 7%
Stradbroke Island Waste Disposal - Revenue
(0.07) (0.01) 8%
Clean-Up Australia Day 0.02 - 0% Clean Up Australia Day March 2018.
Carcass Collection 0.06 0.01 8%
Street and Park Bin Services 0.49 0.03 6%
3.09 0.45 15%
Steet and Park Bin collection services tracking slightly below forecast.
Rates notices issued twice per annum, application of Donations aligns with rating timeframes.
The 2017-18 Kerbside collection program encompasses the central and southern areas of the Gold Coast. Division 13 has been completed.
Commercial waste and recycling services on South Stradbroke Island tracking in line with forecast.
Charitable organisations level of refuse tipping is tracking in line with forecast.
Carcass collection services tracking in line with forecast.
Provision of waste disposal services to residents and businesses on South Stradbroke Island tracking slightly below forecast.

742nd Council Meeting 5 September 2017 42 Gold Coast Water And Waste Committee Meeting 30 August 2017 Adopted Report ITEM 4 (Continued) WASTE SERVICES FINANCIAL PERFORMANCE AS AT 31 JULY 2017 FN334/252/18(P1) 6 ALIGNMENT TO THE CORPORATE PLAN, CORPORATE STRATEGIES AND
OPERATIONAL PLAN Not Applicable. 7 GOLD COAST 2018 COMMONWEALTH GAMES IMPACT There are no identified connections to the 2018 Commonwealth Games (GC2018). 8 FUNDING AND RESOURCING REQUIREMENTS Not Applicable. 9 RISK MANAGEMENT The following risk assessment applies to this report:
Risk Number Description
Risk No. CO000435
Failure to achieve a sustainable long term financial position leading to negative impacts on Council’s ability to deliver on its key focus area commitments.
10 STATUTORY MATTERS Not Applicable. 11 COUNCIL POLICIES
Debt Policy
Revenue Policy
City of Gold Coast Budget Review Policy
12 DELEGATIONS Not Applicable. 13 COORDINATION AND CONSULTATION
Name and/or Title of the Stakeholder Consulted
Directorate or Organisation
Is the Stakeholder Satisfied With Content of Report and Recommendations (Yes/No) (comment as appropriate)
Marilyn Hildebrandt Executive Coordinator Directorate Finances
Office of the CEO Yes
14 STAKEHOLDER IMPACTS Not Applicable.

742nd Council Meeting 5 September 2017 43 Gold Coast Water And Waste Committee Meeting 30 August 2017 Adopted Report ITEM 4 (Continued) WASTE SERVICES FINANCIAL PERFORMANCE AS AT 31 JULY 2017 FN334/252/18(P1) 15 TIMING Not Applicable. 16 CONCLUSION Waste Services Earnings before Interest and Tax (EBIT) for the period to 31 July 2017 is $0.19 million ahead of forecast. This is due to below forecast operating expenses. Gold Coast Water and Waste actively monitors performance to ensure its operations are undertaken in the most effective and efficient manner possible to provide value for money to the ratepayers of the City. This is achieved through rigorous internal processes which include detailed review of all projects to ensure only prudent and efficient expenditure is incurred. 17 RECOMMENDATION It is recommended that Council resolves as follows: That Council notes the Waste Services Monthly Financial Report for the period ended 31 July 2017.
Author: Authorised by: Karen O’Brien Paul Heaton Manager Business Performance Director Gold Coast Water and Waste 22 August 2017
TRACKS REF: #64051877
COMMITTEE RECOMMENDATION WW17.0830.004 moved Cr PJ Young seconded Cr O’Neill That Council notes the Waste Services Monthly Financial Report for the period ended 31 July 2017.

742nd Council Meeting 5 September 2017 44 Gold Coast Water And Waste Committee Meeting 30 August 2017 Adopted Report
Attachment 4.1
Detailed Financial Management Report – 31 July 2017
Full Year
Actual Initial Bgt Var VarInitial
Budget
Month ended 31 July 2017 $'000 $000's $'000 % $'000
Revenue
Waste Utility Rate Revenue 6,411 6,519 (108) (1.7%) 76,746
Refuse Tipping Fees 370 304 66 21.7% 8,138
Recycling Revenue 95 82 13 15.3% 986
Fees and Charges 133 175 (43) (24.4%) 2,105
Internal Tipping Charges 662 609 52 8.6% 7,310
Community Service Obligations 258 258 0 0.0% 3,094
Interest on Outstanding Rates 1 15 (13) (91.9%) 175
Interest on Investments 49 49 - 0.0% 585
Contributions & Donations Revenue - - - 0.0% 870
Other Operating Income - 4 (4) (100.0%) 44
Total Operating Revenue 7,978 8,015 (37) (0.5%) 100,053
Operating Expenses
Employee Expenses 635 662 27 4.1% 8,602
Materials 94 186 91 49.3% 2,261
Services 897 1,395 497 35.7% 17,821
Council Corporate SLA 206 206 0 0.0% 2,467
Internal Directorate SLA 273 273 0 0.0% 3,279
Waste Collection Payments 2,171 1,888 (283) (15.0%) 27,185
Council Fleet & Plant 793 599 (194) (32.4%) 8,170
Consultants 10 91 80 88.5% 760
Electricity 0 11 11 98.7% 148
Insurance Premiums 7 7 0 0.0% 85
Other Expenditure 208 208 (0) (0.0%) 2,500
Total Operating Expenses 5,295 5,525 230 4.2% 73,278
Total Operating Profit 2,683 2,490 193 7.7% 26,774
EBITDA 2,683 2,490 193 7.7% 26,774
Depreciation 813 813 - 0.0% 9,753
EBIT 1,870 1,678 193 11.5% 17,021
Interest Expense (QTC Loan) 346 346 (0) (0.0%) 4,157
Interest Margin Expense 17 17 0 0.0% 209
Income Tax Equivalents 570 511 (59) (11.5%) 6,136
NPAT 936 802 134 16.7% 6,520
Dividend 641 641 0 0.0% 7,691
Retained Earnings 295 161 134 82.8% (1,172)
Waste ServicesFinancial Management Report
Year to Date

742nd Council Meeting 5 September 2017 45 Gold Coast Water And Waste Committee Meeting 30 August 2017 Adopted Report ITEM 5 GOLD COAST WATER AND WASTE GOLD COAST WATER AND WASTE CUSTOMER SATISFACTION SURVEY 2017 WSS1125/324(P1) / LG314/621/18/010 1 BASIS FOR CONFIDENTIALITY Not Applicable. 2 EXECUTIVE SUMMARY Not Applicable. 3 PURPOSE OF REPORT Gold Coast Water and Waste seek to inform Council of the upcoming 2017 Customer Satisfaction Survey. 4 PREVIOUS RESOLUTIONS Not Applicable. 5 DISCUSSION Background Gold Coast Water and Waste (GCWW) performs a customer satisfaction survey every two years to measure satisfaction with our services and facilities. The most recent survey was delivered in 2015. The purpose of the survey is to:
Confirm the levels of customer satisfaction with: o sewerage and water services o billing option preferences o solid waste collection services and waste facilities.
The outcomes of the survey will provide: Representative data related to:
o customer satisfaction with services o service reliability perception o satisfaction with product quality.
Insights and understanding of:
o customer key pain points o billing preferences o communication preferences o customer service issues o product quality issues.

742nd Council Meeting 5 September 2017 46 Gold Coast Water And Waste Committee Meeting 30 August 2017 Adopted Report ITEM 5 (Continued) GOLD COAST WATER AND WASTE CUSTOMER SATISFACTION SURVEY 2017 WSS1125/324(P1) LG314/621/18/010 Results from both the past water survey and waste survey have been utilised extensively to inform initiatives associated with customer orientated business improvements. This engagement has three elements: telephone survey community survey on “GC have your say” a focus group exercise with 50 select customers. Goals The surveys have been drafted to addresses key areas of water and waste operations. The goal is to ask questions that will: align with some of the questions from two years ago for trend analysis purposes align with current Key Performance Indicators (KPI) to give early indication of areas the
business should focus on for improvement identify opportunities for customer improvement initiatives to be developed and delivered
over the following two years be analysed to determine an overall customer satisfaction score. Current situation In order to gain the specific feedback required on GCWW services, without confusing or overwhelming the customer with the size of the survey, three separate surveys will run in unison under the one marketing campaign of a ‘GCWW Customer Satisfaction Survey’.
Survey one – open to Gold Coast water customers (residential and/or commercial)
Survey two – open to Gold Coast waste customers (residential only)
Survey three – open to Gold Coast waste customers (commercial only). Customers are welcome to respond to all surveys if they wish to do so. Furthermore, the consultant delivering the telephone surveys will cease canvassing for responses on one particular survey once 500 responses are achieved. The consultant will continue canvassing on the remaining surveys until 1000 responses in total are achieved. GHD Pty Ltd has been awarded the contract to deliver the 2017 customer satisfaction survey following a competitive tendering process.
6 ALIGNMENT TO THE CORPORATE PLAN, CORPORATE STRATEGIES AND
OPERATIONAL PLAN 1.0 The best place to live and visit 1.3 We have sustainable solid and liquid waste disposal We innovate to maximise recycling and reduce waste.
Supporting the delivery of Gold Coast 2020 B. We manage the city responsibly Our stewardship of the city provides value for money for ratepayers.
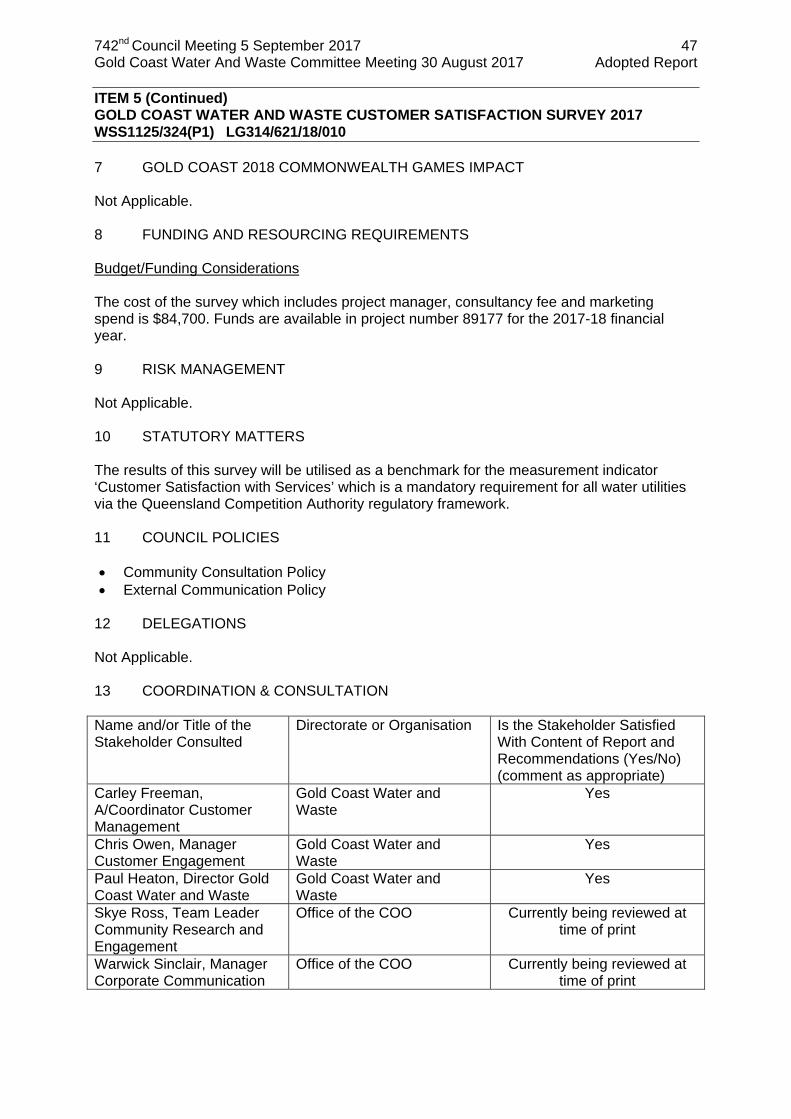
742nd Council Meeting 5 September 2017 47 Gold Coast Water And Waste Committee Meeting 30 August 2017 Adopted Report ITEM 5 (Continued) GOLD COAST WATER AND WASTE CUSTOMER SATISFACTION SURVEY 2017 WSS1125/324(P1) LG314/621/18/010 7 GOLD COAST 2018 COMMONWEALTH GAMES IMPACT Not Applicable. 8 FUNDING AND RESOURCING REQUIREMENTS Budget/Funding Considerations The cost of the survey which includes project manager, consultancy fee and marketing spend is $84,700. Funds are available in project number 89177 for the 2017-18 financial year. 9 RISK MANAGEMENT Not Applicable. 10 STATUTORY MATTERS The results of this survey will be utilised as a benchmark for the measurement indicator ‘Customer Satisfaction with Services’ which is a mandatory requirement for all water utilities via the Queensland Competition Authority regulatory framework. 11 COUNCIL POLICIES Community Consultation Policy External Communication Policy
12 DELEGATIONS Not Applicable. 13 COORDINATION & CONSULTATION Name and/or Title of the Stakeholder Consulted
Directorate or Organisation Is the Stakeholder Satisfied With Content of Report and Recommendations (Yes/No) (comment as appropriate)
Carley Freeman, A/Coordinator Customer Management
Gold Coast Water and Waste
Yes
Chris Owen, Manager Customer Engagement
Gold Coast Water and Waste
Yes
Paul Heaton, Director Gold Coast Water and Waste
Gold Coast Water and Waste
Yes
Skye Ross, Team Leader Community Research and Engagement
Office of the COO Currently being reviewed at time of print
Warwick Sinclair, Manager Corporate Communication
Office of the COO Currently being reviewed at time of print
742nd Council Meeting 5 September 2017 48 Gold Coast Water And Waste Committee Meeting 30 August 2017 Adopted Report ITEM 5 (Continued) GOLD COAST WATER AND WASTE CUSTOMER SATISFACTION SURVEY 2017 WSS1125/324(P1) LG314/621/18/010 14 STAKEHOLDER IMPACTS In accordance with the External Communication Policy, Corporate Communication has been consulted on potential positive and negative impacts prior to survey commencement. External / community stakeholder Impacts It is anticipated that the selection of questions and methods of engagement will achieve improved analysis of community opinions, resulting in clear outcomes to improve satisfaction levels. Internal (Organisational) Stakeholder Impacts GCWW work closely with Corporate Communication to ensure suitability of content for the target audience, while also ensuring all timeframes are met. Outcomes of the survey may inform possible improvements within the Customer Contact branch and/or potential amendments to the current Service Level Agreement. 15 TIMING The consultation period will run for three weeks, commencing Monday 11 September 2017 and concluding Friday 29 September 2017. This timeframe has been selected to run prior to, and during, the September school holidays in order to encourage maximum variety of demographics. The focus group will be scheduled for early November 2017 following an initial analysis of results, which will assist in forming more detailed line of questioning with the focus group attendees. 16 CONCLUSION Gold Coast Water and Waste has established three surveys to gauge customer satisfaction levels with water, sewerage and solid waste services and facilities. Questions have been developed that will identify any trend analysis from previous surveys, align with current key performance indicators and identify opportunities for customer improvement initiatives. Following the initial three week consultation period for online and telephone surveys, results will be analysed for the purpose of informing a more detailed engagement initiative via focus group. After which the full results will be analysed and a report provided back to Council with findings and recommendations. 17 RECOMMENDATION It is recommended that Council resolves as follows: 1 That Council note the nominated Gold Coast Water and Waste Customer Satisfaction
Survey for delivery in September 2017. 2 That Council note that the findings will be presented in early 2018 following a
November 2017 focus group and final analysis of results. Author: Authorised by: Carley Freeman Paul Heaton Acting Coordinator Customer Management Director Gold Coast Water and Waste 18 August 2017
TRACKS REF: # 64146703

742nd Council Meeting 5 September 2017 49 Gold Coast Water And Waste Committee Meeting 30 August 2017 Adopted Report ITEM 5 (Continued) GOLD COAST WATER AND WASTE CUSTOMER SATISFACTION SURVEY 2017 WSS1125/324(P1) LG314/621/18/010 COMMITTEE RECOMMENDATION WW17.0830.005 moved Cr PJ Young seconded Cr O’Neill 1 That Council note the nominated Gold Coast Water and Waste Customer
Satisfaction Survey for delivery in September 2017. 2 That Council note that the findings will be presented in early 2018 following a
November 2017 focus group and final analysis of results.
CARRIED
There being no further business the meeting closed at 3.19pm.

742nd Council Meeting 5 September 2017 50 Gold Coast Water And Waste Committee Meeting 30 August 2017 Adopted Report
These Pages
Numbered 1 to 50
Constitute The Adopted Report Of The Meeting
Of The Gold Coast Water and Waste Committee
Held Wednesday 30 August 2017