Tracking Marijuana in the National Accounts
34
BEA Working Paper Series, WP2021-5 Tracking Marijuana in the National Accounts Author Rachel Soloveichik, Research Economist U.S. Bureau of Economic Analysis Contact [email protected] Date August 2021 Abstract The internationally agreed guidelines for national economic accounts, System of National Accounts 2008 (United Nations Statistics Division 2008), explicitly recommend that illegal market activity should be tracked together with legal market activity. This recommendation is not currently implemented by the U.S. Bureau of Economic Analysis (BEA) because of challenges inherent in identifying suitable source data and differences in conceptual traditions (Carson 1984a and 1984b). Previous research studied how tracking four broad categories of illegal activity might impact aggregate economic statistics (Soloveichik 2019). This paper focuses on how tracking the narrow category of marijuana might impact the aggregate national accounts, the industry accounts, and the regional accounts. In aggregate, tracking marijuana raises the level of nominal gross domestic product (GDP) by 0.2 percentage point in 2019, raises real GDP growth between 2010 and 2019 by 0.05 percentage point per year, and raises measured productivity growth between 2010 and 2019 by 0.06 percentage point per year. By industry, measured nominal value-added in 2019 increases by $4 billion for the farm sector, $8 billion for the food, beverage, and tobacco manufacturing sector, and $37 billion for the retail sector. By state, measured nominal value-added in 2019 increases by $9 billion for California, $3 billion for New York, and by a smaller amount in states with a lower total state GDP or a less intense marijuana culture. Keywords Marijuana, Cannabis, Illegal, National Accounts, Productivity, Farm, Retail, Manufacturing JEL codes E01, O17, Q19 The views expressed in this paper are those of the authors and do not necessarily represent the U.S. Bureau of Economic Analysis, or the U.S. Department of Commerce.
Transcript of Tracking Marijuana in the National Accounts

BEA Working Paper Series, WP2021-5
Tracking Marijuana in the National Accounts
Author Rachel Soloveichik, Research Economist U.S. Bureau of Economic Analysis
Contact [email protected]
Date August 2021
Abstract The internationally agreed guidelines for national economic accounts, System of National Accounts 2008 (United Nations Statistics Division 2008), explicitly recommend that illegal market activity should be tracked together with legal market activity. This recommendation is not currently implemented by the U.S. Bureau of Economic Analysis (BEA) because of challenges inherent in identifying suitable source data and differences in conceptual traditions (Carson 1984a and 1984b). Previous research studied how tracking four broad categories of illegal activity might impact aggregate economic statistics (Soloveichik 2019). This paper focuses on how tracking the narrow category of marijuana might impact the aggregate national accounts, the industry accounts, and the regional accounts. In aggregate, tracking marijuana raises the level of nominal gross domestic product (GDP) by 0.2 percentage point in 2019, raises real GDP growth between 2010 and 2019 by 0.05 percentage point per year, and raises measured productivity growth between 2010 and 2019 by 0.06 percentage point per year. By industry, measured nominal value-added in 2019 increases by $4 billion for the farm sector, $8 billion for the food, beverage, and tobacco manufacturing sector, and $37 billion for the retail sector. By state, measured nominal value-added in 2019 increases by $9 billion for California, $3 billion for New York, and by a smaller amount in states with a lower total state GDP or a less intense marijuana culture.
Keywords Marijuana, Cannabis, Illegal, National Accounts, Productivity, Farm, Retail, Manufacturing
JEL codes E01, O17, Q19
The views expressed in this paper are those of the authors and do not necessarily represent the U.S. Bureau of Economic Analysis, or the U.S. Department of Commerce.

Introduction
2
The internationally agreed guidelines for national economic accounts, System of National Accounts 2008
(United Nations Statistics Division 2008), recommend that illegal market output should be tracked together with legal market output:
Transactions on unofficial markets that exist in parallel with official markets...
must also be included in the accounts, whether or not such markets are actually legal or
illegal (Section 6.42).
Activities that may be illegal but productive in an economic sense include the
manufacture and distribution of narcotics, illegal transportation in the form of
smuggling of goods and of people, and services such as prostitution (Section 6.44).
Transactions in which illegal goods or services are bought and sold need to be recorded
not simply to obtain comprehensive measures of production and consumption but also
to prevent errors appearing elsewhere in the accounts. ... The failure to record illegal
transactions may lead to significant errors within the accounts if the consequences of the
activity are recorded in the financial account and the external accounts, say, but not in
the production and income accounts (Section 6.45).
The official guidelines for international transactions, the Balance of Payments and International
Investment Position Manual (International Monetary Fund 2009), also recommend that illegal market trade should be tracked together with legal market trade. The recommendation to include illegal market activity in the composition of gross domestic product (GDP), gross domestic income (GDI), and balance of payments (BoP) has been implemented in the European Union. The publication The Handbook on the
Compilation of Statistics on Illegal Economic Activities in National Accounts and Balance of Payments
(Eurostat 2018) provides country cases for Australia, Belgium, Colombia, Denmark, Finland, Italy, Luxembourg, the Netherlands, Serbia, Sweden, Ukraine, and the United Kingdom. In addition, France recently included illegal drugs in their national accounts (Agence France-Presse 2018) and Canada recently included illegal cannabis in their national accounts (Barber-Duek et al. 2018). Many people use the words “cannabis” and “marijuana” as synonyms—but these words are defined slightly different under federal law. Cannabis refers to a general plant type. Marijuana refers to cannabis plants which contain at least 0.3 percent of the main psychoactive chemical, tetrahydrocannabinol (THC). Hemp refers to cannabis plants which contain less than 0.3 percent THC. Hemp has been explicitly

3
legal under federal law since 2018 (Hudak 2018) and is therefore assumed to be tracked in the current national accounts. The remainder of the paper will use the word marijuana only. BEA does not currently track illegal market activity because of challenges in source data and different conceptual traditions (Carson 1984a and 1984b). This paper focuses on how tracking marijuana might impact aggregate, industry, and regional economic statistics. Marijuana consumption in the United States was very low before the 1960s, so this paper starts its analysis in 1967. However, interested readers can get historical data from the more comprehensive paper, “Including Illegal Activity in the U.S. National Economic Accounts” (Soloveichik 2019). Other researchers are studying how tracking illegal drug trade might impact the broader trade accounts (Atkinson 2020). Readers should note that this paper uses different datasets and methodology than previous research, so the exact statistics reported in this paper may not match previous papers. This paper is divided into six sections. Section 1 describes the current and exploratory treatment of marijuana in the United States. Section 2 presents national data on nominal consumption, nominal production, and nominal intermediate inputs for marijuana. Section 3 presents national data on marijuana prices and overall GDP prices. Section 3 then calculates how tracking marijuana impacts real GDP growth and productivity growth. Section 4 discusses the regional impact of tracking marijuana. Finally, Appendix A lists the datasets used and Appendix B lists the assumptions made in the empirical portions of the paper.
1. Current and Exploratory Treatment of Marijuana
The paper tracks three separate categories of marijuana: state-permitted medical marijuana, state-permitted recreational marijuana, and unpermitted marijuana. State-permitted medical marijuana is explicitly permitted by state law for medical usage. State-permitted recreational marijuana is explicitly permitted by state law for nonmedical usage. Finally, unpermitted marijuana is all other marijuana.
Agriculture, manufacturing, and retail are the three industries involved with marijuana. Marijuana cultivators are part of agriculture and might have a North American Industry Classification System (NAICS) code 111419, “other food crops grown under cover.” Similarly, manufacturers producing edible, drinkable, or smokable products might have a NAICS code 311 or 312, “food, beverage, and tobacco manufacturing.” Finally, dispensaries and stores that sell to consumers are retailers and might have a NAICS code 453998, “all other miscellaneous store retailers (except tobacco stores).”

4
State-permitted marijuana cultivators are likely tracked in GDI but not GDP. On the income side, state-permitted marijuana cultivators report both employee compensation and business profits to the tax authorities (Breese 2019) and are therefore likely included in the taxable income statistics reported by the Internal Revenue Service (IRS) and GDI. On the output side, marijuana cultivators appear to be excluded from the survey sample for the U.S. Department of Agriculture (Honig and Beck 2019). This apparent exclusion is consistent with the minimal output of indoor herbs reported in the 2017 Census of Agriculture and the 2019 Census of Horticultural Specialties. Hence, state-permitted marijuana cultivators may add to GDI but not GDP, and therefore contribute to the statistical discrepancy.
State-permitted marijuana manufacturers and retailers are likely tracked in both GDI and GDP. The Economic Census does not yet have a dedicated industry code or product code tracking marijuana specifically but the 2017 Economic Census appears to include some retail sales of state-permitted marijuana in the product code “retail sales of religious goods (except) books.”1 However, total sales of that product code were only $2 billion in the 2017 Economic Census, one-third of the $6 billion in retail sales of state-permitted marijuana reported by industry experts (Anne Holland Ventures 2017). The remaining $4 billion of state-permitted marijuana sales may be reported in other retail product codes. It is also possible that BEA’s existing adjustment for underreporting and misreporting in the broader economy (BEA 2019) may implicitly include state-permitted marijuana sales which are not reported correctly to either the Economic Census or the tax authorities. For now, the paper assumes that the manufactured marijuana products produced by state-permitted marijuana manufacturers are already tracked in the sectors NAICS 311 or NAICS 312 and the retail margin earned by state-permitted marijuana retailers is already tracked in the sector NAICS 453998.
Finally, unpermitted marijuana output is likely excluded from both GDI and GDP since BEA’s adjustment for underreporting and misreporting does not cover illegal market activity (IRS 2005). However, a small fraction of unpermitted marijuana firms might misreport their activity as legal (Soloveichik 2019). For now, this paper assumes that neither unpermitted marijuana imports, unpermitted marijuana cultivation, unpermitted marijuana manufacturing, nor unpermitted marijuana retailing are tracked at all in the current national accounts.
1 This classification is likely related to the Economic Census’s survey form. The product code “retail sales of religious goods (except) books” is part of a broad product category “retail sales of household and personal goods, not elsewhere classified” that might seem to cover marijuana. Within that broad category, the detailed code “retail sales of religious goods (except) books” might seem more appropriate for marijuana than the other options.

5
Table 1. Impact of Marijuana on Gross Domestic Product (GDP)
Current treatment in GDP Adjusted GDP Change to GDP
1. Neither state-permitted nor unpermitted cultivators are tracked.
2. State-permitted manufacturers are tracked, but unpermitted manufacturers are not tracked.
3. State-permitted retailers are tracked, but unpermitted retailers are not tracked.
4. Intermediate inputs to cultivation and unpermitted manufacturing are tracked in personal consumption expenditures (PCE).
1. Both state-permitted and unpermitted cultivators are tracked in the farm sector.
2. Both state-permitted and unpermitted manufacturers are tracked in the manufacturing sector.
3. Both state-permitted and unpermitted retailers are tracked in the retail sector.
4. Intermediate inputs to cultivation and unpermitted manufacturing are excluded from PCE.
Increases by the value added of state-permitted and unpermitted cultivators plus the value added of unpermitted manufacturers and retailers.
Table 2. Impact of Marijuana on Gross Domestic Income (GDI)
Current treatment in GDI Adjusted GDI Change to GDI
1. Income earned by state-permitted cultivators is tracked, but income earned by unpermitted cultivators is not tracked.
2. Income earned by state-permitted manufacturers is tracked, but income earned by unpermitted marijuana manufacturers is not tracked.
3. Income earned by state-permitted marijuana retailers is tracked, but income earned by unpermitted retailers is not tracked.
1. Income earned by both state-permitted and unpermitted cultivators is tracked in the farm sector.
2. Income earned by state-permitted and unpermitted manufacturers is tracked in the manufacturing sector.
3. Income earned by both state-permitted and unpermitted retailers is tracked in the retail sector.
Increases by the income earned by unpermitted marijuana cultivators, manufacturers, and retailers.
Table 3. Impact of Marijuana on Balance of Payments (BoP)
Current treatment in BoP Adjusted BoP Change to BoP
Unpermitted marijuana is not tracked in the import statistics or the export statistics.
1. Unpermitted marijuana imports are included together with imports of legal goods.
2. Unpermitted marijuana exports are included together with exports of legal goods.
1. Imports increase by the value of marijuana imports.
2. Exports increase by the value of marijuana exports

6
2. Nominal Marijuana Statistics for the United States
Total personal consumption expenditures by marijuana category
The primary dataset is taken from the report, What America’s Users Spend on Illegal Drugs: 2006–2016
(Executive Office of the President 2019). Figure 5.4 gives the report’s estimate of cash spending on marijuana. A separate section of the report suggests that noncash transactions add another 12.5 percent to total spending. Accordingly, the cash spending numbers are then multiplied by 1.125 to get total marijuana consumption. For data between 1988 and 2006, expenditures on marijuana are taken from table 72 of the report National Drug Control Strategy: Data Supplement 2016 (Executive Office of the President 2016). For data after 2016, expenditures on marijuana are extrapolated using nominal costs per gram that will be described in the next section and aggregate usage days from the National Survey of Drug Use and Health (U.S. Department of Health and Human Services 2005–2021). Before 1988, expenditures on marijuana are extrapolated using nominal costs per gram, total marijuana users from the National Survey of Drug Abuse (U.S. Department of Health and Human Services 1995), and college survey data collected by Gallup (New York Times 1972).
The paper estimates state-permitted marijuana consumption using data from the Annual Marijuana
Business Factbook (Anne Holland Ventures 2013–2020). These reports provide state-level estimates of both state-permitted medical marijuana back to 2011 and state-permitted recreational marijuana back to the industry’s beginning in 2014. From 2005 to 2010, state-permitted medical marijuana sales were extrapolated using a news article on California medical marijuana sales in 2010 (McVey 2016) and counts of registered patients reported by the states of Michigan, Montana, and Oregon. Before 2005, expert judgment was used to extrapolate state-permitted medical marijuana sales back to the industry’s beginning in 1996 (Martin 2016). Unpermitted marijuana is calculated simply as the difference between total marijuana consumption and state-permitted marijuana consumption.
Chart 1 shows that state-permitted marijuana grew rapidly from less than $1 billion in 2010 to more than $10 billion in 2019, but it still accounts for only a small share of marijuana consumption. Even in states that permit both medical and recreational marijuana without restriction, unpermitted marijuana still generally accounts for the majority of consumption (Romero 2019).

7
Chart 1. Nominal Expenditures on Marijuana as a Share of GDP
There is no simple economic explanation for the dramatic growth in nominal marijuana consumption in the late 1960s. A small portion of the increase might be explained by the large Baby Boom generation starting adolescence then—but consumption per teenager also rose dramatically in the late 1960s (Johnson and Gerstein 1998). Similarly, a portion of the nominal spending increase could be explained by higher costs per gram of marijuana—but real consumption was also rising. Instead, a cultural shift during the late 1960s is the most likely explanation for the dramatic growth in marijuana consumption. This cultural shift has been well discussed in the popular, sociological, and legal literatures. In addition, some economists have also studied it (Weisskopf, Bowls, and Gordon 1983).
In contrast, the spike in nominal marijuana consumption in 1986 is due to a short-term spike in marijuana prices. Contemporary news media noted the price spike and argued that it was caused by changes in drug enforcement behavior (Lindsey 1986). One might think that such a large spike in price would cause a drop in real consumption—but no such drop appears in a survey of 12th graders (Miech et al. 2019). Apparently, marijuana consumption is relatively inelastic in the short term. The nominal consumption spike in the 1970s is harder to explain but may have been caused by changes in the average cost per gram of marijuana (Ledbetter 1976).

8
Marijuana production by sector
This section begins by estimating retail margins for marijuana. Retail margins on domestically cultivated marijuana are taken from the paper, “Winning Big: Scale and Success in Retail” (Giroldo and Hollenbeck 2020). Table 3 of that paper reports that state-permitted marijuana retailers in Washington state typically charge retail prices approximately double wholesale prices.2 This paper assumes that retail margins for state-permitted marijuana are fixed at 50 percent of retail prices for all years and all states. In addition, the paper also assumes that retail margins are 50 percent of retail prices for unpermitted marijuana which is produced domestically (either unprocessed marijuana flowers or manufactured marijuana products). Finally, the paper relies on previous research (Soloveichik 2019) to assume that retail margins for imported unprocessed flowers are fixed at 72 percent of retail prices.3 The retail margins specified above only apply to consumer purchases. Wholesale manufacturers who buy unprocessed marijuana for intermediate usage are assumed not to pay retail margins.
Second, the paper splits wholesale marijuana between manufactured products and unprocessed flowers. Chart 3.09 of the 2020 Annual Marijuana Business Factbook and chart 5.13 of the 2019 Annual
Marijuana Business Factbook show that state-permitted manufactured marijuana products have been growing very fast and now account for more than half of consumer spending in states with detailed data (Anne Holland Ventures 2019 and 2020). This data is supplemented with a paper giving the market share for state-permitted manufactured products in Washington state (Kilmer et al. 2019). Before 2014, the market share for manufactured products is extrapolated based on a sample of items which were seized and examined for chemical content (ElSohly 2020). The paper then calculates unprocessed flowers by simply subtracting manufactured products from total marijuana supply.
Third, the paper splits the unprocessed flower supply between domestic cultivation and imports of wholesale marijuana. States with permitted marijuana typically require it to be cultivated and processed by licensed companies within the state and forbid even interstate shipments of marijuana (Shapiro 2019), so state-permitted marijuana is assumed to be entirely domestically cultivated.
2 This gross markup appears to conflict with the graphs shown in figure 1 of the same paper. The paper’s authors were kind enough to explain that table 3 shows tax-exclusive prices and figure 1 shows tax-inclusive prices. 3 Imported marijuana is typically shipped longer distances and sold to different customers than domestic marijuana, so the higher retail margins do not necessarily mean that marijuana importers are more profitable.
9
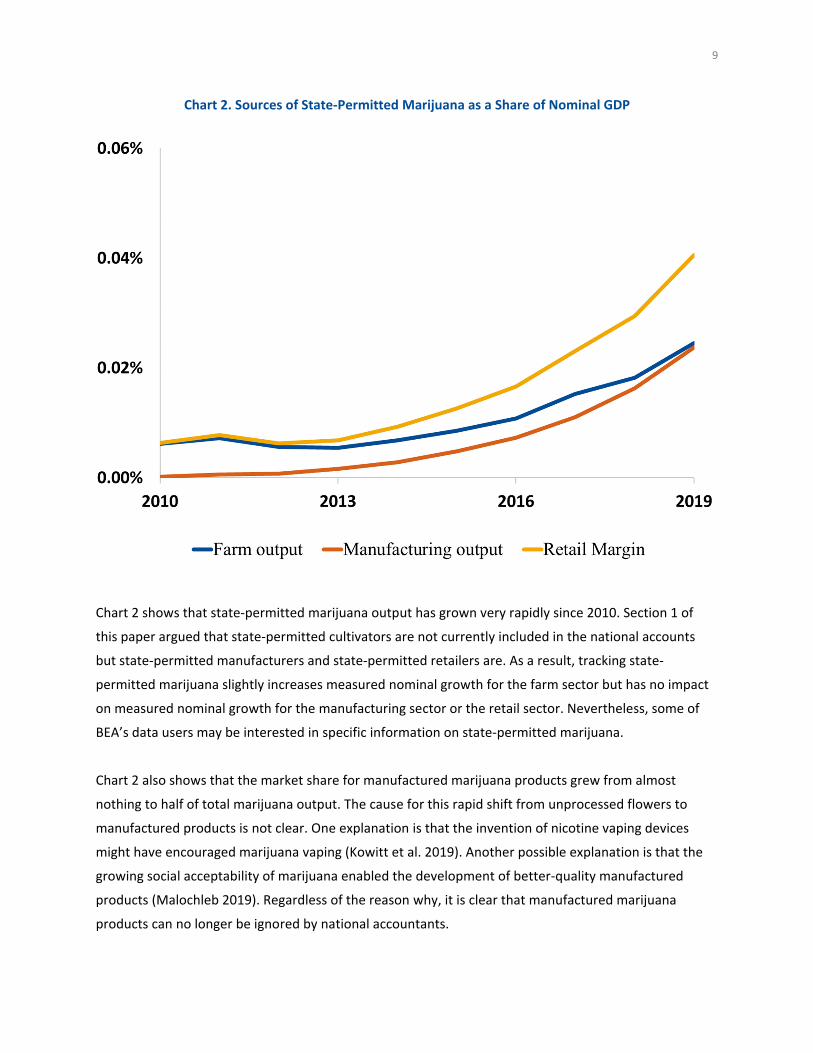
Chart 2. Sources of State-Permitted Marijuana as a Share of Nominal GDP
Chart 2 shows that state-permitted marijuana output has grown very rapidly since 2010. Section 1 of this paper argued that state-permitted cultivators are not currently included in the national accounts but state-permitted manufacturers and state-permitted retailers are. As a result, tracking state-permitted marijuana slightly increases measured nominal growth for the farm sector but has no impact on measured nominal growth for the manufacturing sector or the retail sector. Nevertheless, some of BEA’s data users may be interested in specific information on state-permitted marijuana.
Chart 2 also shows that the market share for manufactured marijuana products grew from almost nothing to half of total marijuana output. The cause for this rapid shift from unprocessed flowers to manufactured products is not clear. One explanation is that the invention of nicotine vaping devices might have encouraged marijuana vaping (Kowitt et al. 2019). Another possible explanation is that the growing social acceptability of marijuana enabled the development of better-quality manufactured products (Malochleb 2019). Regardless of the reason why, it is clear that manufactured marijuana products can no longer be ignored by national accountants.

10
Precise data on the market share for unpermitted manufactured products could not be located, but government surveys also report a similar shift towards manufactured products in states without permitted marijuana (Centers for Disease Control 2016–2019) or in age groups forbidden to purchase state-permitted marijuana (Patrick et al. 2020). For now, this paper assumes that the market share for unpermitted manufactured products tracks the market share for state-permitted manufactured products. Consistent with that assumption, a large number of lung injuries have been associated with unpermitted marijuana vaping (Gay et al. 2020). The paper also assumes that imported marijuana arrives either as unprocessed plant material or minimally processed oil (Pickel 2019), and so all manufactured marijuana products are produced domestically. Consistent with that assumption, a large number of fires have been attributed to unpermitted marijuana manufacturing (Sullivan 2019).
Estimating the split between domestic cultivation and imports for unpermitted marijuana is difficult. This paper’s estimates of marijuana imports are calibrated to recent research studying import shares from 2008 to 2017 (Atkinson 2019). After 2017, the paper uses the ratio of marijuana seizures at ports of entry to marijuana plant eradication by the Drug Enforcement Agency (Carroll 2020) to proxy for the ratio of imports to domestic cultivation. Before 2008, the paper assumes that the ratio of imports to domestic cultivation is fixed at its 2008 level of 4.6. The paper also assumes that a small but growing share of unpermitted marijuana is exported (Robinson et al. 2015). Readers should note that the European Union classifies unpermitted marijuana firms as either agriculture or retail (Eurostat 2018, 40). This simplification may be appropriate for their marijuana market but it makes cross-country comparisons of the impact of marijuana on specific industries problematic.
Chart 3 shows that the retail sector accounts for the largest share of unpermitted marijuana. This large share can be explained by the high markup charged by retailers. But the overall retail sector is quite large and so its measured industry value added only rises by about 4 percent when unpermitted marijuana retailers are included in the tracked economy. This 4 percent increase is relatively stable after 1990, so recent nominal growth for the domestic retail sector does not change much.
Chart 3 also shows that domestic cultivation grew significantly between 2016 and 2019. One possible explanation for the growth is that the existence of state-permitted marijuana makes it easier for criminals to cultivate unpermitted marijuana domestically (Romero et al. 2018). Another possible explanation is that American consumers now demand high quality marijuana that cannot be produced abroad (Robinson et al. 2015). Regardless of the reason why, the growth in domestic cultivation led to a significant decrease in unpermitted marijuana imports and an increase in domestic value added.

11
Chart 3. Sources of Unpermitted Marijuana as a Share of Nominal GDP
Intermediate inputs for domestic marijuana production
Cultivating marijuana indoors requires two main inputs: electricity to power the lights and greenhouse space for the marijuana plants (Caulkins 2010). This paper’s data on input costs is based on a survey of state-permitted marijuana cultivators reported in the Annual Marijuana Business Factbook (Anne Holland Ventures 2017). That survey reports that electricity accounted for approximately 25 percent of costs and space rental accounted for another 25 percent. When calculating annual cost shares, the paper assumes that every gram of marijuana cultivated requires a fixed quantity of electricity and a fixed quantity of greenhouse space. These real input requirements are assumed to be unaffected by either state law changes or the development of new plant varieties. Hence, the nominal share of revenue devoted to electricity and space can be calculated from the price per gram of marijuana, electricity prices, and space rental costs.

12
Manufacturing marijuana also requires two main inputs: unprocessed marijuana plant material and a space to hold the manufacturing equipment. Just like before, this paper’s data on input costs is based on a survey of state-permitted marijuana manufacturers reported in the Annual Marijuana Business
Factbook (Anne Holland Ventures 2017). That survey reports that unprocessed plant material accounted for approximately 29 percent of costs and space rental accounted for another 25 percent. When calculating annual cost shares, the paper assumes that every gram of THC concentrate requires a fixed number of THC units from unprocessed plant material and a fixed quantity of space. Hence, the nominal share of revenue devoted to plant materials and space can be calculated from the price per gram of concentrates, the price per unit of THC in marijuana plants, and space rental costs.
In contrast to marijuana cultivators and manufacturers, marijuana retailers have few untracked intermediate inputs. Unpermitted marijuana retailers generally meet their customers in a public location or deliver their product (Bushey 2019), and so they do not have costs associated with a physical store. Therefore, it seems plausible that unpermitted marijuana retailers have negligible intermediate inputs. In addition, state-permitted marijuana retailers are already included in the retail sector and already have their intermediate inputs tracked in the supply-use tables. Hence, measured intermediate inputs in the national accounts will not change when marijuana retailers are tracked.
Aggregate economic statistics
It is not straightforward to split marijuana output between GDI components. The major issue is that unpermitted marijuana firms are typically loosely organized and do clearly distinguish between income categories. For now, this paper assumes that the income earned by unpermitted marijuana firms is split 75 percent to proprietors’ income, 25 percent to employee compensation, and nothing to taxes or capital compensation. In contrast to this paper, Europe generally assumes that proprietors’ income accounts for 100 percent of illegal market value added employed (Eurostat 2018, 37). So, the increase to proprietors’ income shown in this paper could be seen as a lower bound. The only GDI impact of tracking state-permitted marijuana firms is that cultivators may not be tracked in GDP and therefore may contribute to the statistical discrepancy.
Chart 5 shows that nominal GDP increases when marijuana is tracked but the increase is less than the upward revision to consumption shown in chart 1. The most important offset is the increase to measured imports, which are subtracted from GDP. In addition, BEA’s current accounts track some of the intermediate inputs used to produce marijuana and some of the output of state-permitted marijuana in non-marijuana consumption spending. This paper adjusts non-marijuana consumption downwards to remove this misclassified spending.

13
Chart 4. Revision to Nominal Income, as a Share of GDP
Chart 5. Revision to Nominal GDP, as a Share of GDP

3. Marijuana Prices, Real GDP Growth, and Productivity Growth
14
The paper calculates two separate price indexes: one for medical marijuana and one for recreational marijuana. The medical marijuana price index focuses on special marijuana products which are used for medical purposes like preventing seizures (Perucca 2017) or relieving psychiatric disorders (Sarris et al. 2020).4 The recreational marijuana price index focuses on two ordinary marijuana products: unprocessed flowers and manufactured products. Over the past decade, the market share for unprocessed flowers has shrunk from over 90 percent to under 50 percent. As a result, the recreational marijuana price index has shifted from mostly tracking unprocessed flower prices to tracking the two components almost equally.
Neither the medical marijuana price index nor the recreational marijuana price index follows BLS’s standard methodology for calculating prices. Both the Consumer Price Index and the Producer Price Index generally track prices for the exact same product at a specific outlet over time (BLS 2018). Unfortunately, this matched model technique requires detailed and consistent time-series which could not be easily located for either medical or recreational marijuana. Instead, this paper will use alternative methodologies to construct price indexes from the data located.
State-permitted medical marijuana prices
This paper uses costs per medical marijuana patient as its price index. This price index is inspired by the cost indexes used to calculated BEA’s health satellite account (Dunn et al. 2015), but it does not split spending by disease category like they do. The primary data source used in this paper is the Annual
Marijuana Business Factbook (Anne Holland Ventures 2013–2020), which gives estimates of medical marijuana spending back to 2011 and the number of medical marijuana patients back to 2013. Before then, the paper uses trend analysis to extrapolate costs per medical marijuana patient.
Medical marijuana prices do not adjust for either quality or quantity. In other words, measured inflation rates may be overestimated if patient outcomes have improved due to an increase in the amount of medical marijuana consumed per patient, an increase in the quality of medical marijuana, or better matching of patients with marijuana varieties. The problem of adjusting health care costs for patient outcomes is a well-known topic in the health literature and has been previously studied by BEA researchers (Dunn et al. 2018; Hall 2017). However, BEA does not currently adjust either its core economic statistics or its health care satellite statistics for patient outcomes (Dauda et al. 2019).
4 To review federal law, nonprescription cannabidiol (CBD) oil and prescription drugs derived from cannabis plants with less than 0.3 percent THC are classified as hemp and are assumed to be tracked as pharmaceuticals already.

15
Accordingly, the medical marijuana price index may be consistent with other health care prices even if it does not correspond exactly to a theoretically preferable measure of medical inflation.
Unprocessed flower prices
European countries typically base their marijuana price index on the cost per gram of plant material (European Monitoring Centre for Drugs and Drug Addiction 2012).5 However, this price index is inconsistent with the purity-adjusted prices for cocaine, heroin, and methamphetamine which are published by the U.S. Drug Enforcement Agency (Executive Office of the President 2016). In addition, the U.S. Bureau of Labor Statistic’s prescription drug price indexes use quantity of active ingredient rather than pill weight to link generic drugs with brand name drugs (Bosworth et al. 2018). In order to be consistent with those price indexes, this paper will track potency-adjusted retail prices for recreational marijuana rather than costs per gram of plant material. Based on previous research (Soloveichik 2019), wholesale marijuana prices are assumed to track retail prices.
The paper starts out by calculating the retail cost per gram of unprocessed flowers. The primary data for that time series is taken from What America’s Users Spend on Illegal Drugs: 2006–2016 (Executive Office of the President 2019). This report gives an estimate of marijuana consumption in grams (figure 6.1) which can be combined with the nominal spending estimate shown in chart 1 to get an average cost per gram from 2006 to 2016.6 Between 1981 and 2006, marijuana prices are calculated from the per gram prices in table 76 of National Drug Control Strategy: Data Supplement (Executive Office of the President 2016). For pre-1981 data, a historical price series is constructed from academic research tracking national marijuana prices between 1975 and 1980 (Lindgren and Grossman 2005), IRS data for national marijuana prices between 1973 and 1974 (IRS 1983), and a government report giving national marijuana prices in 1965 (Katzenbach 1967). After 2016, the paper uses California prices for state-permitted flowers (Goldstein and Summer 2019) and a nationwide price index for state-permitted flowers published by BDS Analytics (Capelj 2020) as extrapolators. Between years with data, the Consumer Price Index is used as a price interpolator.
Next, unprocessed flower costs are adjusted for changes in potency. THC is the main psychoactive chemical in marijuana, and recreational users are often believed to adjust marijuana plant material
5 Canada’s current price index is based on costs per gram of plant material. However, they are also experimenting with measuring THC consumption directly, and then using that as a quantity index (Werschler and Brennan 2019). 6 Average price per gram includes medical marijuana, manufactured recreational products, and unprocessed recreational flowers. In practice, unprocessed recreational flowers accounted for the vast majority of purchases before 2010. As a result, adjusting for the different scope would not change historical prices much.

16
consumption to hit a fixed THC target (Leung 2021). Annual statistics on the average THC share for marijuana are taken from the marijuana potency monitoring program (ElSohly 2020; ElSohly et al. 1984 and 2000). These statistics are then smoothed across 5 years and combined with the average price per gram calculated earlier to derive a potency-adjusted price index. Potency data could not be located before 1972, so the paper assumes that THC content was stable from 1967 to 1972.
Readers should note that this price index does not adjust for either quality or availability. It is likely that quality for unprocessed marijuana flowers has risen in recent years. Most important, the new purchases of low-quality flowers by manufacturers probably means that the flowers remaining unprocessed tend to be higher quality than average. In addition, the general shift towards state-permitted marijuana has probably improved average quality somewhat.7 Previous research also adjusted prices for changes in drug availability over time (Soloveichik 2019). This adjustment had little impact on unprocessed marijuana flower prices because they have been almost universally available for decades.
Manufactured marijuana prices
For now, the paper will use cost per gram for THC concentrate (oil or wax) as its price index. The manufactured marijuana category contains hundreds of products which differ by usage mechanism, THC and other chemical content, brand name, and other attributes (Caulkins et al. 2018). However, collecting consistent price data for such a diverse category of products would be practically infeasible. In contrast, THC concentrate is a relatively homogenous product category which accounts for a large share of manufactured marijuana consumption. Furthermore, it is also an important input into products like edibles and lotions (Kilmer et al. 2019). Hence, it seems likely that THC concentrate prices are a reasonable proxy for prices of a broad basket of manufactured marijuana products.
Data on state-permitted THC concentrate prices for 2017 and 2019 is taken from chart 4.11 of the Annual Marijuana Factbook (Anne Holland Ventures 2020). Prices for 2018 are interpolated based on the unprocessed flower price index calculated earlier. Prices for 2015 and 2016 are extrapolated using THC oil prices and marijuana mix package prices in Washington’s state-permitted market. Unlike unprocessed flowers, THC concentrate has had a consistently high THC share since 2015 (Kilmer et al. 2019).8 As a result, there is no need to adjust cost per gram for potency changes over time. Prices for unpermitted concentrate are assumed to track prices for state-permitted concentrate. Before 2015,
7 Unpermitted marijuana consumers may benefit from spillovers like new marijuana strains that were first bred for state-permitted marijuana and online resources which are supported by advertising for state-permitted marijuana. 8 The paper reports both weight and revenue for THC oil in 2015, but the weight only covers a portion of the sales. State-permitted marijuana mix package costs per gram are therefore used as a proxy for 2015 prices.

17
concentrate prices are extrapolated using unprocessed flower prices and expert judgment. Just like unprocessed flowers, this price index does not adjust for either quality or availability.
Chart 6. Marijuana Prices, 2012 Base Year = 100
Chart 6 shows that recreational marijuana prices have risen much slower than the cost per gram of raw plant material. The main driver of this slower price growth is an increase in average THC share from approximately 1 percent in 1973 to nearly 15 percent in 2019. As a result, prices per THC unit in unprocessed flowers grew ten-fold slower than prices per gram of marijuana. In addition, marijuana manufacturers are now using specialized equipment (May 2019) to extract high quality concentrates from previously worthless parts of the marijuana plant (Wood 2018). These processing improvements have reduced prices for manufactured marijuana products relative to unprocessed flower prices.

18
Revisions to GDP prices and real GDP growth
Chart 7. Revision to GDP Prices, Relative to Original GDP Price Index
Chart 7 shows that measured inflation falls slightly when marijuana is included in the consumption basket. This revision to measured inflation is probably too small to impact aggregate monetary policy. But the drop in marijuana prices may be more economically significant to important population subgroups like young adults living in their parents’ home. Readers should note that the revision associated with non-marijuana consumption in chart 8 is slightly sensitive to the price indexes assumed for that category. For now, this paper assumes that rental rates for marijuana greenhouse space and manufacturing space track BEA’s consumer price for housing services (table 2.4.4, line 50) and prices for electricity to power cultivation lights track BEA’s consumer price for electricity (table 2.4.4, line 58). Finally, the paper uses BEA’s consumer price for other nondurable goods to deflate the state-permitted marijuana manufacturing output and retail margins which had previously been misclassified as some other product (table 2.4.4, line 39).

19
Chart 8. Revision to GDP Quantity, Relative to Original Quantity Index
Chart 8 shows that tracking marijuana raises real GDP growth. Between 2010 and 2019, measured growth increases by 0.05 percentage point per year when marijuana is tracked in GDP. This growth increase is almost entirely driven by the newly tracked unpermitted marijuana, which accounted for almost all of marijuana spending until 2014 and still accounts for the lion’s share of marijuana spending. In addition, tracking state-permitted marijuana also requires a downward revision to non-marijuana products that partially offsets the newly recognized marijuana consumption.
Total factor productivity accounts
This paper includes some initial estimates of how tracking marijuana might impact measured total factor productivity (TFP) but acknowledges that these initial estimates may be imperfect. The productivity calculations in this paper are based on existing industry-level production accounts that track labor, capital services, and intermediate inputs for 61 separate private business sector industries (Garner et al. 2018; Jorgenson et al. 2016). The paper then uses BEA’s GDP-by-industry statistics and expert judgment to extrapolate those production accounts forward until 2019. For the productivity calculations, each

20
industry production account will be revised to include both the newly tracked marijuana outputs and the newly tracked inputs associated with marijuana production.
Labor quantities for state-permitted marijuana are measured using an annual estimate of marijuana jobs (Anne Holland Ventures 2013–2020). That report gives estimates of the number of full-time workers back to 2016 and total workers back to 2012. Nominal revenue for the state-permitted marijuana market is used as a proxy for marijuana jobs before then. Data splitting recreational marijuana workers from medical marijuana workers could not be located. For simplicity, this paper will assume that wages are identical across the two categories of state-permitted marijuana.
Labor quantities for unpermitted marijuana are measured using marijuana sales arrests from the FBI’s Uniform Crime Report (Department of Justice 1968–2020). To be clear, individuals arrested for marijuana possession are assumed to be users rather than sellers and are therefore not included the labor quantity index. The paper assumes that arrests are split between foreign importers, domestic cultivators, domestic manufacturers, and domestic retailers in proportion to their nominal value added. Readers should note that measured labor quantities may be biased if the arrest rate for unpermitted marijuana workers changes over time. In other words, non-enforcement of written laws against unpermitted marijuana would appear as a decrease in the number of unpermitted sellers.
Intermediate inputs are tracked using a variety of assumptions. As discussed earlier, the paper assumes that state-permitted marijuana manufacturing and retailing are both tracked in the current production accounts. As a result, the only impact of tracking those industries is the introduction of more accurate price indexes for inputs and outputs. For unpermitted marijuana firms and state-permitted marijuana cultivators, the changes are more extensive. Marijuana cultivation requires electricity and space to hold the plants. Marijuana manufacturing requires unprocessed marijuana and space to hold the manufacturing area. For simplicity, marijuana businesses are assumed to own little capital and therefore the capital accounts will not be revised in this paper. Instead, intermediate inputs increase by the newly recognized electricity purchases, space rent, and unprocessed marijuana purchases.
Chart 9 shows that tracking unpermitted marijuana raises measured productivity growth between 2010 and 2019 by 0.06 percentage point per year. Most of this increase can be attributed to increased productivity growth in the retail sector, but the farm sector and the manufacturing sector also contribute. Just like in chart 8, the aggregate growth increase from tracking state-permitted marijuana is so small that it is almost invisible. To be clear, this result does not rule out rapid productivity growth in the state-permitted marijuana sector. But that sector is still too small to impact on aggregate productivity for the broad economy.

21
Chart 9. Revision to Aggregate TFP Index, Relative to Original TFP Index
4. State-level Marijuana Consumption
The primary dataset used to estimate total marijuana consumption is the National Survey of Drug Use and Health (U.S. Department of Health and Human Services 2005–2020). This paper focuses on the question “Have you used marijuana in the past month,” and assumes that all respondents who report using marijuana in the past month spent the same nominal amount on marijuana.9 In other words, the elasticity of marijuana consumption for monthly users with respect to state-level prices is assumed to be
9 This paper assumes minimal consumption by children under 12, who are excluded from the consumption survey.

22
exactly one. State-level survey data is available from 2003 to 2019. Before 2003, drug arrests in the FBI’s Uniform Crime Report are used as a proxy for total marijuana consumption.10
Next, the paper estimates state-permitted marijuana consumption. Unfortunately, neither data on local consumption of state-permitted marijuana by visitors nor data on transportation of state-permitted marijuana across state lines could be readily located. For now, this paper relies on a report by the Colorado Department of Revenue (Orens et al. 2018) which estimates that adult residents of Colorado consume 62.8 percent of the state-permitted marijuana sold in Colorado. This paper assumes that half of the remainder (18.7 percent) is consumed by nonresidents. BEA has summary statistics on cross-state purchases calculated from the Fiserv/Palantir data (Dunn and Gholizadeh 2020). That dataset’s estimate of credit card spending in Colorado by non-Colorado residents was reasonably close to the 18.7 nonresident share of marijuana purchases, so the paper assumes that all cross-state purchases of state-permitted marijuana follow the same pattern as credit card payments. Unpermitted marijuana consumption is then estimated as the difference between total marijuana consumption and state-permitted marijuana consumption.
The most important result from the state data is that unpermitted marijuana is everywhere. Consumers with free access to state-permitted recreational marijuana still consume considerable amounts of unpermitted marijuana. In those states, an unlicensed marijuana provider is similar to an unlicensed repairman: their business is not considered a serious crime even though it does not comply with all government regulations or pay all taxes. Previous drafts of this paper have experimented with tracking noncriminal unpermitted marijuana separately from criminal unpermitted marijuana. This split offered useful theoretical insights but was difficult to implement empirically. For now, the discussion in this paper will focus on the three categories of state-permitted medical marijuana, state-permitted recreational marijuana, and unpermitted marijuana.
Chart 10 shows only a small negative correlation between per capita consumption of unpermitted marijuana and per capita consumption of state-permitted marijuana. Similarly, a panel analysis shows only a small negative correlation between changes in per capita consumption of unpermitted marijuana and changes in per capita consumption of state-permitted marijuana. This small negative correlation is a stark contrast to earlier research finding a large negative correlation between legal alcohol consumption and illegal alcohol consumption in the 1930s (Soloveichik 2019). In other words, the recent growth of state-permitted marijuana primarily represents new consumption rather than substitution from unpermitted marijuana.
10 The Uniform Crime Report does not disaggregate drug arrests by category and state. However, it does report regional data on the share of drug arrests for marijuana usage. That data is used in the historical extrapolations.

23
Chart 10. Marijuana Consumption in 2019, Nominal $ Per Person
Conclusion
The official guidelines for national accounting recommend that illegal market activity be included in measured output. Consistent with that recommendation, most European Union countries have integrated illegal drugs and illegal prostitution into their national accounts (Eurostat 2018). BEA does not currently implement the recommendation because of challenges in source data and different conceptual traditions (Carson 1984a and 1984b). This preliminary paper explores how tracking both state-permitted and unpermitted marijuana might impact the U.S. National Economic Accounts.

Bibliography
24
Agence France-Presse. (2018) “France to Boost Its GDP by Including Sales of Illegal Drugs,” January 31st. Anne Holland Ventures (2013–2020) “Annual Marijuana Business Factbook” Marijuana Business Daily, available for purchase at https://mjbizdaily.com/factbook/. Atkinson, S. (2020) “Towards Developing Estimates of U.S. Imports of Illegal Drugs” BEA Working Paper 2020-2, https://www.bea.gov/system/files/papers/WP2020-2.pdf. Barber-Dueck, C., Donegan, I., Smith, P., Tebrake, J., and Van Rompay, C. (2018) “Legalization of Cannabis in the Canadian National Accounts” Working Paper Presented at IARIW. Bosworth, B., Bieler, J., Kleinrock, M., Koepcke, E., and Berndt, E. (2018) “An Evaluation of the CPI Indexes for Prescription Drugs,” Brookings Report, posted January 22, 2018 and accessed May 24, 2021. Breese, J. (2019) “Managing Cannabis Employee and Contractor Payroll with Cash” Green Growth Blog, posted September 3, 2019 and accessed March 24, 2021. Bureau of Economic Analysis (2019) “Concepts and Methods of the U.S. National Income and Product Accounts,” https://www.bea.gov/resources/methodologies/nipa-handbook. Bureau of Labor Statistics (2018) “Handbook of Methods,” https://www.bls.gov/opub/hom/. Bushey, C. (2019) “Here’s What Legal Pot Means For Your Local Dope Dealer,” Crain’s Chicago Business, June 28, 2019. Capelj, R. (2020) “BDS Analytics’ October 2019 Cannabis Price Index (CPI) Points To Stability in Retail Pricing,” Benzinga.com, posted January 7, 2020 and accessed March 24, 2021. Carson, C. (1984a and b) “The Underground Economy: An Introduction” Survey of Current Business 64 (May): 21-37 and Survey of Current Business 66 (July): 106-117. Caulkins, J. (2010) “Estimated Cost of Production for Legalized Cannabis” Rand Working Paper 764.

25
Caulkins, J., Bao, Y., Davenport, S., Fahli, I., Guo, Y., Kinnard, K., Najewicz, M., Renaud, L., and Kilmer, B. (2018) “Big Data on a Big New Market: Insights from Washington State’s Legal Cannabis Market,” International Journal of Drug Policy 57 (July): 86-94. Centers for Disease Control (2016–2019) “Behavioral Risk Factor Surveillance System Survey Data” Downloaded in 2021, https://data.cdc.gov/. Dauda, S., Dunn, A., and Hall, A. (2019) “Are Medical Care Prices Still Declining? A Systematic Examination of Quality-Adjusted Price Index Alternatives for Medical Care,” BEA Working Paper 2019-3. Department of Justice (1968–2020) “Uniform Crime Report,” https://www.fbi.gov/services/cjis/ucr. Dunn, A. and Gholizadeh, M. (2020) “The Geography of Consumption and Local Economic Shocks: The Case of the Great Recession,” BEA Working Paper 2020-9. Dunn, A., Rittmueller, L. and Whitmire, B. (2015) “Introducing the New BEA Health Care Satellite Accounts,” Survey of Current Business 95 (January). Dunn, A., Whitmire, B., Batch, A., Fernando, L. and Rittmueller, L. (2018) “High Spending Growth Rates for Key Diseases in 2000-14 were Driven by Technology and Demographic Factors,” BEA Working Paper 2018-7, https://apps.bea.gov/papers/pdf/Working_Paper_7_5_18.pdf. ElSohly, M. (2020) “Potency Monitoring Program: Quarterly Report 142,” National Center for Natural
Products Research, posted January 8, 2020 and access May 25, 2021. ElSohly, M., J. Holley, G. Lewis, M. Russell, and C. Turner. (1984) “Constituents of Cannabis sativa L. XXIV: The Potency of Confiscated Marijuana, Hashish, and Hash Oil Over a Ten-Year Period,” Journal
Forensic Science 29(2), 500-514. ElSohly, M., S. Ross, Z. Mehmedic, R. Arafat, B. Yi, and B. Banahan. (2000) “Potency Trends of Δ9-THC and Other Cannabinoids in Confiscated Marijuana from 1980-1997” Journal Forensic Science 45(1), 24-30. European Monitoring Centre for Drugs and Drug Addiction (2012) “EMCDDA Insights: Cannabis Production and Markets in Europe,” https://www.emcdda.europa.eu/system/files/publications/ 683/web_INSIGHTS_CANNABIS_350894.pdf.

26
Eurostat (2018) “Handbook on the Compilation of Statistics on Illegal Economic Activities in National Accounts and Balance of Payments.” Executive Office of the President (2016) “National Drug Control Strategy: Data Supplement 2016.” Executive Office of the President (2019) “What America’s Users Spend on Illegal Drugs: 2006–2016.” Garner, C., J. Harper, T. Howells, M. Russell, and J. Samuels. (2018) “Backcasting the BEA/BLS Integrated Industry-Level Production Account and the Sources of U.S. Economic Growth Between 1987 and 2016.” Gay, B., Field, Z., Patel, S., Alvarez, R., Nasser, W., Madruga, M., Carlan, S. (202) “Vaping-Induced Lung Injury: A Case of Lipoid Pneumonia Associated with E-Cigarettes Containing Cannabis,” Case Reports in
Pulmonology, https://www.ncbi.nlm.nih.gov/pmc/articles/PMC7157807/. Giroldo, R. and Hollenbeck, B. (2020) “Winning Big: Scale and Success in Retail,” SSRN Working Paper, https://papers.ssrn.com/sol3/papers.cfm?abstract_id=3613183, posted September 20, 2020 and accessed March 24, 2021. Goldstein, R. and Sumner, D. (2019) “Retail Cannabis Prices in California Through Legalization, Regulation and Taxation” California Agriculture 73(3): 136-145. Hall, A. (2016) “Adjusting the Measurement of the Output of the Medical Sector for Quality: A Review of the Literature” Medical Care Research and Review 74(6). Honig, E. and Beck, M. (2019) “By the Numbers: What the USDA’s Latest Census Tells Us About American Agriculture” Harvest Public Media, posted April 11, 2019 and accessed March 24, 2021. Hudak, J. (2018) “The Farm Bill, Hemp Legalization, and the Status of CBD: An Explainer,” Brookings Institute, posted December 14, 2018 and accessed April 23, 2021. Internal Revenue Service (1983) “Income Tax Compliance Research: Estimates for 1973-1981,” July. Internal Revenue Service. (2005) “Understanding the Tax Gap” FS-2005-14, March 2005. International Monetary Fund (2009) “Balance of Payments and International Investment Position Manual, Sixth Edition.”

27
Johnson, R. and Gerstein, D. (1998) “Initiation of Use of Alcohol, Cigarettes, Marijuana, Cocaine, and Other Substances in US Birth Cohorts since 1919,” American Journal of Public Health 88 (1): 27-33. Jorgenson, D., M. Ho, and J. Samuels. (2016) “US Economic Growth – Retrospect and Prospect: Lessons from a Prototype Industry-Level Production Account for the US, 1947–2012.” World Economy: Growth or
Stagnation, 34-69. Cambridge, UK: Cambridge University Press. Kilmer, B., Davenport, S., Smart, R., Caulkins, J., and Midgette, G. (2019) “After the Grand Opening: Assessing Cannabis Supply and Demand in Washington State,” RR-3138-WSLCB. Kowitt, S., Osman, A., Meernick, C., Zarkin, G., Ranney, L., Martin, J., Heck, C., and Goldstein A. (2019) “Vaping Cannabis Among Adolescents: Prevalence and Associations with Tobacco Use from a Cross-Sectional Study in the USA,” BMJ Open 9(6), https://bmjopen.bmj.com/content/9/6/e028535. Katzenbach, N. (1967) “The Challenge of Crime in a Free Society” Report by the President’s Commission on Law Enforcement and the Administration of Justice, https://www.ncjrs.gov/pdffiles1/nij/42.pdf. Ledbetter, L. (1976) “Price of Marijuana Soars as Its Use Increases Among the Nation’s Affluent,” New York Times, published February 12, 1976 and accessed May 24, 2021. Leung, J., Stjepanovic, D., Dawson, D., and Hall, W. (2021) “Do Cannabis Users Reduce Their THC Dosages When Using More Potent Cannabis Products? A Review,” Frontiers in Psychiatry, https://www.frontiersin.org/articles/10.3389/fpsyt.2021.630602/full. Lindgren, B. and M. Grossman. (2005) “Substance Use: Individual Behavior, Social Interaction, Markets and Politics” vol. 16 of Advances in Health Economics and Health Services Administration. Lindsey, R. (1986) “Marijuana Drive Reduces Supplies and Raises Prices,” New York Times, published October 4, 1986 and accessed May 24, 2021. Malochleb, M. (2019) “Why Cannabis Edibles are Creating a Buzz,” Food Technology Magazine, posted February 1, 2019 and accessed May 24, 2021. Martin, S. (2016) “A Brief History of Marijuana Law in America,” Time Magazine, posted April 20, 2016 and accessed March 24, 2021.

28
May, M. (2019) “A Guide to Cannabis Extraction Equipment and Machines” Analytical Cannabis, posted March 21, 2019 and accessed April 23, 2021. McVey, E. (2016) “Chart: California Medical Marijuana Sales Skyrocket 132% Since 2010,” Marijuana
Business Daily, posted October 31, 2016 and accessed May 25, 2021. Miech, R., L. Johnston, P. O’Malley, J. Bachman. and J. Schulenberg. (2019) “Monitoring the Future: National Survey Results on Drug Use 1975–2018; Volume I.” New York Times (1972) “Gallup Finds Rise in Marijuana Use,” February 6, 36. Carroll, J. (2020) “National Drug Control Strategy, Data Supplement 2020,” https://trumpwhitehouse.archives.gov/wp-content/uploads/2020/02/2020-NDCS-Data-Supplement.pdf. Orens, A., Light, M., Lewandowski, B., Rowberry, J., and Saloga, C. (2018) “Market Size and Demand for Marijuana in Colorado, 2017 Market Update,” Marijuana Policy Group, https://www.colorado.gov/ pacific/sites/default/files/MED%20Demand%20and%20Market%20%20Study%20%20082018.pdf. Patrick, M., Miech, R., Kloska, D., Wagner, A., and Johnston, L. (2020) “Trends in Marijuana Vaping and Edible Consumption From 2015 to 2018 Among Adolescents in the United States” JAMA Pediatrics 174 (9): 900-902. Perucca, E. (2017) “Cannabinoids in the Treatment of Epilepsy: Hard Evidence at Last?” Journal of
Epilepsy Research 7 (2): 61-76. Pickel, K. (2019) “CBS 5 Investigates Exposes Drug Cartel’s Crude Oil, Possibly Linked to Vaping Injuries” CBS 5 Investigates, posted December 13, 2019 and accessed April 23, 2021. Robinson, P., Cattan, N., and Bain, B. (2015) “America’s Quality Pot is Changing the Drug War” Bloomberg Businessweek, June 3, 2015, and accessed April 23, 2021. Romero, D. (2019) “California’s Cannabis Black Market Has Eclipsed Its Legal One” NBC News, September 20, 2019, and accessed April 23, 2021.

29
Romero, D., Gutierrez, G., Blankstein, A., and Powell, R. (2018) “Foreign Cartels Embrace Home-Grown Marijuana in Pot-Legal States,” NBC News, posted May 29, 2018 and accessed May 24, 2021. Sarris, J., Sinclair, J., Karamacoska, D., Davidson, M., and Firth, J. (2020) “Medicinal Cannabis for Psychiatric Disorders: A Clinically-Focused Systematic Review” BMC Psychiatry, 20(24). Shapiro, I. (2019) “The case for Allowing Interstate Trade Among Marijuana-Legal States,” Cato Institute, posted March 13, 2019 and accessed May 21, 2021. Sullivan, A. (2019) “Exploding Danger: U.S. Marijuana Oil Labs Pose Deadly Destructive Hazard” Reuters, posted June 4, 2019 and accessed April 23, 2021. Soloveichik, R. (2019) “Including Illegal Activity in the U.S. National Economic Accounts” BEA Working Paper 2019-4, https://www.bea.gov/system/files/papers/WP2019-4_6.pdf. U.S. Department of Health and Human Services, Substance Abuse and Mental Health Services Administration, Center for Behavioral Health Statistics and Quality. (1995 and 2005–2020) National
Survey on Drug Use and Health, https://www.datafiles.samhsa.gov/study-series/national-survey-drug-use-and-health-nsduh-nid13517. United Nations Statistics Division. (2008). Updated System of National Accounts 2008. Accessed May 20, 2013, http://unstats.un.org/unsd/nationalaccount/sna2008.asp. Werschler, T. and Brennan, A. (2019) “Wastewater-based Estimates of Cannabis and Drug Use in Canada: Pilot Test Detailed Results,” https://www150.statcan.gc.ca/n1/pub/11-621-m/11-621-m2019004-eng.htm. Weisskopf, T., S. Bowles, and D. Gordon. (1983) “Hearts and Minds: A Social Model of U.S. Productivity Growth,” Brookings Papers on Economic Activity 2, 381-450. Wood, J. (2018) “6 Ways to Use Your Cannabis Trim” Maximum Yield, posted November 9, 2018 and accessed April 23, 2021.

30
Appendix A: Datasets Used to Estimate Illegal Activity
Data source -Time series derived from source
2017 Economic Census Background information on state-permitted marijuana
Anne Holland Ventures (2013–2020)
Sales of state-permitted medical marijuana by state 2013–2019, Sales of state-permitted recreational marijuana by state 2014–2019, Total sales of state-permitted marijuana by category 2011–2019, Count of medical marijuana patients 2013–2019, State-permitted marijuana concentrate prices 2017–2019, Market share for state-permitted manufactured products 2016–2019,
Intermediate inputs for cultivated and manufactured marijuana 2017, Count of workers in state-permitted marijuana sector 2013–2019
Atkinson 2019 Import share for wholesale marijuana 2008–2017
BEA table 2.4.4 Consumer prices for space rental costs, electricity, and other nondurable goods 1967–2019
BEA industry accounts Used to extrapolate productivity data 2017–2019
Capelj 2020 Marijuana costs per gram 2019
Carroll 2020 Import share for wholesale marijuana 2018–2019
Centers for Disease Control 2016–2019 Qualitative usage of unpermitted manufactured products 2016–2019
Department of Justice 1967–2017
Arrests for importing, cultivating, manufacturing, or selling marijuana by region and year 1967–2019, Arrests for drug use and production by state 1967–2019
Dunn and Gholizadeh 2020 Cross-state spending patterns, used as a proxy for cross-state purchases of state-permitted marijuana
ElSohly et al. 1984 THC content for unprocessed flowers 1972–1979
ElSohly et al. 2000 THC content for unprocessed flowers 1980–1994
ElSohly, M. 2020 Market share for unpermitted marijuana products 1995–2013, THC content for unprocessed flowers 1995–2019
Executive Office of the President 2019
Nominal spending on marijuana 2006–2016, Marijuana costs per gram 2006–2016

-
31
Data source Time series derived from source
Executive Office of the President 2016
Nominal spending on marijuana 1988–2005, Marijuana costs per gram 1981–2005
Garner et al. 2018 Industry data used to calculate productivity 1987–2016
Giroldo and Hollenbeck 2020 Retail margins on state-permitted marijuana in Washington
Goldstein and Summer 2019 Marijuana costs per gram 2017–2018
IRS 1983 Marijuana costs per gram 1973–1974
Katzenbach 1967 Marijuana costs per gram 1965
Kilmer et al. 2019 Market share for state-permitted manufactured products 2014–2015, State-permitted marijuana concentrate prices 2014–2016
Jorgenson et al. 2016 Industry data used to calculate productivity 1948–1987
Lindgren and Grossman 2005 Marijuana costs per gram 1975–1980
Martin 2016 Historical data on state marijuana laws, used to estimate nominal spending on state-permitted marijuana 1996–2010
McVey 2016 State-permitted marijuana sales in California 2010
New York Times 1972 Survey data on marijuana use by college students 1967–1971
Patrick et al. 2020 Market share for unpermitted manufactured products 2016–2019
Orens et al. 2018 Share of state-permitted marijuana sold to nonresidents
Robinson et al. 2015 Qualitative data on marijuana exports 2016–2019
Soloveichik 2019 Retail margins on unpermitted marijuana imports
U.S. Department of Health and Human Services 1995 and 2005–2021
Count of marijuana users 1972–1987, Aggregate usage days for marijuana 2017–2019, State-level marijuana users in past month 2003–2019

32
Appendix B: Empirical Assumptions Made
Series impacted Assumptions made
Aggregate GDI and statistical discrepancy 1967–2019
Income earned by state-permitted marijuana cultivators is currently tracked in GDI but their output is not currently tracked in GDP
None Income earned by state-permitted marijuana manufacturers and state-
permitted marijuana retailers is currently tracked in GDI, and their output is currently tracked in GDP
Aggregate GDI and GDP 1967–2019
Income earned by unpermitted marijuana manufacturers is not currently tracked in GDI, and their output is not currently tracked is in GDP
None Cannabis with less than 0.3 percent THC is legal under federal law and it is therefore fully tracked in the existing national accounts
Marijuana spending 2017–2019
Users consume a fixed quantity of marijuana plant material each day they use marijuana
Marijuana spending 1967–1987 Users consume a fixed quantity of marijuana plant material each year
Marijuana spending 1967–1971 Overall usage of population tracks usage by college students
State-permitted marijuana 1996–2010
Medical marijuana spending is zero in states without state-permitted medical marijuana. In states with permitted medical marijuana, spending
tracks the count of patients if that is available. If patient count is not available, then spending tracks other state trends
State-permitted marijuana 1996–2019
Retail margins for both unprocessed flowers and manufactured products are fixed at 50 percent of retail prices
Unpermitted marijuana 1967–2019
Retail margins for domestical marijuana are fixed at 50 percent of retail prices. Retail margins for imported marijuana are fixed at 72 percent of retail prices
State-permitted and unpermitted marijuana 1967–2019
Manufacturers who buy unprocessed plant material pay no retail margins

Series impacted Assumptions made
Manufacturing output 1967–2019
In each year studied, the market share for manufactured marijuana products is the same for state-permitted marijuana and unpermitted marijuana
Unpermitted marijuana imports 2017–2019
The import share tracks the ratio of seizures at ports of entry to domestically cultivated plots which are destroyed
Unpermitted marijuana imports 1967–2007 Assumed to track the 2008 import share reported in Atkinson 2019
Unpermitted marijuana imports 1967–2019 Consist of unprocessed flowers or minimally processed oil
Unpermitted marijuana exports 2016–2019 Assumed to be growing gradually
Intermediate inputs to cultivation 1967–2019
Each gram of marijuana is assumed to require a fixed quantity of electricity and a fixed quantity of greenhouse space
Intermediate inputs to manufacturing 1967– 2019
Each gram of THC concentrate is assumed to require a fixed number of THC units from unprocessed plant material and a fixed amount of
manufacturing space
Intermediate inputs to retailing 1967–2019 Intermediate inputs to unpermitted marijuana are assumed to be minimal
GDI components 1967–2019
Income earned by unpermitted marijuana firms is assumed to be split 75 percent to proprietors’ income and 25 percent to employee
compensation. Taxes paid and capital income are both assumed to be minimal
Wholesale marijuana prices 1967–2019
Both import prices and domestically cultivated marijuana output prices are assumed to track retail prices for unprocessed flowers
Unprocessed flower potency 1967–1971 Assumed to be fixed at the 1972 level
Aggregate manufactured product price 2015–2019
Assumed to track cost per gram for state-permitted THC concentrate
33

Series impacted Assumptions made
Aggregate manufactured product price 1967–2014
Assumed to grow 20 percent slower per year than unprocessed flower prices for 2010–2014 and track unprocessed flower prices for 1967–2009
Intermediate input prices 1967–2019
Space rental costs and electricity costs track BEA’s consumer price for housing and electricity, prices for unprocessed plant material used in manufacturing track the retail price of unprocessed flowers
Price for misclassified state-permitted marijuana 1996–2019
Tracks BEA’s consumer price for other nondurable goods
Labor inputs for state-permitted marijuana 1996–2011
Total labor is extrapolated based on nominal industry revenue. Wages for medical marijuana and recreational marijuana workers are assumed to be the same
Labor inputs for unpermitted marijuana 1967–2019
Tracks a nationwide count of arrests for importing, cultivating, manufacturing, or selling marijuana. This nationwide count of arrests is adjusted to remove estimated arrests of foreign importers
Capital inputs for marijuana 1967–2019 So small that it can be ignored
Marijuana consumption by state 2003–2019 Assumed to be proportional to the number of users in the past month
Marijuana consumption by state 1967–2002
Tracks a regional count of arrests for marijuana production and a state count of arrests for drug crimes
Cross-state sales of state-permitted marijuana 1996–2019
Tracks the general pattern of cross-state credit card purchases
34