TRACKING EVERY STUDENT’S LEARNING EVERY YEAR 188.pdfimprovements in teacher quality, which makes...
58
WORKING PAPER 1 88 • March 2018 Public Accountability and Nudges: The Effect of an Information Intervention on the Responsiveness of Teacher Education Programs to External Ratings NATIONAL CENTER for ANALYSIS of LONGITUDINAL DATA in EDUCATION RESEARCH A program of research by the American Institutes for Research with Duke University, Northwestern University, Stanford University, University of Missouri-Columbia, University of Texas at Dallas, and University of Washington TRACKING EVERY STUDENT’S LEARNING EVERY YEAR Dan Goldhaber Cory Koedel
Transcript of TRACKING EVERY STUDENT’S LEARNING EVERY YEAR 188.pdfimprovements in teacher quality, which makes...

W O R K I N G P A P E R 1 8 8 • M a r c h 2 0 1 8
Public Accountability and Nudges:
The Effect of an Information Intervention on
the Responsiveness of Teacher Education Programs
to External Ratings
NATIONAL CENTER for ANALYSIS of LONGITUDINAL DATA in EDUCATION RESEARCH
A program of research by the American Institutes for Research with Duke University, Northwestern University, Stanford University, University of Missouri-Columbia, University of Texas at Dallas, and University of Washington
TRACKING EVERY STUDENT’S LEARNING EVERY YEAR
Dan Goldhaber Cory Koedel

Public Accountability and Nudges: The Effect of an Information Intervention on the Responsiveness of Teacher Education Programs to External Ratings
Dan Goldhaber
American Institutes for Research/CALDER
University of Washington
Cory Koedel
University of Missouri/CALDER

Contents
Acknowledgements…………………………………………………………………………....ii
Abstract.……………………………………………………………………………………….iii
1. Rating Teacher Education Programs….……………………………………………….1
2. Background on Public Accountability and the NCTQ TEP Ratings ………………….3
3. Data, Information Intervention, and Analytic Approach……………………………....6
4. Findings….………...………………………………………………………..………...15
5. Discussion..………...…………………………………………………………............19
6. Conclusion…………………………………………………………………………….22
References……………………………………………………………………….………........24
Tables & Figures.…………………………………………………………..............................33
Appendix A…………………………………………………………………………………...43
Appendix B……………………………………………………………………………………52
Appendix C……………………………………………………………………………………55

ii
Acknowledgements
We appreciate the generous financial support that was provided for this research by the Ewing Marion
Kauffman Foundation and by the National Center for the Analysis of Longitudinal Data in Education
Research (CALDER), which is funded by a consortium of foundations. For more information about the
foundations supporting CALDER, see https://caldercenter.org/about-calder. The views expressed are
those of the author(s) and do not necessarily reflect those of the foundations or the institutions to
which the author(s) are affiliated. This research was made possible by excellent research assistance
from Stephanie Liddle and Malcolm Wolff. We also thank the National Council on Teacher Quality
(NCTQ) for data access and feedback. We are particularly indebted to Rob Rickenbrode for his assistance
in answering numerous questions about the NCTQ data throughout the project, and Cap Peck for
comments on an earlier draft. Any and all errors are solely attributed to the authors.
CALDER working papers have not undergone final formal review and should be cited as working papers.
They are intended to encourage discussion and suggestions for revision before final publication. Any
opinions, findings, and conclusions expressed in these papers are those of the authors and do not
necessarily reflect the views of our funders.
CALDER • American Institutes for Research
1000 Thomas Jefferson Street N.W., Washington, D.C. 20007
202-403-5796 • www.caldercenter.org

iii
The Effect of an Information Intervention on the Responsiveness of Teacher Education Programs to External Ratings Dan Goldhaber, Cory Koedel CALDER Working Paper No. 188 March 2018
Abstract
In the summer of 2013, the National Council on Teacher Quality (NCTQ) issued public, highly-visible
ratings of teacher education programs as part of their ambitious and controversial Teacher Prep Review.
We provide the first empirical examination of NCTQ ratings, beginning with a descriptive overview of the
ratings and documentation of how they evolved from 2013-2016, both in aggregate and for programs
with different characteristics. We also report on results from an information experiment built around
the initial ratings release. In the experiment we provided targeted information about specific
programmatic changes that would improve the rating for a randomly selected sample of elementary
teacher education programs. Average program ratings improved between 2013 and 2016, but we find
no evidence that the information intervention increased program responsiveness to NCTQ’s rating
effort. In fact, treated programs had lower ratings than the control group in 2016.
1
1. Rating Teacher Education Programs
Research shows that higher education institutions are impacted by and responsive to public ratings.
The prime example is college and university rankings published by U.S. News and World Report
(USNWR): changes in rankings have been shown to correspond to changes in admissions requirements,
financial aid disbursements, and other policies and investments under university control. This suggests that
public accountability of this form is a potentially powerful way to influence postsecondary institutions and
the students they produce.
In this paper we present research on external ratings of teacher education programs (TEPs)
produced by the National Council on Teacher Quality (NCTQ) and published in USNWR, including the
evaluation of a novel experiment providing information to TEPs about how to improve their ratings.
Understanding if and how TEPs respond to this type of public accountability is of great policy importance
as a large research literature shows teacher quality is the most important schooling input influencing student
outcomes (e.g., see Chetty, Friedman, & Rockoff, 2014; Goldhaber, D., Brewer, D., & Anderson, D. 1999;
Jackson, forthcoming; Kraft, forthcoming; Hanushek & Rivkin, 2010; Nye, Konstantopoulos, & Hedges,
2004). TEPs have received a great deal of research and policy attention as a potential driver of
improvements in teacher quality, which makes sense given the significant role they potentially play in
influencing new entrants to the labor market.1
Public ratings of some types of university programs, like law and medical schools, go back
decades, but the rating and ranking of TEPs by external organizations is new. In 2013, NCTQ, in
collaboration with USNWR, published the Teacher Prep Review with ratings of nearly 1,700 TEPs housed
1 Much of this attention presents TEPs in an unflattering light. For instance, former U.S. Education Secretary Arne
Duncan indicates that “by almost any standard, many if not most of the nation's 1,450 schools, colleges and
departments of education are doing a mediocre job of preparing teachers for the realities of the 21st century
classroom” (U.S. Department of Education, 2009, n.p.). For other critiques questioning the quality control of teacher
education institutions, and, in some cases, the value of teacher training, see Ballou and Podgursky (2000), Cochran‐Smith and and Zeichner (2005), Crowe (2010), Greenberg, McKee, and Walsh (2013), Levine (2006), and Vergari
and Hess (2002).

2
in over 800 higher education institutions.2 The TEPs covered by the Review prepare teachers at the
elementary and secondary levels, grant bachelor’s and graduate degrees, and are in every state. Subsequent
ratings/rankings were released by NCTQ in June of 2014 and December of 2016 as part of NCTQ’s ongoing
effort to rate TEPs nationally.
The NCTQ ratings have been controversial: some argue they provide useful information to
policymakers and potential program enrollees (Duncan, 2016; Startz, 2016; Resmovits, 2013), while others
believe that they are not related to factors that affect the production of high-quality teacher candidates
(Henry & Bastian, 2015) and can be harmful to the institutions (e.g. Fuller, 2014; Darling-Hammond, 2013).
This debate remains unresolved and will likely continue as such for some time. Our interest is in the theory
of action underlying the effort to rate and disseminate information about TEPs. Namely, do public, highly-
visible ratings prompt TEPs to respond to the rating criteria? There are several reasons to expect a response.
First, TEPs may feel compelled to respond if they view high ratings as useful for attracting students (Alter
and Reback, 2014; Meyer, Hanson and Hickman, 2017). Second, there may be indirect effects, such as
pressure TEPs might feel from elected officials or if potential employers of their students consider the
ratings in making hiring decisions. Finally, the information revealed by the ratings process itself could
induce TEPs to make changes to their practices; information about what are the common practices amongst
peer institutions could, for instance, influence program decisions.
We begin our analysis with a descriptive overview of NCTQ ratings, and rating changes, from 2013
to 2016, focused on elementary undergraduate and graduate TEPs.3 Ratings increased modestly on average
between 2013 and 2014, and again between 2014 and 2016, on the order of about 10 percent of a standard
deviation per period. We also document the relationships between various characteristics of TEPs and their
NTCQ ratings, and changes to their NCTQ ratings, over time. Observable characteristics explain a non-
2 For a review of other recent teacher preparation accountability initiatives, see Goldhaber, Krieg, and Theobald
(2013). 3 We do not present descriptive results for secondary TEPs for brevity, but the results are qualitatively similar to
what we show for elementary programs and available from the authors upon request.

3
negligible fraction of the cross-sectional variance in programs’ ratings – roughly 30 to 50 percent depending
on whether state fixed effects are included – but are much less predictive of ratings growth over time.
In addition to our descriptive analysis of the ratings, we report on results from an experiment to
determine whether the provision of targeted information to programs about how to improve their NCTQ
ratings affects the likelihood of improvement. The experiment, which also focused on elementary programs,
is designed to test the hypothesis that program responsiveness is hindered by a lack of knowledge about
how to respond. Specifically, we were granted access to NCTQ’s database and confidential parameters of
the scoring system, which we used to generate individualized recommendations for TEPs. The
recommendations were sent to education school deans (copying university presidents) via email one month
after the initial ratings release in June of 2013. Each recommendation suggested a specific programmatic
change that would result in a higher rating for the TEP, selected based on the TEP’s current practice and
how programmatic changes map to rating changes in NCTQ’s scoring system (we discuss the specifics of
the intervention in more detail below). In addition to providing information about how to improve, our
information intervention can be viewed more broadly as a “nudge” for programs to become more engaged
with the NCTQ rating effort. NCTQ was aware of the experiment being conducted, but had no direct role
in the experiment itself and no knowledge of which programs were in the treatment and control conditions.
We find that the experimental intervention did not lead to rating improvements for TEPs, either in
2014 or 2016. In fact, it had a negative effect on program ratings in 2016. In the discussion section we
consider several possible explanations for these results.
2. Background on Public Accountability and the NCTQ TEP Ratings
Public accountability, whereby information about an entity is made broadly available to the public,
has long been a tool used in the oversight of public institutions (Bovens, 2005; Ranson, 2003; Romzek,
2000). In the case of colleges and universities, states have historically served as information providers
(McLendon, 2003; Zumeta & Kinne, 2011). Ratings and rankings of specific college and university
4
programs have also been a mainstay of newsmagazines like USNWR and Newsweek.4 There is much
academic and policy debate over the quality of the ratings and whether they are good or bad for institutional
operations, efficiency, and the public (e.g. Clark, 2007; McDonough et al., 1998; Rapoport, 1999).
Regardless of whether ratings are ultimately good or bad, there is a significant amount of evidence
showing that colleges and universities respond to ratings. Competition between institutions has been shown
to lead to changes in admissions outcomes including average SAT scores for incoming freshmen, the
admissions rate, pricing, and the distribution of financial aid (Monks and Ehrenberg 1999; Ehrenberg 2003;
Meredith 2004). This institutional responsiveness is unsurprising given evidence that students (consumers)
directly respond to ratings in their application behaviors (Alter & Reback, 2014, Luca & Smith, 2013) and,
moreover, ratings may also affect outcomes such as charitable donations and faculty recruitment.
Although much of the evidence in the literature focuses on undergraduates, graduate programs have
also been shown to be affected by ratings. In a study of law schools, Sauder and Lancaster (2006) find that
USNWR rankings impact both admissions decisions by the schools and application and enrollment
decisions by prospective students. Unsurprisingly, law schools with higher rankings receive more
applicants, the average LSAT score of those applicants is higher, and they matriculate more students.
Sauder and Lancaster (2006) conclude that rankings become “self-fulfilling” prophecies for schools
because of a feedback mechanism. Prospective students respond to the rankings, compounding any changes
the institutions may make.
The June-2013 release of the Teacher Prep Review by NCTQ is the first large-scale, cross-state
publication of TEP ratings.5 NCTQ aimed to rate every TEP in the United States with at least 20 graduates,
and although they were unable to rate all programs on all of their standards, for a large group of programs
they produced comprehensive ratings that were published in USNWR. The ratings applied at the program
4 USNWR ratings of colleges and universities, which date back to 1983, are the longest standing version of this type
of newsmagazine ratings (McDonough, Lising, Walpole, & Perez, 1998). 5 TEPs are accredited by state, and, in some cases, national accrediting bodies. In addition, estimates of the
effectiveness of TEP graduates have been estimated for some states (e.g. Goldhaber et al., 2013; Koedel et al., 2015;
Ronfeldt and Campbell, 2016; von Hippel et al., 2016).

5
level, where multiple “programs” can be housed within one “institution.” For instance, the University of
Washington-Seattle operates three programs that are separately rated by NCTQ (a graduate elementary,
graduate secondary, and graduate special education program).
The NCTQ rating criteria are based on judgments about how TEP practices translate into the
production of high-quality teacher candidates. Information was collected to inform the initial ratings
beginning in spring 2011 when The Review was announced.6 For elementary education programs, the initial
2013 rubric included 18 standards that were individually scored. Five “core” standards were used in a
weighted formula to determine programs’ published ratings: Selection Criteria, Early Reading, Elementary
Mathematics, Elementary Content, and Student Teaching. Information about the purpose of and metrics
used to judge all of the core standards is provided in Appendix B, and even more detailed information is
available directly from NCTQ.7
Based on the information NCTQ collected, each standard was scored on a scale of 0 to 4.8 In 2013
aggregate ratings were prominently published in USNWR using a star-based display (i.e., 0-4 stars) for
programs for which all five core standards could be scored. The 2013 USNWR June publication ultimately
included aggregate ratings for almost 600 graduate and undergraduate elementary programs. It also
included an invitation for TEPs to appeal their ratings, which were subsequently revised in a report
published in December 2013. Sixty-six programs elected to appeal their ratings.9
Figure 1 provides a timeline for NCTQ activities and dates of Teacher Prep Review publications.
The 2014 publication, also released in June, was very similar to the 2013 publication. The two most notable
changes are (a) NCTQ collected more information from programs between reviews and was thus able to
6 NCTQ collected publicly available information about TEP practices and requested documents from institutions of
higher education. As noted above the NCTQ rating was not without controversy and some programs rejected their
request for information. In some cases the information was obtained after legal action (NCTQ pp. 78, 2013). 7 Further details about the specific ways that TEPs were judged on these standards can be found at
https://www.nctq.org/review/how. Comprehensive information on the standards and why they were chosen are
available at: http://www.nctq.org/dmsView/GeneralMethodology. (information retrieved 12.08.2017) 8 Additionally, a small number of TEPs (151) were designated as having a “strong design” for particular components
(NCTQ, pp. 39-55, 2013). 9 In total, the 2013 Teacher Prep Review covered 2,420 undergraduate and graduate (and elementary and secondary)
TEPs housed in 1,130 higher education institutions. This represents 99% percent of the 1,441 college and university-
based IHEs producing teacher candidates in 2013 (NCTQ, pp. 67-68, 2013).

6
rate more of them on more standards, and (b) in terms of presentation, the 2014 Review converted the
published ratings for each TEP to a national ranking, which was again published in USNWR.10
Between 2014 and 2016, NCTQ further broadened the scope of the evaluation given that they had
more time to rate more programs. They also revised the scoring methodology for some standards. With
respect to the elementary programs that are the focus of our study, there were changes to the scoring
methodology for the Elementary Content and Selection Criteria standards. As we show below, the
methodological changes to these standards resulted in a modest increase in the average rating for 2016
relative to what would have been seen under the methodology used in previous years.
3. Data, Information Intervention, and Analytic Approach
3.1 Data and Measures
We utilize multiple sources of data to examine NCTQ ratings and assess the effect of the
information experiment. First, we were granted broad access to the underlying database NCTQ constructed
to rate programs, as well as the rating formula. We focus on elementary education programs with published
ratings in USNWR. Our sample of programs with published ratings in 2013 is 582 (427 undergraduate; 155
graduate).11 In 2014 and 2016, 780 (585 undergraduate; 195 graduate) and 911 (727 undergraduate; 184
graduate) elementary programs received aggregate ratings, respectively, as NCTQ expanded its rating
capacity over time.
We provide descriptive statistics for all fully-rated programs in 2013, 2014, and 2016 in Table 1.
The total rating for each program is the weighted sum of the standard scores on Selection Criteria, Early
Reading, Elementary Mathematics, Elementary Content, and Student Teaching. As noted above, there was
also a change in the methodology for scoring the Elementary Content and Selection Criteria standards in
10 2014 was the last year USNWR published NCTQ rankings. The most recent NCTQ ratings published by USNWR
can be found at https://www.usnews.com/education/nctq. 11 A total of 594 programs had their ratings published in 2013, but we exclude data from 12 public programs in
Wisconsin because of the nature of the data-sharing agreement between the state and NCTQ.

7
2016. We are able to calculate the 2016 rating for each program using the original scoring methodology
from 2013/2014, which we refer to as the “adjusted” 2016 rating. The adjusted rating is our preferred 2016
rating measure because it facilitates analytic consistency over the course of our data panel. The table shows
that the average program rating grew from 1.34 in 2013 to 1.50 in 2016 (using the adjusted 2016 ratings);
the average rating increased by about 10 percent of a standard deviation of the 2013 rating distribution in
each period.12
Tables 2 and 3 show complementary transition matrices documenting rating changes from 2013-
2014 and 2013-2016 for programs that received an aggregate rating in the years relevant to the matrix (e.g.,
for the 2013-2016 transition matrix, a program must have a rating in both 2013 and 2016).13 Table 2 shows
that most programs did not have a categorical rating change between 2013 and 2014 (i.e., most programs
are on the diagonal), which is consistent with the small change in the average rating documented in Table
1. Specifically, 17% of programs experienced a rating increase, 9% experienced a decrease, and the
remaining programs did not experience a rating change.
Panel A of Table 3 shows the same information as Table 2, but for the period 2013-2016 using
programs’ unadjusted ratings. It is apparent that there were many more categorical changes over this period
and the changes are predominantly positive: 30% improve on their rating versus 8% that decline. Per above,
some of the changes in Panel A are the result of the scoring methodology change, so in Panel B of Table 3
we show rating transitions from 2013-2016 holding the methodology fixed as it was in the initial 2013
Teacher Prep Review. This allows us to isolate rating changes that solely reflect programmatic changes.
The results in Panel B imply more modest improvement: categorical ratings improved for 26% of programs
and declined for 14%.14
12 These changes could in principle be driven by ratings growth within programs, or by compositional changes in the
sample of rated programs over time. Ratings growth is the driving factor, though: the average improvement for
programs that remain in the sample across years is the same as for all programs. 13 Undergraduate and graduate programs are combined in the matrices. 14 Average improvement from 2013 to 2016 using the actual NCTQ ratings is 0.27 points, whereas average
improvement using the adjusted ratings is 0.16 points.

8
We merge the NCTQ ratings data with data from four other sources. The first two sources, the
Integrated Postsecondary Education Data System (IPEDS) and national Title II data, allow us to examine
how TEP ratings, and changes to the ratings over time, are associated with a variety of institutional
characteristics. IPEDS covers most colleges and universities in the United States (programs that participate
in federal student aid programs are required to participate) and includes detailed institutional information
ranging from demographics to finances to competitiveness. The Title II data are available under the Higher
Education Opportunity Act (HEOA) of 2008, which requires that every state teacher certification and
licensure program receiving federal assistance report annually to the state and general public on numerous
aspects of their program, including enrollment and completion rates.
The third and fourth sources of data are the NCES Common Core of Data (CCD) and Labor Market
Area (LMA) data from the Bureau of Labor Statistics (BLS). The CCD is a comprehensive annual database
of all public elementary and secondary schools in the nation. It includes enrollment and geographic
information for all traditional and charter schools, which we use in combination with the BLS data to
construct measures of local-area labor market conditions for each TEP. Specifically, by matching each TEP
with its housing LMA, we can calculate (a) the proportion of TEP completers in a LMA coming from a
particular program as a measure of local-area competition in the production of teaching candidates, and (b)
the proportion of K-12 students in a LMA enrolled in charter schools to examine how possible differences
in the nature of demand for TEP candidates along this dimension are related to NCTQ ratings and rating
changes.15
15 The supply-side competition measure is created by matching TEP completion rates in the Title II data to their
encompassing county using state and county Federal Information Processing Standards (FIPS) codes, linking these
FIPS codes to LMAs using the BLS data, and then calculating the proportion of completers in an LMA coming from
each TEP. We create the local-area charter school share by attaching the NCES CCD, which contains the total K-12
public enrollment for traditional and charter schools, to the master dataset by county FIPS code.
9
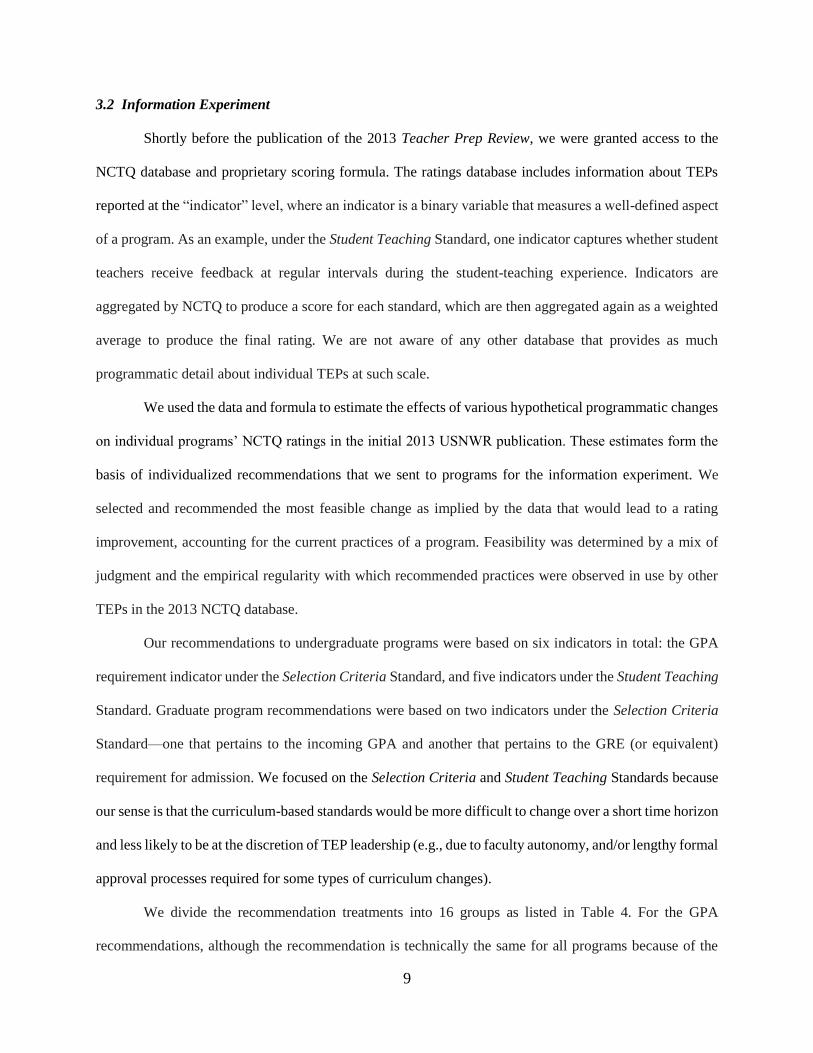
3.2 Information Experiment
Shortly before the publication of the 2013 Teacher Prep Review, we were granted access to the
NCTQ database and proprietary scoring formula. The ratings database includes information about TEPs
reported at the “indicator” level, where an indicator is a binary variable that measures a well-defined aspect
of a program. As an example, under the Student Teaching Standard, one indicator captures whether student
teachers receive feedback at regular intervals during the student-teaching experience. Indicators are
aggregated by NCTQ to produce a score for each standard, which are then aggregated again as a weighted
average to produce the final rating. We are not aware of any other database that provides as much
programmatic detail about individual TEPs at such scale.
We used the data and formula to estimate the effects of various hypothetical programmatic changes
on individual programs’ NCTQ ratings in the initial 2013 USNWR publication. These estimates form the
basis of individualized recommendations that we sent to programs for the information experiment. We
selected and recommended the most feasible change as implied by the data that would lead to a rating
improvement, accounting for the current practices of a program. Feasibility was determined by a mix of
judgment and the empirical regularity with which recommended practices were observed in use by other
TEPs in the 2013 NCTQ database.
Our recommendations to undergraduate programs were based on six indicators in total: the GPA
requirement indicator under the Selection Criteria Standard, and five indicators under the Student Teaching
Standard. Graduate program recommendations were based on two indicators under the Selection Criteria
Standard—one that pertains to the incoming GPA and another that pertains to the GRE (or equivalent)
requirement for admission. We focused on the Selection Criteria and Student Teaching Standards because
our sense is that the curriculum-based standards would be more difficult to change over a short time horizon
and less likely to be at the discretion of TEP leadership (e.g., due to faculty autonomy, and/or lengthy formal
approval processes required for some types of curriculum changes).
We divide the recommendation treatments into 16 groups as listed in Table 4. For the GPA
recommendations, although the recommendation is technically the same for all programs because of the

10
way the NCTQ formula works (a 3.0 GPA requirement ensures a full score on the Selection Criteria
Standard), we differentiate programs based on their current-practice GPA requirement when assessing the
feasibility of a change. For example, a change to meet the 3.0 GPA indicator was deemed more feasible for
programs with required GPAs very close to but below 3.0 than for programs with GPA requirements far
below 3.0, or no GPA requirement at all.
The recommendation numbers in Table 4 preceded by a “U” are for undergraduate programs and
the numbers preceded by a “G” are for graduate programs. The recommendations were prioritized in the
order they are listed in the table, within level (i.e., undergraduate and graduate), by the process described
in Appendix A. As an example, consider an undergraduate program with a required GPA of 2.9 (i.e., close
to 3.0). This program would meet the condition for the first recommendation and would thus be assigned
to that group; in contrast, for a program with a required GPA of 2.0, we first cycled through the student
teaching recommendations, and only if recommendation numbers U2-U7 did not fit (e.g., if the program
already had a top score on the student-teaching standard) did we return back to a GPA-based
recommendation with recommendation U8. Our process is designed to give programs feasible
recommendations while at the same time generating heterogeneity between selectivity and student-teaching
recommendations, between which we did not have a strong prior about which type of recommendation
would be more actionable. Finally, Table 4 shows that the vast majority of programs received a
recommendation to change a single practice, but a handful received multiple suggestions (see treatment
number U7 in particular, and also numbers U10-U12). Both suggestions for the primary multiple-
recommendation treatment, number U7, are for practices that were fairly common among programs in the
NCTQ database (per Appendix A).16
16 We weakly prioritized recommendations that included just one suggestion, with the exception of number U7,
which we put above the “large change” GPA recommendations to achieve better diversity between Selection
Criteria and Student Teaching recommendations in the experiment. Both practices suggested by treatment U7 are
fairly common. The other multiple-suggestion treatments (U10-U12) were given lower priority because they include
suggestions for less common changes (see Appendix Table A.1); these treatment groups are negligible in size.

11
Appendix A explains the process of assigning the recommendations in greater detail and provides
an example of a letter detailing the recommendations, but in simple terms, our recommendations aim to
identify “low-hanging fruit” with regard to how programs could act to improve their NCTQ ratings.
Programs in the control group—i.e., those that did not receive a tailored recommendation—had
access to public information provided by NCTQ on how programs were evaluated. NCTQ publicly
identifies the core standards used to obtain an overall rating, and provides general documentation on how
each standard is scored.17 Our recommendations to the treatment group are based on the broad rating criteria
made widely available by NCTQ, but they also include some information that TEP administrators did not
have. First, because we were granted access to the proprietary NCTQ formula, we were able to provide
precise information about programmatic changes that would raise the rating for individual programs. In
contrast, a typical TEP administrator without the formula could look up the general criteria, but she would
not know which specific changes would lead to a change in the rating due to discontinuities in the function
that maps the underlying indicators into the summative rating. Per the discussion in Appendix A, we also
used information about the full distributions of indicator ratings to inform our individualized
recommendations – e.g., our student-teaching recommendations are informed by how commonly each
indicator is satisfied in the full sample of TEPs. Finally, the NCTQ rating process is complex and their
published literature on the rating methodology could be overwhelming to TEP administrators. Our letters
pinpoint a precise action that can be taken and indicate exactly how this action will lead to an increase in
the program’s NCTQ rating.
To administer the recommendations, we first assigned each TEP to a recommendation group, and
then randomly selected half of the programs within each recommendation group to the treatment condition.
We do not have a way to comprehensively track whether the email letters we sent were read, but we received
a good deal of feedback about the letters, suggesting that they were not ignored. Helping this is that the
17 To view information on each of the standards see https://www.nctq.org/review/standards#.

12
time when we sent the letters – the last week of July 2013 – was in close proximity to when the inaugural
Teacher Prep Review was published in USNWR.
Our experimental sample of TEPs consists of 486 undergraduate and graduate elementary
programs. The experimental sample is smaller than the full sample of rated undergraduate and graduate
programs in 2013 for two reasons. The most important is that to avoid confounding treatments within
universities, we included just one program per institution in the experiment – i.e., institutions that house
both graduate and undergraduate elementary programs could receive a recommendation for just one
program. The other program was dropped from our experimental sample prior to randomization. We chose
to prioritize undergraduate programs, which means that we omitted all graduate programs at institutions
where an undergraduate program was also present. The second reason for a program’s exclusion is that for
a small number of programs, no reasonably simple recommendation within the standards we consider was
available to raise the rating conditional on current practices. All such programs were excluded prior to
randomization as well.
The experimental sample decreases in 2014 and 2016 by 9 and 93 programs, respectively. This is
due in small part to program closures and/or reclassifications (i.e. a program changed from having an
undergraduate to graduate focus or vice versa), which account for 9 programs in 2014 and 14 programs in
2016. The reason for the bigger drop in 2016 is that a large number of programs, 79, have not yet been rated
by NCTQ because they sent in additional information and the ratings are still in-progress. As we show
below, there is no evidence that attrition from the experimental sample is related to treatment and thus no
reason to expect the presence of these yet unrated programs to influence our experimental findings.
Table 5 shows descriptive statistics for the programs in the experiment compared to all elementary
programs, and additionally compares the treatment and control groups. Of the 19 institutional characteristics
reported on in the table, three are statistically different at the 0.10 level between treatments and controls.
This is in the range of what would be expected by chance given that the characteristics are not independent,
and overall we do not find differences between the treatment and control programs when testing the

13
variables jointly.18 Correspondingly, our regression estimates of experimental treatment impacts reported
below are qualitatively insensitive to the inclusion of various program characteristics and state fixed effects.
3.3 Analytic Approach
For the descriptive portion of the analysis we estimate regressions linking NCTQ ratings, and rating
growth, to program characteristics. These regressions take the following form:
𝑌𝑗𝑠𝑡 = 𝛽0 + 𝑿𝒋𝒔𝒕𝜷 + 𝛿𝑠 + 𝜖𝑗𝑠𝑡 (1)
In Equation (1), 𝑌𝑗𝑠𝑡 is a rating for program j in state s in year t. We use the continuous final rating variable
on a 4-point scale, which is available to us in NCTQ’s database, to maximize statistical power. The vector
𝑿𝒋𝒔𝒕 includes program j’s institutional and local-area characteristics as shown in Table 1. In models of rating
growth, 𝑿𝒋𝒔𝒕 also includes the 2013 NCTQ rating (i.e., we examine rating growth from 2013-2014 and
2013-2016). 𝛿𝑠 is a state fixed effect and 𝜖𝑗𝑠𝑡 is the error term, clustered at the state level to account for
within-state interdependence.19 Although the estimates from Equation (1) should not be interpreted
causally, they are useful for contextualizing NCTQ ratings of TEPs in terms of both levels and growth.
Next, for the experiment, we separately regress ratings in 2014 and 2016 on an indicator variable
for the recommendation condition and treatment status. We also include program characteristics from 2013
and state fixed effects in the full specification, which is as follows:
𝑌𝑗𝑠𝑡 = 𝛾0 + 𝑹𝒋𝒔𝜸1 + 𝑇𝑗𝑠𝛾2 + 𝑿𝒋𝒔𝟏𝜸𝟑 + 𝜃𝑠 + 𝑢𝑗𝑠𝑡 (2)
In Equation (2), is again the program rating. 𝑹𝒋𝒔 is a vector of recommendation indicators and is
an indicator for whether the program was treated with a letter. 𝑿𝒋𝒔𝟏 includes the same set of program
characteristics as in Equation (1) based on 2013 data (prior to treatment), and the 2013 NCTQ rating. 𝜃𝑠 is
a state fixed effect and 𝜇𝑗𝑠𝑡 is the error term. 𝛾2 captures the effect of receiving a recommendation letter on
18 We test the variables jointly using Seemingly Unrelated Regressions (SUR) and find no statistical evidence of
imbalance (p = 0.59). 19 A rationale for state clustering is that state-level regulations affect TEP programming which could induce a
correlation between NCTQ ratings within a state.
jstY jsT

14
the final rating and reflects a weighted average of recommendation-specific effects. Our study is only
powered to estimate the impact across all recommendation conditions with reasonable precision.20
In terms of outcomes, the lead specifications define 𝑌𝑗𝑠𝑡 as simply the program rating in either 2014
or 2016. Again, we use the adjusted version of the 2016 rating where the Selection Criteria and Elementary
Content standards are judged based on NCTQ’s 2013/2014 scoring methodology to isolate rating changes
that reflect programmatic changes. In addition, to more narrowly isolate experimental impacts, we also
estimate models on a modified rating outcome that only depends on the two focal standards of the
recommendation letters: Selection Criteria and Student Teaching.21 We prefer the models of “total rating”
effects because they allow for the possibility that our recommendation intervention had effects outside of
the focal standards. This fits with the idea that our letters can be described as a general “nudge” for programs
to pay better attention to their NCTQ ratings, in which case they could lead to programmatic changes outside
of the ones recommended directly.
Finally, we also asked NCTQ to track TEP-initiated inquiries for one month after our intervention
(during August, 2013). NCTQ was not provided any information about which programs received letters in
the experiment to avoid the possibility of contamination of these outcome measures. We use NCTQ’s
correspondence log to examine the impact of treatment on the likelihood of engaging with NCTQ about the
rating within the first month after we sent our letters, regardless of whether a rating change occurred.
20 That said, with caveats we present results from models that subdivide the recommendations into broad categories
in the discussion section. We have also estimated versions of the model that allow for effects specific to each
recommendation, but the lack of statistical power and proliferation of hypothesis tests limits inference. Some of the
recommendation subgroups involve very small samples per Table 4. 21 In these models we replace the 2013 NCTQ summative rating lag with a weighted average of the 2013 Student
Teaching and Selection Criteria scores.

15
4. Findings
4.1 Descriptive Results
Table 6 shows how 2013, 2014, and 2016 NCTQ rating levels are associated with observable TEP
characteristics, with and without state fixed effects. The table reports correlations for all elementary
education programs (undergraduate and graduate) with aggregate ratings in 2013 (columns 1 and 2), 2014
(columns 3 and 4), and 2016 (columns 5 and 6), respectively. As with Table 1, sample composition changes
over time occur due to both the expansion of coverage of TEPs by NCTQ in later years and the removal of
some programs from the ratings database. To explore the implications of the changes to the sample,
Appendix Table C.1 reports results from an analogous set of regressions using a fixed sample of programs
with ratings in all three years. The results in Table 6 and Appendix Table C.1 are very similar, indicating
that sample composition changes have little bearing on the findings.22
We can explain a significant share of the variation in ratings with program characteristics (31-38%
across years in specifications without state fixed effects and 44-50% inclusive of the state fixed effects),
driven by the explanatory power of a few key variables as shown in Table 6. Both average tuition and
college entrance exam scores are strongly positively associated with NCTQ ratings in all specifications.23
A 100-point increase in the median SAT of the housing university (or approximately a 2-point increase in
the housing university’s ACT) is associated with an increase of 0.2-0.3 NCTQ rating points, which is
roughly 0.4 standard deviations. A $1,000 increase in average undergraduate tuition is associated with a
0.01 to 0.02 increase in rating points, or approximately 0.01-0.03 standard deviations.
Other consistent findings include that graduate programs fair worse on NCTQ ratings, receiving
0.15 to 0.65 fewer rating points than undergraduate programs on average, and private institutions are also
22 In results omitted for brevity we also estimate models that predict TEP attrition from the NCTQ database between
2013-2014 and 2013-2016. There are no consistent predictors of attrition. 23 Median standardized test scores are calculated by a composite of SAT and ACT scores of admitted students. If the
university accepts ACT scores, we convert ACT scores to their SAT equivalent using the College Board SAT and
ACT concordance tables (College Board, 2009).

16
rated lower. This is especially true of for-profit private institutions—controlling for state fixed effects,
private for-profit institutions receive ratings that are 0.05 to 0.26 rating points, or 0.07 to 0.35 standard
deviations, lower than their public counterparts. Private not-for-profit institutions also have lower ratings
all else equal, but the large standard errors limit inference.
One hypothesis we had going into the study is that programs that face less local competition from
other TEPs would rate lower on the NCTQ standards because they face weaker incentives.24 There is little
evidence that this is the case. Likewise, we see little evidence that TEPs have differential NCTQ ratings
depending on if they serve a larger or smaller charter school market.
Table 7 shows analogous results for ratings growth from 2013-2014 and 2013-2016 (i.e., the 2013
NCTQ rating is included as a control in these models). To be included in the growth analysis in either 2014
or 2016, a program must have a 2013 rating and a rating for the relevant subsequent year (we show
analogous fixed-sample estimates for programs with ratings in all three years in Appendix Table C.2 and
the results are qualitatively similar). Table 7 shows that the relationships between TEP characteristics and
ratings growth are weaker and less consistent than the relationships for rating levels.
Finally, one of the arguments for NCTQ’s rating effort is that the ratings will help drive the TEP
market to compete on quality (as judged by NCTQ ratings): school systems will seek out teacher candidates
from highly rated programs and prospective teacher candidates will seek to enroll in more highly rated
programs. In results omitted for brevity, we explore this hypothesis descriptively by estimating several
modified versions of Equation (1) where the dependent variable is the log of enrollment in each TEP in
2015 as a function of the 2013 rating, conditional on 2013 enrollment (note that the findings from these
models are merely descriptive and not causal). We do see a positive point estimate for the association
between initial ratings and 2015 enrollment, but it is not statistically significant and is estimated
imprecisely. To be more specific, we cannot rule out (with 95 percent confidence) a positive association as
24 A significant amount of research suggests that TEPs tend to provide teachers to the local labor market, i.e., there
is a high-likelihood that teacher candidates end up employed in school districts that are quite close to the TEPs they
attended (Goldhaber et al., 2014; Killeen et al., 2015; Reininger, 2012).

17
large as 8 percent enrollment growth associated with a one-point increase in a program’s NCTQ rating; nor
can we rule out modest-sized negative associations (see Appendix Table C.3).
4.2 The Information Experiment
Next we turn to the results from the information experiment. As discussed previously, not all
programs with 2013 ratings and involved in the experiment were rated again in 2014 and 2016. The primary
reason for sample attrition, which was large in 2016, is that some programs have not yet been rated because
they have sent NCTQ additional information and the rating is in-progress. A concern is that these programs
would receive systematically different ratings, in which case a correlation between sample attrition and the
information treatment could induce sample selection bias that would contaminate our experimental results.
We test whether our intervention influenced sample attrition by estimating variants of Equation (2)
on the full experimental sample, where we specify the dependent variable as a binary indicator for whether
the program received an aggregate NCTQ rating in either 2014 or 2016. The sample attrition regressions
are estimated as linear probability models and the results are reported in Table 8. There is no indication that
attrition from the sample is related to the information intervention, which gives us confidence that this issue
will not cause bias in our experimental estimates of rating effects.
Table 9 shows the effects of the information experiment on ratings in 2014 and 2016 among rated
programs in those years. We begin with sparse models that do not have any controls outside of the 2013
baseline rating, and subsequently build up to the model that includes detailed university controls (columns
2 and 5) and state fixed effects (columns 3 and 6). In 2014 across all specifications, the estimates are small
and not statistically significant. The treatment effect is unexpectedly negative and statistically significant
in 2016. That is, treated programs have lower ratings growth from 2013 to 2016 than those in the control
condition. The point estimates imply a relative decrease of 0.13-0.15 rating points across specifications,
corresponding to roughly 22 percent of a standard deviation of the 2013 rating distribution. The
strengthening of the negative result from 2014 to 2016 may seem counterintuitive at first glance. However,
the pattern of estimates is not implausible given the evolution of NCTQ rating changes documented above.
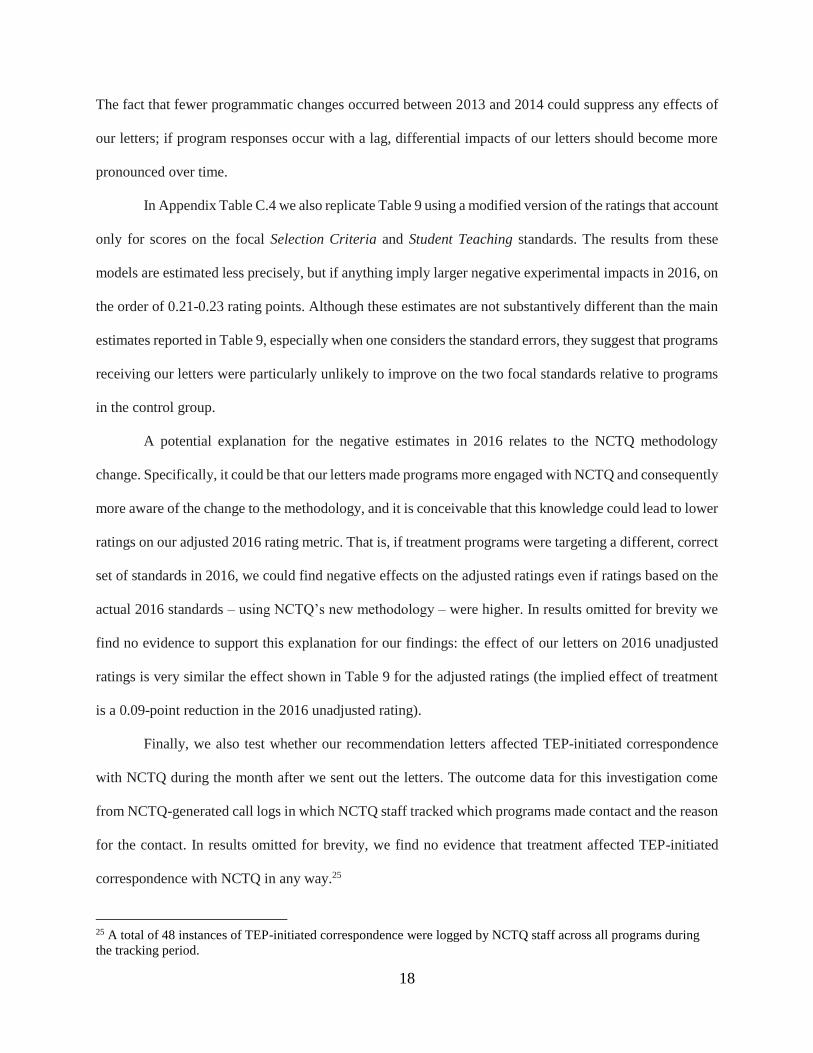
18
The fact that fewer programmatic changes occurred between 2013 and 2014 could suppress any effects of
our letters; if program responses occur with a lag, differential impacts of our letters should become more
pronounced over time.
In Appendix Table C.4 we also replicate Table 9 using a modified version of the ratings that account
only for scores on the focal Selection Criteria and Student Teaching standards. The results from these
models are estimated less precisely, but if anything imply larger negative experimental impacts in 2016, on
the order of 0.21-0.23 rating points. Although these estimates are not substantively different than the main
estimates reported in Table 9, especially when one considers the standard errors, they suggest that programs
receiving our letters were particularly unlikely to improve on the two focal standards relative to programs
in the control group.
A potential explanation for the negative estimates in 2016 relates to the NCTQ methodology
change. Specifically, it could be that our letters made programs more engaged with NCTQ and consequently
more aware of the change to the methodology, and it is conceivable that this knowledge could lead to lower
ratings on our adjusted 2016 rating metric. That is, if treatment programs were targeting a different, correct
set of standards in 2016, we could find negative effects on the adjusted ratings even if ratings based on the
actual 2016 standards – using NCTQ’s new methodology – were higher. In results omitted for brevity we
find no evidence to support this explanation for our findings: the effect of our letters on 2016 unadjusted
ratings is very similar the effect shown in Table 9 for the adjusted ratings (the implied effect of treatment
is a 0.09-point reduction in the 2016 unadjusted rating).
Finally, we also test whether our recommendation letters affected TEP-initiated correspondence
with NCTQ during the month after we sent out the letters. The outcome data for this investigation come
from NCTQ-generated call logs in which NCTQ staff tracked which programs made contact and the reason
for the contact. In results omitted for brevity, we find no evidence that treatment affected TEP-initiated
correspondence with NCTQ in any way.25
25 A total of 48 instances of TEP-initiated correspondence were logged by NCTQ staff across all programs during
the tracking period.

19
5. Discussion
Among programs that did not respond to NCTQ’s rating intervention, one hypothesis is that they
lacked information about how to respond. Our experimental intervention is designed to test this hypothesis
by providing individualized recommendations to TEPs about specific programmatic changes that can
improve their ratings. Our results show that the information we provided did not induce a positive response
from TEPs, and in fact induced a negative response. This suggests that a lack information is not an
explanation for program non-response to the NCTQ rating effort, and moreover, that our additional
interaction with TEPs may have adversely affected their engagement. These findings are not what we
expected and here we consider possible explanations. We discuss the negative effect of our letters at the
end of this section, which is not easy to explain, but first discuss the implications of our findings being non-
positive.
One reason programs may not have responded positively to our letters is that the recommendations
we provided were not useful, perhaps because they were not as feasible as we originally believed. For
example, with respect to the GPA-based recommendations, TEPs may resist even small upward movements
in the minimum GPA if there is concern about losing students. Corroborating the feasibility concern is that
just 9.4 percent of undergraduate programs had a 3.0-minimum GPA requirement as of 2013 (see Appendix
A).
To examine the “GPA rigidity” explanation empirically, we re-estimate our experimental
regressions excluding all undergraduate TEPs that received a GPA recommendation. Thus, only graduate
programs, and undergraduate programs that were assigned a pre-randomization student-teaching
recommendation, are included in the regressions. Note that (a) a much larger fraction of graduate programs
met the 3.0 GPA requirement than undergraduate programs in 2013 (see Appendix A), suggesting greater
feasibility, and (b) several of the undergraduate student-teaching indicators were widely adopted by TEPs
20
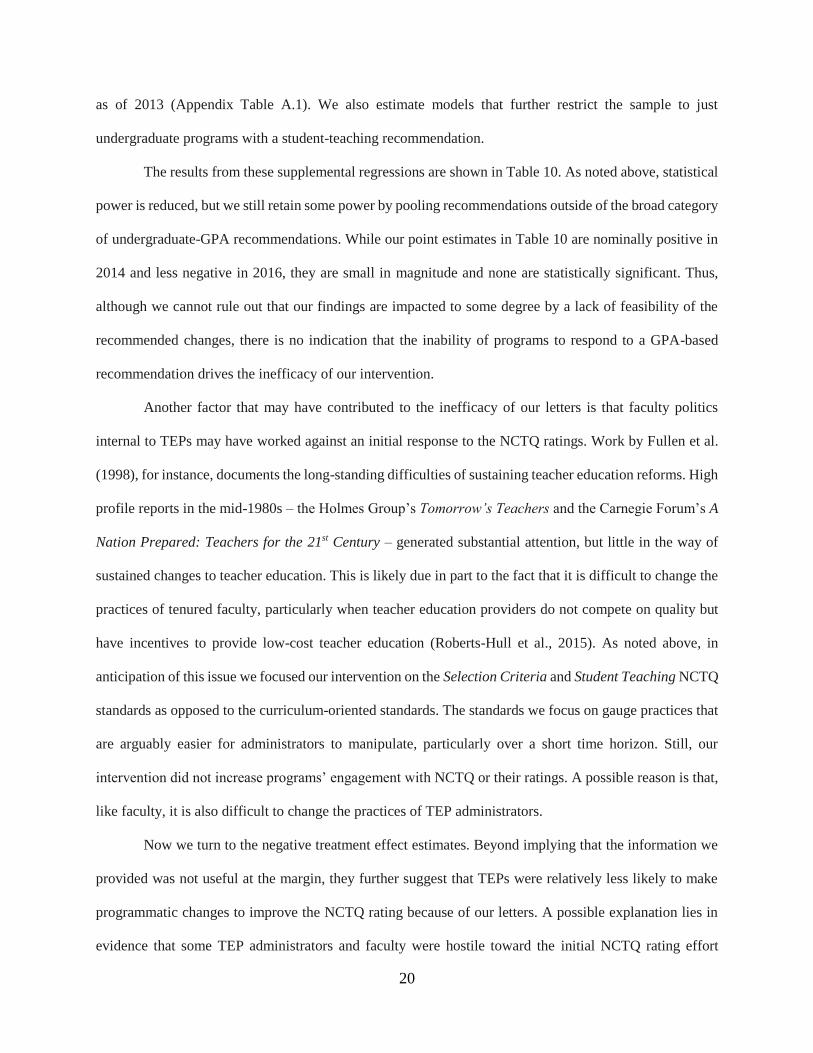
as of 2013 (Appendix Table A.1). We also estimate models that further restrict the sample to just
undergraduate programs with a student-teaching recommendation.
The results from these supplemental regressions are shown in Table 10. As noted above, statistical
power is reduced, but we still retain some power by pooling recommendations outside of the broad category
of undergraduate-GPA recommendations. While our point estimates in Table 10 are nominally positive in
2014 and less negative in 2016, they are small in magnitude and none are statistically significant. Thus,
although we cannot rule out that our findings are impacted to some degree by a lack of feasibility of the
recommended changes, there is no indication that the inability of programs to respond to a GPA-based
recommendation drives the inefficacy of our intervention.
Another factor that may have contributed to the inefficacy of our letters is that faculty politics
internal to TEPs may have worked against an initial response to the NCTQ ratings. Work by Fullen et al.
(1998), for instance, documents the long-standing difficulties of sustaining teacher education reforms. High
profile reports in the mid-1980s – the Holmes Group’s Tomorrow’s Teachers and the Carnegie Forum’s A
Nation Prepared: Teachers for the 21st Century – generated substantial attention, but little in the way of
sustained changes to teacher education. This is likely due in part to the fact that it is difficult to change the
practices of tenured faculty, particularly when teacher education providers do not compete on quality but
have incentives to provide low-cost teacher education (Roberts-Hull et al., 2015). As noted above, in
anticipation of this issue we focused our intervention on the Selection Criteria and Student Teaching NCTQ
standards as opposed to the curriculum-oriented standards. The standards we focus on gauge practices that
are arguably easier for administrators to manipulate, particularly over a short time horizon. Still, our
intervention did not increase programs’ engagement with NCTQ or their ratings. A possible reason is that,
like faculty, it is also difficult to change the practices of TEP administrators.
Now we turn to the negative treatment effect estimates. Beyond implying that the information we
provided was not useful at the margin, they further suggest that TEPs were relatively less likely to make
programmatic changes to improve the NCTQ rating because of our letters. A possible explanation lies in
evidence that some TEP administrators and faculty were hostile toward the initial NCTQ rating effort

21
(AATCT, 2012; Heller, 2014). For instance, in a statement released about a month after the publication of
the 2013 NCTQ Teacher Prep Review, Sharon Robinson, the president of the American Association of
Colleges for Teacher Education, stated that “…NCTQ’s work is part of an extensive, well-funded public
relations campaign to undermine higher education-based teacher preparation…[and it is not] a helpful or
reliable guide for parents, prospective teacher candidates or the public” (AACTE, 2013).26 Our extra
“touch” may have exacerbated these hostile feelings. While we do not have any way of testing this
hypothesis, it is difficult to think of alternative, plausible explanations for why our letters would negatively
impact program ratings.
It also merits brief mention that our experiment may have been too early and that this dulled any
potentially positive impacts. Research shows the importance of policy persistence as a driver of salience.
For example, Dee and Wyckoff (2015), who study the IMPACT teacher evaluation program in Washington
DC, find no evidence of a behavioral response among teachers in the first year of the program but a large
response after the first year. They argue that teachers were initially dismissive of IMPACT and did not
expect it to persist. Informal conversations with NCTQ staff are consistent with a similar phenomenon, in
that they report improved interactions with TEPs during more recent iterations of their evaluation effort,
although this claim is difficult to assess empirically.27
Finally, we conclude our discussion by contextualizing the findings in the larger literature on
“nudges.” As mentioned previously, our intervention can be interpreted broadly as a nudge for TEPs to pay
more attention to their NCTQ ratings, independent of the specific recommendation. This was one rationale
for the primary outcome in our analysis being the summative rating—there are many pathways by which
our letters could affect TEP behavior. The literature on nudges in various circumstances is mixed. There
are examples of informational nudges that have very large effects on behavior (Barr and Turner, 2017;
Castleman and Page, 2016; Hoxby and Turner, 2013; Marx and Turner, 2017) and nudges that do little
26 Efforts by NCTQ to collect information for their ratings were met with resistance from many programs and
NCTQ undertook legal action to obtain data in nine different states in 2013. 27 One indirect data point is that NCTQ’s legal fees associated with obtaining data from programs declined
substantially between 2013 and 2016. This suggests greater cooperation, or at least resignation, in recent years.

22
(Castleman and Page, 2014; Clark, Maki, and Morrill, 2014; Darolia and Harper, forthcoming; Guyton et
al., 2016). Research to date is not clear on what features of a nudge intervention improve efficacy and there
are conflicting results. As just one example, Ferraro and Price (2013) find that a nudge that appeals to our
prosocial nature by including information about peers affects behavior in the desired way, whereas Beshears
et al. (forthcoming) find the opposite. It is difficult to ascertain from the literature what characteristics
differentiate successful and unsuccessful nudges, but our study adds to the body of evidence by reporting
on an ineffectual case.28
6. Conclusion
The National Council on Teacher Quality’s ratings of teacher education programs represent the
first large-scale, external ratings of these programs in the U.S. of which we are aware. The theory of action
underlying NCTQ’s effort is to induce responses from TEPs consistent with the rating criteria. A large body
of previous research on higher education ratings supports the idea that public accountability via widely
available ratings can spur change.
Our descriptive overview shows that program ratings are explained by several characteristics.
Notably, TEPs housed in private institutions are rated lower and institutions with higher tuition and entrance
exam scores are rated higher. We document clear improvement over time on the NCTQ rating indicators,
suggesting programmatic changes are occurring within TEPs, but ratings growth is not strongly associated
with program characteristics.
Within the context of NCTQ’s rating project, we embedded an information experiment designed to
test whether a lack of information about how to improve in the ratings impedes programmatic change. In
the experiment we sent letters to TEP administrators, copying university presidents, with customized
28 Some studies that show what seem to be small nudge effects do not necessarily report them in this way. One
reason is that the size of the effect is implicitly gauged relative to the cost and nudge interventions are typically quite
cheap. Still, many published nudge experiments find small behavioral responses. There is also the standard concern
that the published literature on nudge interventions over-represents their efficacy owing to publication bias.

23
recommendations for changes that would improve their ratings. We leveraged information about NCTQ’s
proprietary scoring formula, programs’ individual profiles in the NCTQ database, and the broader
distribution of indicator scores in developing our recommendations. Our informational nudge did not
improve ratings, and in fact had a negative effect. In results omitted for brevity we also find no evidence
that our letters impacted programs’ general engagement with NCTQ during the month after they were sent.
Some evidence suggests that information about how to improve teacher education, even when
relevant, is not sufficient to lead to improvement as TEPs are not necessarily prepared to understand or
orchestrate change processes suggested by data (Peck and McDonald, 2013). And, moreover, as we
discussed above, a noteworthy aspect of the broad context within which our experiment was conducted is
that the initial Teacher Prep Review was highly controversial and not well-received by many TEPs
(AATCT, 2012; Heller, 2014). Some may have been particularly reluctant to respond, making the
information margin we test irrelevant. While at some level all nudge interventions target behaviors that are
not happening organically and require encouragement, the context of our study may be more contentious
than most. It is difficult to assess this explanation empirically, but if it does drive our results it would be
interesting given the overwhelming evidence that postsecondary institutions are responsive to public ratings
and rankings more generally.

24
References
ACT-SAT Concordance Tables. (2009, October). Retrieved from
http://www.act.org/content/dam/act/unsecured/documents/ACTCollegeBoardJointStatement.pdf
Alter, M., & Reback, R. (2014). True for Your School? How Changing Reputations Alter
Demand for Selective US colleges. Educational Evaluation and Policy Analysis, 36(3), 346-370.
Ballou, D., & Podgursky, M. (2000). Reforming Teacher Preparation and Licensing: What is the
Evidence? Teachers College Record, 102(1), 5-27.
Barr, A., & Turner, S. (2017). A Letter and Encouragement: Does Information Increase Post-
Secondary Enrollment of UI Recipients? National Bureau of Economic Research.
doi:10.3386/w23374
Bovens, M. (2005). 8.1 The concept of public accountability. In E. Ferlie, L. Lynne & C. Pollitt
(Eds.), The Oxford handbook of public management (p. 182). Oxford: Oxford University Press
CAEP Announces commission on standards and performance reporting; Will raise the bar for
educator preparation [Press release]. (2012, February 28). Retrieved from
http://www.ncate.org/about/news-room/statements-press-releases/caep-announces-commission-
on-standards
Castleman, B. L., & Page, L. C. (2015). Summer Nudging: Can Personalized Text Messages and
Peer Mentor Outreach Increase College Going Among Low-income High School Graduates?
Journal of Economic Behavior & Organization, 115, 144-160. doi:10.1016/j.jebo.2014.12.008

25
Castleman, B. L., & Page, L. C. (2016). Freshman Year Financial Aid Nudges: An Experiment
to Increase FAFSA Renewal and College Persistence. Journal of Human Resources, 51(2), 389-
415. doi:10.3368/jhr.51.2.0614-6458r
Chetty, R., Friedman, J. N., & Rockoff, J. E. (2014). Measuring the Impacts of Teachers II:
Teacher Value-added and Student Outcomes in Adulthood. The American Economic Review,
104(9), 2633-2679.
Clark, R. L., Maki, J. A., & Morrill, M. S. (2014). Can Simple Informational Nudges Increase
Employee Participation in a 401 (k) Plan? Southern Economic Journal, 80(3), 677-701.
Cochran-Smith, M. & Zeichner, K. M. (2005). Studying teacher education: The report of the
AERA panel on research and teacher education. Mahwah, NJ: Lawrence Erlbaum Associates.
Crowe, E. (2010, July 9). Measuring what matters: A stronger accountability model for teacher
education. Retrieved from https://www.americanprogress.org/issues/education-k-
12/reports/2010/07/29/8066/measuring-what-matters/
Darling-Hammond, L. (2013, June 18). Why the NCTQ teacher prep ratings are nonsense. The
Washington Post. Retrieved from https://www.washingtonpost.com/news/answer-
sheet/wp/2013/06/18/why-the-nctq-teacher-prep-ratings-are-nonsense/?utm_term=.5cbe8d0b0e53
Darolia, R., & Harper, C. (2017). Information Use and Attention Deferment in College Student
Loan Decisions: Evidence from a Debt Letter Experiment. Educational Evaluation and Policy
Analysis, 40(1), 129-150. doi:10.3102/0162373717734368

26
Dee, T. S., & Wyckoff, J. (2015). Incentives, Selection, and Teacher Performance: Evidence
from IMPACT. Journal of Policy Analysis and Management, 34(2), 267-297.
Duncan, A. (2016, October 04). An open letter to America's college presidents and education
school deans. Brookings. Retrieved August 1, 2017, from
https://www.brookings.edu/blog/brown-center-chalkboard/2016/10/04/arne-duncan-letter-
education-school-deans/
Ehrenberg, R. (2003). Reaching for the Brass Ring: The US News & World Report Rankings and
Competition. Review of Higher Education. 26(2): 145-162.
Ferraro, P.J., & Price, M.K. (2013). Using Nonpecuniary Strategies to Influence Behavior:
Evidence from a Large-scale Field Experiment. Review of Economics and Statistics 95(1), 64-73.
Fullan, M., Galluzzo, G., Morris, P., & Watson, N. (1998). The Rise & Stall of Teacher
Education Reform. Washington, DC: AACTE
Fuller, E. J. (2014). Shaky Methods, Shaky Motives: A Critique of the National Council of
Teacher Quality’s Review of Teacher Preparation Programs. Journal of Teacher Education,
65(1), 63-77.
Greenberg, J., Walsh, K., & Mckee, A. (2013). Teacher prep review: A review of the nation’s
teacher preparation programs. National Council on Teacher Quality (NCTQ). Retrieved from
https://www.nctq.org/dmsView/Teacher_Prep_Review_2013_Report

27
Greenberg, J., Walsh, K., & Mckee, A. (2014). Teacher prep review: A review of the nation’s
teacher preparation programs. National Council on Teacher Quality (NCTQ). Retrieved from
https://www.nctq.org/dmsView/Teacher_Prep_Review_2014_Report
Goldhaber, D., & Anthony, E. (2003). Teacher Quality and Student Achievement. Urban
Diversity Series. New York, NY: Education Resources Information Center (ERIC).
Goldhaber, D., Brewer, D., & Anderson, D. (1999). A Three-Way Error Components Analysis of
Educational Productivity. Education Economics, 7(3), 199-208.
Goldhaber, D., Krieg, J., & Theobald, R. (2014). Knocking on the Door to the Teaching
Profession? Modeling the Entry of Prospective Teachers into the Workforce. Economics of
Education Review, 43, 106-124.
Goldhaber, D., Liddle, S., & Theobald, R. (2013). The Gateway to the Profession: Assessing
Teacher Preparation Programs Based on Student Achievement. Economics of Education Review,
34, 29-44.
Guyton, J., Manoli, D. S., Schafer, B., & Sebastiani, M. (2016). Reminders & Recidivism:
Evidence from Tax Filing & EITC Participation Among Low-Income Nonfilers. (No. w21904).
National Bureau of Economic Research. doi: 10.3386/w21904
Hanushek, E.A. & Rivkin, S. (2010). Generalizations about Using Value-Added Measures of
Teacher Quality. American Economic Review, 100(2), 267-271.

28
Heller, D. E. (2014, November 14). ‘Easy A’s’ Gets an F. The Chronicle of Higher Education.
Retrieved from https://www.chronicle.com/article/Easy-A-s-Gets-an-F/150025.
Henry, G.T. & Bastian, K.C. (2015). Measuring up: The National Council on Teacher Quality’s
ratings of teacher preparation programs and measures of teacher performance. Chapel Hill, NC:
The Education Policy Initiative, College of Arts and Sciences, University of North Carolina.
Hippel, P. T., Bellows, L., Osborne, C., Lincove, J. A., & Mills, N. (2016). Teacher Quality
Differences between Teacher Preparation Programs: How Big? How Reliable? Which Programs
are Different? Economics of Education Review, 53, 31-45.
Hoxby, C. & Turner, S. (2013). Expanding opportunities for high-achieving, low-income
students (Working Paper, No. 12-014). Stanford Institute for Economic Policy Research (SIEPR).
Retrieved from http://siepr.stanford.edu/publicationsprofile/2555.
Jackson, C. K. (2016). What Do Test Scores Miss? The Importance of Teacher Effects on Non-
Test-score Outcomes. National Bureau of Economic Research. doi: 10.3386/w22226
Killeen, K., Loeb, S., & Williams, I. (2015). A double draw of proximity: The importance of
geography in teacher application and hiring decisions. CEPA.
Koedel, C., Parsons, E., Podgursky, M., & Ehlert, M. (2015). Teacher Preparation Programs and
Teacher Quality: Are There Real Differences Across Programs? Education Finance and Policy
10(4), 508-534.
Kraft, M.A. (2017). Teacher Effects on Complex Cognitive Skills and Social-Emotional

29
Competencies. Journal of Human Resources. doi:10.3368/jhr.54.1.0916.8265r3
Latest NCTQ Report Validates Concerns over Group's Flawed Research and Bias.( 2012, May
25). Retrieved November 14, 2014, from https://aacte.org/news-room/press-releases-
statements/129-latest-nctq-report-validates-concerns-over-groups-flawed-research-and-bias
Levine, A. (2006). Educating school teachers. Education Schools Project. Retrieved from
http://edschools.org/pdf/Educating_Teachers_Report.pdf
Luca, M., & Smith, J. (2013). Salience in Quality Disclosure: Evidence from the U.S. News
College Rankings. Journal of Economics & Management Strategy, 22(1), 58-77.
McDonough, P. M., Lising, A., Walpole, A. M., & Perez, L. X. (1998). College Rankings:
Democratized College Knowledge for Whom?. Research in Higher Education, 39(5), 513-537.
McLendon, M. K. (2003). State governance reform of higher education: Patterns, trends, and
theories of the public policy process. In Higher education: Handbook of theory and research (pp.
57-143). Springer Netherlands.
Meredith, M. (2004). Why Do Universities Compete in the Ratings Game? An Empirical
Analysis of the Effects of the US News and World Report College Rankings. Research in Higher
Education, 45(5), 443-461.
Meyer, A.G., Hanson, A.R., & Hickman, D.C., (2017). Perceptions of Institutional Quality:
Evidence of Limited Attention to Higher Education Rankings. Journal of Economic Behavior and
Organization, 142, 241-258.

30
Monks, J. and Ehrenberg, R. G., (1999). The impact of U.S. News & World Report College
Rankings on admissions outcomes and pricing policies at selective private institutions (Working
Paper No. 1). CHERI. Retrieved January 12, 2015, from
http://digitalcommons.ilr.cornell.edu/cgi/viewcontent.cgi?article=1000&context=cheri
Nye, B., Konstantopoulos, S., & Hedges, L. V. (2004). How Large are Teacher Effects?
Educational Evaluation and Policy Analysis, 26(3), 237-257.
Peck, C.A., & McDonald, M. (2013). Creating “Cultures of Evidence” in Teacher Education:
Context, Policy, and Practice in Three High-Data-Use Programs. The New Educator, 9(1), 12-28.
Ranson, S. (2003). Public Accountability in the Age of Neo‐liberal Governance. Journal of
Education Policy, 18(5), 459-480.
Rapoport, N. B. (1999). Ratings, Not Rankings: Why US News & World Report Shouldn't Want
to be Compared to Time and Newsweek--or The New Yorker. Ohio State Law Journal, 60(3),
1097 – 1101.
Reininger, M. (2012). Hometown Disadvantage? It Depends on Where You’re From. Teachers’
Location Preferences and the Implications for Staffing Schools. Educational Evaluation and
Policy Analysis, 34(2), 127-145.
Resmovits, J. (2013, June 18). Teacher preperation program rankings make U.S. News debut.
Huffington Post. Retrieved from https://www.huffingtonpost.com/2013/06/18/teacher-
preparation-program-rankings_n_3456389.html.

31
Roberts-Hull, K., Jensen, B., & Cooper, S. (2015). A new approach: Teacher education reform.
Melbourne, Australia: Learning First.
Romzek, B. S. (2000). Dynamics of Public Sector Accountability in an Era of Reform.
International Review of Administrative Sciences, 66(1), 21-44.
Ronfeldt, M., & Campbell, S.L. (2016). Evaluating Teacher Preparation Using Graduates’
Observational Ratings. Educational Evaluation and Policy Analysis 38(4), 603-625.
Sauder, M. and Lancaster, R.(2006). Do Rankings Matter? The Effects of U.S. News & World
Report Rankings on the Admissions Process of Law Schools. Law & Society Review, 40(2): 105-
134.
Setting the Record Straight: AACTE’s Engagement on the National Council on Teacher Quality
Teacher Prep Review.( 2013, July 19). Retrieved February 12, 2018 from https://aacte.org/news-
room/press-releases-statements/152-setting-the-record-straight-aactes-engagement-on-the-
national-council-on-teacher-quality-teacher-prep-review
Startz, D. (2016, December 8). Teacher prep ratings: 2016 edition. Brookings. Retrieved August
1, 2017, from https://www.brookings.edu/blog/brown-center-chalkboard/2016/12/08/teacher-
prep-ratings-2016-edition/
U.S. Department of Education. (2009, October 22). US Secretary of Education Arne Duncan

32
says colleges of education must improve for reforms to succeed. Retrieved from
https://www.ed.gov/news/press-releases/us-secretary-education-arne-duncan-says-colleges-
education-must-improve-reforms-succeed
Vergari, S., & Hess, F. (2002). The Accreditation Game: Can Accreditation Ensure Quality
Teacher Training. Education Next, 2(3).
Zumeta, W., & Kinne, A. (2011). Accountability Policies: Directions Old and New. In D.E.
Heller (Ed), The States and Public Higher Education Policy: Affordability, Access, and
Accountability (pp. 173-199). Baltimore, MD: Johns Hopkins University Press.

FIGURES AND TABLES
Figure 1. Timeline of NCTQ Activities and the Experimental Intervention.

Table 1. Selected descriptive statistics across ratings years
2013 2014 2016
Average NCTQ Summative Rating 1.34 1.43 1.50
(0.71) (0.72) (0.73)
University median incoming ACT 22.7 22.8 23.2
(2.9) (2.9) (3.0)
University median incoming SAT math 533.2 530.0 530.0
(60.2) (60.2) (58.7)
University median incoming SAT reading 520.1 519.5 520.7
(56.7) (55.3) (54.9)
% Female 57.1 58.2 57.6
(6.2) (8.4) (8.7)
% White 65.8 66.2 66.8
(22.2) (21.6) (21.3)
% URM 26.2 26.0 25.2
(20.3) (19.8) (19.4)
% Other 8.0 7.8 8.0
(8.1) (7.7) (7.8)
Average undergraduate tuition (in dollars) 15216 18212 21632
(8915) (10228) (10845)
Average graduate tuition (in dollars) 12966 13440 14056
(6465) (6834) (7410)
Proportion of students in LMA enrolled in
charter schools
0.04 0.04 0.04
(0.04) (0.04) (0.04)
State charter authorization indicator 0.82 0.84 0.78
(0.38) (0.36) (0.41)
Labor market area share of teacher prep
program graduates
0.61 0.53 0.47
(0.40) (0.41) (0.41)
N (Preparation programs) 582 780 911
Notes: The 2016 ratings are “adjusted” as described in the text by applying the 2013 NCTQ
scoring methodology to the 2016 program data. Median SAT and ACT scores are calculated
assuming symmetric distributions by averaging the 25th and 75th percentiles reported in IPEDS.
Tuition is averaged over in-state and out-of-state. Standard deviations are reported in parentheses.

Table 2. Ratings Category Transition Matrix From 2013 to 2014
2014 NCTQ Summative Rating
0-1 1-2 2-3 3-4 Total
2013 N
CT
Q
Sum
mat
ive
Rat
ing
0-1 26% 8% 1% 0% 35%
1-2 4% 35% 7% 0% 46%
2-3 0% 5% 13% 1% 19%
3-4 0% 0% 0% 1% 1%
Total 30% 47% 21% 1% 100% (571)
Notes: NCTQ ratings are rounded up to the nearest positive integer for these transition
matrices. Number in parentheses is the number of elementary programs in the sample.
Table 3. Ratings category transition matrix from 2013 to 2016
Panel A: Unadjusted 2016 NCTQ Summative Rating
0-1 1-2 2-3 3-4 Total
2013 N
CT
Q
Sum
mat
ive
Rat
ing
0-1 19% 12% 3% 0% 35%
1-2 3% 29% 14% 0% 46%
2-3 0% 5% 11% 1% 18%
3-4 0% 0% 0% 1% 1%
Total 22% 47% 28% 3% 100% (460)
Panel B: Adjusted 2016 NCTQ Summative Rating (applying the 2013/2014 rating criteria)
0-1 1-2 2-3 3-4 Total
2013 N
CT
Q
Sum
mat
ive
Rat
ing
0-1 22% 9% 3% 0% 35%
1-2 6% 29% 11% 1% 46%
2-3 1% 7% 9% 2% 18%
3-4 0% 0% 0% 1% 1%
Total 29% 45% 22% 4% 100% (460)
Notes: NCTQ summative ratings are rounded up to the nearest positive integer for these
transition matrices. Number in parentheses is the number of elementary programs in the
sample. The drop in the sample size in Table 3 relative to Table 2 is largely due to a reduction
in the 2013 elementary education programs in the 2013 sample that were rated by NCTQ in
2016.
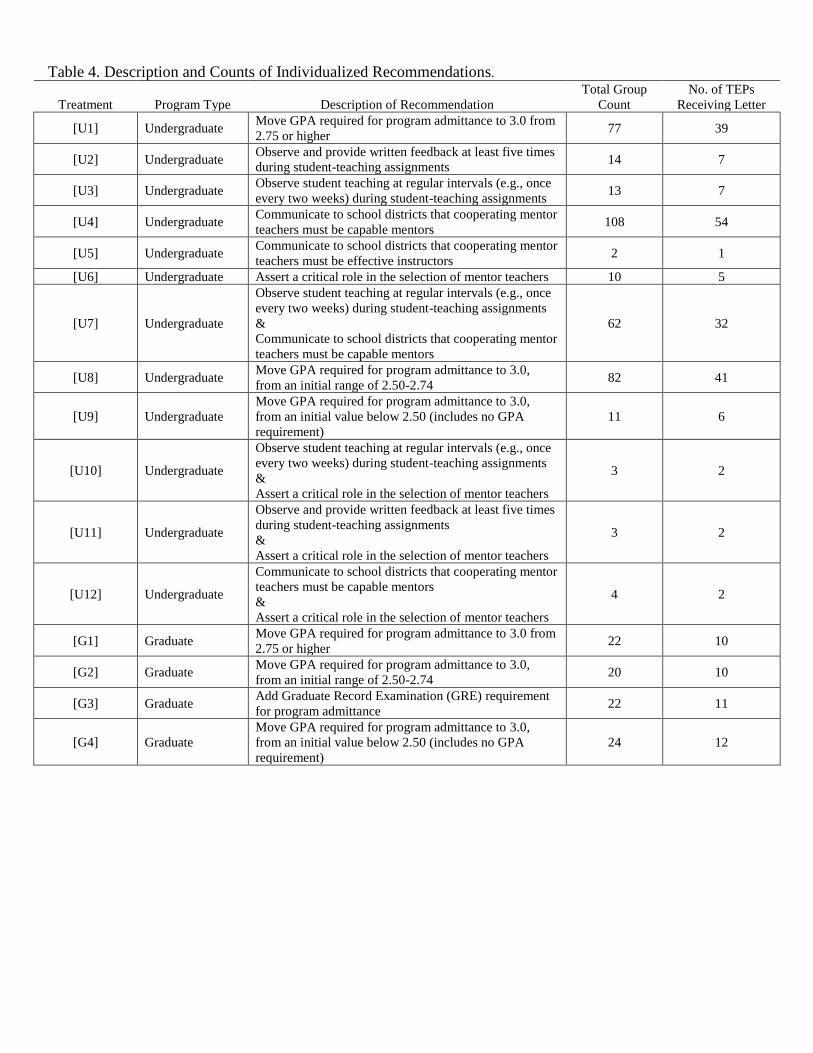
Table 4. Description and Counts of Individualized Recommendations.
Treatment Program Type Description of Recommendation
Total Group
Count
No. of TEPs
Receiving Letter
[U1] Undergraduate Move GPA required for program admittance to 3.0 from
2.75 or higher 77 39
[U2] Undergraduate Observe and provide written feedback at least five times
during student-teaching assignments 14 7
[U3] Undergraduate Observe student teaching at regular intervals (e.g., once
every two weeks) during student-teaching assignments 13 7
[U4] Undergraduate Communicate to school districts that cooperating mentor
teachers must be capable mentors 108 54
[U5] Undergraduate Communicate to school districts that cooperating mentor
teachers must be effective instructors 2 1
[U6] Undergraduate Assert a critical role in the selection of mentor teachers 10 5
[U7] Undergraduate
Observe student teaching at regular intervals (e.g., once
every two weeks) during student-teaching assignments
&
Communicate to school districts that cooperating mentor
teachers must be capable mentors
62 32
[U8] Undergraduate Move GPA required for program admittance to 3.0,
from an initial range of 2.50-2.74 82 41
[U9] Undergraduate
Move GPA required for program admittance to 3.0,
from an initial value below 2.50 (includes no GPA
requirement)
11 6
[U10] Undergraduate
Observe student teaching at regular intervals (e.g., once
every two weeks) during student-teaching assignments
&
Assert a critical role in the selection of mentor teachers
3 2
[U11] Undergraduate
Observe and provide written feedback at least five times
during student-teaching assignments
&
Assert a critical role in the selection of mentor teachers
3 2
[U12] Undergraduate
Communicate to school districts that cooperating mentor
teachers must be capable mentors
&
Assert a critical role in the selection of mentor teachers
4 2
[G1] Graduate Move GPA required for program admittance to 3.0 from
2.75 or higher 22 10
[G2] Graduate Move GPA required for program admittance to 3.0,
from an initial range of 2.50-2.74 20 10
[G3] Graduate Add Graduate Record Examination (GRE) requirement
for program admittance 22 11
[G4] Graduate
Move GPA required for program admittance to 3.0,
from an initial value below 2.50 (includes no GPA
requirement)
24 12

Table 5. Experimental sample descriptive statistics
Control Treatment Difference
% Asian 5.0 4.1 0.9
(6.8) (6.0) (0.7)
% Black 13.3 13.7 -0.4
(17.7) (17.7) (1.7)
% Hispanic 12.4 10.2 2.2*
(14.3) (13.4) (1.1)
% Indian 1.0 1.4 -0.4
(2.5) (6.8) (0.5)
% Multiracial 3.2 2.7 0.5*
(2.8) (2.0) (0.3)
% Pacific Islander 0.3 0.2 0.1
(1.3) (0.2) (0.1)
% White 64.8 67.7 -3.0
(22.7) (22.3) (2.1)
2012-2013 Proportion of university enrolled in
TEP 0.052 0.064 -0.011
(0.079) (0.161) (0.010)
NCTQ summative rating 1.297 1.328 -0.031
(0.692) (0.643) (0.06)
NCTQ selectivity rating 1.722 1.639 0.083
(1.54) (1.476) (0.144)
NCTQ student teaching rating 0.622 0.688 -0.066
(1.125) (1.167) (0.074)
NCTQ elementary content rating 1.008 1.216 -0.208***
(1.088) (1.194) (0.062)
NCTQ math rating 1.384 1.49 -0.106
(1.343) (1.377) (0.13)
NCTQ reading rating 1.675 1.61 0.065
(1.581) (1.601) (0.171)
Out of state graduate tuition 16637 15948 -689
(7187) (7752) (768)
Out of state undergraduate tuition 19554 18339 -1214*
(8299) (8819) (713)
University median incoming ACT 22.6 22.6 0.1
(2.8) (3.0) (0.3)
University median incoming SAT math 528 532 5
(58) (64) (6)
University median incoming SAT reading 515 521 6
(54) (62) (6)
Notes: Standard deviations are reported in parentheses in columns 1 and 2, and standard errors are reported in
parentheses in column 3, clustered at the state level. Out of state graduate tuition is reported for baseline
equivalence tests for brevity. We find similar results for in state tuition. We assume a symmetric distribution for
SAT and ACT scores and calculate the median by averaging the IPEDs reported 25th and 75th percentiles. We
also test these baseline covariates jointly using Seemingly Unrelated Regressions (SUR) and find that the
coefficients are not jointly significant (p=0.589).
*** p < .01 ** p < .05 * p < .1

Table 6. Correlation between university characteristics and NCTQ summative ratings
Dependent variable is NCTQ summative rating in year: 2013 2014 2016 (1) (2) (3) (4) (5) (6)
% Asian -0.008** -0.005 -0.006 -0.006 -0.003 -0.003
(0.003) (0.006) (0.004) (0.005) (0.005) (0.004)
% URM 0.002 0.000 -0.002 -0.002* -0.002 -0.002
(0.002) (0.002) (0.002) (0.001) (0.002) (0.002)
% Multiracial -0.003 -0.016 -0.009 -0.021 0.004 -0.002
(0.011) (0.014) (0.01) (0.014) (0.008) (0.011)
% Female -0.003 0.003 -0.003 -0.001 -0.002 0.001
(0.005) (0.006) (0.003) (0.003) (0.003) (0.002)
Median college/university
entrance exams 0.003*** 0.003*** 0.002*** 0.002*** 0.002*** 0.002***
(0.000) (0.000) (0.000) (0.000) (0.000) (0.000)
Labor market area share of TEP
graduates 0.025 0.063 -0.014 -0.032 0.106 0.019
(0.074) (0.069) (0.063) (0.059) (0.07) (0.056)
Average undergraduate tuition
(in thousands of dollars) 0.009** 0.019*** 0.016*** 0.021*** 0.011*** 0.015***
(0.005) (0.004) (0.004) (0.003) (0.004) (0.004)
Average graduate tuition
(in thousands of dollars) -0.012* -0.006 -0.001 0.003 -0.010* -0.008
(0.007) (0.006) (0.006) (0.006) (0.006) (0.006)
2012-2013 Proportion of
university enrolled in TEP -0.214* 0.083 -0.204* -0.033 -0.174* 0.042
(0.12) (0.101) (0.121) (0.111) (0.105) (0.103)
Proportion of students in LMA
enrolled in charter program -1.42** -0.124 -0.294 0.007 0.483 -0.860
(0.713) (0.609) (0.784) (0.534) (0.855) (0.870)
State charter laws present 0.088 0.013 0.153*
(0.116) (0.072) (0.082)
Private for-profit -0.050 -0.212*** -0.212*** -0.259*** -0.108* -0.159***
(0.089) (0.057) (0.057) (0.056) (0.056) (0.053)
Private not-for-profit -0.181 -0.014 -0.585*** -0.469** 0.285 0.266
(0.320) (0.389) (0.209) (0.222) (0.282) (0.302)
Graduate program -0.317** -0.154 -0.323** -0.245** -0.491*** -0.387***
(0.149) (0.142) (0.130) (0.124) (0.117) (0.137)
State fixed effects No Yes No Yes No Yes
R-squared 0.358 0.503 0.310 0.444 0.377 0.483
N (Elementary programs) 582 582 780 780 911 911
Notes: Standard errors, clustered at the state level, are reported in parentheses. Explanatory variable missing values are
mean imputed with indicator controls for missingness. Median college/university entrance exams are the university
median SAT scores when only SAT scores are available. When both SAT and ACT scores are available it is the average
of the SAT and the ACT median converted to its SAT equivalent (where the conversation of the ACT to the SAT scale
is based on College Board SAT/ ACT concordance tables). When only ACT scores are available it is the ACT score
converted to its SAT equivalent. Tuition variables are averaged over in state and out of state and divided by 1,000 for
representability of coefficients.
*** p < .01 ** p < .05 * p < .1

Table 7. Correlation between university characteristics and NCTQ ratings of programs controlling for the 2013 NCTQ rating Dependent variable is NCTQ summative rating in year: 2014 2016 (1) (2) (3) (4)
% Asian 0.001 0.000 0.000 -0.001
(0.004) (0.004) (0.004) (0.005)
% URM -0.001 0.000 -0.001 -0.001
(0.001) (0.001) (0.001) (0.002)
% Multiracial -0.004 -0.014 0.002 -0.006
(0.007) (0.011) (0.009) (0.013)
% Female 0.001 0.003 -0.005 -0.002
(0.003) (0.003) (0.005) (0.005)
Median college/university entrance exams 0.001** 0.001*** 0.001*** 0.001***
(0.000) (0.000) (0.0) (0.000)
Labor market area share of TEP graduates 0.070 0.016 0.007 -0.122
(0.069) (0.058) (0.071) (0.092)
Average undergraduate tuition
(in thousands of dollars) 0.003 0.005 0.002 0.005
(0.003) (0.004) (0.004) (0.006)
Average graduate tuition
(in thousands of dollars) -0.001 0.000 -0.007 -0.005
(0.005) (0.005) (0.005) (0.005)
2012-2013 Proportion of university enrolled in
TEP -0.081 -0.085 -0.129* -0.173**
(0.063) (0.148) (0.076) (0.076)
Proportion of students in LMA enrolled in
charter program -0.183 -0.408 -0.082 -1.262
(0.530) (0.563) (0.846) (0.778)
State charter laws present 0.024 0.047
(0.072) (0.098)
Private for-profit -0.103 -0.039 -0.101 -0.080
(0.068) (0.055) (0.090) (0.094)
Private not-for-profit -0.214** -0.121 0.32*** 0.415***
(0.085) (0.243) (0.123) (0.145)
Graduate program -0.044 -0.030 -0.316** -0.313**
(0.096) (0.107) (0.124) (0.150)
2013 NCTQ Rating Yes Yes Yes Yes
State fixed effects No Yes No Yes
R-squared 0.686 0.754 0.549 0.629
N (Elementary programs) 571 571 460 460
Notes: Standard errors, clustered at the state level, are reported in parentheses. All regressions control for 2013
NCTQ rating. Explanatory variable missing values are mean imputed with indicator controls for missingness.
Median college/university entrance exams are the university median SAT scores when only SAT scores are
available. When both SAT and ACT scores are available it is the average of the SAT and the ACT median converted
to its SAT equivalent (where the conversation of the ACT to the SAT scale is based on College Board SAT/ ACT
concordance tables). When only ACT scores are available it is the ACT score converted to its SAT equivalent.
Tuition variables are averaged over in state and out of state and divided by 1,000 for representability of coefficients.
*** p < .01 ** p < .05 * p < .1

Table 8. Attrition from the experimental sample
Dependent variable is attrition from the email sample in: 2014 2016 (1) (2) (3) (4) (5) (6)
Treatment 0.012 0.009 0.008 0.015 -0.001 0.014
(0.012) (0.012) (0.014) (0.037) (0.043) (0.048)
2013 NCTQ rating -0.008 -0.020 -0.028 -0.020 0.002 -0.067*
(0.010) (0.012) (0.017) (0.026) (0.034) (0.039)
% Asian -0.002 -0.002
-0.003 -0.003
(0.002) (0.002)
(0.002) (0.004)
% URM 0.000 0.000
-0.001 -0.001
(0.000) (0.000)
(0.001) (0.001)
% Multiracial -0.002 -0.002
0.000 -0.002
(0.002) (0.002)
(0.007) (0.015)
% Female -0.001 -0.002
0.010*** 0.010***
(0.001) (0.001)
(0.003) (0.003)
Median college/university entrance
exams
0.000 0.000
0.000 0.000
(0.000) (0.000)
(0.000) (0.000)
Labor market area share of TEP
graduates
-0.009 -0.008
0.034 0.046
(0.020) (0.020)
(0.053) (0.057)
Average undergraduate tuition
(in thousands of dollars)
0.000 0.001
0.001 0.003
(0.001) (0.001)
(0.004) (0.005)
Average graduate tuition
(in thousands of dollars)
0.001 0.001
0.002 0.003
(0.004) (0.004)
(0.004) (0.005)
2012-2013 Proportion of university
enrolled in TEP
-0.013 -0.022
-0.036 -0.073
(0.022) (0.043)
(0.062) (0.068)
Proportion of students in LMA
enrolled in charter program
-0.304** -0.261*
0.270 0.053
(0.129) (0.155)
(0.389) (0.636)
State charter laws present 0.032***
-0.004
(0.012)
(0.054)
Private for-profit -0.009 -0.013
-0.074 -0.107
(0.013) (0.019)
(0.050) (0.070)
Private not-for-profit -0.128 -0.103
0.387 0.359
(0.116) (0.127)
(0.257) (0.293)
Graduate program 0.061 0.039 0.050 -0.252*** -0.220* -0.237
(0.054) (0.074) (0.077) (0.062) (0.133) (0.160)
University controls No Yes Yes No Yes Yes
State fixed effects No No Yes No No Yes
R-squared 0.071 0.147 0.222 0.051 0.093 0.344
N (Email sample) 486 486 486 486 486 486
Notes: Standard errors, clustered at the state level, are reported in parentheses. Explanatory variable missing values are mean
imputed with indicator controls for missingness. Median college/university entrance exams are the university median SAT scores
when only SAT scores are available. When both SAT and ACT scores are available it is the average of the SAT and the ACT
median converted to its SAT equivalent (where the conversation of the ACT to the SAT scale is based on College Board SAT/ ACT
concordance tables). When only ACT scores are available it is the ACT score converted to its SAT equivalent. Tuition variables are
averaged over in state and out of state and divided by 1,000 for representability of coefficients.
*** p < .01 ** p < .05 * p < .1

Table 9. Estimated impact of treatment on 2014 and 2016 ratings
Dependent variable is NCTQ summative rating in year: 2014 2016 (1) (2) (3) (4) (5) (6)
Treatment
-0.034 -0.038 -0.026 -0.149** -0.141** -0.126*
(0.037) (0.036) (0.040) (0.059) (0.061) (0.070)
2013 NCTQ Rating Yes Yes Yes Yes Yes Yes
University controls No Yes Yes No Yes Yes
State fixed effects No No Yes No No Yes
R-squared 0.690 0.704 0.750 0.511 0.559 0.637
N (Email sample) 477 477 477 384 384 384
Notes: Standard errors, clustered at the state level, are reported in parentheses. All regressions control
for 2013 NCTQ rating and recommendation category. Standard errors, clustered at the state level, are
reported in parentheses. University controls include % Asian, % URM, % multiracial, % female, median
college/university entrance exams, labor market area share of teacher prep program graduates, average
undergraduate tuition, average graduate tuition, 2012-2013 enrollment ratio, proportion of students in
LMA enrolled in charter program, state charter laws, program sector and level.
*** p < .01 ** p < .05 * p < .1

Table 10. Treatment effects for email experiment subsamples
Dependent variable is NCTQ summative rating in year:
2014 2016
(1) (2) (3) (4) (5) (6)
Panel A: No GPA recommendation (undergraduate programs)
Treatment 0.012 0.007 0.021 -0.076 -0.085 -0.063
(0.043) (0.043) (0.044) (0.068) (0.071) (0.088)
2013 NCTQ Rating Yes Yes Yes Yes Yes Yes
University controls No Yes Yes No Yes Yes
State fixed effects No No Yes No No Yes
R-squared 0.725 0.753 0.826 0.628 0.685 0.769
N (Email subsample) 307 255
Panel B: No GPA recommendation (undergraduate or graduate programs)
Treatment 0.005 0.012 0.034 -0.104 -0.096 -0.075
(0.054) (0.051) (0.052) (0.086) (0.086) (0.112)
2013 NCTQ Rating Yes Yes Yes Yes Yes Yes
University controls No Yes Yes No Yes Yes
State fixed effects No No Yes No No Yes
R-squared 0.657 0.698 0.785 0.438 0.547 0.675
N (Email subsample) 241 194
Notes: Standard errors, clustered at the state level, are reported in parentheses. All regressions control for
2013 NCTQ rating and recommendation category. University controls include % Asian, % URM, %
multiracial, % female, median college/university entrance exams test scores, labor market area share of teacher
prep program graduates, average undergraduate tuition, average graduate tuition, 2012-2013 enrollment ratio,
proportion of students in LMA enrolled in charter program, state charter laws, program sector and level.
*** p < .01 ** p < .05 * p < .1

Appendix A
Recommendation Procedures & Example Letter
A.1 Recommendation Procedure for Undergraduate Programs
The recommendation for each program depends on three factors: (1) the program’s scores on
each indicator and standard from the 2013 Review, (2) how NCTQ aggregates indicators within
standards and weights the standard-specific ratings to construct a final rating, and (3) the overall
distribution of ratings, which we used to help determine the ease with which different standards
can be met. In general terms, we define 𝑿𝒋𝒌𝑼𝑮 as a vector of binary variables for the six focal
undergraduate indicators under the Selection Criteria and Student Teaching Standards, with each
indicator equal to one if program j satisfies indicator k and zero otherwise. We further define 𝑌𝑗𝑈𝐺
and 𝑍𝑗𝑈𝐺 as measures of program j’s ratings on indicators and standards not covered by our
intervention. Specifically, 𝑌𝑗𝑈𝐺is measures program j’s ratings on the Selection Criteria indicators
unrelated to the GPA requirement (which depend on the selectivity of the larger institution to
which program j belongs and the racial diversity of the program relative to the housing institution),
and 𝑍𝑗𝑈𝐺 is a summative measure of program j’s ratings on the Early Reading, Elementary
Mathematics, and Elementary Content Standards. Using these definitions, each undergraduate
program’s final rating, , can be written as follows:
𝑅𝑗𝑈𝐺 = 𝐹(𝑋𝑗1
𝑈𝐺 , 𝑋𝑗2𝑈𝐺 , 𝑋𝑗3
𝑈𝐺 , 𝑋𝑗4𝑈𝐺 , 𝑋𝑗5
𝑈𝐺 , 𝑋𝑗6𝑈𝐺 , 𝑌𝑗
𝑈𝐺 , 𝑍𝑗𝑈𝐺). (A.1)
We calculate 𝛥𝑅𝑗𝑈𝐺 for k=1,2,…6, where 𝛥𝑅𝑗𝑘 represents the change in the overall rating that
would occur if program j met indicator k, holding ratings on other indicators and standards constant
(for programs that are already meeting indicator k, 𝛥𝑅𝑗𝑘𝑈𝐺 = 0 ). Among the indicators for
which 𝛥𝑅𝑗𝑘𝑈𝐺 > 0, our recommendation to program j is to take action on the indicator that would
be easiest for the program to satisfy.
We used a mix of judgment and empirics to determine the ease with which programs could
make changes to satisfy failed indicators. The most important judgment call that we made involves
the Selection Criteria Standard. The Selection Criteria Standard can be fully met by meeting just
the GPA requirement indicator, which specifies a 3.0 college GPA for admittance into the program.
We assume that it is easier for programs with GPA requirements “close” to 3.0 to change to meet
this indicator than programs with GPA requirements “far” from 3.0. Accordingly, we divided
programs into two groups: group-A programs, with GPA requirements between 2.75 and 2.99
(inclusive), and group-B programs, with GPA requirements below 2.75 (group-B includes
programs that do not have a GPA requirement).1
The sequence that we used to determine programs’ recommendations was as follows. First,
we identified the GPA requirement indicator as the easiest to satisfy for all group-A programs that
did not already fully meet the Selection Criteria Standard (via information in 𝑌𝑗𝑈𝐺). Next, for
programs that already fully met the Selection Criteria Standard, and group-B programs regardless
1 Recall from above that program scores on the Selection Criteria Standard also can be affected by the selectivity of
the housing university and racial diversity. In fact, programs can fully meet the Selection Criteria Standard without a
3.0 GPA based on these alternative metrics. By definition, group-A and group-B programs do not fully satisfy the
Selection Criteria Standard.
UG
jR

of whether they met the Selection Criteria Standard, we turned to the Student Teaching indicators
to make recommendations. Based on each program’s indicator profile under the Student Teaching
Standard, and its ratings on other standards, we identified the subset of Student Teaching indicators
for which 𝛥𝑅𝑗𝑘𝑈𝐺 > 0. We recommended action to satisfy the most-commonly-satisfied indicator
among all other programs with ratings. One issue that came up with the Student Teaching
recommendations is that programs that failed all five Student Teaching indicators could not
improve their overall rating with any single action. Put differently, 𝛥𝑅𝑗𝑘𝑈𝐺 = 0 for each indicator
individually because NCTQ requires at least two of the five Student Teaching indicators to be met
to earn a positive Student Teaching score. For programs in this situation, we recommended action
for the two indicators under the Student Teaching Standard that were most-commonly met among
rated programs and minimally sufficient to generate a rating bump.2
After assigning GPA-requirement recommendations to group-A programs, and running
through the Student Teaching indicators for the remaining programs, some programs still did not
have a recommendation. For these programs, we turned back to the Selection Criteria Standard
and recommended that all remaining (group-B) programs move their GPA requirement to 3.0. At
the conclusion of our recommendation process most programs had been assigned a
recommendation (89.5 percent of the experimental sample). For the remaining programs there was
no recommendation we could make that would lead to an improved rating (e.g., programs that
nearly or fully satisfied the Selection Criteria and Student Teaching Standards already, including
those housed in a highly selective institution university regardless of their own GPA requirement).
Table A.1 shows the share of all rated programs in the NCTQ database that satisfied each
of the six focal indicators in the 2013 Teacher Prep Review.3 The table is meant to give an
empirical sense of the ease with which each indicator can be met. Note that only 9.4 percent of
rated programs met the GPA requirement. This perhaps implies that it is difficult to attain this
indicator, but it is important to recognize that this raw summary statistic does not distinguish
between programs with GPA requirements “close” and “far” from the 3.0 threshold. The 9.4-
percent figure may overstate the difficulty of implementing this change for programs with GPA
requirements already close to 3.0 (e.g., group-A), and understate it for programs further away (e.g.,
group-B). Among the Student Teaching indicators, indicator 14.1b is clearly the most-commonly
met. Indicators 14.1a and 14.2a are also met regularly, while indicators 14.2b and 14.3 are met less
often.
2 We did send out more complicated, multi-part recommendations to a very small fraction of programs (10 in total),
but our sample of such programs is so small that we cannot evaluate them and thus have excluded them from our
analysis. 3 For the GPA requirement, we report the total share of programs that require a GPA of 3.0 or higher, which is not
synonymous with NCTQ’s definition of the standard per above. We report the total share of programs that have a
GPA requirement of 3.0 or higher because this is the relevant aspect of the indicator for our recommendations.

A.2 Recommendation Procedure for Graduate Programs
We sent out letters to graduate programs at the same time as undergraduate programs – in
July of 2013, one month after the inaugural ratings were published in U.S. News. Our approach to
determining recommendations for graduate programs is conceptually similar to the approach we
describe in the previous section for undergraduate programs. However, for graduate programs we
focus on just two indicators under the Selection Criteria Standard: (a) whether the program
requires a 3.0 undergraduate GPA for admittance, and (b) whether the program utilizes a
standardized test (e.g., the GRE) or an audition in the admissions process (whether a program
meets the latter indicator does not depend on how the standardized test or audition is used). To
fully meet the Selection Criteria Standard, a graduate program must meet both of these indicators.
Unlike for undergraduate programs, graduate programs cannot rely on the selectivity of their
housing institution to help them meet the Selection Criteria Standard.
With just two focal indicators, the analog to Equation (A.1) for graduate programs can be
written as:
𝑅𝑗𝐺 = 𝐹(𝑋𝑗1
𝐺 , 𝑋𝑗2𝐺 , 𝑍𝑗
𝐺). (A.2)
Like terms in Equation (A.2) are as defined in Equation (A.1), with the exception that 𝑍𝑗𝐺 is
expanded to cover the rating on the Student Teaching Standard as well. Also, the analog to 𝑌𝑗𝑈𝐺 is
unnecessary in Equation (A.2) because graduate programs’ final ratings on the Selection Criteria
Standard are entirely a function of indicators 𝑋1𝐺 and 𝑋2
𝐺 .4 We again calculate 𝛥𝑅𝑗𝑘𝐺 for k=1,2,
restrict our attention to the indicator or indicators for which 𝛥𝑅𝑗𝑘𝐺 > 0 , and recommend that
graduate program j take action on the indicator that is easiest to satisfy.
Following our approach for undergraduate programs, we split graduate programs with GPA
requirements below 3.0 into group-A and group-B programs. We make group-A larger for the
graduate-program analysis to increase the number of programs that ultimately receive a GPA
recommendation. Specifically, for graduate programs we identify group-A programs as those with
an undergraduate GPA requirement between 2.50 and 2.99 (inclusive), and group-B programs as
those with a GPA requirement below 2.50.
The sequence that we used to determine recommendations for graduate programs was as
follows. First, we recommended moving to meet the GPA requirement indicator for all group-A
programs. Next, among group-B programs, we recommended adding the GRE as a consideration
in the admissions process for all programs that were not already using the GRE or an alternative,
equally-scored (by NCTQ) test or audition. Finally, for group-B programs already using the GRE
or a comparable test/audition, we recommended acting to meet the GPA requirement.
Table A.2 presents information analogous to what we show in Table A.1 but for graduate
programs. Among all rated graduate programs, 36.3 percent have an undergraduate GPA
requirement of at least 3.0 and 22.0 percent consider the GRE or an alternative standardized test
score/audition in the admissions process.
4 Graduate programs cannot benefit from institution-level selectivity like their undergraduate counterparts. Also note
that while NCTQ does add a ‘strong design’ designation to graduate programs based on racial diversity, this
designation does not influence the numeric scoring of this standard.

A.3 Sample Letter
Dear Dr. John Jacobson: email: [email protected]
As you know, the National Council on Teacher Quality (NCTQ) is working in collaboration with
U.S. News & World Report to evaluate teacher preparation programs in the United States. The
2013 edition of the Teacher Prep Review was published in U.S. News & World Report in June of
this year. Work is already underway for the 2014 edition, the results of which will also be
published in U.S. News & World Report.
We are writing because NCTQ has granted us broad access to the scoring data and rating
methodology that they used to determine program ratings for the 2013 Review. We have used
this information to analyze the rating for each undergraduate elementary education program in
U.S. News. Based on our analysis, we have developed customized recommendations to help
individual programs understand specific ways to improve their ratings. Our interest is in studying
the extent to which different programs elect to make changes.
Our analysis of your program indicates that one of the most effective ways in which you could
improve your program’s rating is to improve your rating on the Student Teaching Standard. In
particular, we analyzed different scenarios associated with changes to your program’s ratings on
key standards and determined that if your program communicated to school districts that
cooperating mentor teachers must be capable mentors, your rating on the Student Teaching
Standard would have risen from 0 to 2. Correspondingly, the overall rating of your
undergraduate elementary education program would have improved from 1 to 2 out of 4 stars
(where zero stars is the lowest possible rating). This recommendation is based on NCTQ’s
scoring methodology for the Student Teaching Standard. More information about this
methodology can be found on page(s) 9 of www.nctq.org/dmsView/SM_for_Std14.
We hope that the information provided in this letter is helpful as you consider changes to your
program. NCTQ will assess programmatic changes that you make and these will be factored into
your rating in the 2014 and future editions of the Teacher Prep Review if NCTQ is made aware
of them by December 1. If you have questions about this letter we would be happy to answer
them. You can reach us at [email protected]. For broader questions about NCTQ’s Teacher
Prep Review, or to inform NCTQ of program changes, please contact Robert Rickenbrode at
NCTQ directly; his email address is [email protected].
Sincerely,
Dan Goldhaber & Cory Koedel

Table A.1. Shares of all undergraduate elementary education programs that satisfied each of the six
focal NCTQ indicators
Share Satisfied
“Satisfy” Standard 1.1: GPA requirement is 3.0 or above 0.094
Satisfy Standard 14.1a: Require at least five student teaching
observations with written feedback
0.350
Satisfy Standard 14.1b: Require student teaching observations at
regular intervals
0.584
Satisfy Standard 14.2a: Communicate to school districts that
mentors must be capable
0.287
Satisfy Standard 14.2b: Communicate to school districts that
mentors must be effective instructors
0.117
Satisfy Standard 14.3: Asserts a critical role in the selection of
cooperating teachers
0.131
Notes:
1. All programs rated on each individual indicator are included in these tabulations regardless of whether they
have comprehensive ratings. For the GPA requirement all programs in the NCTQ database were rated, but only
56 percent of programs were rated on the Student Teaching Standard indicators. NCTQ was unable to obtain
sufficient data to rate programs on the Student Teaching Standard for programs that did not receive a rating.
2. The share of all programs satisfying indicator 1.1 as defined in this table is not the same as NCTQ’s definition.
NCTQ also allows programs to satisfy indicator 1.1 based on university-wide selection standards and racial
diversity considerations. In this table, we report the share of all programs with a minimum GPA requirement of
3.0 or higher, regardless of university-wide selectivity, because this is the relevant benchmark for our
intervention.
3. The share of all rated programs that met both indicators 14.1b and 14.2a, per the joint recommendation used
for some programs in our intervention, was 0.195. Satisfying the combination of both 14.1a and 14.1b alone
was not sufficient to generate a ratings increase conditional on zero satisfied indicators for the Student
Teaching Standard (thus the use of indicators 14.1b and 14.2a in the primary joint recommendation).
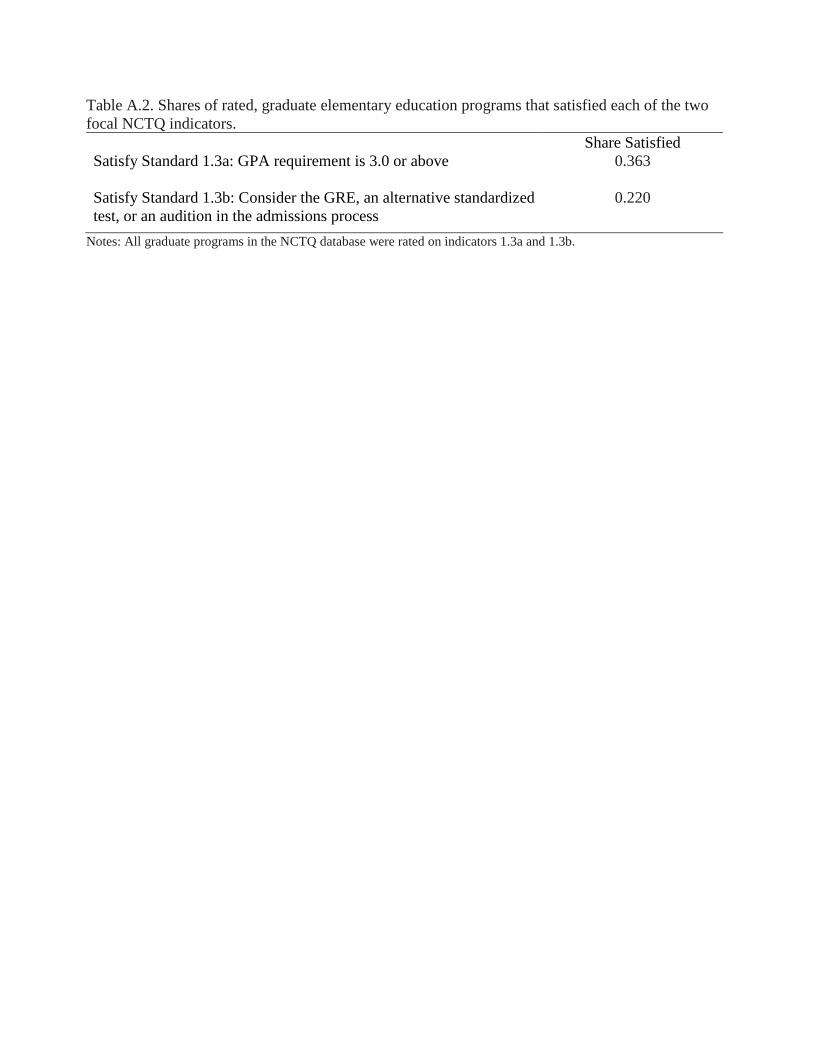
Table A.2. Shares of rated, graduate elementary education programs that satisfied each of the two
focal NCTQ indicators.
Share Satisfied
Satisfy Standard 1.3a: GPA requirement is 3.0 or above 0.363
Satisfy Standard 1.3b: Consider the GRE, an alternative standardized
test, or an audition in the admissions process
0.220
Notes: All graduate programs in the NCTQ database were rated on indicators 1.3a and 1.3b.
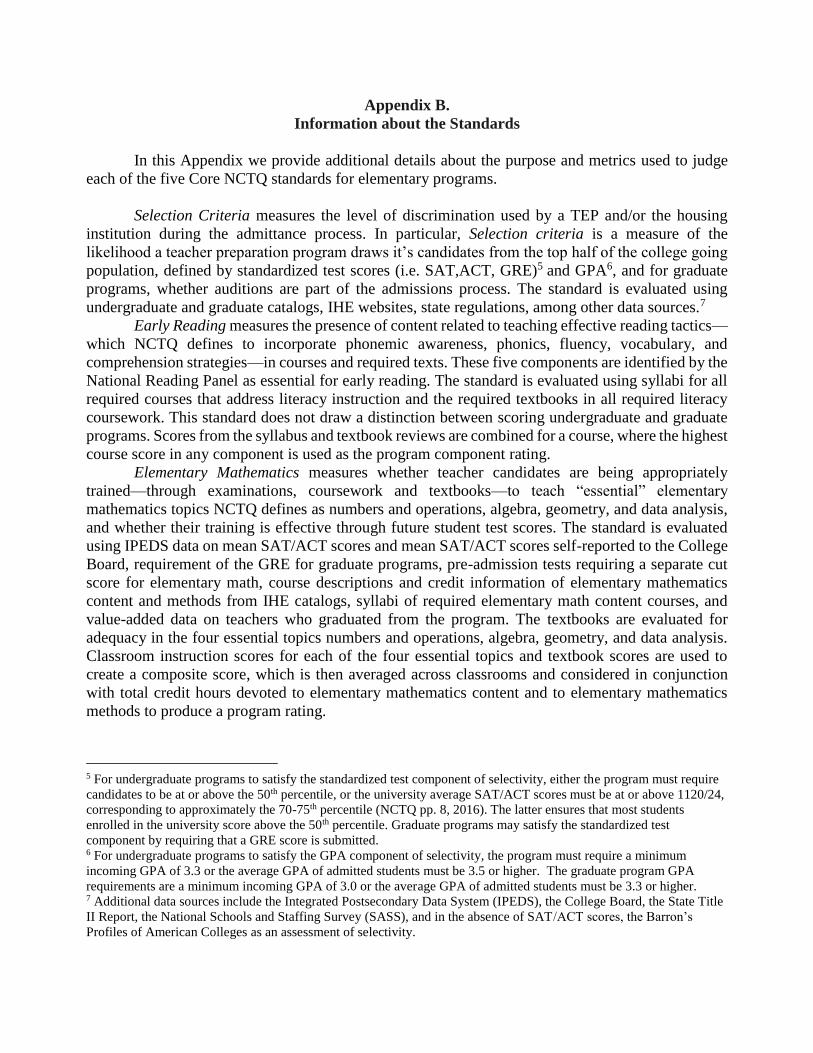
Appendix B.
Information about the Standards
In this Appendix we provide additional details about the purpose and metrics used to judge
each of the five Core NCTQ standards for elementary programs.
Selection Criteria measures the level of discrimination used by a TEP and/or the housing
institution during the admittance process. In particular, Selection criteria is a measure of the
likelihood a teacher preparation program draws it’s candidates from the top half of the college going
population, defined by standardized test scores (i.e. SAT,ACT, GRE)5 and GPA6, and for graduate
programs, whether auditions are part of the admissions process. The standard is evaluated using
undergraduate and graduate catalogs, IHE websites, state regulations, among other data sources.7
Early Reading measures the presence of content related to teaching effective reading tactics—
which NCTQ defines to incorporate phonemic awareness, phonics, fluency, vocabulary, and
comprehension strategies—in courses and required texts. These five components are identified by the
National Reading Panel as essential for early reading. The standard is evaluated using syllabi for all
required courses that address literacy instruction and the required textbooks in all required literacy
coursework. This standard does not draw a distinction between scoring undergraduate and graduate
programs. Scores from the syllabus and textbook reviews are combined for a course, where the highest
course score in any component is used as the program component rating.
Elementary Mathematics measures whether teacher candidates are being appropriately
trained—through examinations, coursework and textbooks—to teach “essential” elementary
mathematics topics NCTQ defines as numbers and operations, algebra, geometry, and data analysis,
and whether their training is effective through future student test scores. The standard is evaluated
using IPEDS data on mean SAT/ACT scores and mean SAT/ACT scores self-reported to the College
Board, requirement of the GRE for graduate programs, pre-admission tests requiring a separate cut
score for elementary math, course descriptions and credit information of elementary mathematics
content and methods from IHE catalogs, syllabi of required elementary math content courses, and
value-added data on teachers who graduated from the program. The textbooks are evaluated for
adequacy in the four essential topics numbers and operations, algebra, geometry, and data analysis.
Classroom instruction scores for each of the four essential topics and textbook scores are used to
create a composite score, which is then averaged across classrooms and considered in conjunction
with total credit hours devoted to elementary mathematics content and to elementary mathematics
methods to produce a program rating.
5 For undergraduate programs to satisfy the standardized test component of selectivity, either the program must require
candidates to be at or above the 50th percentile, or the university average SAT/ACT scores must be at or above 1120/24,
corresponding to approximately the 70-75th percentile (NCTQ pp. 8, 2016). The latter ensures that most students
enrolled in the university score above the 50th percentile. Graduate programs may satisfy the standardized test
component by requiring that a GRE score is submitted. 6 For undergraduate programs to satisfy the GPA component of selectivity, the program must require a minimum
incoming GPA of 3.3 or the average GPA of admitted students must be 3.5 or higher. The graduate program GPA
requirements are a minimum incoming GPA of 3.0 or the average GPA of admitted students must be 3.3 or higher. 7 Additional data sources include the Integrated Postsecondary Data System (IPEDS), the College Board, the State Title
II Report, the National Schools and Staffing Survey (SASS), and in the absence of SAT/ACT scores, the Barron’s
Profiles of American Colleges as an assessment of selectivity.

Elementary Content measures the level of preparation programs provide for elementary
content using individual course requirements, concentration requirements and proficiency
assessments in Literature and Composition, History and Geography, and Science.8 In the absence of
appropriate proficiency exams, college catalogs and syllabi are used to assess whether the program
course requirements comprehensively address each category above. Degree plans from the IHEs,
relevant IHE websites, textbook listings, admission-relevant documents, and state regulations are also
used to assess adequate coverage of these categories. Some programs had rigid course requirements
satisfying each category, where others offered students a choice in course pathways. In the 2013 and
2014 NCTQ scoring methodology, only required courses counted towards the standard9. In 2016,
NCTQ allowed for courses which students had the option to take to fulfill a program requirement to
count towards the standard, so long as most options available to the student covered one of the topics
above sufficiently.
Student Teaching measures the activity level of TEPs in ensuring candidates are having a
rigorous student teaching experience through sufficient observation and feedback and appropriate
mentors. Evaluation of the standard utilizes handbooks prepared by institutions pertaining to the
teacher preparation program or student teaching placements, observation instruments used by
university supervisors in student teaching placements, contracts between institutions and school
districts regarding placements, syllabi for seminars and courses relating to student teaching, and
school districts’ documents and policies relevant to student teaching placements. Full satisfaction of
the standard requires five or more student teaching observations by the university supervisor at regular
intervals with written feedback, cooperating teachers required to be proven capable mentors or receive
mentorship training, and required to be effective instructors (measured by student outcomes), and
programs must play an active role in selecting cooperating teachers, as demonstrated by program
documents on student teaching requirements.
8 Each of these subjects have identified sub-topics to ensure sufficient generality of the subject material. Literature and
Composition has the sub-topics World Literature, American Literature, Writing, Grammar and Composition, and
Children’s Literature. History and Geography has the sub-topics Early American History, Modern American History or
Government, Ancient World History, and Modern World History. Science has the sub-topics Biology, Chemistry, and
Physics/Physical Science/Earth Science. 9 Students could be exempt from course requirements based on testing.

19
Appendix C.
Supplementary Tables
Table C.1. Replication of Table 6 for programs in the NCTQ sample in all years
Dependent variable is NCTQ summative rating in year: 2013 2014 2016 (1) (2) (3) (4) (5) (6)
% Asian -0.007** -0.001 -0.004 -0.001 -0.003 -0.003
(0.003) (0.006) (0.005) (0.005) (0.005) (0.004)
% URM 0.001 -0.001 0.001 -0.001 -0.002 -0.002
(0.002) (0.002) (0.002) (0.002) (0.002) (0.002)
% Multiracial 0.000 -0.018 -0.008 -0.035* 0.004 -0.002
(0.016) (0.017) (0.016) (0.019) (0.008) (0.011)
% Female -0.003 0.003 -0.004 0.004 -0.002 0.001
(0.006) (0.006) (0.007) (0.007) (0.003) (0.002)
Median college/university entrance
exams 0.003*** 0.002*** 0.003*** 0.003*** 0.002*** 0.002***
(0.000) (0. 000) (0. 000) (0. 000) (0.000) (0.000)
Labor market area share of TEP
graduates 0.028 0.071 0.152* 0.086 0.106 0.019
(0.077) (0.097) (0.091) (0.087) (0.070) (0.056)
Average undergraduate tuition
(in thousands of dollars) 0.010* 0.019*** 0.013** 0.020*** 0.011*** 0.015***
(0.006) (0.005) (0.005) (0.005) (0.004) (0.004)
Average graduate tuition
(in thousands of dollars) -0.013 -0.008 -0.010 -0.007 -0.010* -0.008
(0.008) (0.008) (0.008) (0.008) (0.006) (0.006)
2012-2013 Proportion of university
enrolled in TEP -0.156 0.188 -0.217* 0.032 -0.174* 0.042
(0.123) (0.119) (0.131) (0.119) (0.105) (0.103)
Proportion of students in LMA
enrolled in charter program -1.767** -0.430 -1.228 -0.884 0.483 -0.860
(0.805) (0.622) (0.832) (0.747) (0.855) (0.870)
State charter laws present 0.108 0.056 0.153*
(0.126) (0.097) (0.082)
Private for-profit -0.086 -0.290*** -0.094 -0.187** -0.108* -0.159***
(0.103) (0.076) (0.089) (0.093) (0.056) (0.053)
Private not-for-profit 0.056 0.372* 0.087 0.326 0.285 0.266
(0.157) (0.214) (0.240) (0.266) (0.282) (0.302)
Graduate program -0.246 -0.030 -0.163 0.014 -0.491*** -0.387***
(0.173) (0.176) (0.188) (0.201) (0.117) (0.137)
State fixed effects No Yes No Yes No Yes
R-squared 0.358 0.535 0.313 0.489 0.377 0.483
N (Elementary programs) 460 460 460 460 911 911
Notes: Standard errors, clustered at the state level, are reported in parentheses. Explanatory variable missing values are mean
imputed with indicator controls for missingness. Median college/university entrance exams are the university median SAT scores
when only SAT scores are available. When both SAT and ACT scores are available it is the average of the SAT and the ACT
median converted to its SAT equivalent (where the conversation of the ACT to the SAT scale is based on College Board SAT/ ACT
concordance tables). When only ACT scores are available it is the ACT score converted to its SAT equivalent. Tuition variables are
averaged over in state and out of state and divided by 1,000 for representability of coefficients.
*** p < .01 ** p < .05 * p < .1

20
Table C.2. Replication of Table 7 for programs rated in all years
Dependent variable is NCTQ summative rating in year: 2014 2016 (1) (2) (3) (4)
% Asian 0.002 0.001 0.000 -0.001
(0.004) (0.004) (0.004) (0.005)
% URM 0.000 0.000 -0.001 -0.001
(0.001) (0.002) (0.001) (0.002)
% Multiracial -0.008 -0.025 0.002 -0.006
(0.009) (0.015) (0.009) (0.013)
% Female -0.001 0.002 -0.005 -0.002
(0.003) (0.003) (0.005) (0.005)
Median college/university entrance exams 0.001* 0.001*** 0.001*** 0.001***
(0.000) (0.000) (0.000) (0.000)
Labor market area share of TEP graduates 0.092 0.008 0.007 -0.122
(0.057) (0.071) (0.071) (0.092)
Average undergraduate tuition
(in thousands of dollars) -0.001 0.002 0.002 0.005
(0.003) (0.004) (0.004) (0.006)
Average graduate tuition
(in thousands of dollars) -0.002 -0.001 -0.007 -0.005
(0.005) (0.005) (0.005) (0.005)
2012-2013 Proportion of university enrolled
in TEP -0.092 -0.102 -0.129* -0.173**
(0.061) (0.068) (0.076) (0.076)
Proportion of students in LMA enrolled in
charter program -0.001 -0.380 -0.082 -1.262
(0.569) (0.356) (0.846) (0.778)
State charter laws present 0.026 0.047
(0.081) (0.098)
Private for-profit -0.042 0.023 -0.101 -0.080
(0.071) (0.057) (0.090) (0.094)
Private not-for-profit -0.054 0.055 0.320*** 0.415***
(0.113) (0.122) (0.123) (0.145)
Graduate program -0.03 0.000 -0.316** -0.313**
(0.106) (0.117) (0.124) (0.150)
2013 NCTQ Rating Yes Yes Yes Yes
State fixed effects No Yes No Yes
R-squared 0.717 0.788 0.549 0.629
N (Elementary programs) 460 460 460 460
Notes: Standard errors, clustered at the state level, are reported in parentheses. All regressions control for 2013
NCTQ rating. Median college/university entrance exams are the university median SAT scores when only SAT
scores are available. When both SAT and ACT scores are available it is the average of the SAT and the ACT
median converted to its SAT equivalent (where the conversation of the ACT to the SAT scale is based on
College Board SAT/ ACT concordance tables). When only ACT scores are available it is the ACT score
converted to its SAT equivalent. Tuition variables are averaged over in state and out of state and divided by
1,000 for representability of coefficients.
*** p < .01 ** p < .05 * p < .1
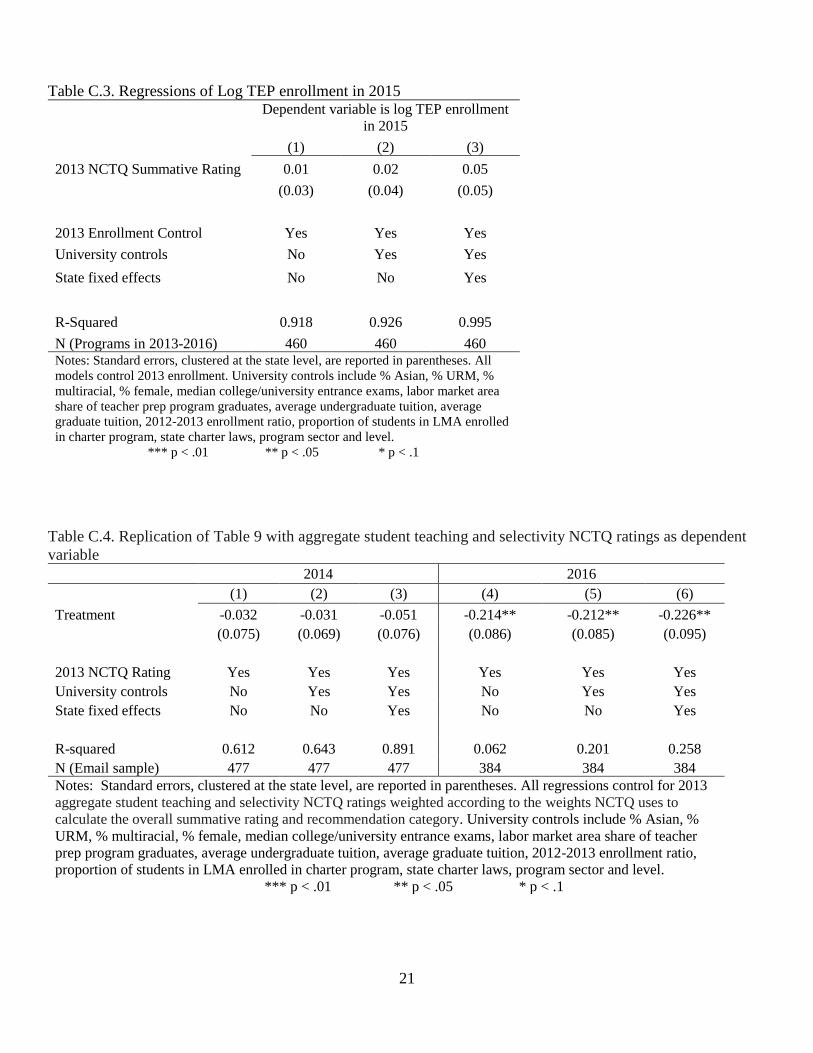
21
Table C.3. Regressions of Log TEP enrollment in 2015
Dependent variable is log TEP enrollment
in 2015
(1) (2) (3)
2013 NCTQ Summative Rating 0.01 0.02 0.05
(0.03) (0.04) (0.05)
2013 Enrollment Control Yes Yes Yes
University controls No Yes Yes
State fixed effects No No Yes
R-Squared 0.918 0.926 0.995
N (Programs in 2013-2016) 460 460 460 Notes: Standard errors, clustered at the state level, are reported in parentheses. All
models control 2013 enrollment. University controls include % Asian, % URM, %
multiracial, % female, median college/university entrance exams, labor market area
share of teacher prep program graduates, average undergraduate tuition, average
graduate tuition, 2012-2013 enrollment ratio, proportion of students in LMA enrolled
in charter program, state charter laws, program sector and level.
*** p < .01 ** p < .05 * p < .1
Table C.4. Replication of Table 9 with aggregate student teaching and selectivity NCTQ ratings as dependent
variable 2014 2016 (1) (2) (3) (4) (5) (6)
Treatment -0.032 -0.031 -0.051 -0.214** -0.212** -0.226**
(0.075) (0.069) (0.076) (0.086) (0.085) (0.095)
2013 NCTQ Rating Yes Yes Yes Yes Yes Yes
University controls No Yes Yes No Yes Yes
State fixed effects No No Yes No No Yes
R-squared 0.612 0.643 0.891 0.062 0.201 0.258
N (Email sample) 477 477 477 384 384 384
Notes: Standard errors, clustered at the state level, are reported in parentheses. All regressions control for 2013
aggregate student teaching and selectivity NCTQ ratings weighted according to the weights NCTQ uses to
calculate the overall summative rating and recommendation category. University controls include % Asian, %
URM, % multiracial, % female, median college/university entrance exams, labor market area share of teacher
prep program graduates, average undergraduate tuition, average graduate tuition, 2012-2013 enrollment ratio,
proportion of students in LMA enrolled in charter program, state charter laws, program sector and level.
*** p < .01 ** p < .05 * p < .1