Traceca Corridor Traffic and Feasibility Studies - TNREG · PDF fileTraceca Corridor Traffic...
60
Traceca Corridor Traffic and Feasibility Studies - TNREG 9803 Module E : Transport of crude oil and oil products on the Caspian Sea Feasibility study for the rehabilitation of Dubendi Oil Terminal (task E3) April 2001
Transcript of Traceca Corridor Traffic and Feasibility Studies - TNREG · PDF fileTraceca Corridor Traffic...

Traceca Corridor Traffic and Feasibility Studies - TNREG 9803
Module E :
Transport of crude oil and oil products on the Caspian Sea
Feasibility study for the rehabilitation of Dubendi Oil Terminal (task E3)
April 2001
Report Cover Page
Project Title : Traceca Corridor - Traffic and Feasibility Studies Module E Title : Transport of crude oil and oil products on the Caspian Sea Project Number : TNREG 9803 Module E Countries : Azerbaijan, Kazakhstan and Turkmenistan Local Operators EC Consultant Azerbaijan Mr. Ikram Sadikov Headquarters Head of Transport Dept. Bceom Société Française d'Ingénierie Ministry of Economy Place des Frères Montgolfier Baku 78286 Guyancourt Cedex, France Kazakhstan Project office Mr. Talgat Abylgazin 9 Sultanov Street, Appt. 67 General Director Baku, Azerbaijan Aktau Commercial Sea Port Mr. Ph. Delaporte & Mr. A. Merrien Aktau [email protected] [email protected] Sub-Consultant for Module E Turkmenistan Port of Marseilles Authority, France Mr. Bekmyrat Gurbanmuradov Mr. J.M. Bocognano General Director [email protected] Turkmen Maritime Lines Turkmenbashi [email protected] Date of report : 25 April 2001 Reporting period : February to April 2001 Authors of report : André Merrien and Jean-Michel Bocognano EC Monitoring team [name] [signature] [date] EC Delegation [name] [signature] [date] Tacis Bureau [task manager] [name] [signature] [date]
Transport of crude oil and oil products on the Caspian Sea - European Commission Tacis-Traceca Programme ____________________________________________________________________________________________________________
________________________________________________________________________ Feasibility Study for the Rehabilitation of Dubendi Oil Terminal - April 2001
Table of contents
1. Project synopsis for module E ......................................................................................................................4
2. Summary and conclusions...........................................................................................................................5
3. Oil flow projections.......................................................................................................................................7
4. Current condition of Dubendi Oil Terminal...................................................................................................8
4.1 General .................................................................................................................................................8 4.2 Navigation channel ...............................................................................................................................8 4.3 Breakwater............................................................................................................................................9 4.4 Piers......................................................................................................................................................9 4.5 Tank farms..........................................................................................................................................10 4.6 Rail-tank-car loading station ...............................................................................................................10 4.7 Waste Water Treatment Plant ............................................................................................................11 4.8 Oil pipe networks ................................................................................................................................11 4.9 Pump stations .....................................................................................................................................11 4.10 Power stations and electricity networks ..........................................................................................12 4.11 Administrative buildings ..................................................................................................................12 4.12 Miscellaneous deficiencies .............................................................................................................12
5. Rehabilitation plans....................................................................................................................................13
5.1 Short-term rehabilitation plan..............................................................................................................14 5.2 Medium-term rehabilitation plan .........................................................................................................15 5.3 Long-term rehabilitation plan ..............................................................................................................16 5.4 Investment costs.................................................................................................................................17
6. Ownership and operation schemes ...........................................................................................................17
7. Financial assessment ................................................................................................................................18
7.1 General ...............................................................................................................................................18 7.2 Computation of revenues....................................................................................................................19 7.3 Computation of operating expenses ...................................................................................................20 7.4 Financial results ..................................................................................................................................22
___________________
Annex 1: Abbreviations & Acronyms, References and Staff List Annex 2: Photographs of Dubendi Oil Terminal Annex 3: Financial tables Annex 4: Maps and drawings
Transport of crude oil and oil products on the Caspian Sea - European Commission Tacis-Traceca Programme ____________________________________________________________________________________________________________
________________________________________________________________________ Feasibility Study for the Rehabilitation of Dubendi Oil Terminal - April 2001
4
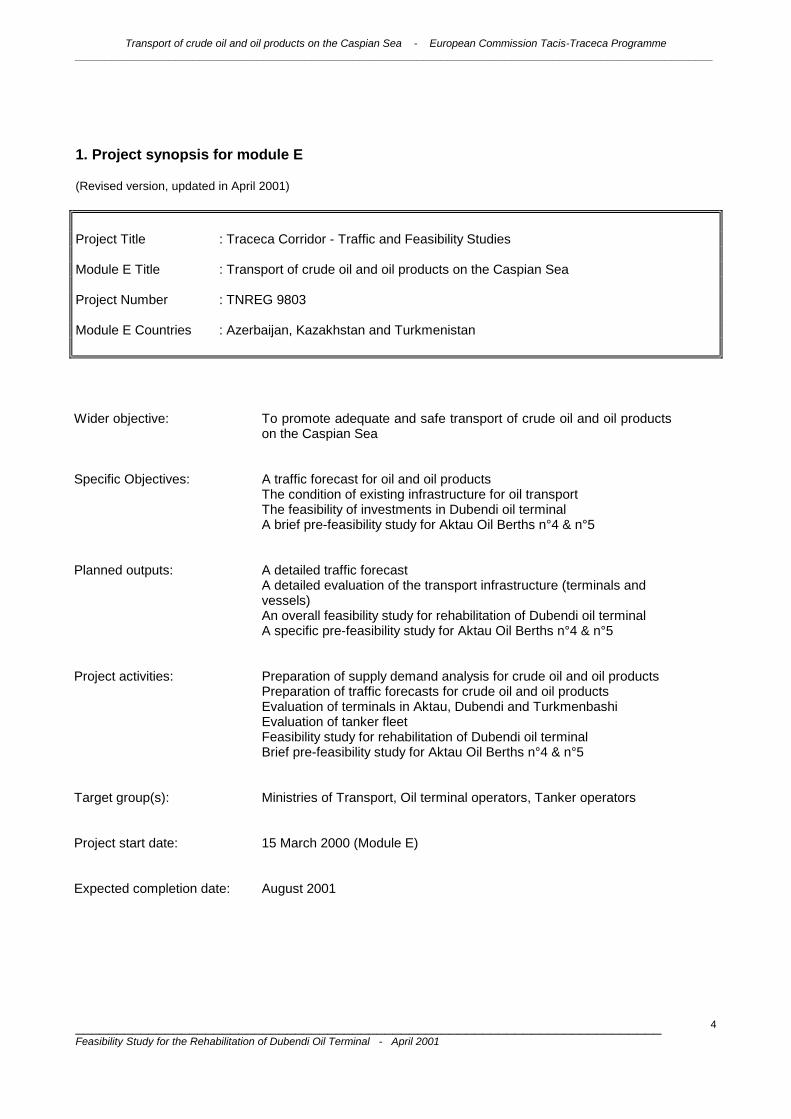
1. Project synopsis for module E
(Revised version, updated in April 2001)
Project Title : Traceca Corridor - Traffic and Feasibility Studies Module E Title : Transport of crude oil and oil products on the Caspian Sea Project Number : TNREG 9803 Module E Countries : Azerbaijan, Kazakhstan and Turkmenistan
Wider objective: To promote adequate and safe transport of crude oil and oil products
on the Caspian Sea
Specific Objectives: A traffic forecast for oil and oil products The condition of existing infrastructure for oil transport The feasibility of investments in Dubendi oil terminal A brief pre-feasibility study for Aktau Oil Berths n°4 & n°5
Planned outputs: A detailed traffic forecast A detailed evaluation of the transport infrastructure (terminals and vessels) An overall feasibility study for rehabilitation of Dubendi oil terminal A specific pre-feasibility study for Aktau Oil Berths n°4 & n°5
Project activities: Preparation of supply demand analysis for crude oil and oil products Preparation of traffic forecasts for crude oil and oil products Evaluation of terminals in Aktau, Dubendi and Turkmenbashi Evaluation of tanker fleet Feasibility study for rehabilitation of Dubendi oil terminal Brief pre-feasibility study for Aktau Oil Berths n°4 & n°5
Target group(s): Ministries of Transport, Oil terminal operators, Tanker operators
Project start date: 15 March 2000 (Module E)
Expected completion date:
August 2001
Transport of crude oil and oil products on the Caspian Sea - European Commission Tacis-Traceca Programme ____________________________________________________________________________________________________________
________________________________________________________________________ Feasibility Study for the Rehabilitation of Dubendi Oil Terminal - April 2001
5
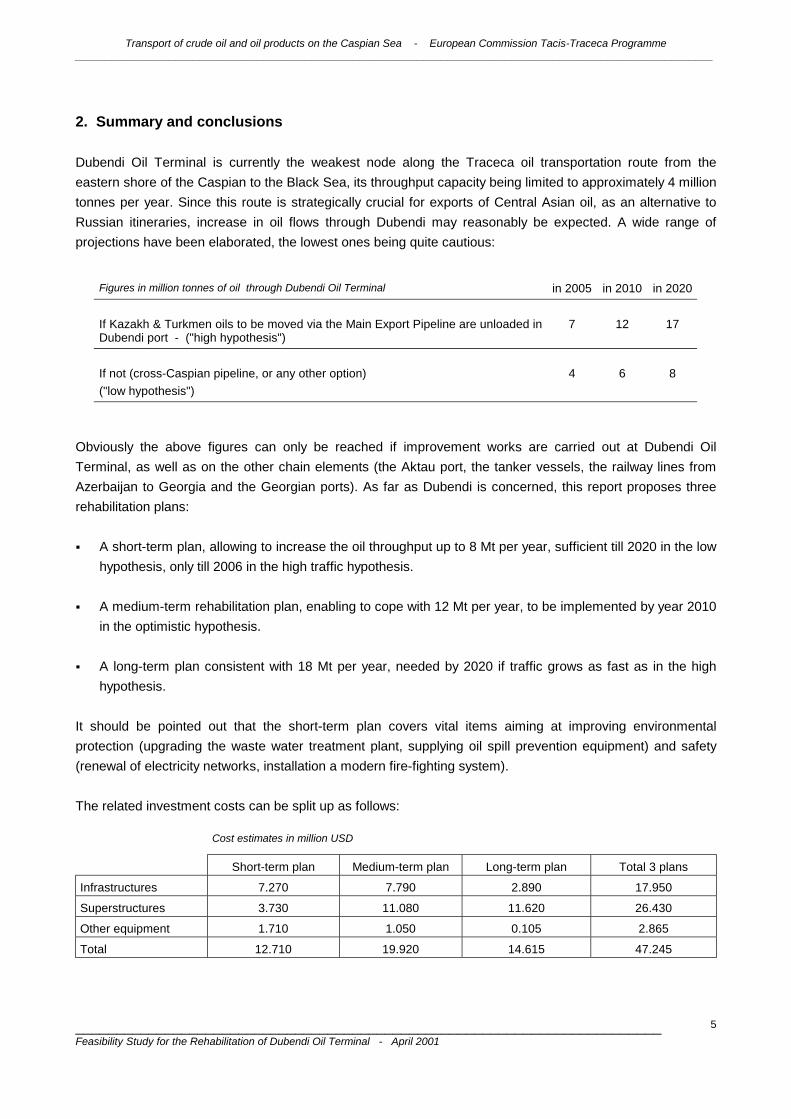
2. Summary and conclusions Dubendi Oil Terminal is currently the weakest node along the Traceca oil transportation route from the eastern shore of the Caspian to the Black Sea, its throughput capacity being limited to approximately 4 million tonnes per year. Since this route is strategically crucial for exports of Central Asian oil, as an alternative to Russian itineraries, increase in oil flows through Dubendi may reasonably be expected. A wide range of projections have been elaborated, the lowest ones being quite cautious:
Figures in million tonnes of oil through Dubendi Oil Terminal
in 2005
in 2010
in 2020
If Kazakh & Turkmen oils to be moved via the Main Export Pipeline are unloaded in Dubendi port - ("high hypothesis")
7
12
17
If not (cross-Caspian pipeline, or any other option) ("low hypothesis")
4
6
8
Obviously the above figures can only be reached if improvement works are carried out at Dubendi Oil Terminal, as well as on the other chain elements (the Aktau port, the tanker vessels, the railway lines from Azerbaijan to Georgia and the Georgian ports). As far as Dubendi is concerned, this report proposes three rehabilitation plans: ! A short-term plan, allowing to increase the oil throughput up to 8 Mt per year, sufficient till 2020 in the low
hypothesis, only till 2006 in the high traffic hypothesis. ! A medium-term rehabilitation plan, enabling to cope with 12 Mt per year, to be implemented by year 2010
in the optimistic hypothesis. ! A long-term plan consistent with 18 Mt per year, needed by 2020 if traffic grows as fast as in the high
hypothesis. It should be pointed out that the short-term plan covers vital items aiming at improving environmental protection (upgrading the waste water treatment plant, supplying oil spill prevention equipment) and safety (renewal of electricity networks, installation a modern fire-fighting system). The related investment costs can be split up as follows:
Cost estimates in million USD
Short-term plan Medium-term plan Long-term plan Total 3 plans
Infrastructures 7.270 7.790 2.890 17.950
Superstructures 3.730 11.080 11.620 26.430
Other equipment 1.710 1.050 0.105 2.865
Total 12.710 19.920 14.615 47.245
Transport of crude oil and oil products on the Caspian Sea - European Commission Tacis-Traceca Programme ____________________________________________________________________________________________________________
________________________________________________________________________ Feasibility Study for the Rehabilitation of Dubendi Oil Terminal - April 2001
6
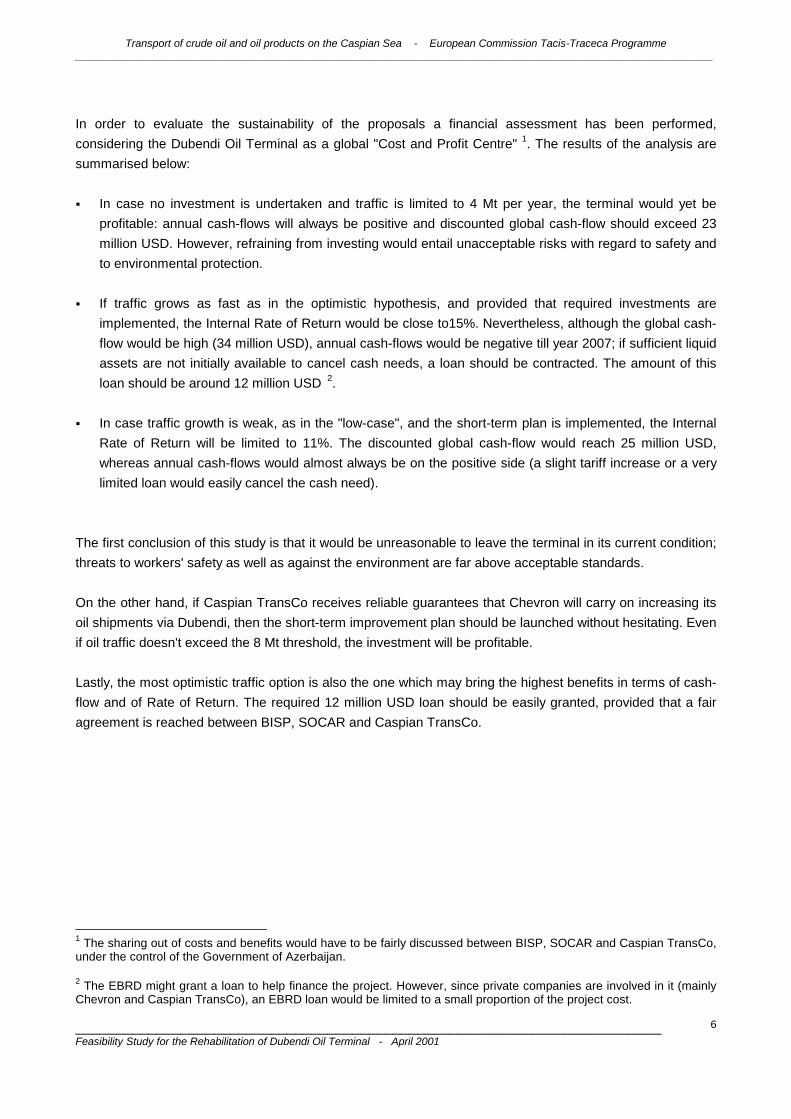
In order to evaluate the sustainability of the proposals a financial assessment has been performed, considering the Dubendi Oil Terminal as a global "Cost and Profit Centre" 1. The results of the analysis are summarised below: ! In case no investment is undertaken and traffic is limited to 4 Mt per year, the terminal would yet be
profitable: annual cash-flows will always be positive and discounted global cash-flow should exceed 23 million USD. However, refraining from investing would entail unacceptable risks with regard to safety and to environmental protection.
! If traffic grows as fast as in the optimistic hypothesis, and provided that required investments are
implemented, the Internal Rate of Return would be close to15%. Nevertheless, although the global cash-flow would be high (34 million USD), annual cash-flows would be negative till year 2007; if sufficient liquid assets are not initially available to cancel cash needs, a loan should be contracted. The amount of this loan should be around 12 million USD 2.
! In case traffic growth is weak, as in the "low-case", and the short-term plan is implemented, the Internal
Rate of Return will be limited to 11%. The discounted global cash-flow would reach 25 million USD, whereas annual cash-flows would almost always be on the positive side (a slight tariff increase or a very limited loan would easily cancel the cash need).
The first conclusion of this study is that it would be unreasonable to leave the terminal in its current condition; threats to workers' safety as well as against the environment are far above acceptable standards. On the other hand, if Caspian TransCo receives reliable guarantees that Chevron will carry on increasing its oil shipments via Dubendi, then the short-term improvement plan should be launched without hesitating. Even if oil traffic doesn't exceed the 8 Mt threshold, the investment will be profitable. Lastly, the most optimistic traffic option is also the one which may bring the highest benefits in terms of cash-flow and of Rate of Return. The required 12 million USD loan should be easily granted, provided that a fair agreement is reached between BISP, SOCAR and Caspian TransCo.
1 The sharing out of costs and benefits would have to be fairly discussed between BISP, SOCAR and Caspian TransCo, under the control of the Government of Azerbaijan. 2 The EBRD might grant a loan to help finance the project. However, since private companies are involved in it (mainly Chevron and Caspian TransCo), an EBRD loan would be limited to a small proportion of the project cost.
Transport of crude oil and oil products on the Caspian Sea - European Commission Tacis-Traceca Programme ____________________________________________________________________________________________________________
________________________________________________________________________ Feasibility Study for the Rehabilitation of Dubendi Oil Terminal - April 2001
7
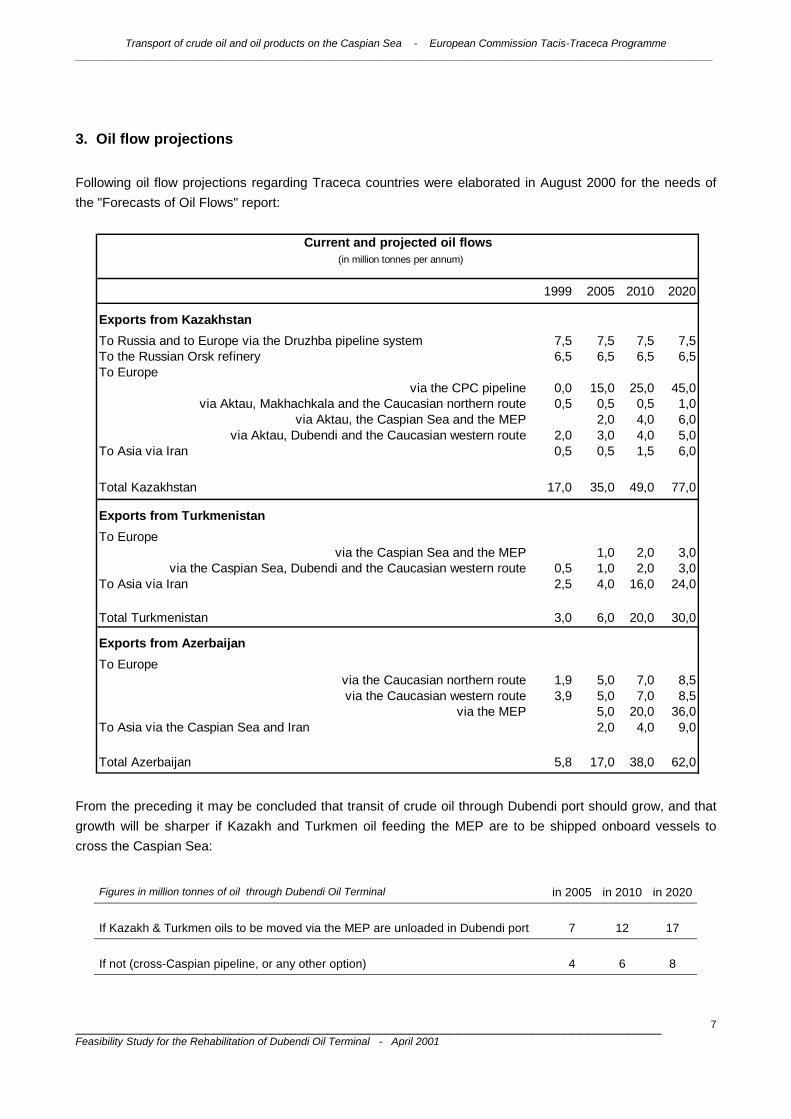
3. Oil flow projections Following oil flow projections regarding Traceca countries were elaborated in August 2000 for the needs of the "Forecasts of Oil Flows" report:
From the preceding it may be concluded that transit of crude oil through Dubendi port should grow, and that growth will be sharper if Kazakh and Turkmen oil feeding the MEP are to be shipped onboard vessels to cross the Caspian Sea:
Figures in million tonnes of oil through Dubendi Oil Terminal
in 2005
in 2010
in 2020
If Kazakh & Turkmen oils to be moved via the MEP are unloaded in Dubendi port
7
12
17
If not (cross-Caspian pipeline, or any other option)
4
6
8
1999 2005 2010 2020
Exports from KazakhstanTo Russia and to Europe via the Druzhba pipeline system 7,5 7,5 7,5 7,5To the Russian Orsk refinery 6,5 6,5 6,5 6,5To Europe
via the CPC pipeline 0,0 15,0 25,0 45,0via Aktau, Makhachkala and the Caucasian northern route 0,5 0,5 0,5 1,0
via Aktau, the Caspian Sea and the MEP 2,0 4,0 6,0via Aktau, Dubendi and the Caucasian western route 2,0 3,0 4,0 5,0
To Asia via Iran 0,5 0,5 1,5 6,0
Total Kazakhstan 17,0 35,0 49,0 77,0
Exports from TurkmenistanTo Europe
via the Caspian Sea and the MEP 1,0 2,0 3,0via the Caspian Sea, Dubendi and the Caucasian western route 0,5 1,0 2,0 3,0
To Asia via Iran 2,5 4,0 16,0 24,0
Total Turkmenistan 3,0 6,0 20,0 30,0
Exports from AzerbaijanTo Europe
via the Caucasian northern route 1,9 5,0 7,0 8,5via the Caucasian western route 3,9 5,0 7,0 8,5
via the MEP 5,0 20,0 36,0To Asia via the Caspian Sea and Iran 2,0 4,0 9,0
Total Azerbaijan 5,8 17,0 38,0 62,0
Current and projected oil flows (in million tonnes per annum)
Transport of crude oil and oil products on the Caspian Sea - European Commission Tacis-Traceca Programme ____________________________________________________________________________________________________________
________________________________________________________________________ Feasibility Study for the Rehabilitation of Dubendi Oil Terminal - April 2001
8
4. Current condition of Dubendi Oil Terminal
4.1 General In the Soviet times the Baku area was a major centre for oil processing. Baku refineries had a capacity of up to 25 million tonnes of crude oil per year. They were processing not only oil extracted in the area but also significant volumes brought from other parts of the Soviet Union, particularly Kazakhstan and Turkmenistan. On the other hand large volumes of petroleum products were exported in direction of those two countries with destinations as far as Siberia or even Kamchatka. The terminal facilities of the Baku port were at one time handling inflows and outflows, particularly at pier n°20. However, to cope with increasing flows, at the beginning of the sixties it was decided to build a dedicated oil terminal on the Absheron Peninsula in a site called Dubendi that is naturally well protected by the Pirallachy island from the east and from the south (the island is connected to the mainland by an artificial dike). Dubendi is at a distance of 47 km from Baku by land and 92 nautical miles by sea. Construction of the port started in 1965. Two kinds of flows are presently transiting by Dubendi: • Crude oil extracted in the region of the Absheron Peninsula, which reaches Dubendi by underwater
pipelines. It is shipped by rail to the SOCAR storage facilities in Sangachal, 60 km south of Baku, before being forwarded by the AIOC pipeline to the Supsa port, on the Black Sea.
• Crude oil imported by tanker either (the bulk of it) from Aktau, Kazakhstan, from where it is mainly
shipped by Tengizchevroil, or from Okarem or Cheleken, Turkmenistan, where it is produced by Mobil and Total. This oil is sent to Batumi port on the Black Sea by the Caspian TransCo Company.
Dubendi Oil Terminal mainly consists of a navigation channel, four piers sheltered by a breakwater as well as onshore facilities: tank-farms, a rail-tank-car loading station, a waste water treatment plant, oil pipe networks, pump stations, power stations, electricity and water networks, administrative buildings. All infrastructures are owned by BISP whereas most unloading facilities, pipe systems and tank-farms belong to SOCAR. There is no bunkering station left in Dubendi. Tankers refuel in other ports of call.
4.2 Navigation channel The navigation channel starts from the 10 m hydrographic contour line, and was initially dredged down to 10 m below the Caspian Sea chart datum. It is 100 m wide on the sea bed and stretches along 2.5 nautical miles. Due to northern wave action the channel is subject to continuous siltation. Frequent dredging works have been required to maintain water depths, however insufficient since a shoal currently reduces the depth

Transport of crude oil and oil products on the Caspian Sea - European Commission Tacis-Traceca Programme ____________________________________________________________________________________________________________
________________________________________________________________________ Feasibility Study for the Rehabilitation of Dubendi Oil Terminal - April 2001
9
to 6.5 m in the vicinity of the breakwater head. The port basin was also initially dredged to 10 m, but siltation has resulted in restricted depths: 9 m in the turning area, 8.5 m to 7.5 m along the berths 3. The channel is marked with four port and four starboard buoys, which are highly corroded and partly not working. In addition, two leading lines are marked by onshore beacons. The beacons in the first section are in poor condition but still working, whilst beacons in the second section are out of operation 4.
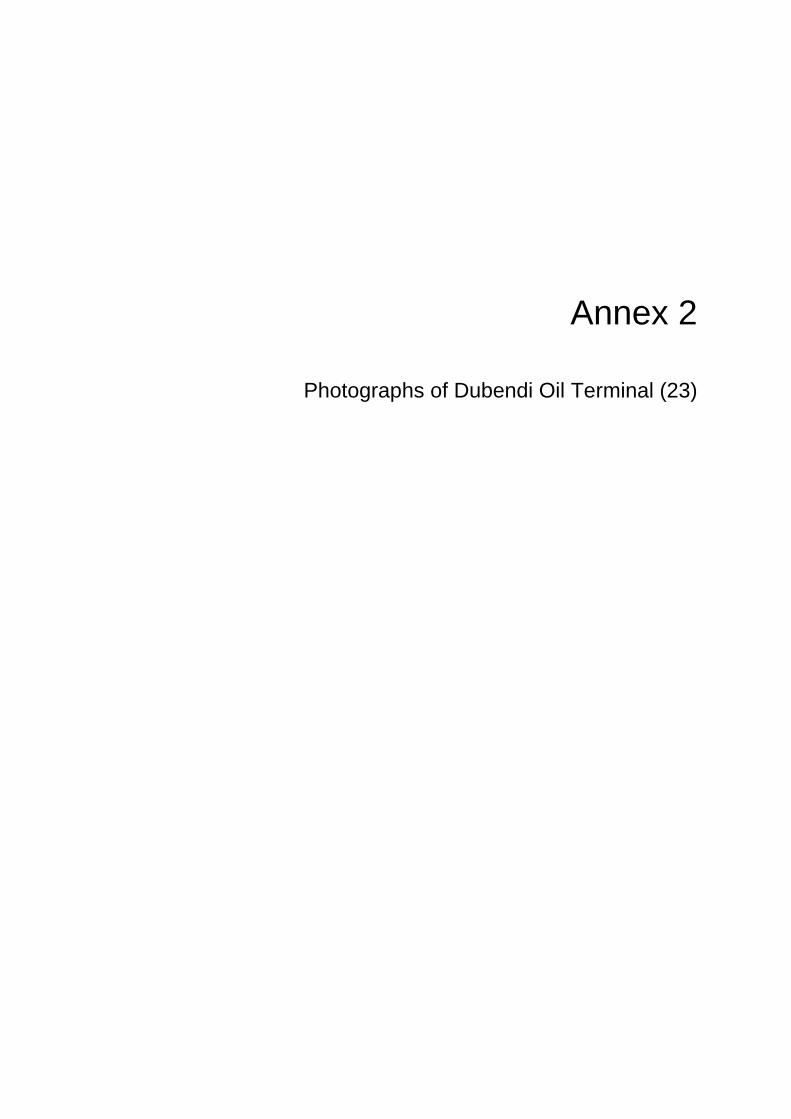
4.3 Breakwater The breakwater is of rubble mound type. Its total length is 1,035 m, consisting of a 250 m long root, a 540 m long trunk section and a 245 m long head. The elevation of the top is 3 m above the Caspian chart datum. The root section is protected with quarry stones, the trunk stretch is covered with 4.6 tonne concrete cubes whilst the head part is protected with 10 to 15 tonne concrete cubes. The end of the breakwater head is bordered by a sheet pile wall that reduces the structure width. Due to the increase in the Caspian Sea level incoming waves are currently stronger than those which were taken into account at the design phase; this is the reason why several parts of the armour layer and of the cap failed, including at the head section, as shown on the attached photos. There is almost a breach between connection with pier n°2 and connection with pier n°5. The inner part of the breakwater is bordered with reinforced concrete piles supporting pipelines which are generally severally damaged, except between the root and pier n°1. Diver inspections revealed that piles are damaged underwater too. Floodlighting system along the breakwater is destroyed, as well as all water and electricity networks.
4.4 Piers Four piers were constructed from 1972 to 1975, to allow berthing of tankers: pier n°1, pier n°2, pier n°3 and pier n°5. Pier n°4 was initially foreseen, close to pier n°3, but finally not built. Piers n°2 and n°5 were never used for oil traffic, they only accommodated tug boats, dredgers and other port vessels. Each pier has two symmetrical berths, design capacity of each berth being 2.5 Mt per annum. Pier n°1 and pier n°3 are operated by Caspian TransCo for unloading crude oil shipped from Aktau, Okarem and Cheleken 5. 3 The CSC tanker fleet operating in the Caspian Sea consists of 33 tankers: ! 3 type “Kafur Mamedov” tankers: 12,300 dwt Mean load draught: 8.00 m ! 9 type “Absheron” tankers: 7,400 dwt Mean load draught: 5.3 m ! 21 type “Gal Shikhlinskiy” tankers: 5,500 dwt Mean load draught: 4.15 m The three largest tankers were recently purchased with the objective of reducing transportation costs. However this acquisition didn't provide the expected benefit so far, since water depths in Aktau and Dubendi are not sufficient to accommodate fully loaded 12,300 dwt tankers. 4 A specific project has been undertaken to upgrade navigation aids in Baku and Dubendi ports, to be implemented in 2001 under the Traceca programme. This project includes supply of radar equipment, Global Maritime Distress Safety System, radio communication equipment, renewal of buoys, beacons, leading lights and lighthouses. 5 Pier n°3 is also equipped for unloading refined oil products. However throughput of refined oil has fallen below a very limited level in Dubendi (Baku city port has dedicated berths for unloading refined oil, originating from Turkmenbashi refinery and mainly destined to Azerbaijan and to western Europe).
Transport of crude oil and oil products on the Caspian Sea - European Commission Tacis-Traceca Programme ____________________________________________________________________________________________________________
________________________________________________________________________ Feasibility Study for the Rehabilitation of Dubendi Oil Terminal - April 2001
10
These piers are made of reinforced concrete piled structures consisting of berthing sections connected with trestle bridges. They are equipped with fenders, bollards, oil unloading arms, oil pipelines, water pipes, valves and lightening masts. All concrete structures are highly deteriorated, cracked and show corroded steel bars, above sea water and below water level as well. Almost all fenders are simple rubber tyres which are not adequate. Oil arms and pipes are in need of maintenance, although in working conditions. Fire-fighting system is not suitable since it is only based on water, except a small foam equipment recently installed on pier n°3 - water is not adequate to fight hydrocarbon fires -. Moreover, there is no automated system to give the alarm. Other steel equipment (stairs, handrails, etc.) are very corroded and generally out of shape. Electricity networks are such in poor condition that they are indeed dangerous. Condition of pedestrian traffic on piers is very bad and somehow risky. Lastly, access to pier n°3, via a 220 m long rubble mound structure protected with 300 kg quarry stones, has been damaged by wave action.
4.5 Tank farms Two main tank farms are available. The first one borders the port basin and is used to store crude oil (16 tanks, total capacity 170,000 m3 - available current capacity is only 130,000 m3 because some tank bottoms are obstructed with viscous products -), whereas the second one is on top of the hill (52 tanks, total capacity 260,000 m3); the latter was dedicated to refined products but is no longer used. Current storage capacity for crude oil (130,000 m3) is a bit low: on the year 2000 traffic basis (3.5 Mt) it only allowed an average "oil idle time" of 13 days. For the needs of the following project a more comfortable ratio has been considered (20 days), entailing use of the upper tank farm for crude oil storage and extension of the lower tank-farm.
4.6 Rail-tank-car loading station Two pipelines allow transfer of crude oil from the lower tank farm to the RTC station, located a few kilometres away, on top of the plateau. The station includes two blocks, each one being designed for 21 RTC at a time. It is equipped with a complete and modern foam fire-fighting station. The RTC loading station is recent and runs under satisfactory safety conditions.
Transport of crude oil and oil products on the Caspian Sea - European Commission Tacis-Traceca Programme ____________________________________________________________________________________________________________
________________________________________________________________________ Feasibility Study for the Rehabilitation of Dubendi Oil Terminal - April 2001
11
4.7 Waste Water Treatment Plant The port has a Waste Water Treatment Plant (WWTP) built in 1970 for treating sanitary water, bilge water from the tankers, and waste water from the land-based crude oil storage tanks 6. The original design capacity of the WWTP was 1,500 to 2,000 tonnes of waste water per day. Since 1991 the WWTP has been operated by the "28 of May" Company, the same Company that operates the port reception and oil transport facilities. The WWTP staff and quality control laboratory are at the site. The laboratory is not capable of testing for regulated parameters in the WWTP discharge. For complete analyses samples must be sent offsite. Analysis of the sea water for phenols and other contaminants is according to Gost standards. The WWTP features the following processes: ! 3 to 4 hours of settling in crude oil tanks (containing crude oil delivered from Aktau and Turkmenbashi, as
well as from Pirallachy Island, which now totals about 78.000 tonnes daily). ! Draw off of water/oil emulsion (about 80 to 100 tonnes daily, depending on tanker traffic). ! Two 5,000 tonne tanks for oil/water separation (about 17 to 20 tonnes of oil is returned to the crude oil
tanks). ! Discharge of treated waste water to sea. The WWTP is poorly maintained and operated. Significant bypassing is reported to occur.
4.8 Oil pipe networks Except the rare lines which are still being used, all other pipelines are worn-out. Moreover, pipeline supports which are standing along the breakwater are severely damaged.
4.9 Pump stations There are three pump stations on the terminal: pump stations n°27 and n°62, serving the upper tank farm 7, and Caspian TransCo's pump station, serving the RTC loading facility. The latter is the only new and sound one. The two others are operating but they are in need of overhaul.
6 The plant doesn't receive any ballast water since vessels arriving at the port are loaded with oil. 7 Crude oil is delivered to the lower tank farm by the use of vessel pumps. It may be underlined that unloading operations are frequently delayed because of failures on vessel pumps.
Transport of crude oil and oil products on the Caspian Sea - European Commission Tacis-Traceca Programme ____________________________________________________________________________________________________________
________________________________________________________________________ Feasibility Study for the Rehabilitation of Dubendi Oil Terminal - April 2001
12
4.10 Power stations and electricity networks The terminal is fed by two main transformers delivering 6 kV power to seven sub-transformers producing 0.4 kV power. All transformers and sub-transformers are in need of overhaul. Besides, the whole electricity supply network is in advanced stage of deterioration and therefore dangerous with regard to risk of fire: ! cable ways are not covered; ! many connection boxes are no longer protected from dust and rain, and several cable connections are
not insulated; ! earthening devices don't look efficient; ! most supporting poles are corroded and about to collapse.
4.11 Administrative buildings Though main building structures look sound, administrative buildings do not offer decent working conditions. They need to be refurbished, they also need some modern office equipment and adequate improvements allowing to centralise port operation control.
4.12 Miscellaneous deficiencies Traffic of vehicles and pedestrians is not controlled according to international safety standards applicable to oil terminals. All dangerous areas ought to be clearly marked and prohibited to non-authorised vehicles and persons. The general fire-fighting system is not adequate, especially because it does not include enough foam systems (only pier n°3 has a small foam tank). Furthermore, the water network is not well maintained and outlets are difficult to locate. There was no confirmation of the presence of appropriate oil spill prevention equipment, although a short old boom guard for localising emergency oil spills in the process of unloading tankers could be seen. The "oil refuse collector" ship carries out mechanical collection of oil and waste floating on the surface. The fire boat is also supposed to be equipped with operational boom guards for localising oil spills in the berth areas. The port evidently expects help to come from the port of Baku in the case of critical oil spills. There was no indication that an Emergency Response Plan has been developed. The port has requested booms of the “Anakonda” type as part of the rehabilitation project. It may be added that Azerbaijan, as a member of the IMO (as well as all other riparian states of the Caspian), has accepted the various requirements of the IMO concerning oil pollution preparedness, response and co-operation. These include reporting procedures for vessels, emergency response plans, and international co-operation. Port crude oil and petroleum product offloading and onloading facilities, which fall under the IMO directives on preparedness, are in the process of improving facilities, developing Emergency Oil Spill Response Plans, and upgrading equipment required to meet the terms of the plans. In general these ports should be prepared to handle US EPA Tier 1 and Tier 2 spills. The minimum requirements for Tier 1 (up to 10 tonnes) and Tier 2 (from 10 to 100 tonnes) spills are as follows:

Transport of crude oil and oil products on the Caspian Sea - European Commission Tacis-Traceca Programme ____________________________________________________________________________________________________________
________________________________________________________________________ Feasibility Study for the Rehabilitation of Dubendi Oil Terminal - April 2001
13
1. Oil spill response vessel 2. Rapid deployment boom system 3. Permanently-moored boom 4. Rope skimmer oil mop 5. Portable power supply 6. Sorbents 7. Harbour compensators 8. Harbour skimming system 9. Individual response pits 10. Capacity for installation & commissioning of equipment 11. Spare parts and maintenance
5. Rehabilitation plans Rehabilitation plans have been developed to cope with the projected increase of oil flows, to improve the environmental protection at the port and to comply with safety requirements. Two hypotheses of oil flows have been considered, based on the former traffic projections 8: Figures in Mt in 2005 in 2010 in 2020
High hypothesis 7 12 17
Low hypothesis 4 6 8
Rehabilitation plans have been adjusted accordingly: ! A short-term rehabilitation plan allowing an annual flow of 4 to 8 Mt, sufficient till 2020 in the "low-traffic"
hypothesis, till 2006 only in the "high-traffic" case. ! A medium-term rehabilitation plan allowing an annual flow of 8 to 12 Mt, to be launched in 2005 in the
"high-traffic" case. ! A long-term rehabilitation plan allowing an annual flow of 12 to 18 Mt, to be launched in 2010 in the "high-
traffic" case.
8 Without any investment DOT capacity would be limited to approximately 4 Mt per annum - or reduced in case the breakwater carries on failing -.
Transport of crude oil and oil products on the Caspian Sea - European Commission Tacis-Traceca Programme ____________________________________________________________________________________________________________
________________________________________________________________________ Feasibility Study for the Rehabilitation of Dubendi Oil Terminal - April 2001
14
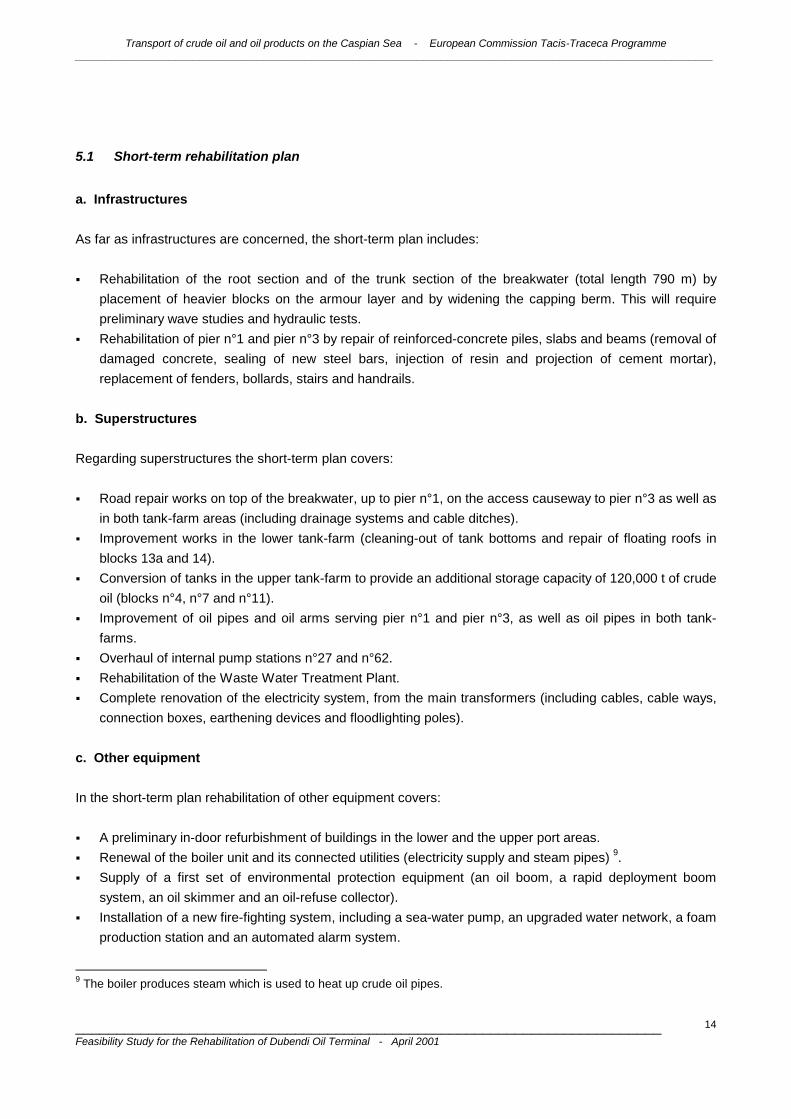
5.1 Short-term rehabilitation plan a. Infrastructures As far as infrastructures are concerned, the short-term plan includes: ! Rehabilitation of the root section and of the trunk section of the breakwater (total length 790 m) by
placement of heavier blocks on the armour layer and by widening the capping berm. This will require preliminary wave studies and hydraulic tests.
! Rehabilitation of pier n°1 and pier n°3 by repair of reinforced-concrete piles, slabs and beams (removal of damaged concrete, sealing of new steel bars, injection of resin and projection of cement mortar), replacement of fenders, bollards, stairs and handrails.
b. Superstructures Regarding superstructures the short-term plan covers: ! Road repair works on top of the breakwater, up to pier n°1, on the access causeway to pier n°3 as well as
in both tank-farm areas (including drainage systems and cable ditches). ! Improvement works in the lower tank-farm (cleaning-out of tank bottoms and repair of floating roofs in
blocks 13a and 14). ! Conversion of tanks in the upper tank-farm to provide an additional storage capacity of 120,000 t of crude
oil (blocks n°4, n°7 and n°11). ! Improvement of oil pipes and oil arms serving pier n°1 and pier n°3, as well as oil pipes in both tank-
farms. ! Overhaul of internal pump stations n°27 and n°62. ! Rehabilitation of the Waste Water Treatment Plant. ! Complete renovation of the electricity system, from the main transformers (including cables, cable ways,
connection boxes, earthening devices and floodlighting poles). c. Other equipment In the short-term plan rehabilitation of other equipment covers: ! A preliminary in-door refurbishment of buildings in the lower and the upper port areas. ! Renewal of the boiler unit and its connected utilities (electricity supply and steam pipes) 9. ! Supply of a first set of environmental protection equipment (an oil boom, a rapid deployment boom
system, an oil skimmer and an oil-refuse collector). ! Installation of a new fire-fighting system, including a sea-water pump, an upgraded water network, a foam
production station and an automated alarm system.
9 The boiler produces steam which is used to heat up crude oil pipes.
Transport of crude oil and oil products on the Caspian Sea - European Commission Tacis-Traceca Programme ____________________________________________________________________________________________________________
________________________________________________________________________ Feasibility Study for the Rehabilitation of Dubendi Oil Terminal - April 2001
15
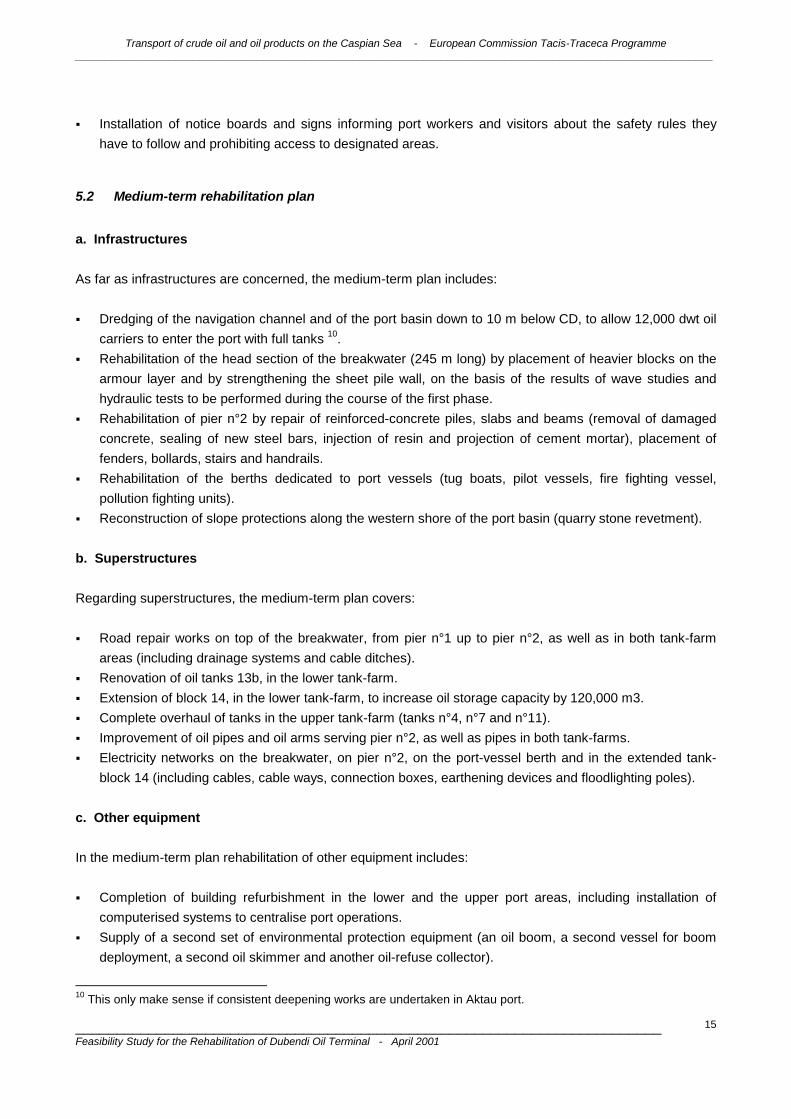
! Installation of notice boards and signs informing port workers and visitors about the safety rules they have to follow and prohibiting access to designated areas.
5.2 Medium-term rehabilitation plan a. Infrastructures As far as infrastructures are concerned, the medium-term plan includes: ! Dredging of the navigation channel and of the port basin down to 10 m below CD, to allow 12,000 dwt oil
carriers to enter the port with full tanks 10. ! Rehabilitation of the head section of the breakwater (245 m long) by placement of heavier blocks on the
armour layer and by strengthening the sheet pile wall, on the basis of the results of wave studies and hydraulic tests to be performed during the course of the first phase.
! Rehabilitation of pier n°2 by repair of reinforced-concrete piles, slabs and beams (removal of damaged concrete, sealing of new steel bars, injection of resin and projection of cement mortar), placement of fenders, bollards, stairs and handrails.
! Rehabilitation of the berths dedicated to port vessels (tug boats, pilot vessels, fire fighting vessel, pollution fighting units).
! Reconstruction of slope protections along the western shore of the port basin (quarry stone revetment). b. Superstructures Regarding superstructures, the medium-term plan covers: ! Road repair works on top of the breakwater, from pier n°1 up to pier n°2, as well as in both tank-farm
areas (including drainage systems and cable ditches). ! Renovation of oil tanks 13b, in the lower tank-farm. ! Extension of block 14, in the lower tank-farm, to increase oil storage capacity by 120,000 m3. ! Complete overhaul of tanks in the upper tank-farm (tanks n°4, n°7 and n°11). ! Improvement of oil pipes and oil arms serving pier n°2, as well as pipes in both tank-farms. ! Electricity networks on the breakwater, on pier n°2, on the port-vessel berth and in the extended tank-
block 14 (including cables, cable ways, connection boxes, earthening devices and floodlighting poles). c. Other equipment In the medium-term plan rehabilitation of other equipment includes: ! Completion of building refurbishment in the lower and the upper port areas, including installation of
computerised systems to centralise port operations. ! Supply of a second set of environmental protection equipment (an oil boom, a second vessel for boom
deployment, a second oil skimmer and another oil-refuse collector).
10 This only make sense if consistent deepening works are undertaken in Aktau port.
Transport of crude oil and oil products on the Caspian Sea - European Commission Tacis-Traceca Programme ____________________________________________________________________________________________________________
________________________________________________________________________ Feasibility Study for the Rehabilitation of Dubendi Oil Terminal - April 2001
16
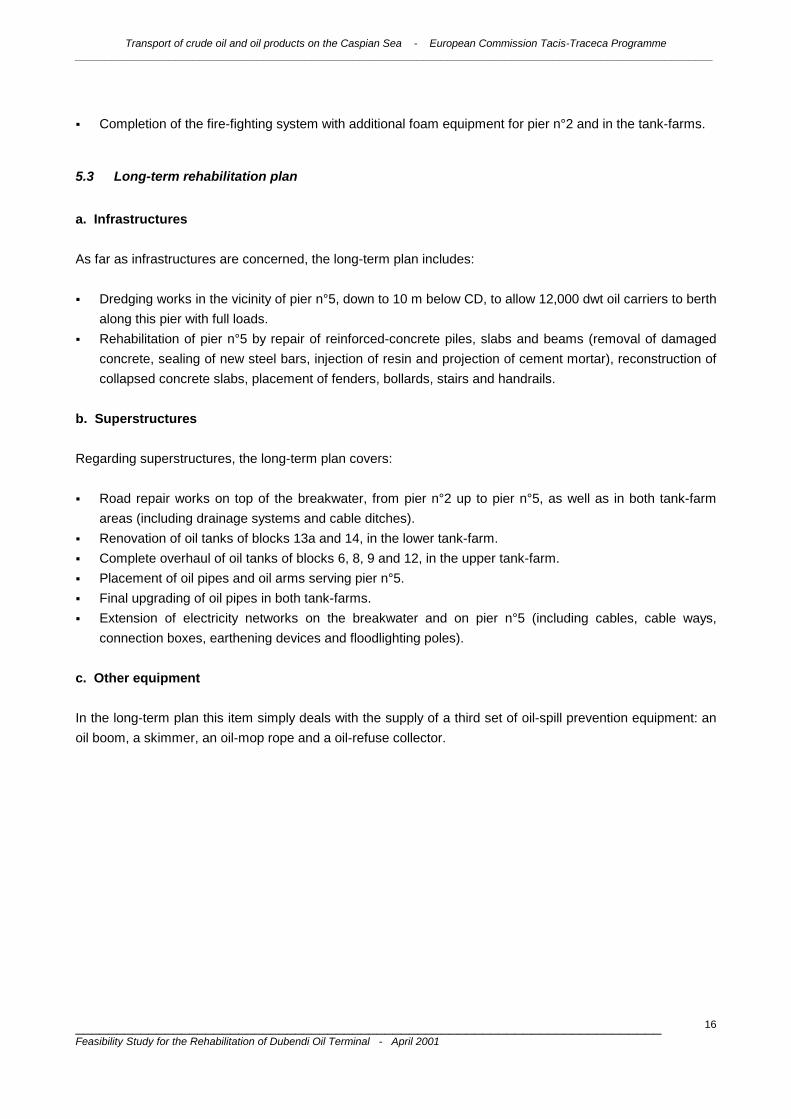
! Completion of the fire-fighting system with additional foam equipment for pier n°2 and in the tank-farms.
5.3 Long-term rehabilitation plan a. Infrastructures As far as infrastructures are concerned, the long-term plan includes: ! Dredging works in the vicinity of pier n°5, down to 10 m below CD, to allow 12,000 dwt oil carriers to berth
along this pier with full loads. ! Rehabilitation of pier n°5 by repair of reinforced-concrete piles, slabs and beams (removal of damaged
concrete, sealing of new steel bars, injection of resin and projection of cement mortar), reconstruction of collapsed concrete slabs, placement of fenders, bollards, stairs and handrails.
b. Superstructures Regarding superstructures, the long-term plan covers: ! Road repair works on top of the breakwater, from pier n°2 up to pier n°5, as well as in both tank-farm
areas (including drainage systems and cable ditches). ! Renovation of oil tanks of blocks 13a and 14, in the lower tank-farm. ! Complete overhaul of oil tanks of blocks 6, 8, 9 and 12, in the upper tank-farm. ! Placement of oil pipes and oil arms serving pier n°5. ! Final upgrading of oil pipes in both tank-farms. ! Extension of electricity networks on the breakwater and on pier n°5 (including cables, cable ways,
connection boxes, earthening devices and floodlighting poles). c. Other equipment In the long-term plan this item simply deals with the supply of a third set of oil-spill prevention equipment: an oil boom, a skimmer, an oil-mop rope and a oil-refuse collector.
Transport of crude oil and oil products on the Caspian Sea - European Commission Tacis-Traceca Programme ____________________________________________________________________________________________________________
________________________________________________________________________ Feasibility Study for the Rehabilitation of Dubendi Oil Terminal - April 2001
17
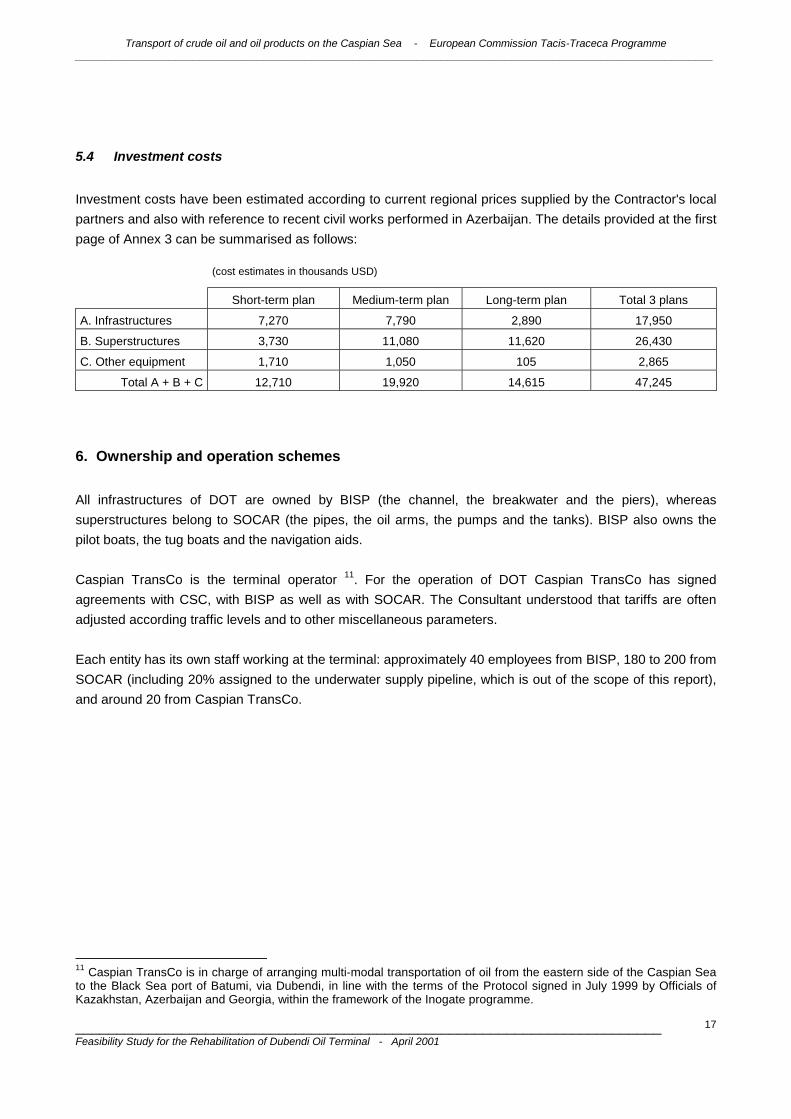
5.4 Investment costs Investment costs have been estimated according to current regional prices supplied by the Contractor's local partners and also with reference to recent civil works performed in Azerbaijan. The details provided at the first page of Annex 3 can be summarised as follows:
(cost estimates in thousands USD)
Short-term plan Medium-term plan Long-term plan Total 3 plans
A. Infrastructures 7,270 7,790 2,890 17,950
B. Superstructures 3,730 11,080 11,620 26,430
C. Other equipment 1,710 1,050 105 2,865
Total A + B + C 12,710 19,920 14,615 47,245
6. Ownership and operation schemes All infrastructures of DOT are owned by BISP (the channel, the breakwater and the piers), whereas superstructures belong to SOCAR (the pipes, the oil arms, the pumps and the tanks). BISP also owns the pilot boats, the tug boats and the navigation aids. Caspian TransCo is the terminal operator 11. For the operation of DOT Caspian TransCo has signed agreements with CSC, with BISP as well as with SOCAR. The Consultant understood that tariffs are often adjusted according traffic levels and to other miscellaneous parameters. Each entity has its own staff working at the terminal: approximately 40 employees from BISP, 180 to 200 from SOCAR (including 20% assigned to the underwater supply pipeline, which is out of the scope of this report), and around 20 from Caspian TransCo.
11 Caspian TransCo is in charge of arranging multi-modal transportation of oil from the eastern side of the Caspian Sea to the Black Sea port of Batumi, via Dubendi, in line with the terms of the Protocol signed in July 1999 by Officials of Kazakhstan, Azerbaijan and Georgia, within the framework of the Inogate programme.

Transport of crude oil and oil products on the Caspian Sea - European Commission Tacis-Traceca Programme ____________________________________________________________________________________________________________
________________________________________________________________________ Feasibility Study for the Rehabilitation of Dubendi Oil Terminal - April 2001
18
7. Financial assessment
7.1 General The objectives of the financial assessment are to evaluate the capacity of DOT to be self-supporting and to bear the load of the improvement works which are required to comply with safety requirements, to protect the environment and to cope with the projected increase of oil throughput. In this chapter DOT is considered as a global "cost and profit centre", the sharing out of investment costs being to be agreed upon by negotiations between BISP, SOCAR and Caspian TransCo. Financial projections have been made according to three families of hypotheses: 1. No investment is undertaken and traffic is therefore limited to 4 Mt per year throughout the whole study
period (20 years). 2. Investments are carried out to cope with the low traffic hypothesis (4 Mt in year 2005, 6 Mt in year 2010
and 8 Mt in year 2020). The content of the investment programme is that of the "short term plan", amounting to USD 12.7 million.
3. Investments are carried out to cope with the high traffic hypothesis (7 Mt in year 2005, 12 Mt in year 2010
and 17 Mt in year 2020). In this case the content of the investment programme covers the short-term plan (USD 12.7 million), the medium-term plan (USD 19.9 million) and the long-term plan (USD 14.6 million), resulting in a total investment of USD 47.2 million.
Transport of crude oil and oil products on the Caspian Sea - European Commission Tacis-Traceca Programme ____________________________________________________________________________________________________________
________________________________________________________________________ Feasibility Study for the Rehabilitation of Dubendi Oil Terminal - April 2001
19
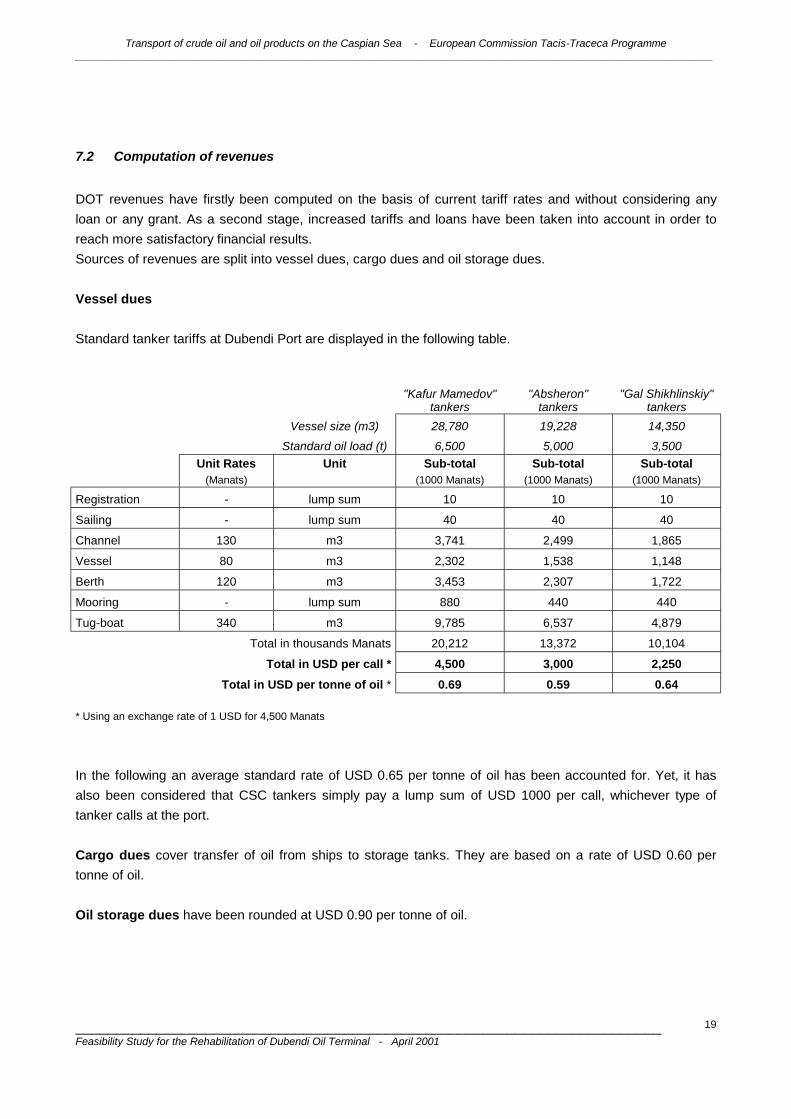
7.2 Computation of revenues DOT revenues have firstly been computed on the basis of current tariff rates and without considering any loan or any grant. As a second stage, increased tariffs and loans have been taken into account in order to reach more satisfactory financial results. Sources of revenues are split into vessel dues, cargo dues and oil storage dues. Vessel dues Standard tanker tariffs at Dubendi Port are displayed in the following table. "Kafur Mamedov"
tankers "Absheron"
tankers "Gal Shikhlinskiy"
tankers Vessel size (m3)
Standard oil load (t) 28,780 6,500
19,228 5,000
14,350 3,500
Unit Rates (Manats)
Unit Sub-total (1000 Manats)
Sub-total (1000 Manats)
Sub-total (1000 Manats)
Registration - lump sum 10 10 10
Sailing - lump sum 40 40 40
Channel 130 m3 3,741 2,499 1,865
Vessel 80 m3 2,302 1,538 1,148
Berth 120 m3 3,453 2,307 1,722
Mooring - lump sum 880 440 440
Tug-boat 340 m3 9,785 6,537 4,879
Total in thousands Manats 20,212 13,372 10,104
Total in USD per call * 4,500 3,000 2,250 Total in USD per tonne of oil * 0.69 0.59 0.64
* Using an exchange rate of 1 USD for 4,500 Manats
In the following an average standard rate of USD 0.65 per tonne of oil has been accounted for. Yet, it has also been considered that CSC tankers simply pay a lump sum of USD 1000 per call, whichever type of tanker calls at the port. Cargo dues cover transfer of oil from ships to storage tanks. They are based on a rate of USD 0.60 per tonne of oil. Oil storage dues have been rounded at USD 0.90 per tonne of oil.
Transport of crude oil and oil products on the Caspian Sea - European Commission Tacis-Traceca Programme ____________________________________________________________________________________________________________
________________________________________________________________________ Feasibility Study for the Rehabilitation of Dubendi Oil Terminal - April 2001
20
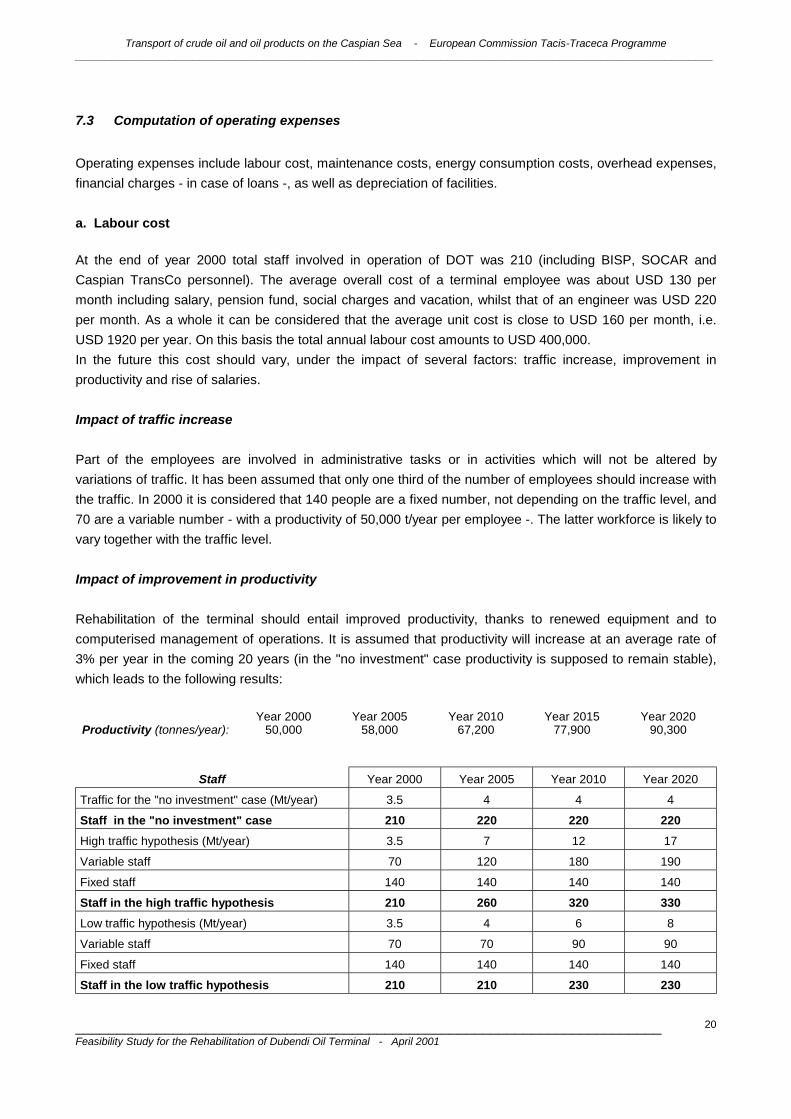
7.3 Computation of operating expenses Operating expenses include labour cost, maintenance costs, energy consumption costs, overhead expenses, financial charges - in case of loans -, as well as depreciation of facilities. a. Labour cost At the end of year 2000 total staff involved in operation of DOT was 210 (including BISP, SOCAR and Caspian TransCo personnel). The average overall cost of a terminal employee was about USD 130 per month including salary, pension fund, social charges and vacation, whilst that of an engineer was USD 220 per month. As a whole it can be considered that the average unit cost is close to USD 160 per month, i.e. USD 1920 per year. On this basis the total annual labour cost amounts to USD 400,000. In the future this cost should vary, under the impact of several factors: traffic increase, improvement in productivity and rise of salaries. Impact of traffic increase Part of the employees are involved in administrative tasks or in activities which will not be altered by variations of traffic. It has been assumed that only one third of the number of employees should increase with the traffic. In 2000 it is considered that 140 people are a fixed number, not depending on the traffic level, and 70 are a variable number - with a productivity of 50,000 t/year per employee -. The latter workforce is likely to vary together with the traffic level. Impact of improvement in productivity Rehabilitation of the terminal should entail improved productivity, thanks to renewed equipment and to computerised management of operations. It is assumed that productivity will increase at an average rate of 3% per year in the coming 20 years (in the "no investment" case productivity is supposed to remain stable), which leads to the following results:
Year 2000 Year 2005 Year 2010 Year 2015 Year 2020 Productivity (tonnes/year): 50,000 58,000 67,200 77,900 90,300
Staff Year 2000 Year 2005 Year 2010 Year 2020
Traffic for the "no investment" case (Mt/year) 3.5 4 4 4
Staff in the "no investment" case 210 220 220 220 High traffic hypothesis (Mt/year) 3.5 7 12 17
Variable staff 70 120 180 190
Fixed staff 140 140 140 140
Staff in the high traffic hypothesis 210 260 320 330 Low traffic hypothesis (Mt/year) 3.5 4 6 8
Variable staff 70 70 90 90
Fixed staff 140 140 140 140
Staff in the low traffic hypothesis 210 210 230 230
Transport of crude oil and oil products on the Caspian Sea - European Commission Tacis-Traceca Programme ____________________________________________________________________________________________________________
________________________________________________________________________ Feasibility Study for the Rehabilitation of Dubendi Oil Terminal - April 2001
21
Impact of rise of salaries On the basis of a yearly increase of 2% the annual cost of an employee will vary as follows: ! Year 2000: USD 1920 ! Year 2005: USD 2120 ! Year 2010: USD 2340 ! Year 2015: USD 2580 ! Year 2020: USD 2850 b. Maintenance costs Annual maintenance costs can be estimated as ratios of investment costs, and following ratios have been applied to planned investments: ! 0.5% for the breakwater; ! 0.2% for the other infrastructure items; ! 5% for the superstructures and the other equipment. As far as existing facilities are concerned, a yearly lump sum of 1 million USD has been taken into account. c. Energy consumption costs From the Inogate Ref. 1 report the cost of energy spent to unload a tanker and to pump its oil into storage tanks is around USD 0.12 per tonne of oil. d. Overhead expenses Part of administrative and management costs of BISP, SOCAR and Caspian TransCo is to be incorporated into the terminal operating expenses. For this purpose DOT turnover has been considered as the key parameter, it has been multiplied by 0.15 to compute global overhead expenses. e. Financial charges Each time it is assumed that a loan will be needed, following standard conditions are applied: 4-year grace delay, 10-year repayment period and 8% financial charges (interest rate plus commitment fees plus fixed fees). f. Depreciation of facilities It has be considered that rehabilitation works will be amortised within 20 years. No depreciation is accounted for existing facilities.

Transport of crude oil and oil products on the Caspian Sea - European Commission Tacis-Traceca Programme ____________________________________________________________________________________________________________
________________________________________________________________________ Feasibility Study for the Rehabilitation of Dubendi Oil Terminal - April 2001
22
7.4 Financial results
Details of financial computations are in the attached Annex 3, from page 2 through page 8. They are summarised in the table below.
Hypothesis
Table in Annex 3
Loan
(million USD)
Tariff Rise
(USD/t)
Discounted cash-flow at 10%
(million USD)
Internal Rate of
Return (%)
Maximum need in
cash-flow (million USD)
No investment REF 0 0 23.5 - 0
High traffic HH1 0 0 34.2 14.6 8.2 (in 2006) High traffic HH2 0 0.45 56.9 25.4 4.9 (in 2002) High traffic HH3 11.55 0 37.0 19.0 0
Low traffic LH1 0 0 24.5 11.2 0.3 (in 2005) Low traffic LH2 0 0.03 25.3 12.2 0 Low traffic LH3 0.4 0 24.6 11.3 0
Note: gross operating profits are clearly positive in all cases, even in the "no investment" hypothesis. Comments: ! In the "no investment" case cash-flows are always positive (average USD 2.4 million per year),
discounted cash-flow being USD million 23.5. DOT is globally quite profitable. ! In the two other cases cash-flows are sometimes negative at the beginning of the time period; this is the
reason why additional tests have been carried out, firstly with increased tariffs, then with loans. ! In the "high traffic" hypothesis a significant rise of tariff (USD 0.45 per tonne of oil) is not sufficient to
cancel the need in cash-flow. A USD 11.55 million loan can solve the problem. ! In the "low traffic" hypothesis a very slight increase of tariff (USD 0.03 per tonne of oil) cancels the
negative cash-flows. The same result can be obtained with a very limited loan (USD 400,000). ! Internal Rates of Return are satisfactory in all cases, although a bit on the edge in the "low traffic"
hypothesis. Investments are profitable.
* *
* Enclosures: Annex 1 to Annex 4

Annex 1
Abbreviations & Acronyms, References and Staff List

1
Abbreviations and Acronyms • AIOC Azerbaijan International Oil Corporation • BISP Baku International Sea Port • BSL Baltic Sea Level • CD Chart Datum • CPC Caspian Pipeline Consortium (from western Kazakhstan to Novorossiysk) • CSC Caspian Shipping Company • DOT Dubendi Oil Terminal • dwt dead weight tonnage • EBRD European Bank for Reconstruction and Development • IMDG International Maritime Dangerous Goods Code • IMO International Maritime Organisation • Inogate Interstate Oil and Gas Transmission to Europe (a European Commission programme) • km kilometre • kV kilo Volts • m metre • MARPOL International Convention for Prevention of Marine Pollution • MEP Main Export Pipeline (from Baku to Ceyhan) • Mt Million tonnes • RTC Rail Tank Car • SOCAR State Oil Company of Azerbaijan Republic • t metric tonne • Traceca Transport Corridor Europe-Caucasus-Asia • USD United States dollar • V Volt • WWTP Waste Water Treatment Plant
References 1. Trans-Caucasian Multi-Modal Oil Transport System (Inogate 97.04, January 2000)
2. Complementary Feasibility Studies for Oil and Gas Transport from the Caspian Sea Region (Inogate 97.01)
3. Hydrocarbon Potential Assessment (Inogate 97.02)
4. Priority Emergency Investment in Oil and Gas Infrastructures (Inogate 97.03)
5. Feasibility Study for Oil and Gas Pipe-Lines across the Caspian Sea (Inogate 96.01)
6. Black Sea Oil Investment (Lloyd’s Shipping Economist, April 2000)
7. Restituer le potentiel de la mer Caspienne (Pétrole et Gaz Informations, April 2000)
8. The Caspian Sea: legal status and international security (Umirserik Kasenov)
9. L’exploitation des hydrocarbures de la mer Caspienne (Pétrole et Techniques, February 2000)
10. EIA Caspian Sea Region Report (Energy Information Administration, December 1998)
11. Caucase, le grand jeu pétrolier (Courrier International, October 1999)
12. Seminar: Les enjeux régionaux de la mer Caspienne (Centre Français du Commerce Extérieur, September 1999)
13. Caucase, les grandes manœuvres russes (L’Express, November 1999)

2
Staff list 1. BENEFICIARIES & COUNTERPARTS Ministry of Economics of Azerbaijan
Mr. Ikram Sadikov, Head of Transport Department Mr. Hussein Gubadov, Head of Fuel and Energy Department
Baku International Sea Trade Port
Mr. Soltan Kazimov, Chief Engineer Mr. Rafail Mirgulamov, Commercial Manager
Aktau Commercial Sea Port
Mr. Abylgazin, General Director Mr. Glock, Deputy General Director
Turkmen Maritime Lines Mr. Bekmyrat Gurbanmuradov, General Director Mr. Murad Atayev, Deputy General Director
2. TACIS
Co-ordinators Mr. Marc Graille, Tbilisi Mr. Erzhan Zhumali, Astana Mr. Emilio Valli, Astana Mr. Boris Smolin, Baku Mr. Mahir Kazimov, Baku Mr. Mukhamet Gulychev, Ashgabad Mr. Michael Wilson, Ashgabad
Monitor Mr. Pieter Melissen, Tashkent
3. CONSULTANT & SUB-CONSULTANTS BCEOM Mr. André Merrien, Port Engineer Mr. Robert Gould, Environmentalist PORT OF MARSEILLES AUTHORITY Mr. Jean-Michel Bocognano, Port Engineer Mr. Patrick Durel, Port Economist Mr. Christian Montfort, Oil Traffic Expert Mr. Marcel Immelé, Oil Superstructure Expert Mr. Michel Peronnet, Oil Process Expert CASPMORNIIPROEKT, BAKU
Mrs. Tamilla Bagirova, Director Mr. Fazil Gahramanov, Chief Engineer
AZQIPRONEFTECHIM, BAKU
Mr. Valeriy Aleksandrov, Chief Engineer
3
4. OTHER STAFF MET • EBRD Mr. Christopher Ousey, London
Mrs. Lala Gouliyeva, Baku
Mr. Rufat Imamverdiyev, Baku
Mr. Kanat Aubakirov, Almaty
Mr. Batyr Hudaynazarov, Ashgabad
• Kaztransoil Mr. Kairgeldi Kabyldin, Astana
• Kazakh Petroleum Association Mr. Edward Verona, Almaty
• Investconsulting Mr. Kadyr Baikenov, Almaty
• SOCAR Mr. Gahraman Narimanogly, Baku
• SOCAR Mr. Vagif Abbasov, Baku
• AIOC Mr. Roger Davis, Baku
• AIOC Mr. Gary Reichow, Baku
• Azerneftyag Mr. Adil Ragimov, Baku
• Caspian Shipping Company Mr. Elshad Khalykov, Baku
• Azerbaijan State Railways Mr. Musa Panahov, Baku
• Caspian TransCo Inc. Mr. Nazih Elbeyli, Baku
• Caspian TransCo Inc. Mr. Bekir Vural, Baku
• Caspian TransCo Inc. Mr. Aydin Saral, Baku
• Caspian TransCo Inc. Mr. Ardic Durdu, Baku
• Chevron Mr. Haver Kambaizadeh, Baku
• BP Amoco Mr. Falk Mamedov, Baku
• Elf Petroleum Mr. Jean-François Daganaud, Baku
• Total Oil Mr. Patrick Lantigner, Baku
• Entrepose Construction Company Mr. Franck Le Baron, Baku
• Bouygues Offshore Construction Company Mr. Olivier Clausin, Baku
Annex 2
Photographs of Dubendi Oil Terminal (23)
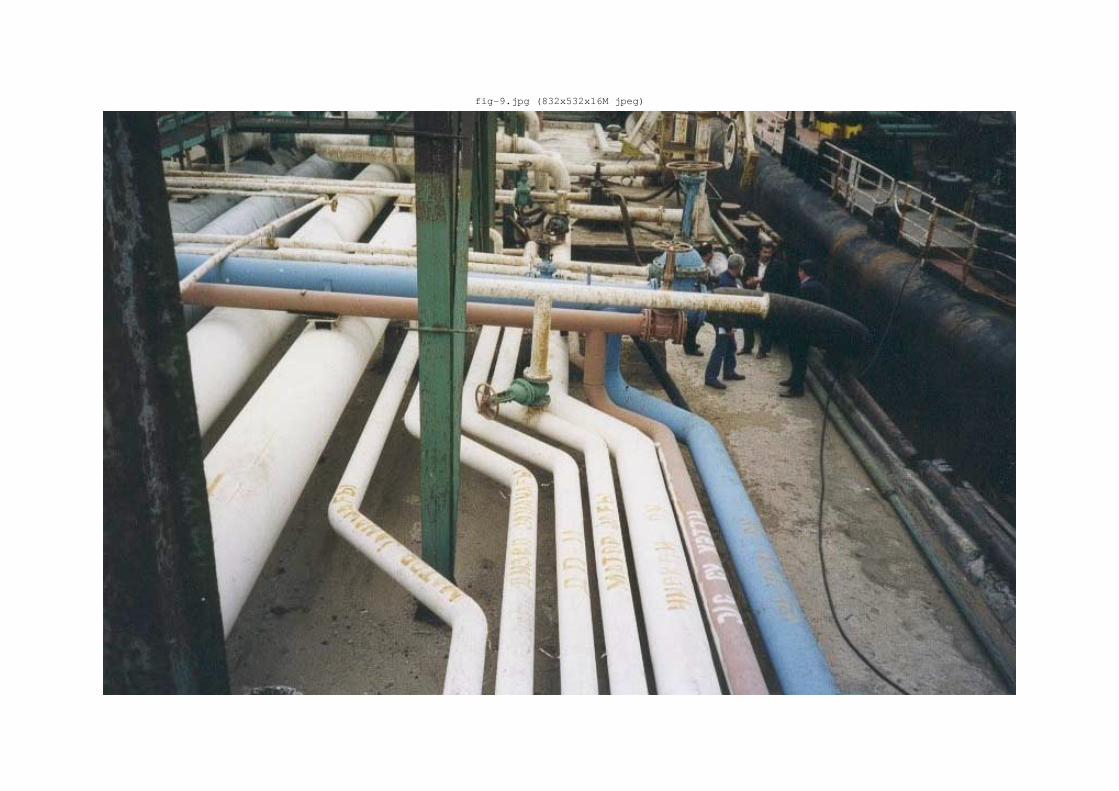
fig-9.jpg (832x532x16M jpeg)
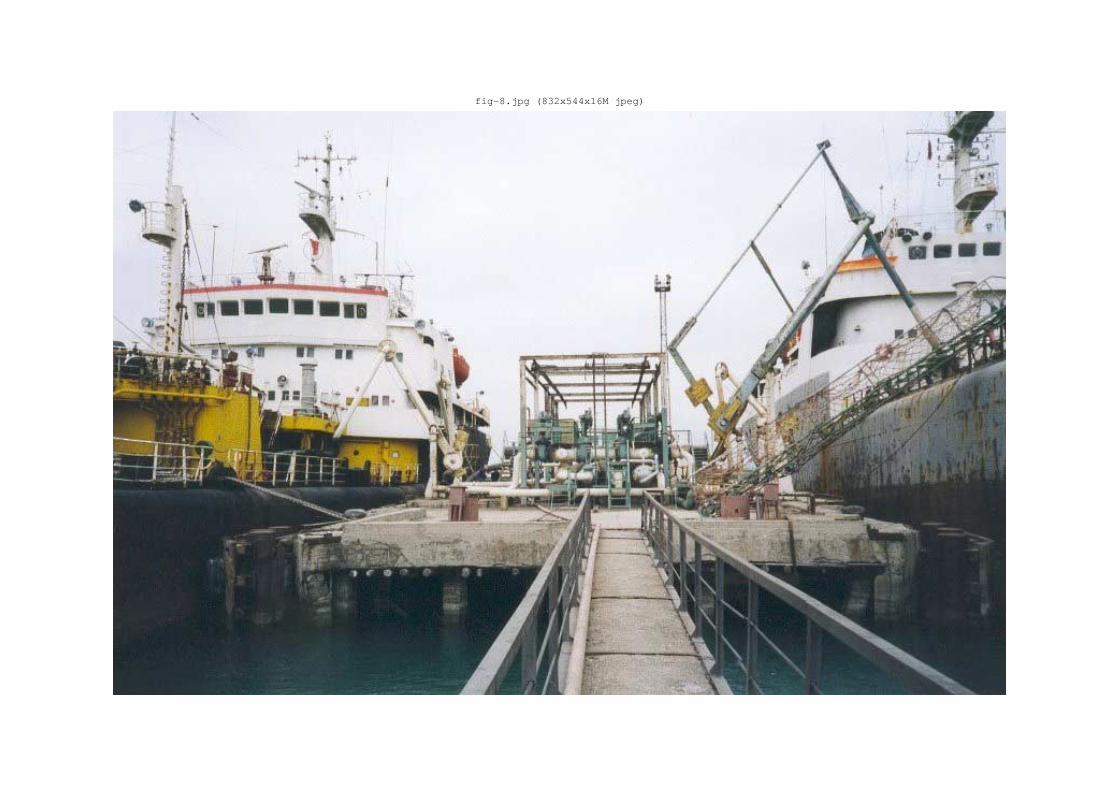
fig-8.jpg (832x544x16M jpeg)

fig-7.jpg (1752x1162x16M jpeg)
fig-6.jpg (1752x1182x16M jpeg)
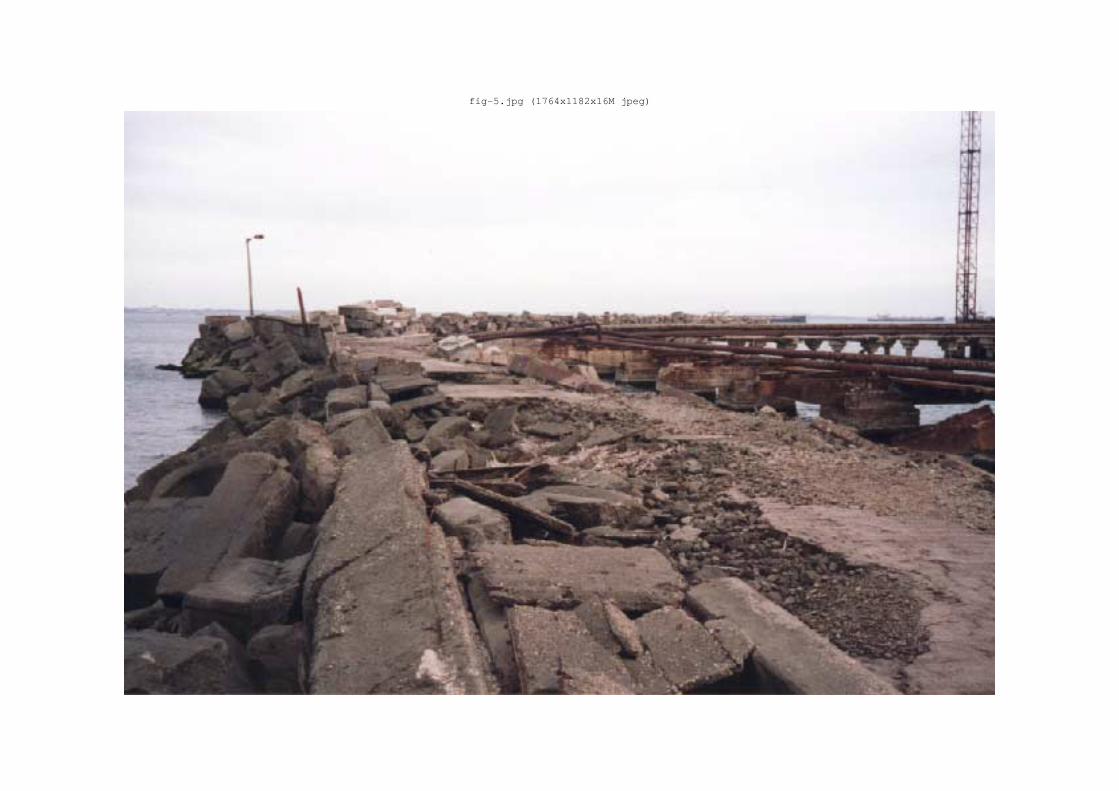
fig-5.jpg (1764x1182x16M jpeg)
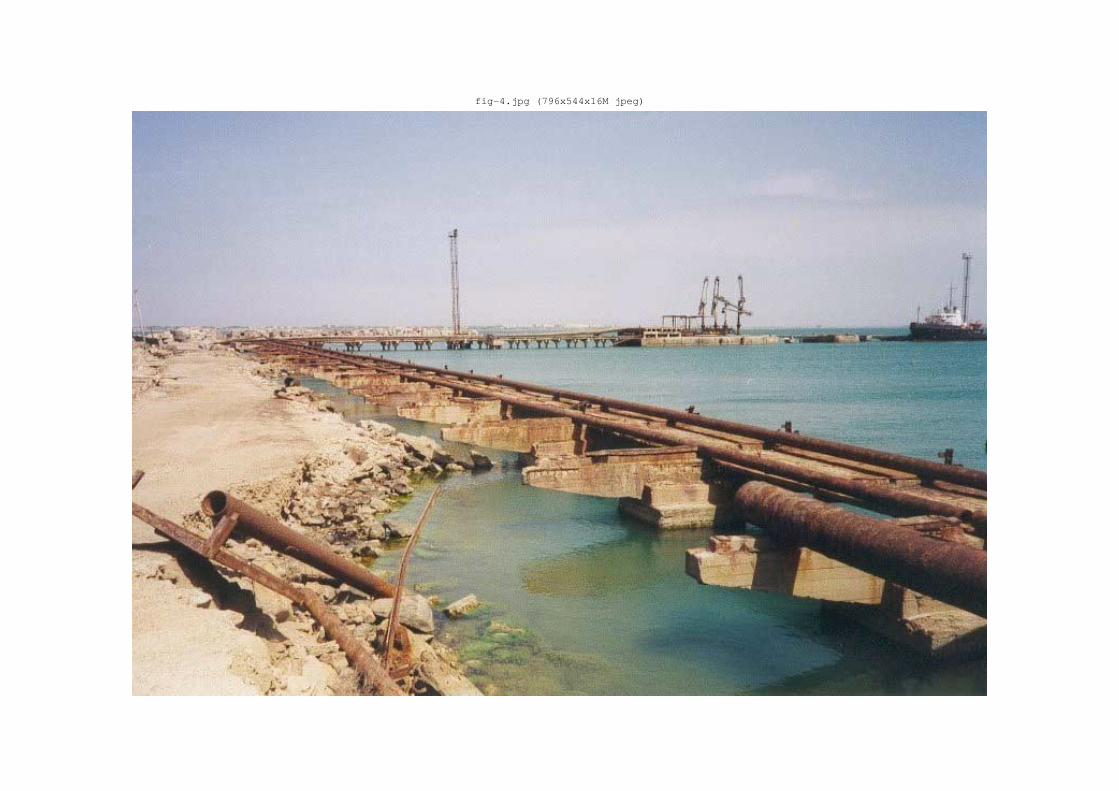
fig-4.jpg (796x544x16M jpeg)
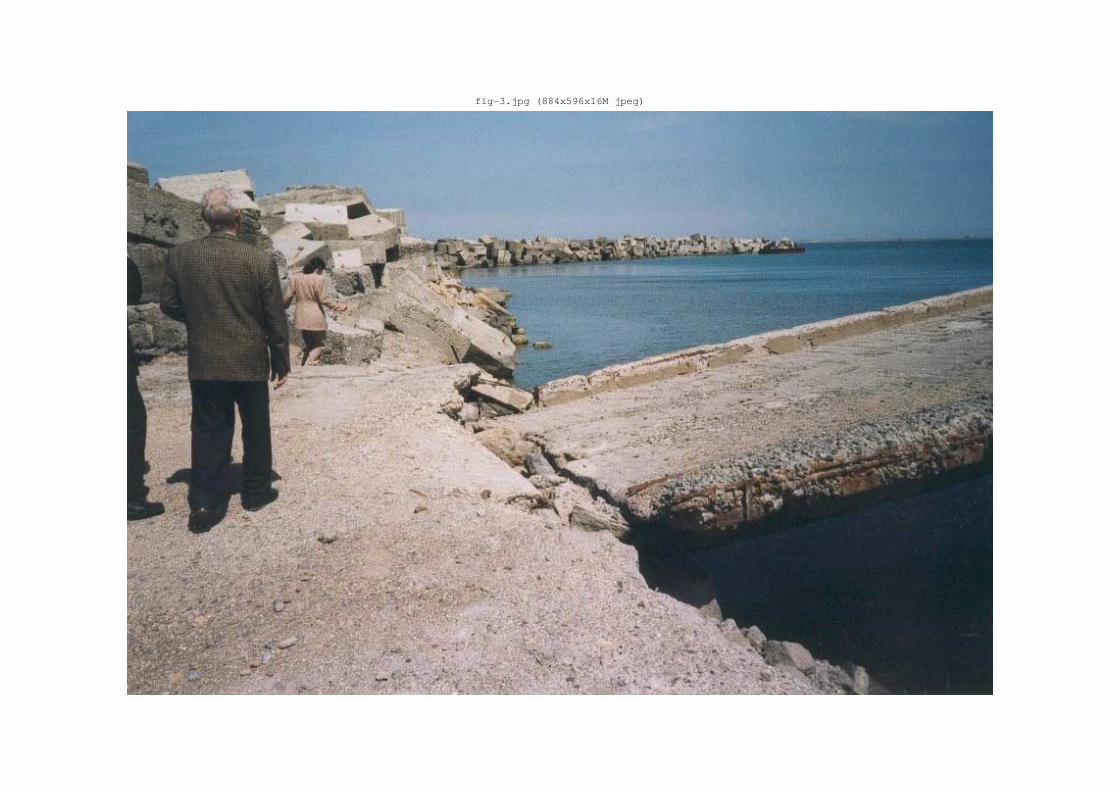
fig-3.jpg (884x596x16M jpeg)

fig-23.jpg (1752x1162x16M jpeg)
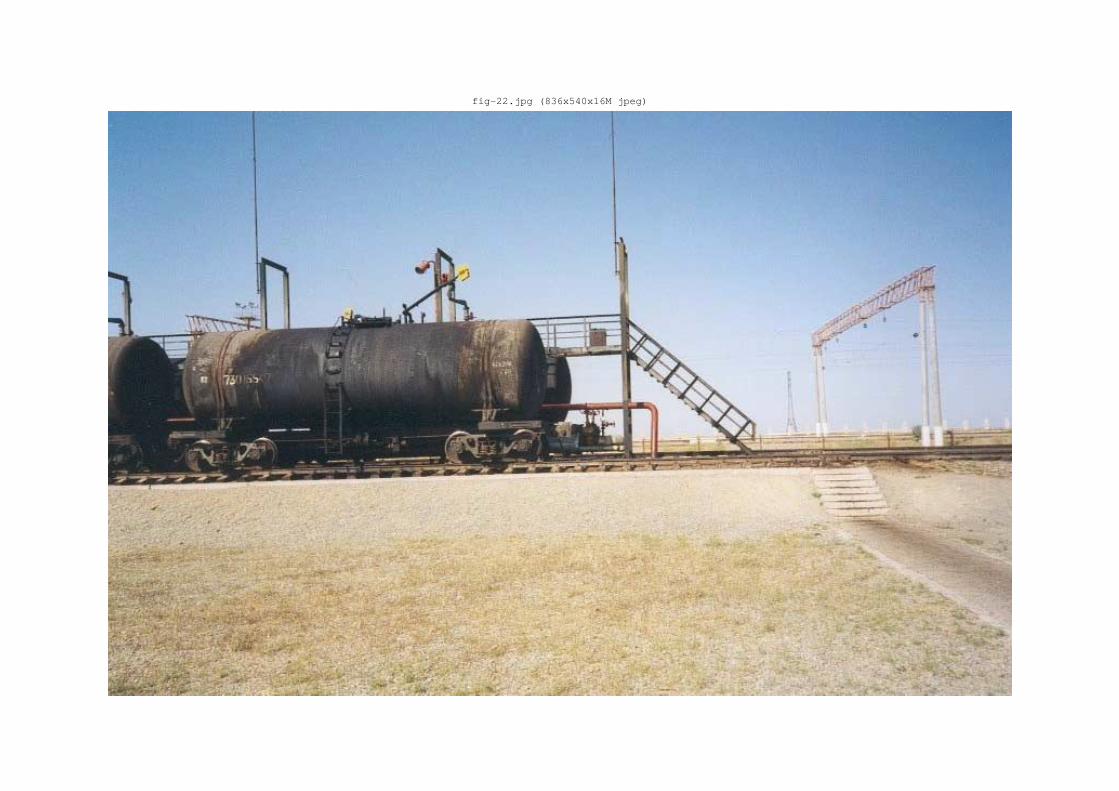
fig-22.jpg (836x540x16M jpeg)
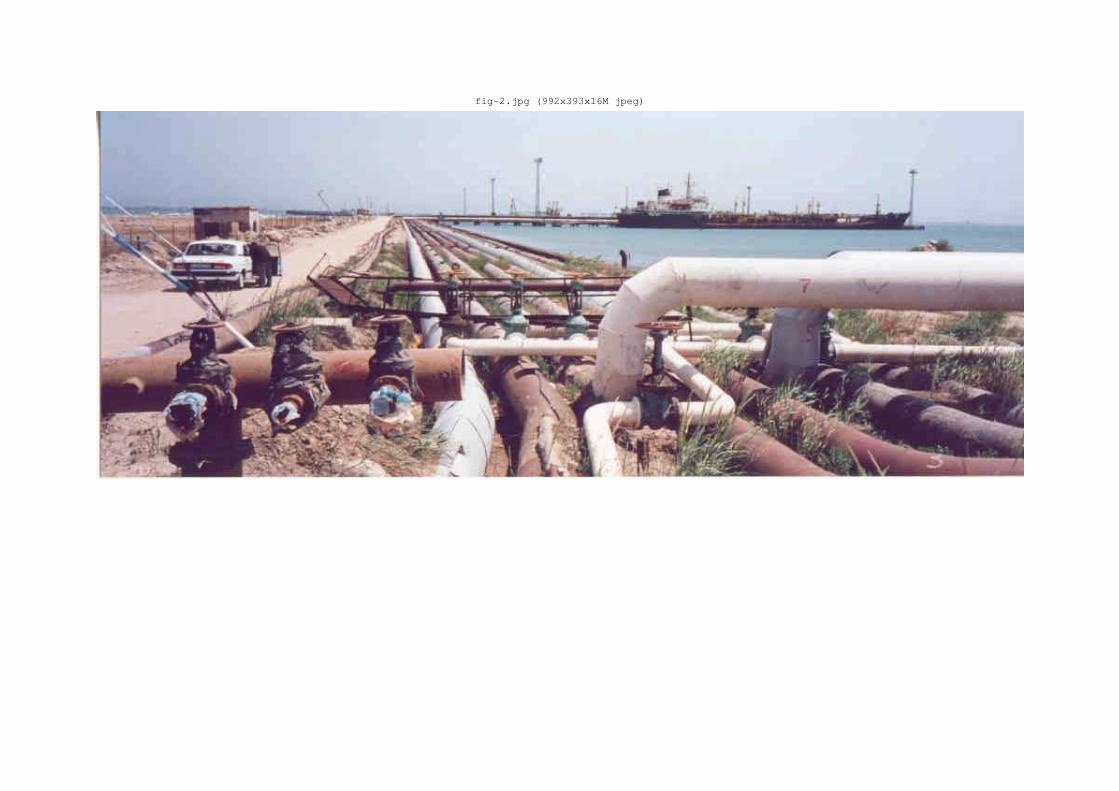
fig-2.jpg (992x393x16M jpeg)
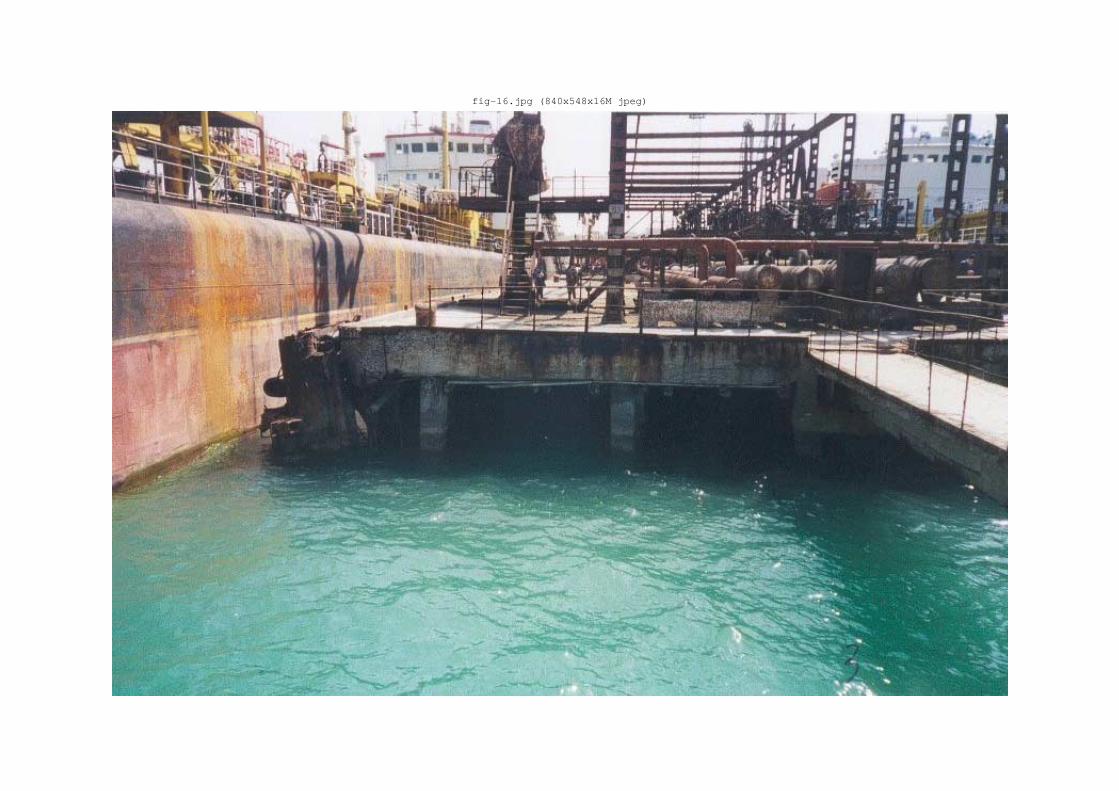
fig-16.jpg (840x548x16M jpeg)
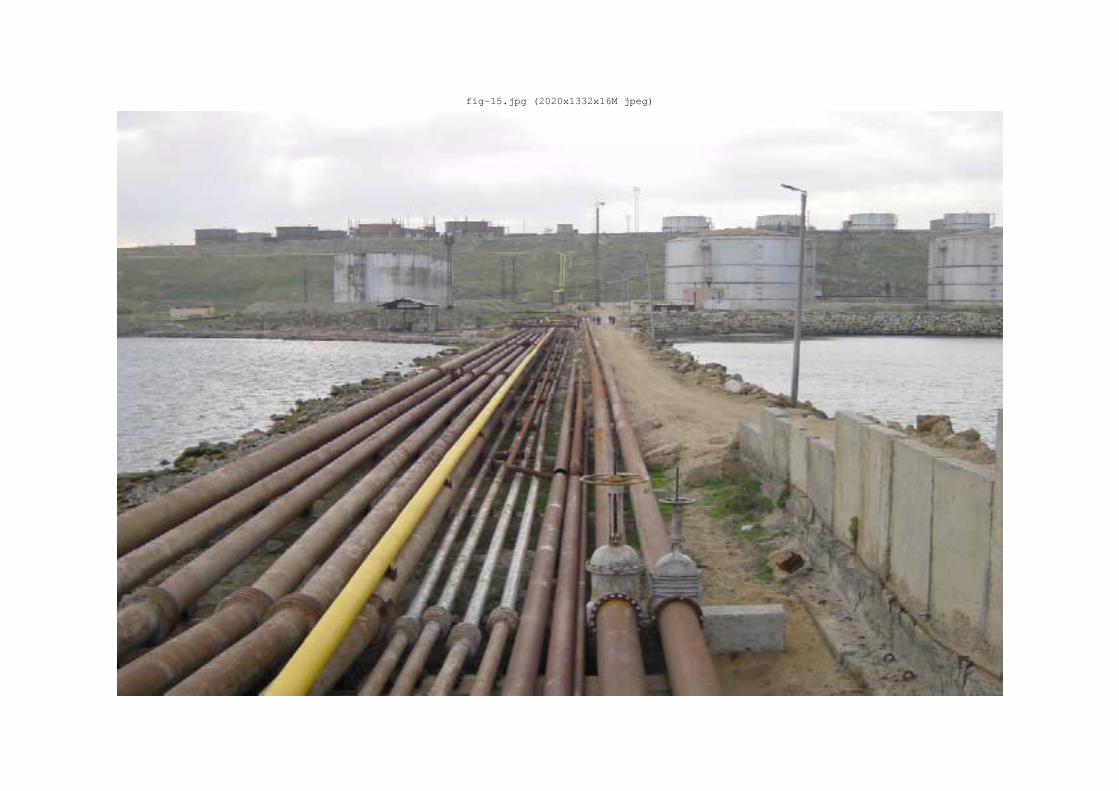
fig-15.jpg (2020x1332x16M jpeg)
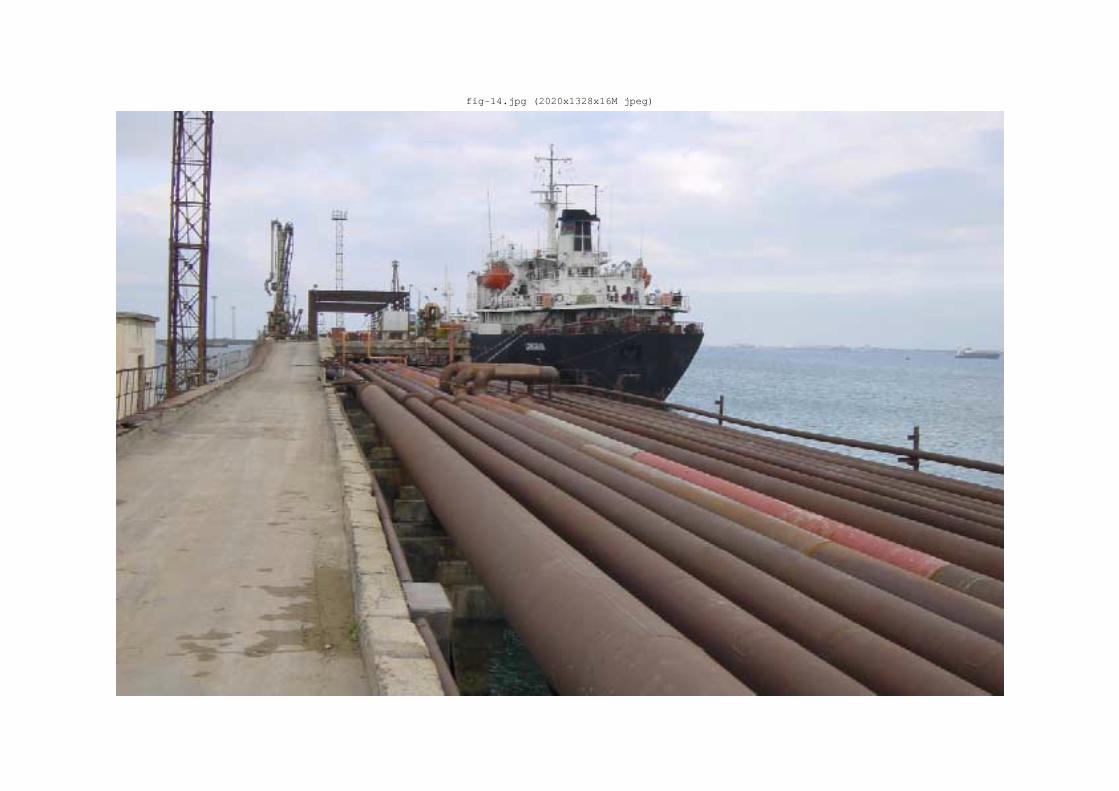
fig-14.jpg (2020x1328x16M jpeg)

fig-12.jpg (832x532x16M jpeg)
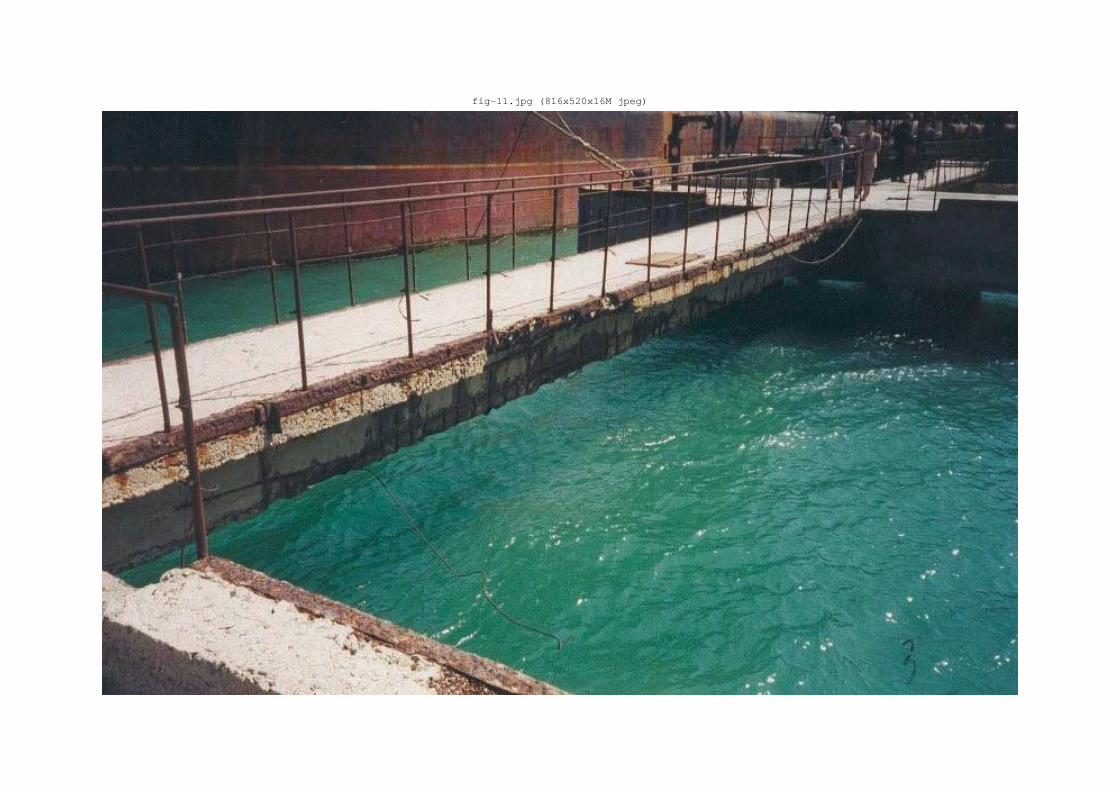
fig-11.jpg (816x520x16M jpeg)

fig-10.jpg (840x540x16M jpeg)
fig-1.jpg (995x395x16M jpeg)

fig-21.jpg (540x824x16M jpeg)

fig-20.jpg (1536x2048x16M jpeg)
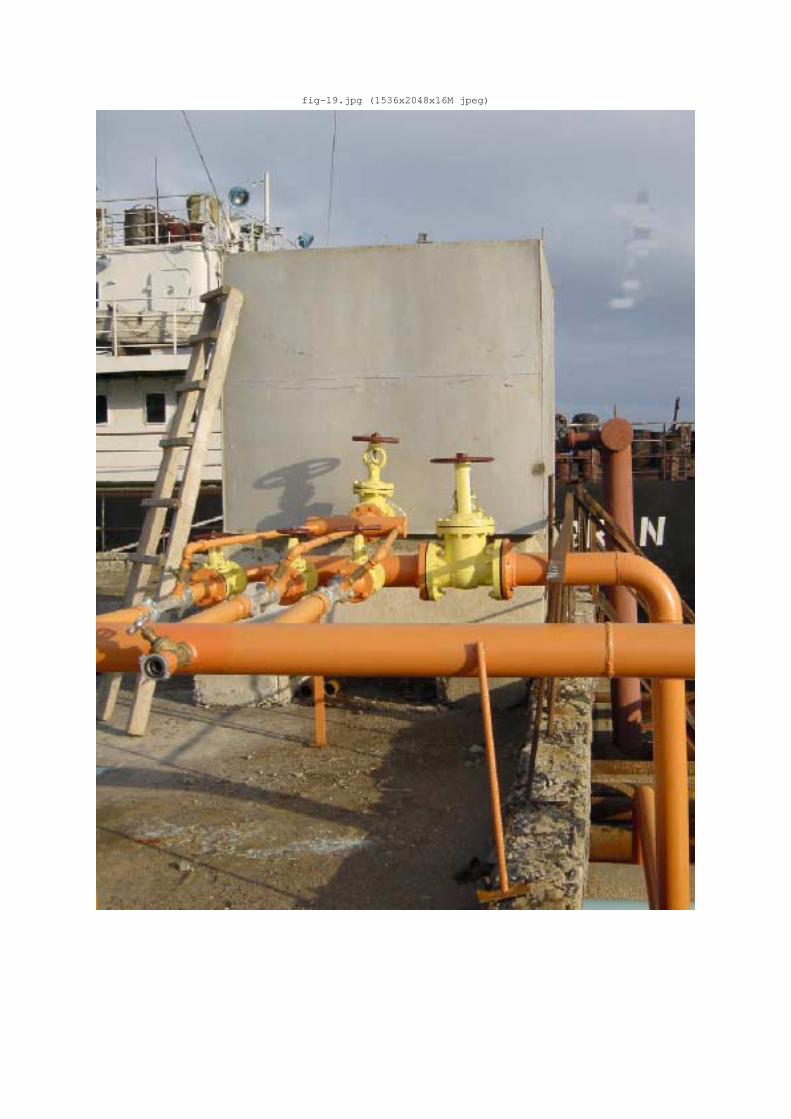
fig-19.jpg (1536x2048x16M jpeg)
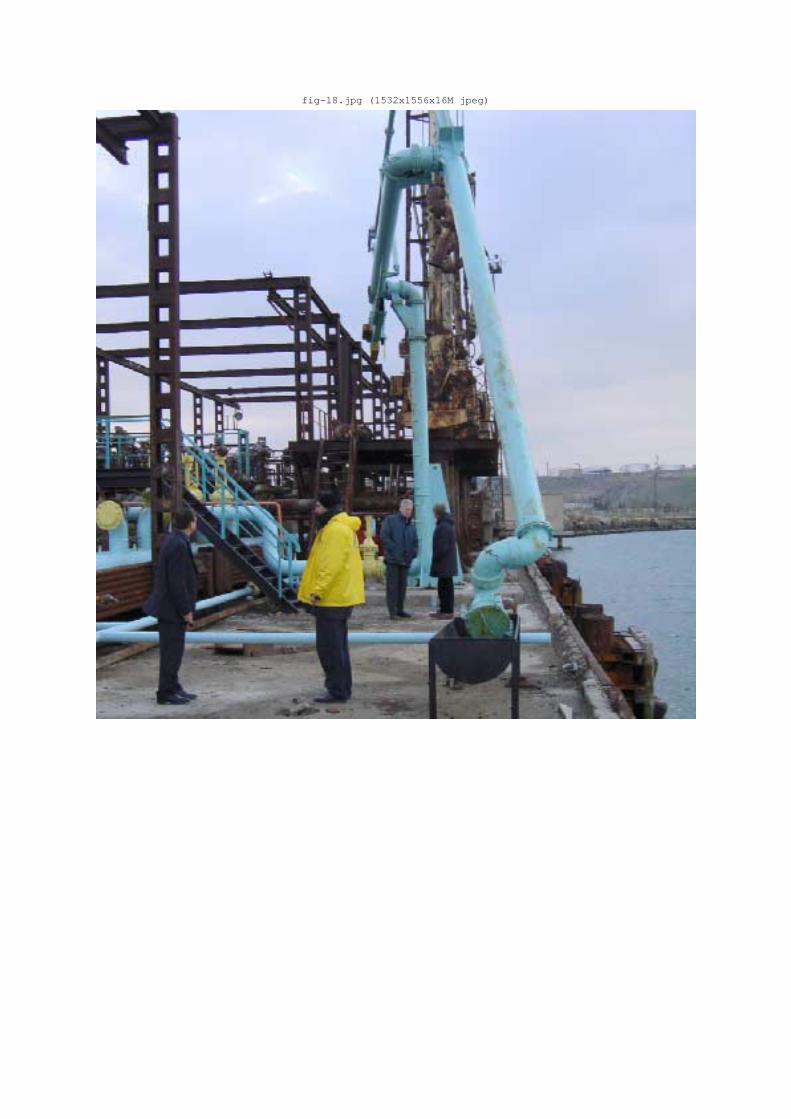
fig-18.jpg (1532x1556x16M jpeg)

fig-17.jpg (540x844x16M jpeg)

fig-13.jpg (544x840x16M jpeg)

Annex 3
Financial Tables (8 sheets)
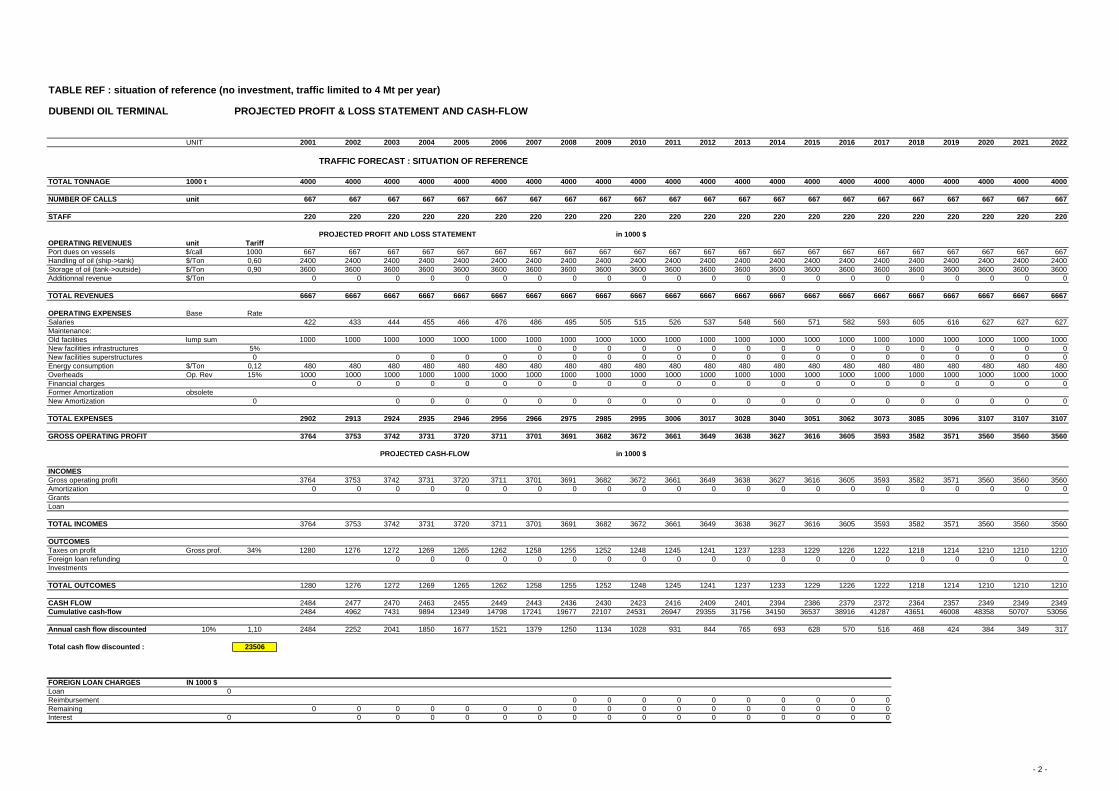
TABLE REF : situation of reference (no investment, traffic limited to 4 Mt per year)
DUBENDI OIL TERMINAL PROJECTED PROFIT & LOSS STATEMENT AND CASH-FLOW
UNIT 2001 2002 2003 2004 2005 2006 2007 2008 2009 2010 2011 2012 2013 2014 2015 2016 2017 2018 2019 2020 2021 2022
TRAFFIC FORECAST : SITUATION OF REFERENCE
TOTAL TONNAGE 1000 t 4000 4000 4000 4000 4000 4000 4000 4000 4000 4000 4000 4000 4000 4000 4000 4000 4000 4000 4000 4000 4000 4000
NUMBER OF CALLS unit 667 667 667 667 667 667 667 667 667 667 667 667 667 667 667 667 667 667 667 667 667 667
STAFF 220 220 220 220 220 220 220 220 220 220 220 220 220 220 220 220 220 220 220 220 220 220
PROJECTED PROFIT AND LOSS STATEMENT in 1000 $OPERATING REVENUES unit TariffPort dues on vessels $/call 1000 667 667 667 667 667 667 667 667 667 667 667 667 667 667 667 667 667 667 667 667 667 667Handling of oil (ship->tank) $/Ton 0,60 2400 2400 2400 2400 2400 2400 2400 2400 2400 2400 2400 2400 2400 2400 2400 2400 2400 2400 2400 2400 2400 2400Storage of oil (tank->outside) $/Ton 0,90 3600 3600 3600 3600 3600 3600 3600 3600 3600 3600 3600 3600 3600 3600 3600 3600 3600 3600 3600 3600 3600 3600Additionnal revenue $/Ton 0 0 0 0 0 0 0 0 0 0 0 0 0 0 0 0 0 0 0 0 0 0
TOTAL REVENUES 6667 6667 6667 6667 6667 6667 6667 6667 6667 6667 6667 6667 6667 6667 6667 6667 6667 6667 6667 6667 6667 6667
OPERATING EXPENSES Base RateSalaries 422 433 444 455 466 476 486 495 505 515 526 537 548 560 571 582 593 605 616 627 627 627Maintenance:Old facilities lump sum 1000 1000 1000 1000 1000 1000 1000 1000 1000 1000 1000 1000 1000 1000 1000 1000 1000 1000 1000 1000 1000 1000New facilities infrastructures 5% 0 0 0 0 0 0 0 0 0 0 0 0 0 0 0 0New facilities superstructures 0 0 0 0 0 0 0 0 0 0 0 0 0 0 0 0 0 0 0 0 0Energy consumption $/Ton 0,12 480 480 480 480 480 480 480 480 480 480 480 480 480 480 480 480 480 480 480 480 480 480Overheads Op. Rev 15% 1000 1000 1000 1000 1000 1000 1000 1000 1000 1000 1000 1000 1000 1000 1000 1000 1000 1000 1000 1000 1000 1000Financial charges 0 0 0 0 0 0 0 0 0 0 0 0 0 0 0 0 0 0 0 0 0 0Former Amortization obsoleteNew Amortization 0 0 0 0 0 0 0 0 0 0 0 0 0 0 0 0 0 0 0 0 0
TOTAL EXPENSES 2902 2913 2924 2935 2946 2956 2966 2975 2985 2995 3006 3017 3028 3040 3051 3062 3073 3085 3096 3107 3107 3107
GROSS OPERATING PROFIT 3764 3753 3742 3731 3720 3711 3701 3691 3682 3672 3661 3649 3638 3627 3616 3605 3593 3582 3571 3560 3560 3560
PROJECTED CASH-FLOW in 1000 $
INCOMESGross operating profit 3764 3753 3742 3731 3720 3711 3701 3691 3682 3672 3661 3649 3638 3627 3616 3605 3593 3582 3571 3560 3560 3560Amortization 0 0 0 0 0 0 0 0 0 0 0 0 0 0 0 0 0 0 0 0 0 0GrantsLoan
TOTAL INCOMES 3764 3753 3742 3731 3720 3711 3701 3691 3682 3672 3661 3649 3638 3627 3616 3605 3593 3582 3571 3560 3560 3560
OUTCOMESTaxes on profit Gross prof. 34% 1280 1276 1272 1269 1265 1262 1258 1255 1252 1248 1245 1241 1237 1233 1229 1226 1222 1218 1214 1210 1210 1210Foreign loan refunding 0 0 0 0 0 0 0 0 0 0 0 0 0 0 0 0 0 0 0 0Investments
TOTAL OUTCOMES 1280 1276 1272 1269 1265 1262 1258 1255 1252 1248 1245 1241 1237 1233 1229 1226 1222 1218 1214 1210 1210 1210
CASH FLOW 2484 2477 2470 2463 2455 2449 2443 2436 2430 2423 2416 2409 2401 2394 2386 2379 2372 2364 2357 2349 2349 2349Cumulative cash-flow 2484 4962 7431 9894 12349 14798 17241 19677 22107 24531 26947 29355 31756 34150 36537 38916 41287 43651 46008 48358 50707 53056
Annual cash flow discounted 10% 1,10 2484 2252 2041 1850 1677 1521 1379 1250 1134 1028 931 844 765 693 628 570 516 468 424 384 349 317
Total cash flow discounted : 23506
FOREIGN LOAN CHARGES IN 1000 $Loan 0Reimbursement 0 0 0 0 0 0 0 0 0 0Remaining 0 0 0 0 0 0 0 0 0 0 0 0 0 0 0 0 0Interest 0 0 0 0 0 0 0 0 0 0 0 0 0 0 0 0 0
- 2 -
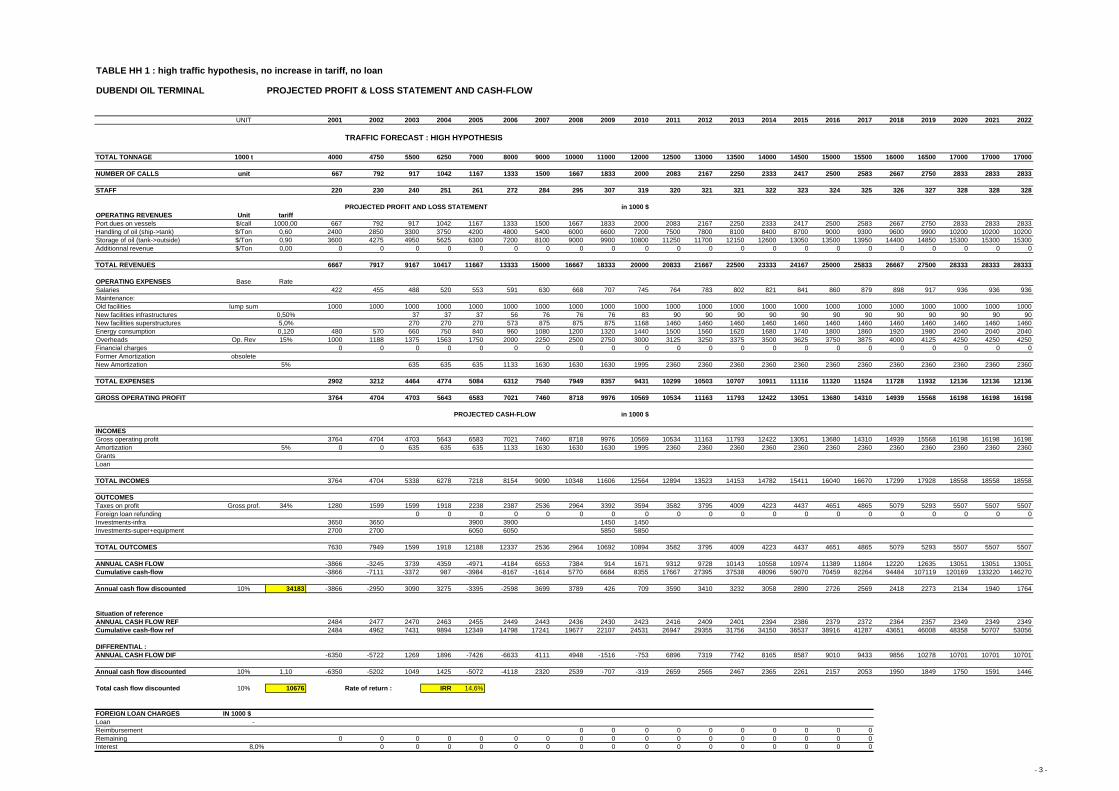
TABLE HH 1 : high traffic hypothesis, no increase in tariff, no loan
DUBENDI OIL TERMINAL PROJECTED PROFIT & LOSS STATEMENT AND CASH-FLOW
UNIT 2001 2002 2003 2004 2005 2006 2007 2008 2009 2010 2011 2012 2013 2014 2015 2016 2017 2018 2019 2020 2021 2022
TRAFFIC FORECAST : HIGH HYPOTHESIS
TOTAL TONNAGE 1000 t 4000 4750 5500 6250 7000 8000 9000 10000 11000 12000 12500 13000 13500 14000 14500 15000 15500 16000 16500 17000 17000 17000
NUMBER OF CALLS unit 667 792 917 1042 1167 1333 1500 1667 1833 2000 2083 2167 2250 2333 2417 2500 2583 2667 2750 2833 2833 2833
STAFF 220 230 240 251 261 272 284 295 307 319 320 321 321 322 323 324 325 326 327 328 328 328
PROJECTED PROFIT AND LOSS STATEMENT in 1000 $OPERATING REVENUES Unit tariffPort dues on vessels $/call 1000,00 667 792 917 1042 1167 1333 1500 1667 1833 2000 2083 2167 2250 2333 2417 2500 2583 2667 2750 2833 2833 2833Handling of oil (ship->tank) $/Ton 0,60 2400 2850 3300 3750 4200 4800 5400 6000 6600 7200 7500 7800 8100 8400 8700 9000 9300 9600 9900 10200 10200 10200Storage of oil (tank->outside) $/Ton 0,90 3600 4275 4950 5625 6300 7200 8100 9000 9900 10800 11250 11700 12150 12600 13050 13500 13950 14400 14850 15300 15300 15300Additionnal revenue $/Ton 0,00 0 0 0 0 0 0 0 0 0 0 0 0 0 0 0 0 0 0 0 0 0 0
TOTAL REVENUES 6667 7917 9167 10417 11667 13333 15000 16667 18333 20000 20833 21667 22500 23333 24167 25000 25833 26667 27500 28333 28333 28333
OPERATING EXPENSES Base RateSalaries 422 455 488 520 553 591 630 668 707 745 764 783 802 821 841 860 879 898 917 936 936 936Maintenance:Old facilities lump sum 1000 1000 1000 1000 1000 1000 1000 1000 1000 1000 1000 1000 1000 1000 1000 1000 1000 1000 1000 1000 1000 1000New facilities infrastructures 0,50% 37 37 37 56 76 76 76 83 90 90 90 90 90 90 90 90 90 90 90 90New facilities superstructures 5,0% 270 270 270 573 875 875 875 1168 1460 1460 1460 1460 1460 1460 1460 1460 1460 1460 1460 1460Energy consumption 0,120 480 570 660 750 840 960 1080 1200 1320 1440 1500 1560 1620 1680 1740 1800 1860 1920 1980 2040 2040 2040Overheads Op. Rev 15% 1000 1188 1375 1563 1750 2000 2250 2500 2750 3000 3125 3250 3375 3500 3625 3750 3875 4000 4125 4250 4250 4250Financial charges 0 0 0 0 0 0 0 0 0 0 0 0 0 0 0 0 0 0 0 0 0 0Former Amortization obsoleteNew Amortization 5% 635 635 635 1133 1630 1630 1630 1995 2360 2360 2360 2360 2360 2360 2360 2360 2360 2360 2360 2360
TOTAL EXPENSES 2902 3212 4464 4774 5084 6312 7540 7949 8357 9431 10299 10503 10707 10911 11116 11320 11524 11728 11932 12136 12136 12136
GROSS OPERATING PROFIT 3764 4704 4703 5643 6583 7021 7460 8718 9976 10569 10534 11163 11793 12422 13051 13680 14310 14939 15568 16198 16198 16198
PROJECTED CASH-FLOW in 1000 $
INCOMESGross operating profit 3764 4704 4703 5643 6583 7021 7460 8718 9976 10569 10534 11163 11793 12422 13051 13680 14310 14939 15568 16198 16198 16198Amortization 5% 0 0 635 635 635 1133 1630 1630 1630 1995 2360 2360 2360 2360 2360 2360 2360 2360 2360 2360 2360 2360GrantsLoan
TOTAL INCOMES 3764 4704 5338 6278 7218 8154 9090 10348 11606 12564 12894 13523 14153 14782 15411 16040 16670 17299 17928 18558 18558 18558
OUTCOMESTaxes on profit Gross prof. 34% 1280 1599 1599 1918 2238 2387 2536 2964 3392 3594 3582 3795 4009 4223 4437 4651 4865 5079 5293 5507 5507 5507Foreign loan refunding 0 0 0 0 0 0 0 0 0 0 0 0 0 0 0 0 0 0 0 0Investments-infra 3650 3650 3900 3900 1450 1450Investments-super+equipment 2700 2700 6050 6050 5850 5850
TOTAL OUTCOMES 7630 7949 1599 1918 12188 12337 2536 2964 10692 10894 3582 3795 4009 4223 4437 4651 4865 5079 5293 5507 5507 5507
ANNUAL CASH FLOW -3866 -3245 3739 4359 -4971 -4184 6553 7384 914 1671 9312 9728 10143 10558 10974 11389 11804 12220 12635 13051 13051 13051Cumulative cash-flow -3866 -7111 -3372 987 -3984 -8167 -1614 5770 6684 8355 17667 27395 37538 48096 59070 70459 82264 94484 107119 120169 133220 146270
Annual cash flow discounted 10% 34183 -3866 -2950 3090 3275 -3395 -2598 3699 3789 426 709 3590 3410 3232 3058 2890 2726 2569 2418 2273 2134 1940 1764
Situation of referenceANNUAL CASH FLOW REF 2484 2477 2470 2463 2455 2449 2443 2436 2430 2423 2416 2409 2401 2394 2386 2379 2372 2364 2357 2349 2349 2349Cumulative cash-flow ref 2484 4962 7431 9894 12349 14798 17241 19677 22107 24531 26947 29355 31756 34150 36537 38916 41287 43651 46008 48358 50707 53056
DIFFERENTIAL :ANNUAL CASH FLOW DIF -6350 -5722 1269 1896 -7426 -6633 4111 4948 -1516 -753 6896 7319 7742 8165 8587 9010 9433 9856 10278 10701 10701 10701
Annual cash flow discounted 10% 1,10 -6350 -5202 1049 1425 -5072 -4118 2320 2539 -707 -319 2659 2565 2467 2365 2261 2157 2053 1950 1849 1750 1591 1446
Total cash flow discounted 10% 10676 Rate of return : IRR 14,6%
FOREIGN LOAN CHARGES IN 1000 $Loan - Reimbursement 0 0 0 0 0 0 0 0 0 0Remaining 0 0 0 0 0 0 0 0 0 0 0 0 0 0 0 0 0Interest 8,0% 0 0 0 0 0 0 0 0 0 0 0 0 0 0 0 0
- 3 -

TABLE HH 2 : high traffic hypothesis, increased tariff (+ USD 0.45 per tonne), no loan
DUBENDI OIL TERMINAL PROJECTED PROFIT & LOSS STATEMENT AND CASH-FLOW
UNIT 2001 2002 2003 2004 2005 2006 2007 2008 2009 2010 2011 2012 2013 2014 2015 2016 2017 2018 2019 2020 2021 2022
TRAFFIC FORECAST : HIGH HYPOTHESIS
TOTAL TONNAGE 1000 t 4000 4750 5500 6250 7000 8000 9000 10000 11000 12000 12500 13000 13500 14000 14500 15000 15500 16000 16500 17000 17000 17000
NUMBER OF CALLS unit 667 792 917 1042 1167 1333 1500 1667 1833 2000 2083 2167 2250 2333 2417 2500 2583 2667 2750 2833 2833 2833
STAFF 220 230 240 251 261 272 284 295 307 319 320 321 321 322 323 324 325 326 327 328 328 328
PROJECTED PROFIT AND LOSS STATEMENT in 1000 $OPERATING REVENUES Unit tariffPort dues on vessels $/call 1000,00 667 792 917 1042 1167 1333 1500 1667 1833 2000 2083 2167 2250 2333 2417 2500 2583 2667 2750 2833 2833 2833Handling of oil (ship->tank) $/Ton 0,60 2400 2850 3300 3750 4200 4800 5400 6000 6600 7200 7500 7800 8100 8400 8700 9000 9300 9600 9900 10200 10200 10200Storage of oil (tank->outside) $/Ton 0,90 3600 4275 4950 5625 6300 7200 8100 9000 9900 10800 11250 11700 12150 12600 13050 13500 13950 14400 14850 15300 15300 15300Additionnal revenue $/Ton 0,45 1800 2138 2475 2813 3150 3600 4050 4500 4950 5400 5625 5850 6075 6300 6525 6750 6975 7200 7425 7650 7650 7650
TOTAL REVENUES 8467 10054 11642 13229 14817 16933 19050 21167 23283 25400 26458 27517 28575 29633 30692 31750 32808 33867 34925 35983 35983 35983
OPERATING EXPENSES Base RateSalaries 422 455 488 520 553 591 630 668 707 745 764 783 802 821 841 860 879 898 917 936 936 936Maintenance:Old facilities lump sum 1000 1000 1000 1000 1000 1000 1000 1000 1000 1000 1000 1000 1000 1000 1000 1000 1000 1000 1000 1000 1000 1000New facilities infrastructures 0,50% 37 37 37 56 76 76 76 83 90 90 90 90 90 90 90 90 90 90 90 90New facilities superstructures 5,0% 270 270 270 573 875 875 875 1168 1460 1460 1460 1460 1460 1460 1460 1460 1460 1460 1460 1460Energy consumption 0,120 480 570 660 750 840 960 1080 1200 1320 1440 1500 1560 1620 1680 1740 1800 1860 1920 1980 2040 2040 2040Overheads Op. Rev 15% 1270 1508 1746 1984 2223 2540 2858 3175 3493 3810 3969 4128 4286 4445 4604 4763 4921 5080 5239 5398 5398 5398Financial charges 0 0 0 0 0 0 0 0 0 0 0 0 0 0 0 0 0 0 0 0 0 0Former Amortization obsoleteNew Amortization 5% 635 635 635 1133 1630 1630 1630 1995 2360 2360 2360 2360 2360 2360 2360 2360 2360 2360 2360 2360
TOTAL EXPENSES 3172 3533 4835 5196 5557 6852 8148 8624 9100 10241 11143 11381 11619 11856 12094 12332 12570 12808 13045 13283 13283 13283
GROSS OPERATING PROFIT 5294 6521 6806 8033 9260 10081 10902 12543 14183 15159 15315 16136 16956 17777 18597 19418 20239 21059 21880 22700 22700 22700
PROJECTED CASH-FLOW in 1000 $
INCOMESGross operating profit 5294 6521 6806 8033 9260 10081 10902 12543 14183 15159 15315 16136 16956 17777 18597 19418 20239 21059 21880 22700 22700 22700Amortization 5% 0 0 635 635 635 1133 1630 1630 1630 1995 2360 2360 2360 2360 2360 2360 2360 2360 2360 2360 2360 2360GrantsLoan
TOTAL INCOMES 5294 6521 7441 8668 9895 11214 12532 14173 15813 17154 17675 18496 19316 20137 20957 21778 22599 23419 24240 25060 25060 25060
OUTCOMESTaxes on profit Gross prof. 34% 1800 2217 2314 2731 3148 3428 3707 4265 4822 5154 5207 5486 5765 6044 6323 6602 6881 7160 7439 7718 7718 7718Foreign loan refunding 0 0 0 0 0 0 0 0 0 0 0 0 0 0 0 0 0 0 0 0Investments-infra 3650 3650 3900 3900 1450 1450Investments-super+equipment 2700 2700 6050 6050 5850 5850
TOTAL OUTCOMES 8150 8567 2314 2731 13098 13378 3707 4265 12122 12454 5207 5486 5765 6044 6323 6602 6881 7160 7439 7718 7718 7718
ANNUAL CASH FLOW -2856 -2046 5127 5937 -3203 -2164 8825 9908 3691 4700 12468 13010 13551 14093 14634 15176 15717 16259 16801 17342 17342 17342Cumulative cash-flow -2856 -4902 225 6162 2959 795 9620 19529 23220 27920 40388 53397 66948 81041 95675 110851 126569 142828 159628 176971 194313 211655
Annual cash flow discounted 10% 56901 -2856 -1860 4237 4460 -2188 -1344 4982 5085 1722 1993 4807 4560 4318 4082 3854 3633 3421 3217 3022 2836 2578 2343
Situation of referenceANNUAL CASH FLOW REF 2484 2477 2470 2463 2455 2449 2443 2436 2430 2423 2416 2409 2401 2394 2386 2379 2372 2364 2357 2349 2349 2349Cumulative cash-flow ref 2484 4962 7431 9894 12349 14798 17241 19677 22107 24531 26947 29355 31756 34150 36537 38916 41287 43651 46008 48358 50707 53056
DIFFERENTIAL :ANNUAL CASH FLOW DIF -5340 -4523 2657 3474 -5659 -4613 6383 7472 1261 2277 10052 10601 11150 11699 12248 12797 13346 13895 14444 14993 14993 14993
Annual cash flow discounted 10% -5340 -4112 2196 2610 -3865 -2864 3603 3834 588 966 3875 3716 3553 3389 3225 3063 2904 2749 2598 2451 2229 2026
Total cash flow discounted 10% 33395 Rate of return : IRR 25,4%
FOREIGN LOAN CHARGES IN 1000 $Loan - Reimbursement 0 0 0 0 0 0 0 0 0 0Remaining 0 0 0 0 0 0 0 0 0 0 0 0 0 0 0 0 0Interest 8,0% 0 0 0 0 0 0 0 0 0 0 0 0 0 0 0 0
- 4 -
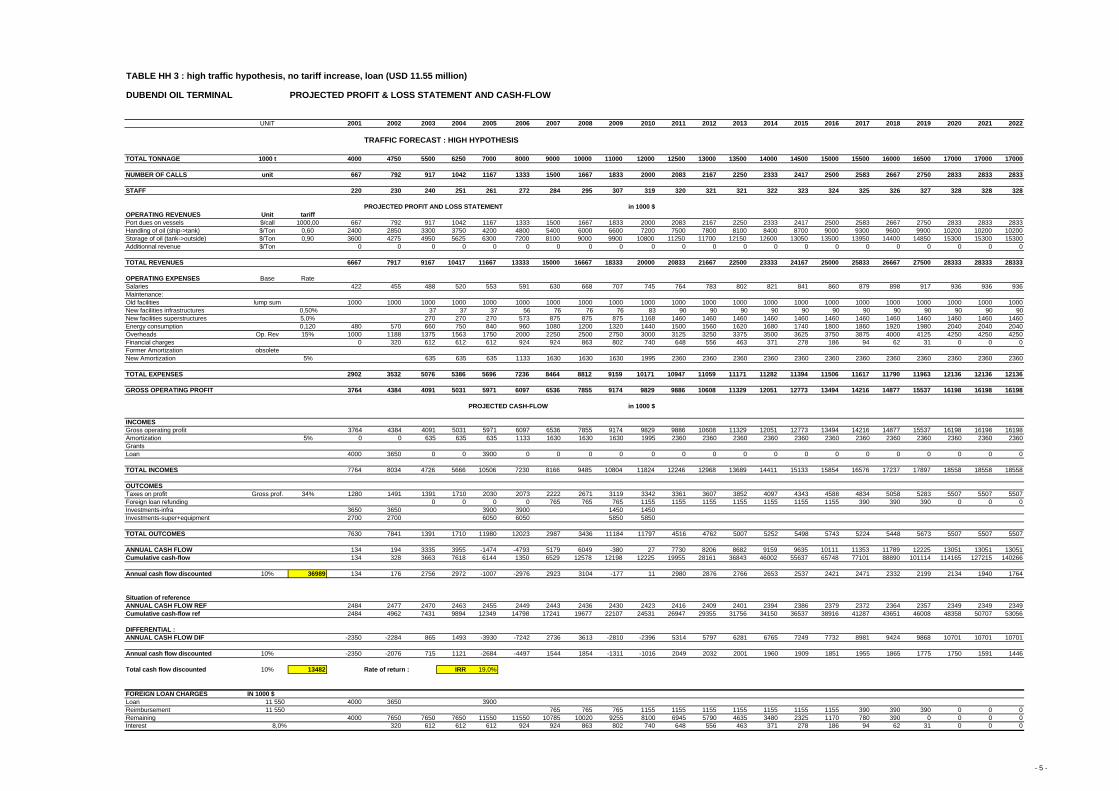
TABLE HH 3 : high traffic hypothesis, no tariff increase, loan (USD 11.55 million)
DUBENDI OIL TERMINAL PROJECTED PROFIT & LOSS STATEMENT AND CASH-FLOW
UNIT 2001 2002 2003 2004 2005 2006 2007 2008 2009 2010 2011 2012 2013 2014 2015 2016 2017 2018 2019 2020 2021 2022
TRAFFIC FORECAST : HIGH HYPOTHESIS
TOTAL TONNAGE 1000 t 4000 4750 5500 6250 7000 8000 9000 10000 11000 12000 12500 13000 13500 14000 14500 15000 15500 16000 16500 17000 17000 17000
NUMBER OF CALLS unit 667 792 917 1042 1167 1333 1500 1667 1833 2000 2083 2167 2250 2333 2417 2500 2583 2667 2750 2833 2833 2833
STAFF 220 230 240 251 261 272 284 295 307 319 320 321 321 322 323 324 325 326 327 328 328 328
PROJECTED PROFIT AND LOSS STATEMENT in 1000 $OPERATING REVENUES Unit tariffPort dues on vessels $/call 1000,00 667 792 917 1042 1167 1333 1500 1667 1833 2000 2083 2167 2250 2333 2417 2500 2583 2667 2750 2833 2833 2833Handling of oil (ship->tank) $/Ton 0,60 2400 2850 3300 3750 4200 4800 5400 6000 6600 7200 7500 7800 8100 8400 8700 9000 9300 9600 9900 10200 10200 10200Storage of oil (tank->outside) $/Ton 0,90 3600 4275 4950 5625 6300 7200 8100 9000 9900 10800 11250 11700 12150 12600 13050 13500 13950 14400 14850 15300 15300 15300Additionnal revenue $/Ton 0 0 0 0 0 0 0 0 0 0 0 0 0 0 0 0 0 0 0 0 0 0
TOTAL REVENUES 6667 7917 9167 10417 11667 13333 15000 16667 18333 20000 20833 21667 22500 23333 24167 25000 25833 26667 27500 28333 28333 28333
OPERATING EXPENSES Base RateSalaries 422 455 488 520 553 591 630 668 707 745 764 783 802 821 841 860 879 898 917 936 936 936Maintenance:Old facilities lump sum 1000 1000 1000 1000 1000 1000 1000 1000 1000 1000 1000 1000 1000 1000 1000 1000 1000 1000 1000 1000 1000 1000New facilities infrastructures 0,50% 37 37 37 56 76 76 76 83 90 90 90 90 90 90 90 90 90 90 90 90New facilities superstructures 5,0% 270 270 270 573 875 875 875 1168 1460 1460 1460 1460 1460 1460 1460 1460 1460 1460 1460 1460Energy consumption 0,120 480 570 660 750 840 960 1080 1200 1320 1440 1500 1560 1620 1680 1740 1800 1860 1920 1980 2040 2040 2040Overheads Op. Rev 15% 1000 1188 1375 1563 1750 2000 2250 2500 2750 3000 3125 3250 3375 3500 3625 3750 3875 4000 4125 4250 4250 4250Financial charges 0 320 612 612 612 924 924 863 802 740 648 556 463 371 278 186 94 62 31 0 0 0Former Amortization obsoleteNew Amortization 5% 635 635 635 1133 1630 1630 1630 1995 2360 2360 2360 2360 2360 2360 2360 2360 2360 2360 2360 2360
TOTAL EXPENSES 2902 3532 5076 5386 5696 7236 8464 8812 9159 10171 10947 11059 11171 11282 11394 11506 11617 11790 11963 12136 12136 12136
GROSS OPERATING PROFIT 3764 4384 4091 5031 5971 6097 6536 7855 9174 9829 9886 10608 11329 12051 12773 13494 14216 14877 15537 16198 16198 16198
PROJECTED CASH-FLOW in 1000 $
INCOMESGross operating profit 3764 4384 4091 5031 5971 6097 6536 7855 9174 9829 9886 10608 11329 12051 12773 13494 14216 14877 15537 16198 16198 16198Amortization 5% 0 0 635 635 635 1133 1630 1630 1630 1995 2360 2360 2360 2360 2360 2360 2360 2360 2360 2360 2360 2360GrantsLoan 4000 3650 0 0 3900 0 0 0 0 0 0 0 0 0 0 0 0 0 0 0 0 0
TOTAL INCOMES 7764 8034 4726 5666 10506 7230 8166 9485 10804 11824 12246 12968 13689 14411 15133 15854 16576 17237 17897 18558 18558 18558
OUTCOMESTaxes on profit Gross prof. 34% 1280 1491 1391 1710 2030 2073 2222 2671 3119 3342 3361 3607 3852 4097 4343 4588 4834 5058 5283 5507 5507 5507Foreign loan refunding 0 0 0 0 765 765 765 1155 1155 1155 1155 1155 1155 1155 390 390 390 0 0 0Investments-infra 3650 3650 3900 3900 1450 1450Investments-super+equipment 2700 2700 6050 6050 5850 5850
TOTAL OUTCOMES 7630 7841 1391 1710 11980 12023 2987 3436 11184 11797 4516 4762 5007 5252 5498 5743 5224 5448 5673 5507 5507 5507
ANNUAL CASH FLOW 134 194 3335 3955 -1474 -4793 5179 6049 -380 27 7730 8206 8682 9159 9635 10111 11353 11789 12225 13051 13051 13051Cumulative cash-flow 134 328 3663 7618 6144 1350 6529 12578 12198 12225 19955 28161 36843 46002 55637 65748 77101 88890 101114 114165 127215 140266
Annual cash flow discounted 10% 36989 134 176 2756 2972 -1007 -2976 2923 3104 -177 11 2980 2876 2766 2653 2537 2421 2471 2332 2199 2134 1940 1764
Situation of referenceANNUAL CASH FLOW REF 2484 2477 2470 2463 2455 2449 2443 2436 2430 2423 2416 2409 2401 2394 2386 2379 2372 2364 2357 2349 2349 2349Cumulative cash-flow ref 2484 4962 7431 9894 12349 14798 17241 19677 22107 24531 26947 29355 31756 34150 36537 38916 41287 43651 46008 48358 50707 53056
DIFFERENTIAL :ANNUAL CASH FLOW DIF -2350 -2284 865 1493 -3930 -7242 2736 3613 -2810 -2396 5314 5797 6281 6765 7249 7732 8981 9424 9868 10701 10701 10701
Annual cash flow discounted 10% -2350 -2076 715 1121 -2684 -4497 1544 1854 -1311 -1016 2049 2032 2001 1960 1909 1851 1955 1865 1775 1750 1591 1446
Total cash flow discounted 10% 13482 Rate of return : IRR 19,0%
FOREIGN LOAN CHARGES IN 1000 $Loan 11 550 4000 3650 3900Reimbursement 11 550 765 765 765 1155 1155 1155 1155 1155 1155 1155 390 390 390 0 0 0Remaining 4000 7650 7650 7650 11550 11550 10785 10020 9255 8100 6945 5790 4635 3480 2325 1170 780 390 0 0 0 0Interest 8,0% 320 612 612 612 924 924 863 802 740 648 556 463 371 278 186 94 62 31 0 0 0
- 5 -
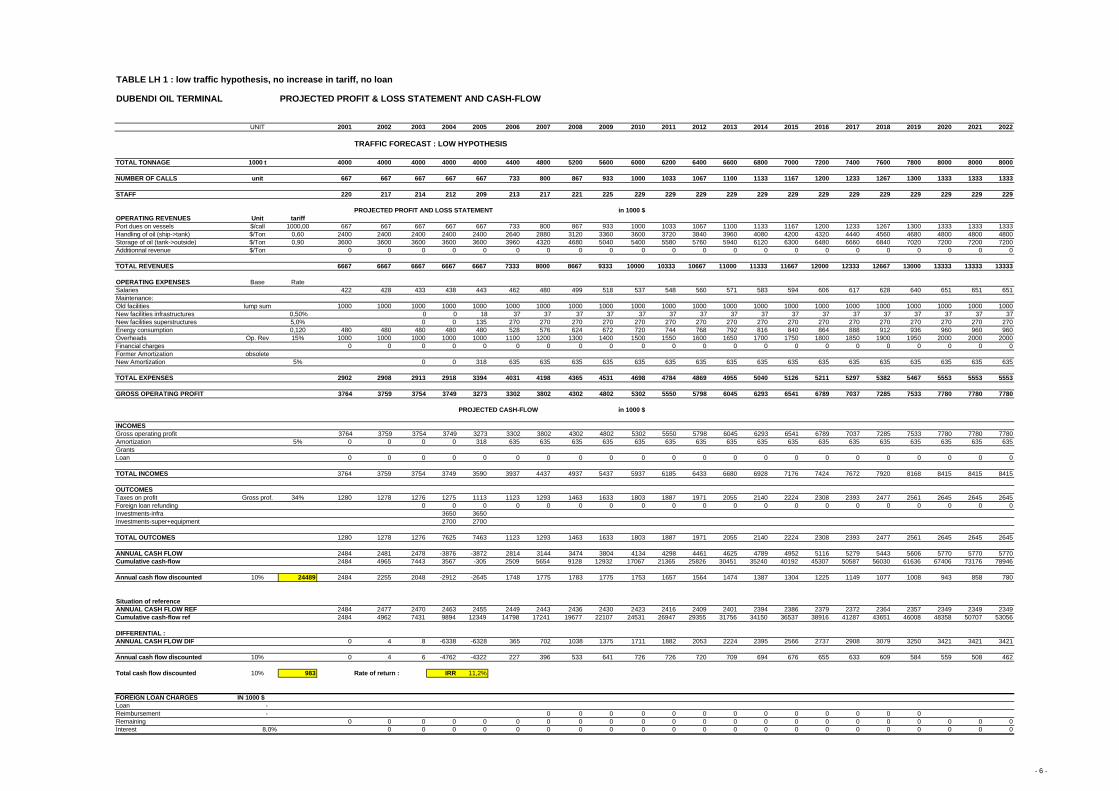
TABLE LH 1 : low traffic hypothesis, no increase in tariff, no loan
DUBENDI OIL TERMINAL PROJECTED PROFIT & LOSS STATEMENT AND CASH-FLOW
UNIT 2001 2002 2003 2004 2005 2006 2007 2008 2009 2010 2011 2012 2013 2014 2015 2016 2017 2018 2019 2020 2021 2022
TRAFFIC FORECAST : LOW HYPOTHESIS
TOTAL TONNAGE 1000 t 4000 4000 4000 4000 4000 4400 4800 5200 5600 6000 6200 6400 6600 6800 7000 7200 7400 7600 7800 8000 8000 8000
NUMBER OF CALLS unit 667 667 667 667 667 733 800 867 933 1000 1033 1067 1100 1133 1167 1200 1233 1267 1300 1333 1333 1333
STAFF 220 217 214 212 209 213 217 221 225 229 229 229 229 229 229 229 229 229 229 229 229 229
PROJECTED PROFIT AND LOSS STATEMENT in 1000 $OPERATING REVENUES Unit tariffPort dues on vessels $/call 1000,00 667 667 667 667 667 733 800 867 933 1000 1033 1067 1100 1133 1167 1200 1233 1267 1300 1333 1333 1333Handling of oil (ship->tank) $/Ton 0,60 2400 2400 2400 2400 2400 2640 2880 3120 3360 3600 3720 3840 3960 4080 4200 4320 4440 4560 4680 4800 4800 4800Storage of oil (tank->outside) $/Ton 0,90 3600 3600 3600 3600 3600 3960 4320 4680 5040 5400 5580 5760 5940 6120 6300 6480 6660 6840 7020 7200 7200 7200Additionnal revenue $/Ton 0 0 0 0 0 0 0 0 0 0 0 0 0 0 0 0 0 0 0 0 0 0
TOTAL REVENUES 6667 6667 6667 6667 6667 7333 8000 8667 9333 10000 10333 10667 11000 11333 11667 12000 12333 12667 13000 13333 13333 13333
OPERATING EXPENSES Base RateSalaries 422 428 433 438 443 462 480 499 518 537 548 560 571 583 594 606 617 628 640 651 651 651Maintenance:Old facilities lump sum 1000 1000 1000 1000 1000 1000 1000 1000 1000 1000 1000 1000 1000 1000 1000 1000 1000 1000 1000 1000 1000 1000New facilities infrastructures 0,50% 0 0 18 37 37 37 37 37 37 37 37 37 37 37 37 37 37 37 37 37New facilities superstructures 5,0% 0 0 135 270 270 270 270 270 270 270 270 270 270 270 270 270 270 270 270 270Energy consumption 0,120 480 480 480 480 480 528 576 624 672 720 744 768 792 816 840 864 888 912 936 960 960 960Overheads Op. Rev 15% 1000 1000 1000 1000 1000 1100 1200 1300 1400 1500 1550 1600 1650 1700 1750 1800 1850 1900 1950 2000 2000 2000Financial charges 0 0 0 0 0 0 0 0 0 0 0 0 0 0 0 0 0 0 0 0 0 0Former Amortization obsoleteNew Amortization 5% 0 0 318 635 635 635 635 635 635 635 635 635 635 635 635 635 635 635 635 635
TOTAL EXPENSES 2902 2908 2913 2918 3394 4031 4198 4365 4531 4698 4784 4869 4955 5040 5126 5211 5297 5382 5467 5553 5553 5553
GROSS OPERATING PROFIT 3764 3759 3754 3749 3273 3302 3802 4302 4802 5302 5550 5798 6045 6293 6541 6789 7037 7285 7533 7780 7780 7780
PROJECTED CASH-FLOW in 1000 $
INCOMESGross operating profit 3764 3759 3754 3749 3273 3302 3802 4302 4802 5302 5550 5798 6045 6293 6541 6789 7037 7285 7533 7780 7780 7780Amortization 5% 0 0 0 0 318 635 635 635 635 635 635 635 635 635 635 635 635 635 635 635 635 635GrantsLoan 0 0 0 0 0 0 0 0 0 0 0 0 0 0 0 0 0 0 0 0 0 0
TOTAL INCOMES 3764 3759 3754 3749 3590 3937 4437 4937 5437 5937 6185 6433 6680 6928 7176 7424 7672 7920 8168 8415 8415 8415
OUTCOMESTaxes on profit Gross prof. 34% 1280 1278 1276 1275 1113 1123 1293 1463 1633 1803 1887 1971 2055 2140 2224 2308 2393 2477 2561 2645 2645 2645Foreign loan refunding 0 0 0 0 0 0 0 0 0 0 0 0 0 0 0 0 0 0 0 0Investments-infra 3650 3650Investments-super+equipment 2700 2700
TOTAL OUTCOMES 1280 1278 1276 7625 7463 1123 1293 1463 1633 1803 1887 1971 2055 2140 2224 2308 2393 2477 2561 2645 2645 2645
ANNUAL CASH FLOW 2484 2481 2478 -3876 -3872 2814 3144 3474 3804 4134 4298 4461 4625 4789 4952 5116 5279 5443 5606 5770 5770 5770Cumulative cash-flow 2484 4965 7443 3567 -305 2509 5654 9128 12932 17067 21365 25826 30451 35240 40192 45307 50587 56030 61636 67406 73176 78946
Annual cash flow discounted 10% 24489 2484 2255 2048 -2912 -2645 1748 1775 1783 1775 1753 1657 1564 1474 1387 1304 1225 1149 1077 1008 943 858 780
Situation of referenceANNUAL CASH FLOW REF 2484 2477 2470 2463 2455 2449 2443 2436 2430 2423 2416 2409 2401 2394 2386 2379 2372 2364 2357 2349 2349 2349Cumulative cash-flow ref 2484 4962 7431 9894 12349 14798 17241 19677 22107 24531 26947 29355 31756 34150 36537 38916 41287 43651 46008 48358 50707 53056
DIFFERENTIAL :ANNUAL CASH FLOW DIF 0 4 8 -6338 -6328 365 702 1038 1375 1711 1882 2053 2224 2395 2566 2737 2908 3079 3250 3421 3421 3421
Annual cash flow discounted 10% 0 4 6 -4762 -4322 227 396 533 641 726 726 720 709 694 676 655 633 609 584 559 508 462
Total cash flow discounted 10% 983 Rate of return : IRR 11,2%
FOREIGN LOAN CHARGES IN 1000 $Loan - Reimbursement - 0 0 0 0 0 0 0 0 0 0 0 0 0Remaining 0 0 0 0 0 0 0 0 0 0 0 0 0 0 0 0 0 0 0 0 0 0Interest 8,0% 0 0 0 0 0 0 0 0 0 0 0 0 0 0 0 0 0 0 0 0 0
- 6 -

TABLE LH 2 : low traffic hypothesis, slight tariff increase (+ USD 0.03 per tonne), no loan
DUBENDI OIL TERMINAL PROJECTED PROFIT & LOSS STATEMENT AND CASH-FLOW
UNIT 2001 2002 2003 2004 2005 2006 2007 2008 2009 2010 2011 2012 2013 2014 2015 2016 2017 2018 2019 2020 2021 2022
TRAFFIC FORECAST : LOW HYPOTHESIS
TOTAL TONNAGE 1000 t 4000 4000 4000 4000 4000 4400 4800 5200 5600 6000 6200 6400 6600 6800 7000 7200 7400 7600 7800 8000 8000 8000
NUMBER OF CALLS unit 667 667 667 667 667 733 800 867 933 1000 1033 1067 1100 1133 1167 1200 1233 1267 1300 1333 1333 1333
STAFF 220 217 214 212 209 213 217 221 225 229 229 229 229 229 229 229 229 229 229 229 229 229
PROJECTED PROFIT AND LOSS STATEMENT in 1000 $OPERATING REVENUES Unit tariffPort dues on vessels $/call 1000,00 667 667 667 667 667 733 800 867 933 1000 1033 1067 1100 1133 1167 1200 1233 1267 1300 1333 1333 1333Handling of oil (ship->tank) $/Ton 0,60 2400 2400 2400 2400 2400 2640 2880 3120 3360 3600 3720 3840 3960 4080 4200 4320 4440 4560 4680 4800 4800 4800Storage of oil (tank->outside) $/Ton 0,90 3600 3600 3600 3600 3600 3960 4320 4680 5040 5400 5580 5760 5940 6120 6300 6480 6660 6840 7020 7200 7200 7200Additionnal revenue $/Ton 0,03 120 120 120 120 120 132 144 156 168 180 186 192 198 204 210 216 222 228 234 240 240 240
TOTAL REVENUES 6787 6787 6787 6787 6787 7465 8144 8823 9501 10180 10519 10859 11198 11537 11877 12216 12555 12895 13234 13573 13573 13573
OPERATING EXPENSES Base RateSalaries 422 428 433 438 443 462 480 499 518 537 548 560 571 583 594 606 617 628 640 651 651 651Maintenance:Old facilities lump sum 1000 1000 1000 1000 1000 1000 1000 1000 1000 1000 1000 1000 1000 1000 1000 1000 1000 1000 1000 1000 1000 1000New facilities infrastructures 0,50% 0 0 18 37 37 37 37 37 37 37 37 37 37 37 37 37 37 37 37 37New facilities superstructures 5,0% 0 0 135 270 270 270 270 270 270 270 270 270 270 270 270 270 270 270 270 270Energy consumption 0,120 480 480 480 480 480 528 576 624 672 720 744 768 792 816 840 864 888 912 936 960 960 960Overheads Op. Rev 15% 1018 1018 1018 1018 1018 1120 1222 1323 1425 1527 1578 1629 1680 1731 1782 1832 1883 1934 1985 2036 2036 2036Financial charges 0 0 0 0 0 0 0 0 0 0 0 0 0 0 0 0 0 0 0 0 0 0Former Amortization obsoleteNew Amortization 5% 0 0 318 635 635 635 635 635 635 635 635 635 635 635 635 635 635 635 635 635
TOTAL EXPENSES 2920 2926 2931 2936 3412 4051 4220 4388 4557 4725 4811 4898 4984 5071 5157 5243 5330 5416 5503 5589 5589 5589
GROSS OPERATING PROFIT 3866 3861 3856 3851 3375 3414 3924 4435 4945 5455 5708 5961 6214 6467 6720 6973 7226 7478 7731 7984 7984 7984
PROJECTED CASH-FLOW in 1000 $
INCOMESGross operating profit 3866 3861 3856 3851 3375 3414 3924 4435 4945 5455 5708 5961 6214 6467 6720 6973 7226 7478 7731 7984 7984 7984Amortization 5% 0 0 0 0 318 635 635 635 635 635 635 635 635 635 635 635 635 635 635 635 635 635GrantsLoan 0 0 0 0 0 0 0 0 0 0 0 0 0 0 0 0 0 0 0 0 0 0
TOTAL INCOMES 3866 3861 3856 3851 3692 4049 4559 5070 5580 6090 6343 6596 6849 7102 7355 7608 7861 8113 8366 8619 8619 8619
OUTCOMESTaxes on profit Gross prof. 34% 1315 1313 1311 1309 1147 1161 1334 1508 1681 1855 1941 2027 2113 2199 2285 2371 2457 2543 2629 2715 2715 2715Foreign loan refunding 0 0 0 0 0 0 0 0 0 0 0 0 0 0 0 0 0 0 0 0Investments-infra 3650 3650Investments-super+equipment 2700 2700
TOTAL OUTCOMES 1315 1313 1311 7659 7497 1161 1334 1508 1681 1855 1941 2027 2113 2199 2285 2371 2457 2543 2629 2715 2715 2715
ANNUAL CASH FLOW 2552 2548 2545 -3808 -3805 2888 3225 3562 3899 4235 4402 4569 4736 4903 5070 5237 5404 5571 5738 5905 5905 5905Cumulative cash-flow 2552 5100 7645 3837 31 2920 6145 9707 13606 17841 22243 26812 31548 36451 41521 46758 52162 57733 63471 69375 75280 81185
Annual cash flow discounted 10% 25336 2552 2317 2103 -2861 -2599 1794 1821 1828 1819 1796 1697 1601 1509 1420 1335 1254 1176 1102 1032 965 878 798
Situation of referenceANNUAL CASH FLOW REF 2484 2477 2470 2463 2455 2449 2443 2436 2430 2423 2416 2409 2401 2394 2386 2379 2372 2364 2357 2349 2349 2349Cumulative cash-flow ref 2484 4962 7431 9894 12349 14798 17241 19677 22107 24531 26947 29355 31756 34150 36537 38916 41287 43651 46008 48358 50707 53056
DIFFERENTIAL :ANNUAL CASH FLOW DIF 67 71 75 -6271 -6260 439 783 1126 1469 1812 1986 2161 2335 2509 2684 2858 3032 3207 3381 3555 3555 3555
Annual cash flow discounted 10% 67 65 62 -4712 -4276 273 442 578 685 768 766 757 744 727 707 684 660 634 608 581 528 480
Total cash flow discounted 10% 1830 Rate of return : IRR 12,2%
FOREIGN LOAN CHARGES IN 1000 $Loan - Reimbursement - 0 0 0 0 0 0 0 0 0 0 0 0 0Remaining 0 0 0 0 0 0 0 0 0 0 0 0 0 0 0 0 0 0 0 0 0 0Interest 8,0% 0 0 0 0 0 0 0 0 0 0 0 0 0 0 0 0 0 0 0 0 0
- 7 -

TABLE LH 3 : low traffic hypothesis, no increase in tariff, loan (USD 0.4 million)
DUBENDI OIL TERMINAL PROJECTED PROFIT & LOSS STATEMENT AND CASH-FLOW
UNIT 2001 2002 2003 2004 2005 2006 2007 2008 2009 2010 2011 2012 2013 2014 2015 2016 2017 2018 2019 2020 2021 2022
TRAFFIC FORECAST : LOW HYPOTHESIS
TOTAL TONNAGE 1000 t 4000 4000 4000 4000 4000 4400 4800 5200 5600 6000 6200 6400 6600 6800 7000 7200 7400 7600 7800 8000 8000 8000
NUMBER OF CALLS unit 667 667 667 667 667 733 800 867 933 1000 1033 1067 1100 1133 1167 1200 1233 1267 1300 1333 1333 1333
STAFF 220 217 214 212 209 213 217 221 225 229 229 229 229 229 229 229 229 229 229 229 229 229
PROJECTED PROFIT AND LOSS STATEMENT in 1000 $OPERATING REVENUES Unit tariffPort dues on vessels $/call 1000,00 667 667 667 667 667 733 800 867 933 1000 1033 1067 1100 1133 1167 1200 1233 1267 1300 1333 1333 1333Handling of oil (ship->tank) $/Ton 0,60 2400 2400 2400 2400 2400 2640 2880 3120 3360 3600 3720 3840 3960 4080 4200 4320 4440 4560 4680 4800 4800 4800Storage of oil (tank->outside) $/Ton 0,90 3600 3600 3600 3600 3600 3960 4320 4680 5040 5400 5580 5760 5940 6120 6300 6480 6660 6840 7020 7200 7200 7200Additionnal revenue $/Ton 0,00 0 0 0 0 0 0 0 0 0 0 0 0 0 0 0 0 0 0 0 0 0 0
TOTAL REVENUES 6667 6667 6667 6667 6667 7333 8000 8667 9333 10000 10333 10667 11000 11333 11667 12000 12333 12667 13000 13333 13333 13333
OPERATING EXPENSES Base RateSalaries 422 428 433 438 443 462 480 499 518 537 548 560 571 583 594 606 617 628 640 651 651 651Maintenance:Old facilities lump sum 1000 1000 1000 1000 1000 1000 1000 1000 1000 1000 1000 1000 1000 1000 1000 1000 1000 1000 1000 1000 1000 1000New facilities infrastructures 0,50% 0 0 18 37 37 37 37 37 37 37 37 37 37 37 37 37 37 37 37 37New facilities superstructures 5,0% 0 0 135 270 270 270 270 270 270 270 270 270 270 270 270 270 270 270 270 270Energy consumption 0,120 480 480 480 480 480 528 576 624 672 720 744 768 792 816 840 864 888 912 936 960 960 960Overheads Op. Rev 15% 1000 1000 1000 1000 1000 1100 1200 1300 1400 1500 1550 1600 1650 1700 1750 1800 1850 1900 1950 2000 2000 2000Financial charges 0 0 0 0 0 32 32 32 32 32 29 26 22 19 16 13 10 6 3 0 0 0Former Amortization obsoleteNew Amortization 5% 0 0 318 635 635 635 635 635 635 635 635 635 635 635 635 635 635 635 635 635
TOTAL EXPENSES 2902 2908 2913 2918 3394 4063 4230 4397 4563 4730 4812 4895 4977 5059 5142 5224 5306 5388 5471 5553 5553 5553
GROSS OPERATING PROFIT 3764 3759 3754 3749 3273 3270 3770 4270 4770 5270 5521 5772 6023 6274 6525 6776 7027 7278 7529 7780 7780 7780
PROJECTED CASH-FLOW in 1000 $
INCOMESGross operating profit 3764 3759 3754 3749 3273 3270 3770 4270 4770 5270 5521 5772 6023 6274 6525 6776 7027 7278 7529 7780 7780 7780Amortization 5% 0 0 0 0 318 635 635 635 635 635 635 635 635 635 635 635 635 635 635 635 635 635GrantsLoan 0 0 0 0 400 0 0 0 0 0 0 0 0 0 0 0 0 0 0 0 0 0
TOTAL INCOMES 3764 3759 3754 3749 3990 3905 4405 4905 5405 5905 6156 6407 6658 6909 7160 7411 7662 7913 8164 8415 8415 8415
OUTCOMESTaxes on profit Gross prof. 34% 1280 1278 1276 1275 1113 1112 1282 1452 1622 1792 1877 1962 2048 2133 2219 2304 2389 2475 2560 2645 2645 2645Foreign loan refunding 0 0 0 0 0 0 0 40 40 40 40 40 40 40 40 40 40 0 0 0Investments-infra 3650 3650Investments-super+equipment 2700 2700
TOTAL OUTCOMES 1280 1278 1276 7625 7463 1112 1282 1452 1622 1832 1917 2002 2088 2173 2259 2344 2429 2515 2600 2645 2645 2645
ANNUAL CASH FLOW 2484 2481 2478 -3876 -3472 2793 3123 3453 3783 4073 4239 4405 4570 4736 4902 5067 5233 5399 5564 5770 5770 5770Cumulative cash-flow 2484 4965 7443 3567 95 2888 6011 9465 13248 17321 21560 25964 30535 35271 40172 45239 50472 55871 61435 67205 72976 78746
Annual cash flow discounted 10% 24564 2484 2255 2048 -2912 -2372 1734 1763 1772 1765 1727 1634 1544 1456 1372 1291 1213 1139 1068 1001 943 858 780
Situation of referenceANNUAL CASH FLOW REF 2484 2477 2470 2463 2455 2449 2443 2436 2430 2423 2416 2409 2401 2394 2386 2379 2372 2364 2357 2349 2349 2349Cumulative cash-flow ref 2484 4962 7431 9894 12349 14798 17241 19677 22107 24531 26947 29355 31756 34150 36537 38916 41287 43651 46008 48358 50707 53056
DIFFERENTIAL :ANNUAL CASH FLOW DIF 0 4 8 -6338 -5928 344 681 1017 1353 1650 1823 1996 2169 2342 2515 2688 2861 3034 3208 3421 3421 3421
Annual cash flow discounted 10% 0 4 6 -4762 -4049 214 384 522 631 700 703 700 691 678 662 644 623 600 577 559 508 462
Total cash flow discounted 10% 1058 Rate of return : IRR 11,3%
FOREIGN LOAN CHARGES IN 1000 $Loan 400 400Reimbursement 400 40 40 40 40 40 40 40 40 40 40Remaining 0 0 0 0 400 400 400 400 400 360 320 280 240 200 160 120 80 40 0 0 0 0Interest 8,0% 0 0 0 0 32 32 32 32 32 29 26 22 19 16 13 10 6 3 0 0 0
- 8 -
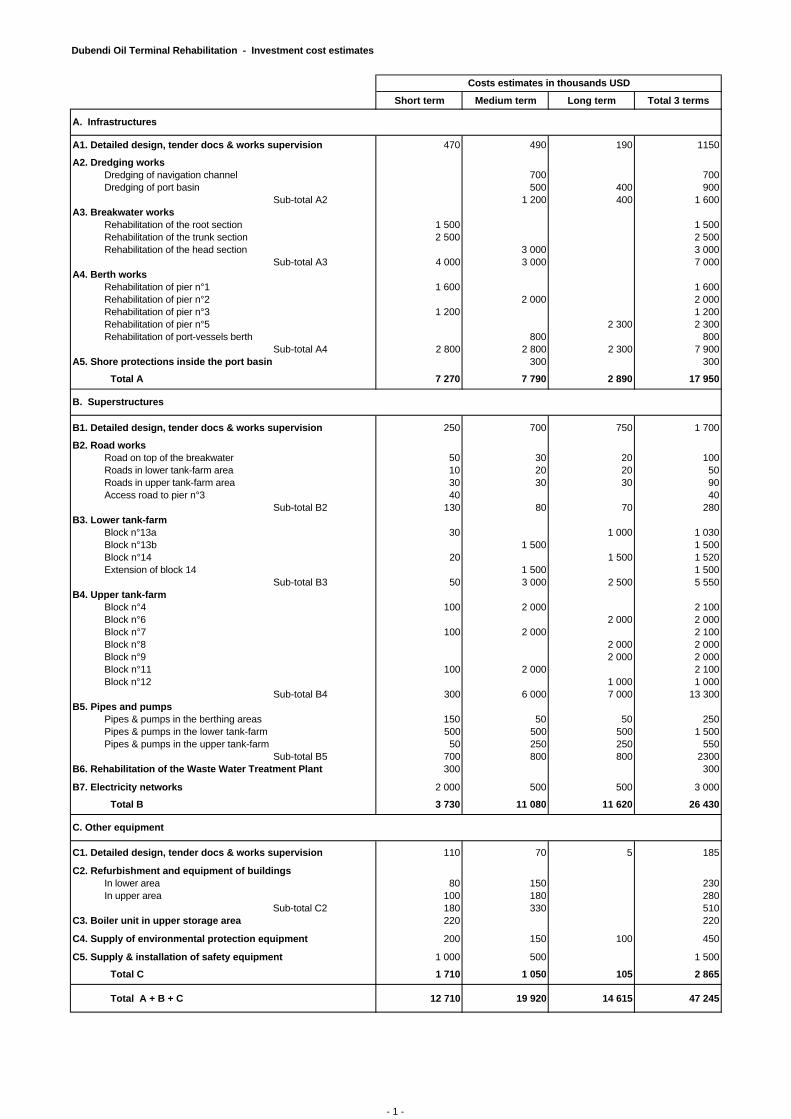
Dubendi Oil Terminal Rehabilitation - Investment cost estimates
Short term Medium term Long term Total 3 terms
A1. Detailed design, tender docs & works supervision 470 490 190 1150
A2. Dredging worksDredging of navigation channel 700 700Dredging of port basin 500 400 900
Sub-total A2 1 200 400 1 600A3. Breakwater works
Rehabilitation of the root section 1 500 1 500Rehabilitation of the trunk section 2 500 2 500Rehabilitation of the head section 3 000 3 000
Sub-total A3 4 000 3 000 7 000A4. Berth works
Rehabilitation of pier n°1 1 600 1 600Rehabilitation of pier n°2 2 000 2 000Rehabilitation of pier n°3 1 200 1 200Rehabilitation of pier n°5 2 300 2 300Rehabilitation of port-vessels berth 800 800
Sub-total A4 2 800 2 800 2 300 7 900A5. Shore protections inside the port basin 300 300
Total A 7 270 7 790 2 890 17 950
B1. Detailed design, tender docs & works supervision 250 700 750 1 700
B2. Road worksRoad on top of the breakwater 50 30 20 100Roads in lower tank-farm area 10 20 20 50Roads in upper tank-farm area 30 30 30 90Access road to pier n°3 40 40
Sub-total B2 130 80 70 280B3. Lower tank-farm
Block n°13a 30 1 000 1 030Block n°13b 1 500 1 500Block n°14 20 1 500 1 520Extension of block 14 1 500 1 500
Sub-total B3 50 3 000 2 500 5 550B4. Upper tank-farm
Block n°4 100 2 000 2 100Block n°6 2 000 2 000Block n°7 100 2 000 2 100Block n°8 2 000 2 000Block n°9 2 000 2 000Block n°11 100 2 000 2 100Block n°12 1 000 1 000
Sub-total B4 300 6 000 7 000 13 300B5. Pipes and pumps
Pipes & pumps in the berthing areas 150 50 50 250Pipes & pumps in the lower tank-farm 500 500 500 1 500Pipes & pumps in the upper tank-farm 50 250 250 550
Sub-total B5 700 800 800 2300B6. Rehabilitation of the Waste Water Treatment Plant 300 300
B7. Electricity networks 2 000 500 500 3 000
Total B 3 730 11 080 11 620 26 430
C1. Detailed design, tender docs & works supervision 110 70 5 185
C2. Refurbishment and equipment of buildingsIn lower area 80 150 230In upper area 100 180 280
Sub-total C2 180 330 510C3. Boiler unit in upper storage area 220 220
C4. Supply of environmental protection equipment 200 150 100 450
C5. Supply & installation of safety equipment 1 000 500 1 500
Total C 1 710 1 050 105 2 865
Total A + B + C 12 710 19 920 14 615 47 245
C. Other equipment
A. Infrastructures
B. Superstructures
Costs estimates in thousands USD
- 1 -
Annex 4
Maps and Drawings
! Traceca map ! Global "oil map" ! Dubendi – Channel and port layout ! Dubendi – Marine and land facilities ! Piers n°1 & n°2 – Oil transfer scheme ! Pier n°3 – Oil transfer scheme ! Existing power supply scheme ! Directory scheme for power supply ! Piping and power supply diagrams ! Short-term flow diagram ! Medium-term flow diagram ! Long-term flow diagram ! Breakwater head ! Breakwater root and trunk ! Pier cross-section ! Pier longitudinal section ! Port-vessel berth