Trace Metals in Phosphate Fertilizers Used in Eastern ...
30
HAL Id: hal-02151873 https://hal.archives-ouvertes.fr/hal-02151873 Submitted on 10 Jun 2019 HAL is a multi-disciplinary open access archive for the deposit and dissemination of sci- entific research documents, whether they are pub- lished or not. The documents may come from teaching and research institutions in France or abroad, or from public or private research centers. L’archive ouverte pluridisciplinaire HAL, est destinée au dépôt et à la diffusion de documents scientifiques de niveau recherche, publiés ou non, émanant des établissements d’enseignement et de recherche français ou étrangers, des laboratoires publics ou privés. Trace Metals in Phosphate Fertilizers Used in Eastern Mediterranean Countries Valérie Azzi, Antoine El Samrani, Bruno Lartiges, Ahmad Kobeissi, Ali Kanso, Véronique Kazpard To cite this version: Valérie Azzi, Antoine El Samrani, Bruno Lartiges, Ahmad Kobeissi, Ali Kanso, et al.. Trace Metals in Phosphate Fertilizers Used in Eastern Mediterranean Countries. CLEAN - Soil, Air, Water, Wiley, 2017, 45 (1), 10.1002/clen.201500988. hal-02151873
Transcript of Trace Metals in Phosphate Fertilizers Used in Eastern ...
HAL Id: hal-02151873https://hal.archives-ouvertes.fr/hal-02151873
Submitted on 10 Jun 2019
HAL is a multi-disciplinary open accessarchive for the deposit and dissemination of sci-entific research documents, whether they are pub-lished or not. The documents may come fromteaching and research institutions in France orabroad, or from public or private research centers.
L’archive ouverte pluridisciplinaire HAL, estdestinée au dépôt et à la diffusion de documentsscientifiques de niveau recherche, publiés ou non,émanant des établissements d’enseignement et derecherche français ou étrangers, des laboratoirespublics ou privés.
Trace Metals in Phosphate Fertilizers Used in EasternMediterranean Countries
Valérie Azzi, Antoine El Samrani, Bruno Lartiges, Ahmad Kobeissi, AliKanso, Véronique Kazpard
To cite this version:Valérie Azzi, Antoine El Samrani, Bruno Lartiges, Ahmad Kobeissi, Ali Kanso, et al.. Trace Metalsin Phosphate Fertilizers Used in Eastern Mediterranean Countries. CLEAN - Soil, Air, Water, Wiley,2017, 45 (1), �10.1002/clen.201500988�. �hal-02151873�

Trace metals in phosphate fertilizers used in Eastern Mediterranean countries
Valérie Azzi 1,2,3
, Antoine G. El Samrani 1
, Bruno Lartiges 2, Ahmad Kobeissi
4, Ali Kanso
1,
Véronique Kazpard 1
1 Platform for Research and Analysis in Environmental Sciences, Doctoral School of Science and
Technology, Faculty of Sciences, Lebanese University, P.O Box. 5, Campus Rafic Hariri-Beirut-
Lebanon. [email protected], [email protected], [email protected],
2 University of Toulouse (Paul Sabatier), Geosciences Environment Toulouse (UMR CNRS-UPS
5563 IRD 234), 14 Av. E. Belin, 31400 Toulouse, France. [email protected]
3 Lebanese Agriculture Research Institute (LARI), Fanar, Lebanon.
4 Faculty of Sciences, Lebanese University, P.O Box. 5, Campus Rafic Hariri-Beirut- Lebanon.
Keywords: P-Fertilizers, phosphate, sulfate, trace metal, XRD
Correspondence: V. Azzi, Platform for Research and Analysis in Environmental Sciences,
Doctoral School of Science and Technology, Faculty of Sciences, Lebanese University, P.O Box.
5, Campus Rafic Hariri-Beirut- Lebanon.
E-mail: [email protected]
Abstract
Phosphate fertilizers represent major sources of trace metal contaminants in agricultural soils. To
predict the inputs and the fate of trace metals in soils of the eastern Mediterranean region, a
speciation study was conducted using a total of 44 phosphate fertilizers commercialized in the
area. The contents in major anions and potentially toxic metals (Zn, Pb, Cd, and Cu) were
determined using Atomic Absorption Spectrometry (AAS) and X-Ray Fluorescence Spectrometry
(XRF). The nature of mineral phases in the fertilizer was characterized using X-ray diffraction and
Fourier Transform Infrared Spectrometry. The results show that sulfates are the main Cd-bearing
phases when present in the P-fertilizer. The contents in Zn and Pb were linearly related, whereas
the levels of Sb, Ag, Pd, Nb, Mo and P2O5 were strongly correlated to each other. The annual
average inputs of Zn, Cu, Pb and Cd were calculated to be 922, 124, 26 and 6 g/ha/year,
respectively. Even though such inputs comply with the maximal metals concentrations authorized
in temperate countries, an accumulation of those metals in the typical arid and alkaline soils of the
eastern Mediterranean countries is expected.
1 Introduction
Phosphate fertilizers are chemical compounds produced from the acid treatment of apatite minerals
(Ca5(PO4)3 [F, OH or Cl]) that naturally contains minor amounts of trace metals [1]. The level of
potentially toxic metals in the phosphate fertilizer depends both on the origin of the phosphate ore
and on the fertilizer production process [2-4]. Thus, sedimentary phosphate rocks (about 75 to 80%
of phosphate resources) contain 50 to 200 mg/kg of uranium and 2 to 20 mg/kg of thorium,
whereas phosphate ores of igneous or metamorphic origins (15-17% of P-resources) show a
maximum of 10 mg/kg in uranium but are rich in thorium and rare earth elements [3, 5]. The
remaining 2 to 3% of phosphate ores originate from biogenic sources such as bird and bat guano
deposits and mainly contain nitrogen and phosphorus [6, 7]. Radiological surveys of workers
handling fertilizers confirm their exposition to high levels of radioactive elements [2, 8].
More than 30 million tons of phosphate fertilizers are used annually in the world to increase crop
production and to ensure successful harvests [9-11]. This represents significant sources of
potentially toxic metals in agricultural soils [12, 13]. Thus, arsenic, cadmium, zinc, iron and lead
as trace metals, Uranium-238 (238
U), Thorium-232 (232
Th), Potassium-40 (40
K) and Radium-226
(226
Ra) [2, 12, 14-17] as radionuclides, have been shown to accumulate in cultivated soils
following phosphate fertilization [4, 18-21].
Much less investigated is the influence of fertilizer type on the fate of potentially toxic metals in
the soil. Thawornchaisit and Polprasert [22] showed that the nature of phosphate phase in triple
superphosphate, diammonium phosphate and phosphate rock, contributes to stabilize cadmium in
contaminated soils. Similarly, Zhang and Pu [23] evidenced a change in the availability of
cadmium, copper, lead and zinc, following applications of rock phosphate, calcium magnesium
phosphate, limestone and palygorskite. In the context of the remediation of contaminated soils,
many authors have also demonstrated that the stabilization of potentially toxic metals such as Pb,
Cu, or Zn, depends on the nature of phosphate rock used [24-26].
Toxic metals can be harmful to ecosystems and to humans due to their persistence in soil and
their potential to enter the human food chain after accumulation in vegetables and consumables
[13, 27]. Concentrations of Cd, Cr, Pb and Hg in fertilizers are regulated in most of the eastern
Mediterranean countries but the Maximal Admissible Concentrations (MAC) differ from one
country to another. Thus, cadmium and lead MAC in Lebanon are higher than those set in Finland
and Germany [28, 29]. Actually, in the Middle East, contrary to European countries, soils are
alkaline and submitted to arid and sub-arid climates, thus enhancing the potential for trace metals
accumulation. Therefore, Maximal Admissible Concentrations of potentially toxic metals and trace
elements in fertilizers used in eastern Mediterranean countries should be adapted to the local
context.
A predictive approach of the fate in soils of trace metals originating from phosphate fertilizers is
therefore of great interest. It should not only be based on the determination of the total metal
content in the soil, but also on the nature of the metal bearing phases since phosphate fertilizers are
made up of at least two major phases. In this paper, the aim is to incite emerging eastern
Mediterranean countries to set new limits of trace metals in phosphate fertilizers and better control
their use in alkaline soils. Thus, we investigate the various potentially toxic metals-bearing phases
present in phosphate fertilizers commercialized in the eastern Mediterranean region. Correlations
between trace elements, metals, phosphate and sulfate contents in the fertilizers provide a clearer
picture of metal contaminant fate in the treated soil.
2 Experimental
2.1 Fertilizer materials
A list of most commercialized phosphate fertilizers in the eastern Mediterranean region (Lebanon,
Egypt, Iraq, Syria, Kingdom of Saudi Arabia, Kurdistan and Turkey) was obtained from the
Lebanese Agricultural Research Institute. A total of 44 samples were then purchased (Table 1).
The P-fertilizer samples selected include two liquid P-fertilizers and 42 solid P-fertilizers. Based
on the data sheets provided with each sample material, the 44 P-fertilizers were partitioned into
Potassium Phosphate (2 samples), Urea Phosphate (2 samples), Superphosphate (2 samples), and
Nitrogen-Phosphorous and Potassium (NPK) (38 samples). The samples were crushed and
homogenized in an agate mortar, and then transferred into hermetically sealed polyethylene
containers to be preserved from humidity and moisture.
2.2 Gross characterization of fertilizer samples
Solutions (1g/L) of each P-fertilizer were prepared with distilled water. pH (Adwa AD 1000
pH/mV & Temp. meter) and conductivity (WTW Cond 330i) were then measured. The solutions
were filtered through a 0.45µm Nylon filter in order to analyze the major dissolved anions (PO43-
,
Cl-, SO4
2- and NO3
-) by ion chromatography (Shimadzu Shim-pack IC-A3). Concentrations of K
+
and Na+ were determined using a Biotech engineering Management Co. Ltd flame photometer
(AFP 100). The residue on the filter was dried at room temperature and analyzed by X-ray
diffraction.
2.3 Nature of heavy metal bearing phases
X-ray diffraction analyses were carried out using a D8 Bruker diffractometer. The collected
diffractograms were analyzed using the EVA software coupled to powder diffraction files provided

by the interactive center for diffraction data ICDD. The various chemical groups in P-fertilizers
were identified using Fourier Transform Infrared Spectrometry (FTIR, 6300 JASCO) in
transmission mode. Pellets were prepared by mixing a 1% (w/w) of the P-fertilizer with KBr. The
spectra were recorded in the 4000-400 cm-1
range at 4 cm-1
resolution.
2.4 Quantitative assessment of heavy metal contaminants
A pre-calibrated Thermo Scientific Niton XL2 X-Ray tube-based X-Ray fluorescence (XRF)
analyzer was used in the bulk mode to measure the levels of Sb, Pd, Ag, Mo, Nb, Zr, Bi, and Mn.
Cd, Zn, Pb, Fe, Cu and Ca were determined by atomic absorption spectrometry (AAS) using a
Rayleigh WXF-210 AA Spectrophotometer and WF-10A Autosampler. A 3 g amount of P-
fertilizer was dissolved in aqua regia formed by freshly mixing 21 mL of hydrochloric acid (HCl,
12 mol.L-1
) with 7 mL of nitric acid (HNO3, 14 mol.L-1
) (ISO 11466:1995). After 16 hours at room
temperature, the mixture was digested at 120°C for 2 hours. After cooling, 10 mL of diluted nitric
acid (HNO3, 0.5 mol.L-1
) were added, and the digested samples were filtered through a 0.45 μm
PTFE filter (Millipore). The filtrate was diluted to 50 mL with nitric acid 0.5 mol.L-1
and stored at
4ºC before analysis. The instrument was calibrated using manually prepared standard solutions of
each metal. Blanks for AAS analysis were prepared from HCl and HNO3 (3:1) solution by using
the same digestion protocol as with P-Fertilizer. Digestions were carried out per batch of 12, which
includes 3 replicates of each sample and 3 blanks.
2.5 Statistical analysis
All the data reported represent an average of three replicates with standard deviation. XL-STAT
software (Version 2009.3.02) was used to treat the data. The observations and correlations between
all parameters were tested using Principal Component Analysis (PCA), Pearson (n) type.
3 Results and discussion
3.1 Mineral phases and functional groups
Archerite or biphosphammite ((NH4,K)H2PO4) was the dominant crystallized phase in potassium
phosphate fertilizers, whereas urea phosphatic acid (CO(NH2)2(H3PO4)) was typical of the urea
phosphate group. Anhydrite (CaSO4), chlorapatite (Ca10(PO4)6Cl2), and minor amounts of
Cadmium Lead Phosphate Hydroxide ((CdPb9)(PO4)6(OH)2) were found in the superphosphate
group. In the case of NPK fertilizers, biphosphammite, syngenite (K2Ca(SO4)2.H2O), carnalite
(KClMgCl2.6H2O), fluorapatite (Ca10(PO4)6F2), niter mineral (KNO3) were distinguished with
traces of urea (CO(NH2)2) (Typical DRX diffractograms are shown in Supporting Information).
Glauconite ((K,Na) (Fe3+
,Al,Mg2) (Si,Al)4O10(OH)2) was identified in one sample of P-fertilizers.
Likewise, montmorillonite was recognized in three NPK fertilizers. Such clay minerals are usually
found disseminated in calcareous rocks, and may occur as impurities in the stockpiles of raw
materials.
If fluorapatite (Ca10(PO4)6F2) is a likely residue of the initial phosphate ore [4, 30], the other
mineral phases are classically formed during processing. Thus, the assemblage archerite,
biphosphammite, syngenite, halite, and calcite, has previously been reported in the literature in P-
fertilizers [31]. Syngenite in NPK fertilizers is often found inter-grown and enclosed within the
biphosphamite phase [32], which itself results from the loss of one ammonia from phosphammite
(NH4)2HPO4. Gypsum obtained as by-product during the preparation of phosphoric acid upon
addition of sulfuric acid to the phosphate rocks, is transformed to anhydrite and calcium hydrogen
phosphate hydrate (Ca(H2PO4)2.H2O) in the superphosphate under high temperature [33]. These
components were previously reported by Makweba and Holm [8] as the main phosphate
compounds present in superphosphate fertilizer. Calcium carbonate has also been reported to occur
in rock phosphate [34].
Infrared spectra reveal a predominant band around 1100 cm-1
in superphosphate but less intense
in urea phosphate, NPK and potassium phosphate, attributed to the P-O symmetric stretching
vibrations in the PO4 group [34-35] (See figure S2 in Supporting Information). The absorbance
bands at 680-610 cm-1
in superphosphate and NPK samples, and 840-810 cm-1
in urea phosphate,
NPK and potassium phosphate samples, confirm the presence of sulfate and nitrate groups (S-O
and N-O vibrations, respectively) [35, 36]. The N-H bond in ammonium ion is characterized by a
strong peak at 1390 cm-1
[36, 37]. The band at 1650-1590 cm-1
in urea phosphate, potassium
phosphate and NPK, is also attributed to the presence of N-H bond. The broad absorption band
around 3000-2850 cm-1
suggests the presence of C-H bond in potassium phosphate and urea
phosphate fertilizers [38]. Hydroxyl groups and adsorbed water are identified in the 3670-3200 cm-
1 region in all the samples [34, 39]. Such hydration is also observed in the NPK samples at the
wavelength number of 3169 cm-1
[34]. N-H, S-O and N-O bonds were identified in 85%, 77% and
70% of P-fertilizers, respectively.
In the FTIR transmission mode, the absorbance intensity is directly proportional to the
abundance of a given chemical bond. Hence, the intensity ratios of the typical bands characterizing
the P-fertilizers may provide valuable insights into the relative abundance of the chemical groups
considered. Fig. 1 presents the cumulative frequency for P-fertilizers as a function of the band
intensity ratios IP-O/IN-O, IP-O/IS-O and IP-O /IN-H. About 73% of the samples yielded IP-O/IN-H ratios
<1, which means that the P-O bond is then less abundant than the N-H bond. In 77% and 70% of
the samples, P-O bonds were more frequent than S-O and N-O bonds, respectively (IP-O/IN-O and IP-

O/IS-O greater than 1). This implies that phosphate is more abundant than nitrate and sulfate, and
that nitrogen is mainly present as ammonium and not as nitrate in P-fertilizers.
3.2 Geochemical characteristics of fertilizers
The main chemical characteristics and amounts of major components and of trace metals within
the P-fertilizers investigated are listed in Table 1. The pH of P-fertilizer solutions ranged from 2.2
to 8 whereas the conductivity was measured between 0.41 and 5.55 mS/cm. However, the pH
measured for a solution of a given fertilizer group displayed no significant variation. Urea
phosphate yields the lowest pH values (2.27±0.05) among the fertilizer solutions but not the
greatest conductivity (1.78±0.19 mS/cm). Potassium phosphate and urea phosphate lead to the
highest conductivity because of their solubility in water. Such solubility can be related to the origin
of the phosphate ore and to the type of fertilizer process. It is worth noting that the electrical
conductivity of P-fertilizer solutions varies within a wide range for each fertilizer group. This
suggests that the solubilization mechanism of fertilizers within a given group may drastically
change, which is of great interest to properly understand the migration of trace metals in soils
when released from fertilizers.
The level of P2O5 ranged from 2.82 to 53%, that of SO3 between 0 and 34%, Cl between 0 and
0.02%, K2O between 0 and 45% and Na between 0.15 and 3.8%. The highest concentrations in
P2O5 were found in superphosphate, potassium phosphate and urea phosphate, whereas the lowest
P-level was found in NPK.
Among toxic metals, cadmium has received a considerable attention and several studies focused
on Cd availability since it can be easily absorbed by plants. Cadmium concentrations ranged from
0.62 to 9.43 mg/kg with a mean value of 3.16 mg/kg, superphosphate showing the highest
concentration in cadmium, i.e. 9.43 mg Cd/kg (Table 1). Such values lie within the range reported

for Cd in phosphate rocks (0.1-60 mg/kg) [6, 40] and in phosphate fertilizers (0.1-170 mg/kg) [2,
27, 41]. If the Cd level is normalized to the P concentration in the fertilizer, the average Cd
concentration in our fertilizers is 76.53 mg/kg-P. The Cd concentrations in Potassium Phosphate
and Urea phosphate were below 22 mg Cd/kg-P, whereas Cd in superphosphate (58.71± 19.3 mg
Cd/kg-P) was much higher in comparison with literature data [42]. All samples exceeded the Cd
concentration limit set by the German Fertilizer Ordinance (21.2 mg Cd/kg-P) [10, 13] (Fig. 2).
According to the literature, Cd should be essentially associated with tricalcium phosphate [43]. In
the present study, however, a fairly good correlation was found between Cd and SO42-
in
superphosphate, NPK-fertilizers, urea phosphate and potassium phosphate. The substitution of Ca
with Cd results from a Cd2+
ionic radius (0.109 nm) similar to that of Ca2+
(0.114 nm), thus leading
to a Cd-P or Cd-S bond and the formation of Cd3(PO4)2 and/or CdSO4 within the fertilizers [44].
The relationship between Cd and sulfate is conditioned to the presence of high sulfate contents in
the NPK group of higher pH (Table 1). Such result is reminiscent of Cd speciation studies in the
roots of barley and lettuce [44], showing that most of cadmium ions were bound to ligands
containing SO4.
Lead was present in all fertilizer samples. The highest concentrations were measured in
potassium phosphate and NPK samples with 16±11 and 14±9 mg Pb/kg, respectively. All the
samples were below the limit of 150 mg Pb/kg (Fig. 3a) [13]. During the manufacturing process of
P-fertilizer from phosphate rocks, the precipitation of phosphogypsum after sulfuric acid addition
may capture Pb as insoluble lead sulfate (anglesite PbSO4) [40]. Indeed, lead sulfate is barely
soluble whereas lead phosphate solubility in water is found to increase with a decrease in pH to 4
[45]. Hence, during the manufacturing of phosphate fertilizer, if sulfate is present, it will compete
with phosphate to precipitate lead. In contaminated soils, previous studies have shown that Pb can
be stabilized by the addition of hydroxyapatite to form pyromorphite-like minerals (Pb10(PO4)6 X2)
where X can be replaced with OH, Cl or F. Hydroxyapatite may also fix Cd and Zn to lead to the
formation of cadmium lead phosphate hydroxide (CdPb9(PO4)6(OH)2), or fluorapatite [25, 26].
Such mineral phases in the fertilizers are geochemically stable with reduced solubility allowing
lead to accumulate in soil without being significantly absorbed by plants [24, 25, 40].
Essential trace elements for plants such as Zn, Cu, Fe, Mo, Mn and B are added to data sheets of
the fertilizers as TE (Trace elements). Actually, most of the samples collected were not labelled as
containing Zn, Cu, Fe and Ca (Table 1).
The zinc concentrations in the P-fertilizers ranged from 29 mg/kg to 5735 mg/kg with a mean
value of 496 mg/kg. Expressed on P-basis, the overall mean in P-fertilizers was 8574 mg Zn/kg-P.
Zinc showed elevated values in NPK-fertilizers with a mean value of 541 mg/kg. The average zinc
levels in urea phosphate, superphosphate and potassium phosphate were 141±1, 239±207 and
250±63 mg Zn/kg, respectively. Such range is consistent with previous reports for phosphate rock
(17.7-299.3 mg Zn/kg) [40] and for phosphate fertilizers (50-1500 mg Zn/kg) (Fig. 3b) [11]. Only
2 NPK-fertilizers had Zn concentrations above the limit value of 5000 mg/kg [13]. Since both zinc
and cadmium belong to the same group in the periodic system of elements and have a similar
nuclear structure and ionic radius, they may compete in the soil for similar binding sites [11, 46].
On the other hand, some authors have demonstrated an antagonistic interaction for Cd and Zn
uptake and translocation in plants, an increase in Zn uptake mitigating Cd accumulation in crops
[47].
Copper, like Zn, showed elevated values in NPK-fertilizers and potassium phosphate samples
with a mean value of 74.86±118 and 30.63±40.3 mg Cu/kg respectively. The average value for Cu,
i.e. 66.6±111 mg Cu/kg, is lower than the worldwide range for rock phosphate (5.5-130 mg/kg);
only 4 NPK-fertilizer samples gave a higher concentration. 90% of the samples had a
concentration below 100 mg Cu/kg (Fig. 3c), the value set by AFNOR (Association Française de
Normalisation) for fertilizers, but only 8% were above the minimum concentration for Cu in
Germany (200 mg/kg) and all the samples remained below the limit of 900 mg/kg set for
agricultural fertilizers in the same country [13].
Iron and calcium were present in abundance in NPK-fertilizers and superphosphate where they
reached 1.7 and 1.4 g Fe/kg and 9.2 and 149.3 g Ca/kg respectively for the two kinds of phosphate
fertilizers mentioned above. 65% of the tested products displayed Fe concentrations above 500 mg
Fe/kg and all the samples except one NPK-fertilizer had the Fe concentrations below the minimum
of 10 g Fe/kg defined by the German Fertilizer Ordinance for agricultural products [13].
The standard deviations exceeded the mean average of Cu in NPK-fertilizers and potassium
phosphate samples. The high standard deviations found for all the investigated elements even
within a single group of fertilizers result on the one hand from the various origins of phosphate
rocks, and on the other hand, from the type of processes used in P-fertilizers manufacturing [13].
The residue on the filter during the preparation of the 1 g/L solution of fertilizer was examined by
XRD. The non-dissolved particles correspond mainly to apatite and quartz in the superphosphate
samples. The geological origin of phosphate rocks explains the presence of apatite, quartz,
montmorillonite, dolomite, fluorapatite, etc. [48].
The concentrations of phosphate, sulfate, cadmium, lead and the relative abundance of copper
and zinc in fertilizer samples are given in Fig. 4. The cadmium distribution in P-fertilizers clearly
reaches the highest levels (around 9 mg/kg) when the proportion of sulfate increases in the
fertilizers. In the absence of sulfate, cadmium remains fluctuant between 1.5 and 2 mg/kg (Fig.
4a), which is not the case for lead (Fig. 4b). This suggests that cadmium is mainly associated with

sulfate and in less important amounts with phosphate when sulfate is absent or negligible.
However, no direct proportional relationship between cadmium and sulfate can be inferred which
actually reflects the various geochemical backgrounds of the fertilizers. The content in lead is
between 10 and 15 mg/kg in fertilizers without revealing a specific affinity for either sulfate or
phosphate. The behaviors of copper and zinc are similar to that of lead. The relative abundances of
copper and zinc do not show a clear relation with one or another component of the fertilizers, even
though the highest relative amounts of copper and zinc were observed in fertilizers of high sulfate
contents and the lowest amounts in fertilizers with less or negligible sulfate contents (Fig. 4c).
The results of the Principal Component Analysis (PCA) showed that the eigenvalues of the first
three components explain 60.5% of the total variance correlation (Fig. 5). Cadmium was positively
correlated to sulfate (0.516) and calcium (0.705), which is in agreement with what was previously
described in Fig. 4. Hence, cadmium is essentially entrapped in the calcium sulfate phases of the
fertilizers (Fig. 5). Another positive correlation was found between Zn and Pb with R=0.590 (Fig.
5, Table 2). Sb, Ag, Pd, Nb, Mo were strongly correlated to each other (R between 0.86 and 0.44)
and to a lesser extent with P2O5 (R between 0.48 and 0.24) (Table 2). Such result is consistent with
Boyle and Jonasson investigation [49] on the geochemistry of antimony (Sb), which revealed that
Sb can be considered as an indicator of phosphorous and is geochemically associated to Ag, P, Bi,
Nb and Mo.
3.3 Input of trace metals in agricultural soils
Whatever the guidelines used for describing and characterizing soils, the levels of metals in soils
will either fall within the guideline ranges or outside. The metal contents in soils of eastern and
southern Mediterranean countries are drastically different (Table 3). For example, in Lebanese
soils, the cadmium level is higher than that found in Canadian guidelines unlike the levels of

copper and lead. Therefore, such data must be discussed separately taking into account the external
inputs of metals to the soil, and especially fertilizers inputs that represent the most important
source of metals.
The average applications of phosphate fertilizer are 34 kg/ha/year in Asia, 133 kg/ha/year in India,
600 kg/ha/year in Saudi Arabia, which is actually much lower than the 1860 kg/ha/year applied in
Lebanon [47, 50, 51]. Knowing the amounts of trace metals in fertilizers and the average
amendment per year of P-Fertilizer, the input of trace metals from P-fertilizers into agricultural
soils may be estimated.
The P-Fertilizer annual amendment in the eastern Mediterranean countries usually ranges
between 20 and 60 kg-P/hectare. Such values fluctuate according to agricultural practice, soil pH
and soil humidity. The common practice applies high levels of P-amendment since soil pH is
alkaline under moderate to dry climate. In Table 4, the estimated range of inputs in Cd, Pb, Zn and
Cu are given on P-basis per year. According to the fertilizer used, the supply in cadmium may
reach 31 g/ha/year when 60 kg of P are applied. Lead input varies between 0.95 to 100 g/ha/year,
zinc between 6.6 to 5257 g/ha/year and copper between 0.18 to 26130 g/ha/year.
Based on those values, the average input of metals to agricultural soils of eastern Mediterranean
countries from phosphate fertilizers may be estimated to 6 g Cd/ha/year, 26 g Pb/ha/year, 922 g
Zn/ha/year and 124 g Cu/ha/year. Such levels are higher than the average values reported for the
European countries (e.g. 1.6 g Cd/ha, 1 g Pb/ha and 43.1 g Zn/ha). However, such metal inputs are
much lower than the maximum limits set in Brazil and in the United Kingdom [52]. Nevertheless,
such estimates and comparisons remain approximations since the metal accumulation in
agricultural soil depends not only on the total addition of metal but also on soil pH, humidity and
soil compounds. Therefore, in arid regions where soil pH is mostly alkaline, the metal inputs
estimated seem to be relatively high even if they remain comparable and lower than the limits
established for some countries.
4 Conclusions
According to the origin of the phosphate rock and to the fertilizer manufacturing process, the trace
metal concentrations may significantly vary within a given type of fertilizer. Cadmium showed the
highest concentration in superphosphate, whereas lead, copper and zinc were more abundant in
potassium phosphate and NPK-fertilizers. Phosphate minerals were found to be the major trace
metal bearing phases for cadmium, molybdenum, antimony, niobium and palladium. Another
strong correlation was found between calcium, cadmium and sulfate.
The application of fertilizers is by far the most significant source of trace elements in cropland
soils. However, during P-Fertilizer production, metals will precipitate in the less soluble phases,
which may mitigate the impact of metal inputs. In Eastern Mediterranean countries, the presence
of alkaline soils combined with the arid to semi-arid climate, facilitates the accumulation of trace
metals. Therefore, careful attention must be paid when setting the limits for trace metal inputs in
soils, which should be based not only on the amount of metals in P-fertilizers but also on the
accumulation potential of metals in soils.
Acknowledgements
We gratefully acknowledge the financial supports provided by the Lebanese National Council for
Scientific Research, the Lebanese University and the Lebanese Agriculture Research Institute.
The authors have declared no conflict of interest.
References
[1] A.S. Knox, D.I. Kaplan, M.H. Paller, Phosphate sources and their suitability for remediation
of contaminated soils, Sci. Total Environ. 2006, 357, 271–279.
[2] L. Giuffré, S. Ratto, L. Marbán, Heavy metals input with phosphate fertilizers used in
Argentina, Sci. Total Environ. 1997, 204, 245–250.
[3] M. Rentería-Villalobos, I. Vioque, J. Mantero, G. Manjón, Radiological, chemical and
morphological characterizations of phosphate rock and phosphogypsum from phosphoric
acid factories in SW Spain, J. Hazard. Mater. 2010, 181, 193–203.
[4] C. Roselli, D. Desideri, M.A. Meli, Radiological characterization of phosphate fertilizers:
Comparison between alpha and gamma spectrometry, Microchem. J. 2009, 91, 181–186.
[5] P.M. Rutherford, M.J. Dudas, R.A. Samek, Environmental impacts of phosphogypsum, Sci.
Total Environ. 1994, 149, 1–38.
[6] I. Aydin, F. Aydin, A. Saydut, E.G. Bakirdere, C. Hamamci, Hazardous metal geochemistry
of sedimentary phosphate rock used for fertilizer (Mazıdag, SE Anatolia, Turkey),
Microchem. J. 2010, 96, 247–251.
[7] R. Shahack-Gross, F. Berna, P. Karkanas, S. Weiner, Bat guano and preservation of
archaeological remains in cave sites, J. Archaeol. Sci. 2004, 31, 1259–1272.
[8] MM. Makweba, E. Holm, The natural radioactivity of the rock phosphates, phosphatic
products and their environmental implications, Sci. Total Environ. 1993, 133, 99–110.
[9] W. Tang, B. Shan, H. Zhang, Phosphorus buildup and release risk associated with
agricultural intensification in the estuarine sediments of Chaohu Lake Valley, Eastern
China, Clean- Soil, Air, Water, 2010, 38 (4), 336–343.
[10] W. Jiao, W. Chen, A.C. Chang, A.L. Page, Environmental risks of trace elements associated
with long-term phosphate fertilizers applications: a review, Environ. Pollut. 2012, 168, 44–
53.
[11] R. Lambert, C. Grant, S. Sauvé, Cadmium and zinc in soil solution extracts following the
application of phosphate fertilizers, Sci. Total Environ. 2007, 378, 293–305.
[12] G. Nziguheba, E. Smolders, Inputs of trace elements in agricultural soils via phosphate
fertilizers in European countries, Sci. Total Environ. 2008, 390, 53–57.
[13] S. Kratz, J. Schick, E. Schnug, Trace elements in rock phosphates and P containing mineral
and organo-mineral fertilizers sold in Germany, Sci. Total Environ. 2016, 542, 1013–1019.
doi:10.1016/j.scitotenv.2015.08.046.
[14] A.S. Abdel-Haleem, A. Sroor, S.M. El-Bahi, E. Zohny, Heavy metals and rare earth
elements in phosphate fertilizer components using instrumental neutron activation analysis,
Appl. Radiat. Isot. 2001, 55, 569–573.
[15] A.L. Pérez, K.A. Anderson, DGT estimates cadmium accumulation in wheat and potato
from phosphate fertilizer applications, Sci. Total Environ. 2009, 407, 5096–5103.
[16] E. Schnug, B.G. Lottermoser, Fertilizer-derived Uranium and its threat to human health,
Environ. Sci. Technol. 2013, 47, 2433–2434.
[17] N. Yamaguchi, A. Kawasaki, I. Iiyama, Distribution of uranium in soil components of
agricultural fields after long-term application of phosphate fertilizers, Sci. Total Environ.
2009, 407, 1383–1390.
[18] E. Belon, M. Boisson, I.Z. Deportes, T.K. Eglin, I. Feix, A.O. Bispo, I. Galsomies, S.
Leblond, C.R. Guellier, An inventory of trace elements inputs to French agricultural soils,
Sci. Total Environ. 2012, 439, 87–95.
[19] X. Wang, T. Sato, B. Xing, S. Tao, Health risks of heavy metals to the general public in
Tianjin, China via consumption of vegetables and fish, Sci. Total Environ. 2005, 350, 28–
37.
[20] D. Lin, Y. Ouyang, C.H. Huang, D.Y. Huang, Characterization of heavy metals from
banana farming soils, CLEAN - Soil, Air, Water 2010, 38 (5-6), 430–436.
[21] A. Takeda, H. Tsukada, Y. Takaku, S. Hisamatsu, M. Nanzyo, Accumulation of uranium
derived from long-term fertilizer applications in a cultivated Andisol, Sci. Total Environ.
2006, 367, 924–931.
[22] U. Thawornchaisit, C. Polprasert, Evaluation of phosphate fertilizers for the stabilization of
cadmium in highly contaminated soils, J. Hazard. Mater. 2009, 165, 1109–1113.
[23] M. Zhang, J. Pu, Mineral materials as feasible amendments to stabilize heavy metals in
polluted urban soils, J. Environ. Sci. 2011, 23 (4), 607–615.
[24] X. Cao, L.Q. Ma, D.R. Rhue, C.S. Appel, Mechanisms of lead, copper, and zinc retention by
phosphate rock, Environ. Pollut. 2004, 131, 435–444.
[25] R.X. Cao, L.Q. Ma, M. Chen, S.P. Singh, W.G. Harris, Phosphate-induced metal
immobilization in a contaminated site, Environ. Pollut. 2003, 122, 19–28.
[26] X. Cao, A. Wahbi, L. Ma, B. Li, Y. Yang, Immobilization of Zn, Cu, and Pb in
contaminated soils using phosphate rock and phosphoric acid, J. Hazard. Mater. 2009, 164,
555–564.
[27] A.A. Abdelhafez, H.H. Abbas, R.S. Abd-El-Aal, N.F. Kandil, J. Li, W. Mahmoud,
Environmental and health impacts of successive mineral fertilization in Egypt, Clean- Soil,
Air, Water 2012, 40 (4), 356–363.
[28] O. Dahl, R. Pöykiö, H. Nurmesniemi, Concentrations of heavy metals in fly ash from a coal-
fired power plant with respect to the Finnish limit value, J. Mater. Cycles Waste Manag.
2008, 10, 87–92.
[29] H. Weigand, M. Bertau, W. Hübner, F. Bohndick, A. Bruckert, RecoPhos : Full-scale
fertilizer production from sewage sludge ash, Waste Manag. 2013, 33, 540–544.
[30] B. Hajem, K. Djebali, A. M’nif, Modeling and optimization of fluoride and cadmium
trapping in phosphogypsum using design methodology, CLEAN - Soil, Air, Water 2010, 38
(9), 859–864.
[31] P.J. Bridge, Archerite, (K ,NH4)H2P04, a new mineral from Madura, Western Australia,
Mineral. Mag. 1977, 41, 33–35.
[32] M.W. Pryce, Biphosphammite: a second occurrence, Mineral. Mag. 1972, 38, 965–967.
[33] M. Singh, M. Garg, Making of anhydrite cement from waste gypsum, Cem. Concr. Res.
2000, 30, 571–577.
[34] G. Jiang, Y. Liu, L. Huang, Q. Fu, Y. Deng, H. Hu, Mechanism of lead immobilization by
oxalic acid-activated phosphate rocks, J. Environ. Sci. 2012, 24 (5), 919–925.
[35] M-H. Bernier, G.J. Levy, P. Fine, M. Borisover, Organic matter composition in soils
irrigated with treated wastewater : FT-IR spectroscopic analysis of bulk soil samples,
Geoderma 2013, 209–210, 233–240.
[36] F.A. Miller, C.H. Wilkins, Infrared Spectra and Characteristic Frequencies of Inorganic
Ions., Anal. Chem. 1952, 24(8), 1253–1294.
[37] R.A. Nyquist, R.O. Kagel, Infrared Spectra of Inorganic Compounds (3800-45 cm-1), 1971,
4, 1–34.
[38] M. Chiban, A. Soudani, F. Sinan, S. Tahrouch, M. Persin, Characterization and application
of dried plants to remove heavy metals, nitrate, and phosphate ions from industrial
wastewaters, CLEAN - Soil, Air, Water 2011, 39 (4), 376–383.
[39] S. Yalcin, The mechanism of heavy metal biosorption on green marine macroalga
Enteromorpha linza, Clean- Soil, Air, Water 2014, 42 (3), 251–259.
[40] Sabiha-Javied, T. Mehmood, M.M. Chaudhry, M. Tufail, N. Irfan, Heavy metal pollution
from phosphate rock used for the production of fertilizer in Pakistan, Microchem. J. 2009,
91, 94–99.
[41] E. Gimeno-Garcia, V. Andreu, R. Boluda, Heavy metals incidence in the application of
inorganic fertilizers and pesticides to rice farming soils, Environ. Pollut. 1996, 92 (1), 19–
25.
[42] D. Uprety, M. Hejcman, J. Szakova, E. Kunzova, P. Tlustos, Concentration of trace
elements in arable soil after long-term application of organic and inorganic fertilizers, Nutr.
Cycl. Agroecosystems 2009, 85, 241–252.
[43] B.R. Singh, K. Myhr, Cadmium uptake by barley as affected by Cd sources and pH levels.,
Geoderma 1998, 84, 185–194.
[44] M.F. Akhter, C.R. Omelon, R.A. Gordon, D. Moser, S.M. Macfie, Localization and
chemical speciation of cadmium in the roots of barley and lettuce, Environ. Exp. Bot. 2014,
100, 10–19.
[45] S. Sauvé, M. McBride, W. Hendershot, Lead Phosphate Solubility in Water and Soil
Suspensions, Environ. Sci. Technol. 1998, 32 (3), 388–393.
[46] N. Köleli, S. Eker, I. Cakmak, Effect of zinc fertilization on cadmium toxicity in durum and
bread wheat grown in zinc-deficient soil, Environ. Pollut. 2004, 131, 453–459.

[47] D.K. Gupta, S. Chatterjee, S. Datta, V. Veer, C. Walther, Role of phosphate fertilizers in
heavy metal uptake and detoxification of toxic metals, Chemosphere 2014, 108, 134–144.
[48] P.M. Rutherford, M.J. Dudas, R.A. Samek, Environmental impacts of phosphogypsum, Sci.
Total Environ. 1994, 149, 1-38.
[49] R.W. Boyle, I.R. Jonasson, The geochemistry of antimony and its use as an indicatore
element in geochemical prospecting, J. Geochemical Explor. 1984, 20, 223–302.
[50] FAO, “Fertilizer use by crop,” in FAO Fertilizer and Plant Nutrition Bulletin, Rome, Italy,
2006.
[51] N. Farajalla, M. Marktanner, L. Dagher, P. Zgheib, The National Economic, Environment
and Development Studies (NEEDS) for Climate Change Project -Final Report, Issam Fares
Institute for Public Policy and International Affairs - American University of Beirut, Beirut.
2010.
[52] F.T. Conceição, D.M. Bonotto, Radionuclides, heavy metals and fluorine incidence at
Tapira phosphate rocks, Brazil, and their industrial (by) products, Environ. Pollut. 2006,
139, 232–243.
[53] J. Aslam, S.A. Khan, S.H. Khan, Heavy metals contamination in roadside soil near different
traffic signals in Dubai, Unites Arab Emirates, J. Saudi Chem. Soc. 2013, 17, 315–319.
[54] H.J. Kanbar, N. Hanna, A.G. El-Samrani, A. Kobaissi, N. Harb, N. Amacha, Metal binding
in soil cores and sediments in the vicinity of a dammed agricultural and industrial
watershed, Environ. Monit. Assess. 2014, 186 (12), 8793–8806.
[55] Y. Al Naggar, E. Naiem, M. Mona, J. Giesy, A. Seif, Metals in agricultural soils and plants
in Egypt, Toxicol. Environ. Chem. 2014, 96 (5), 730–742.

[56] R.H. Habib, S.M. Awadh, M. Muslim, Toxic heavy metals in soil and some plants in
Beghdad, Iraq, J. Al-Nahrain University 2012, 15 (2), 1–16.
[57] A. Esmaeili, F. Moore, B. Keshavarzi, N. Jaafarzadeh, M. Kermani, M, A geochemical
survey of heavy metals in agricultural and background soils of the Isfahan industrial zone,
Iran, Catena 2014, 121, 88–98.
[58] A. Möller, H.W. Müller, A. Abdullah, G. Abdelgawad, J. Utermann, Urban soil pollution in
Damascus, Syria: concentrations and patterns of heavy metals in the soils of the Damascus
Ghouta, Geoderma 2005, 124, 63–71.
[59] G. Daldoul, R. Souissi, F. Souissi, N. Jemmali, H.K. Chakroun, Assessment and mobility of
heavy metals in carbonated soils contaminated by old mine tailings in North Tunisia, J. Afr.
Earth Sci. 2015, 110, 150–159.
[60] Z. Fatna, C. Zakaria, M. Fatimaezzahra, M. Kawtar, N. Saber, Assessment of environmental
quality in soil under wheat and vines in Bouznika-Benslimane region of Morocco. Eur. Sci.
J. 2014, 20 (24), 23–33.
[61] S. Maas, R. Scheifler, M. Benslama, N. Crini, E. Lucot, Z. Brahmia, S. Benyacoub, P.
Giraudoux, Spatial distribution of heavy metal concentrations in urban, suburban and
agricultural soils in a Mediterranean city of Algeria, Environ. Pollut. 2010, 158, 2294–2301.
Supporting Information
Figure S1 Typical diffractograms of Potassium Phosphate (K.P; sample 38), Urea-Phosphate (U.P;
sample 43), Superphosphate (S.P; sample 13) and NPK (sample 4). The black arrows correspond
to the 2-theta value of 23.952 on the K.P, 9.971 on the U.P, 18.211, 23.057 and 31.495 on the S.P
and 16.681 and 22.32 on the N.P.K.
Figure S2 Typical infrared spectra of Superphosphate (S.P; sample 13), Urea-phosphate (U.P;
sample 40), NPK fertilizers (sample 7) and Potassium Phosphate (K.P; sample 38)
Figure captions
Figure 1. Frequency distribution of the Intensity ratio of the typical functional groups (IP-O/IS-O, IP-
O/IN-H and IP-O/IN-O)
Figure 2. Frequency distribution of cadmium in P- fertilizer samples (mg Cd/kg-P)
Figure 3. Frequency distribution in P- fertilizer samples of a) Lead, b) Zinc and c) Copper in
(mg/kg)
Figure 4. a) P, S, and Cd, b) P, S and Pb, c) P, S, Zn (%) and Cu (%) in fertilizer samples
Figure 5. Pearson correlation of all compounds in NPK fertilizer
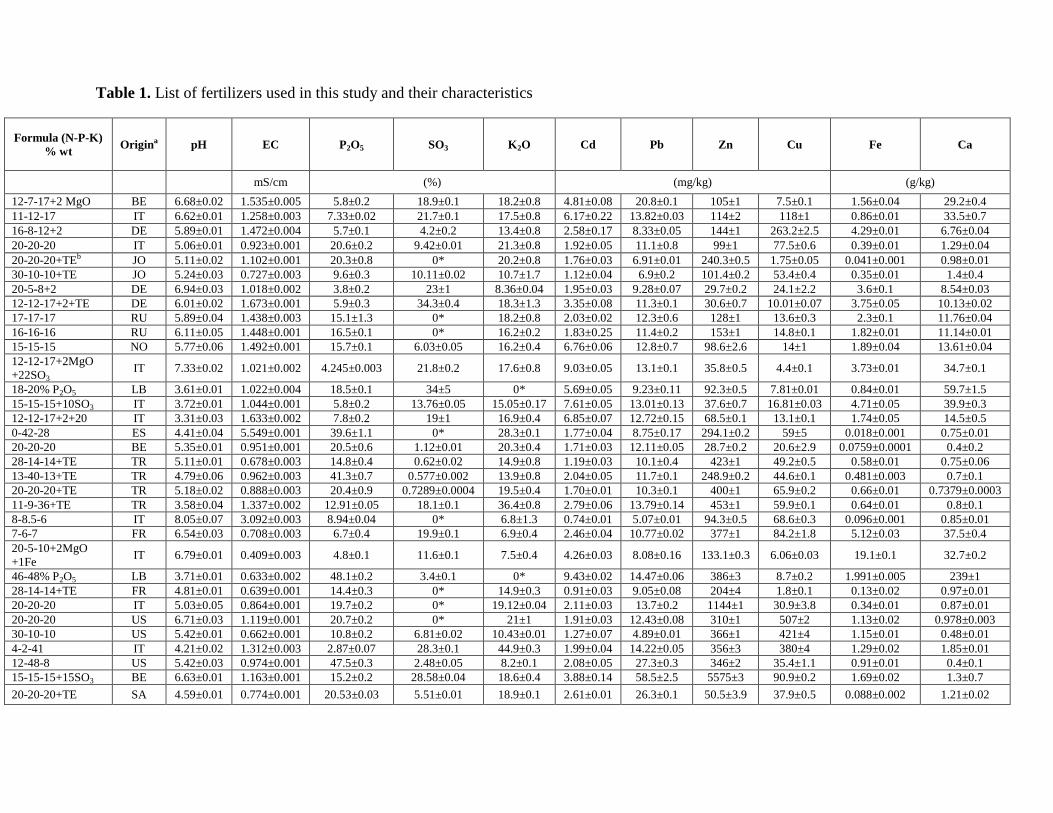
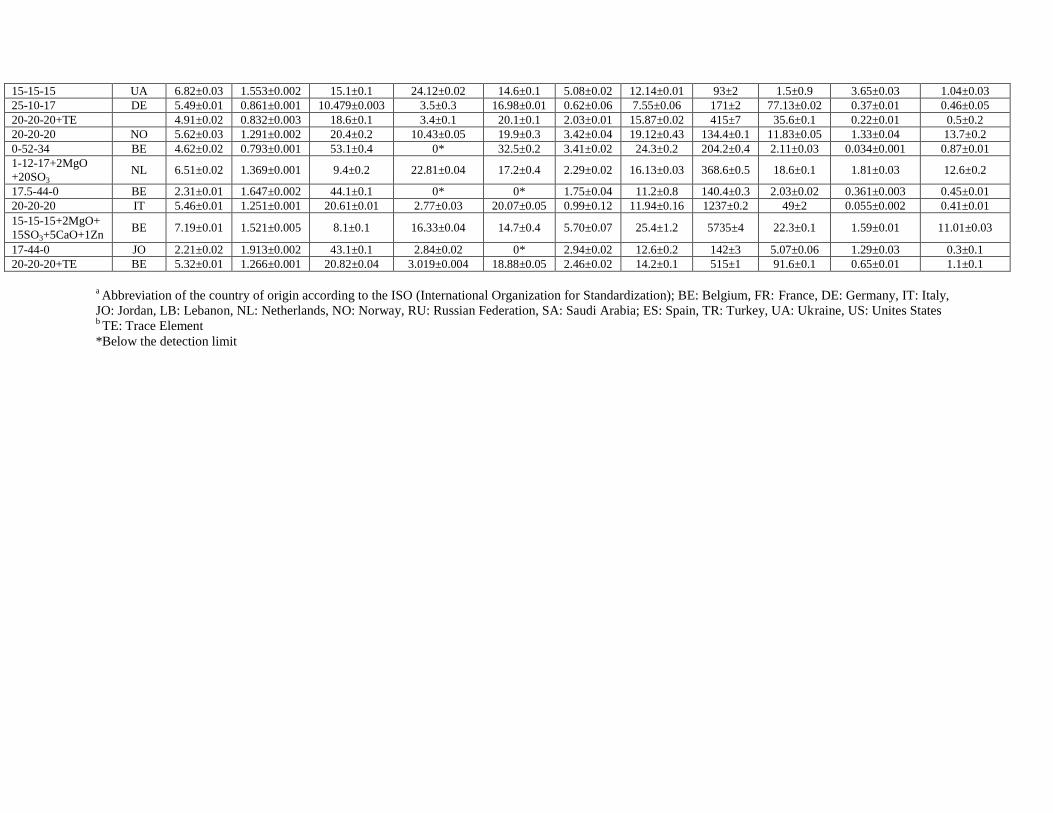
Table 1. List of fertilizers used in this study and their characteristics
Formula (N-P-K)
% wt Origina pH EC P2O5 SO3 K2O Cd Pb Zn Cu Fe Ca
mS/cm (%) (mg/kg) (g/kg)
12-7-17+2 MgO BE 6.68±0.02 1.535±0.005 5.8±0.2 18.9±0.1 18.2±0.8 4.81±0.08 20.8±0.1 105±1 7.5±0.1 1.56±0.04 29.2±0.4
11-12-17 IT 6.62±0.01 1.258±0.003 7.33±0.02 21.7±0.1 17.5±0.8 6.17±0.22 13.82±0.03 114±2 118±1 0.86±0.01 33.5±0.7
16-8-12+2 DE 5.89±0.01 1.472±0.004 5.7±0.1 4.2±0.2 13.4±0.8 2.58±0.17 8.33±0.05 144±1 263.2±2.5 4.29±0.01 6.76±0.04
20-20-20 IT 5.06±0.01 0.923±0.001 20.6±0.2 9.42±0.01 21.3±0.8 1.92±0.05 11.1±0.8 99±1 77.5±0.6 0.39±0.01 1.29±0.04
20-20-20+TEb JO 5.11±0.02 1.102±0.001 20.3±0.8 0* 20.2±0.8 1.76±0.03 6.91±0.01 240.3±0.5 1.75±0.05 0.041±0.001 0.98±0.01
30-10-10+TE JO 5.24±0.03 0.727±0.003 9.6±0.3 10.11±0.02 10.7±1.7 1.12±0.04 6.9±0.2 101.4±0.2 53.4±0.4 0.35±0.01 1.4±0.4
20-5-8+2 DE 6.94±0.03 1.018±0.002 3.8±0.2 23±1 8.36±0.04 1.95±0.03 9.28±0.07 29.7±0.2 24.1±2.2 3.6±0.1 8.54±0.03
12-12-17+2+TE DE 6.01±0.02 1.673±0.001 5.9±0.3 34.3±0.4 18.3±1.3 3.35±0.08 11.3±0.1 30.6±0.7 10.01±0.07 3.75±0.05 10.13±0.02
17-17-17 RU 5.89±0.04 1.438±0.003 15.1±1.3 0* 18.2±0.8 2.03±0.02 12.3±0.6 128±1 13.6±0.3 2.3±0.1 11.76±0.04
16-16-16 RU 6.11±0.05 1.448±0.001 16.5±0.1 0* 16.2±0.2 1.83±0.25 11.4±0.2 153±1 14.8±0.1 1.82±0.01 11.14±0.01
15-15-15 NO 5.77±0.06 1.492±0.001 15.7±0.1 6.03±0.05 16.2±0.4 6.76±0.06 12.8±0.7 98.6±2.6 14±1 1.89±0.04 13.61±0.04
12-12-17+2MgO
+22SO3 IT 7.33±0.02 1.021±0.002 4.245±0.003 21.8±0.2 17.6±0.8 9.03±0.05 13.1±0.1 35.8±0.5 4.4±0.1 3.73±0.01 34.7±0.1
18-20% P2O5 LB 3.61±0.01 1.022±0.004 18.5±0.1 34±5 0* 5.69±0.05 9.23±0.11 92.3±0.5 7.81±0.01 0.84±0.01 59.7±1.5
15-15-15+10SO3 IT 3.72±0.01 1.044±0.001 5.8±0.2 13.76±0.05 15.05±0.17 7.61±0.05 13.01±0.13 37.6±0.7 16.81±0.03 4.71±0.05 39.9±0.3
12-12-17+2+20 IT 3.31±0.03 1.633±0.002 7.8±0.2 19±1 16.9±0.4 6.85±0.07 12.72±0.15 68.5±0.1 13.1±0.1 1.74±0.05 14.5±0.5
0-42-28 ES 4.41±0.04 5.549±0.001 39.6±1.1 0* 28.3±0.1 1.77±0.04 8.75±0.17 294.1±0.2 59±5 0.018±0.001 0.75±0.01
20-20-20 BE 5.35±0.01 0.951±0.001 20.5±0.6 1.12±0.01 20.3±0.4 1.71±0.03 12.11±0.05 28.7±0.2 20.6±2.9 0.0759±0.0001 0.4±0.2
28-14-14+TE TR 5.11±0.01 0.678±0.003 14.8±0.4 0.62±0.02 14.9±0.8 1.19±0.03 10.1±0.4 423±1 49.2±0.5 0.58±0.01 0.75±0.06
13-40-13+TE TR 4.79±0.06 0.962±0.003 41.3±0.7 0.577±0.002 13.9±0.8 2.04±0.05 11.7±0.1 248.9±0.2 44.6±0.1 0.481±0.003 0.7±0.1
20-20-20+TE TR 5.18±0.02 0.888±0.003 20.4±0.9 0.7289±0.0004 19.5±0.4 1.70±0.01 10.3±0.1 400±1 65.9±0.2 0.66±0.01 0.7379±0.0003
11-9-36+TE TR 3.58±0.04 1.337±0.002 12.91±0.05 18.1±0.1 36.4±0.8 2.79±0.06 13.79±0.14 453±1 59.9±0.1 0.64±0.01 0.8±0.1
8-8.5-6 IT 8.05±0.07 3.092±0.003 8.94±0.04 0* 6.8±1.3 0.74±0.01 5.07±0.01 94.3±0.5 68.6±0.3 0.096±0.001 0.85±0.01
7-6-7 FR 6.54±0.03 0.708±0.003 6.7±0.4 19.9±0.1 6.9±0.4 2.46±0.04 10.77±0.02 377±1 84.2±1.8 5.12±0.03 37.5±0.4
20-5-10+2MgO
+1Fe IT 6.79±0.01 0.409±0.003 4.8±0.1 11.6±0.1 7.5±0.4 4.26±0.03 8.08±0.16 133.1±0.3 6.06±0.03 19.1±0.1 32.7±0.2
46-48% P2O5 LB 3.71±0.01 0.633±0.002 48.1±0.2 3.4±0.1 0* 9.43±0.02 14.47±0.06 386±3 8.7±0.2 1.991±0.005 239±1
28-14-14+TE FR 4.81±0.01 0.639±0.001 14.4±0.3 0* 14.9±0.3 0.91±0.03 9.05±0.08 204±4 1.8±0.1 0.13±0.02 0.97±0.01
20-20-20 IT 5.03±0.05 0.864±0.001 19.7±0.2 0* 19.12±0.04 2.11±0.03 13.7±0.2 1144±1 30.9±3.8 0.34±0.01 0.87±0.01
20-20-20 US 6.71±0.03 1.119±0.001 20.7±0.2 0* 21±1 1.91±0.03 12.43±0.08 310±1 507±2 1.13±0.02 0.978±0.003
30-10-10 US 5.42±0.01 0.662±0.001 10.8±0.2 6.81±0.02 10.43±0.01 1.27±0.07 4.89±0.01 366±1 421±4 1.15±0.01 0.48±0.01
4-2-41 IT 4.21±0.02 1.312±0.003 2.87±0.07 28.3±0.1 44.9±0.3 1.99±0.04 14.22±0.05 356±3 380±4 1.29±0.02 1.85±0.01
12-48-8 US 5.42±0.03 0.974±0.001 47.5±0.3 2.48±0.05 8.2±0.1 2.08±0.05 27.3±0.3 346±2 35.4±1.1 0.91±0.01 0.4±0.1
15-15-15+15SO3 BE 6.63±0.01 1.163±0.001 15.2±0.2 28.58±0.04 18.6±0.4 3.88±0.14 58.5±2.5 5575±3 90.9±0.2 1.69±0.02 1.3±0.7
20-20-20+TE SA 4.59±0.01 0.774±0.001 20.53±0.03 5.51±0.01 18.9±0.1 2.61±0.01 26.3±0.1 50.5±3.9 37.9±0.5 0.088±0.002 1.21±0.02
15-15-15 UA 6.82±0.03 1.553±0.002 15.1±0.1 24.12±0.02 14.6±0.1 5.08±0.02 12.14±0.01 93±2 1.5±0.9 3.65±0.03 1.04±0.03
25-10-17 DE 5.49±0.01 0.861±0.001 10.479±0.003 3.5±0.3 16.98±0.01 0.62±0.06 7.55±0.06 171±2 77.13±0.02 0.37±0.01 0.46±0.05
20-20-20+TE 4.91±0.02 0.832±0.003 18.6±0.1 3.4±0.1 20.1±0.1 2.03±0.01 15.87±0.02 415±7 35.6±0.1 0.22±0.01 0.5±0.2
20-20-20 NO 5.62±0.03 1.291±0.002 20.4±0.2 10.43±0.05 19.9±0.3 3.42±0.04 19.12±0.43 134.4±0.1 11.83±0.05 1.33±0.04 13.7±0.2
0-52-34 BE 4.62±0.02 0.793±0.001 53.1±0.4 0* 32.5±0.2 3.41±0.02 24.3±0.2 204.2±0.4 2.11±0.03 0.034±0.001 0.87±0.01
1-12-17+2MgO
+20SO3 NL 6.51±0.02 1.369±0.001 9.4±0.2 22.81±0.04 17.2±0.4 2.29±0.02 16.13±0.03 368.6±0.5 18.6±0.1 1.81±0.03 12.6±0.2
17.5-44-0 BE 2.31±0.01 1.647±0.002 44.1±0.1 0* 0* 1.75±0.04 11.2±0.8 140.4±0.3 2.03±0.02 0.361±0.003 0.45±0.01
20-20-20 IT 5.46±0.01 1.251±0.001 20.61±0.01 2.77±0.03 20.07±0.05 0.99±0.12 11.94±0.16 1237±0.2 49±2 0.055±0.002 0.41±0.01
15-15-15+2MgO+
15SO3+5CaO+1Zn BE 7.19±0.01 1.521±0.005 8.1±0.1 16.33±0.04 14.7±0.4 5.70±0.07 25.4±1.2 5735±4 22.3±0.1 1.59±0.01 11.01±0.03
17-44-0 JO 2.21±0.02 1.913±0.002 43.1±0.1 2.84±0.02 0* 2.94±0.02 12.6±0.2 142±3 5.07±0.06 1.29±0.03 0.3±0.1
20-20-20+TE BE 5.32±0.01 1.266±0.001 20.82±0.04 3.019±0.004 18.88±0.05 2.46±0.02 14.2±0.1 515±1 91.6±0.1 0.65±0.01 1.1±0.1
a Abbreviation of the country of origin according to the ISO (International Organization for Standardization); BE: Belgium, FR: France, DE: Germany, IT: Italy,
JO: Jordan, LB: Lebanon, NL: Netherlands, NO: Norway, RU: Russian Federation, SA: Saudi Arabia; ES: Spain, TR: Turkey, UA: Ukraine, US: Unites States b TE: Trace Element
*Below the detection limit

27
Table 2. Pearson correlation of all compounds in NPK fertilizers
Sb Pd Ag Mo Nb Zr Bi Zn Cu Fe Mn Pb Cd Ca P2O5 SO4
Sb 1
Pd 0.474 1
Ag 0.499 0.528 1
Mo 0.438 0.605 0.856 1
Nb 0.580 0.730 0.739 0.808 1
Zr -0.190 -0.187 -0.045 -0.050 -0.179 1
Bi 0.070 -0.320 -0.194 -0.221 -0.364 0.383 1
Zn -0.288 -0.191 -0.145 -0.160 -0.100 -0.202 -0.205 1
Cu -0.010 0.215 0.119 0.335 0.205 -0.119 -0.116 -0.046 1
Fe -0.413 -0.171 -0.325 -0.249 -0.305 0.156 -0.044 -0.340 -0.092 1
Mn 0.005 0.161 0.062 0.094 0.251 0.044 -0.135 0.350 0.149 -0.252 1
Pb -0.206 -0.273 -0.071 -0.150 -0.261 -0.022 -0.103 0.590 -0.098 -0.229 -0.173 1
Cd -0.208 -0.480 -0.397 -0.434 -0.586 -0.128 0.173 -0.030 -0.245 0.360 -0.495 0.198 1
Ca -0.316 -0.444 -0.367 -0.396 -0.557 0.051 0.201 -0.150 -0.215 0.591 -0.400 0.071 0.705 1
P2O5 0.291 0.242 0.243 0.329 0.476 -0.069 -0.113 0.191 0.138 -0.477 0.576 0.083 -0.459 -0.630 1
SO4 -0.256 -0.341 -0.335 -0.358 -0.534 -0.260 -0.008 0.017 0.038 0.367 -0.502 0.241 0.516 0.502 -0.602 1

28
Table 3. Trace metals in soil from eastern and southern Mediterranean countries
Cd Zn Pb Cu Cr
Dubai 0.17-1.01 3.34-170.27 6.92-2784 0.82-65.9 [53]
Lebanon 0.28-2.8 11.3-22.9 25.3-54.2 [54]
Egypt 12-16 36-41 46-79 28-29 [55]
Iraq 11-41 29-183 [56]
Iran 0.11-8.68 50.2-1510.3 7.2-319.3 15.4-84 67-116 [57]
Syria 46-293 <5-108 16-97 12-116 [58]
Tunisia 16.5 3337.6 676 [59]
Morocco 0.52-0.81 261.98-791.63 38.36-67.14 66.7 [60]
Algeria 0.01-14.15 4.7-258.8 3.1-823.7 0.2-132.1 7.4-111.5 [61]

29
Table 4. Estimated range of inputs in Cu, Pb, Zn and Cd (g/ha/year) in agricultural soil
Minimum application of 20 kg P/ha/year
Input of Cu Input of Pb Input of Zn Input of Cd
(g/ha/year)
Min/max 0.185/871 0.95/32.59 6.6/1752.4 0.183/10.34
Maximum application of 60 kg P/ha/year
Input of Cu Input of Pb Input of Zn Input of Cd
(g/ha/year)
Min/max 0.56/26130 2.84/98 19.8/5257.2 0.54/31