
Trace Debugging in lowRISC - RISC-V Foundation · Trace Debugging in lowRISC lowRISC release v0.3...
22
Trace Debugging in lowRISC lowRISC release v0.3 with Open SoC Debug Wei Song 1 , Stefan Wallentowitz 2 , Alex Bradbury 1 , Robert Mullins 1 1. lowRISC and University of Cambridge 2. Open SoC Debug 12 July 2016
-
Upload
phungduong -
Category
Documents
-
view
220 -
download
0
Transcript of Trace Debugging in lowRISC - RISC-V Foundation · Trace Debugging in lowRISC lowRISC release v0.3...

Trace Debugging in lowRISC lowRISC release v0.3 with Open SoC Debug
Wei Song1, Stefan Wallentowitz2, Alex Bradbury1, Robert Mullins1
1. lowRISC and University of Cambridge
2. Open SoC Debug
12 July 2016

lowRISC
lowRISC (http://lowrisc.org) is a not-for-profit community
project providing complete open source SoC designs.
– Open source hardware: ‘Linux of the hardware world’
– Aim to offer complete SoCs that run Linux well
– Extensible platforms: Base design for derivative designs
– RISC-V ISA: Rocket, BOOM, and PULPino
– Produce volume silicon, low-cost development boards and reference
designs: ‘Raspberry Pi for grownups’
– Research focuses: security and flexibility
– Core team based in Computer Laboratory, University of Cambridge
2

lowRISC cont.
• Approaches – Simple and permissive licenses
– Active community collaboration
– Regular tape-outs with community contribution
– Minion cores and shims:
• Flexible/programmable IO, performance counters, accelerators, security co-processor, etc.
– Tagged memory:
• Security, performance monitoring, synchronization, etc.
• Progress – Initial funding from private donor, recently from Google, eventually
self-sustaining
– Two major code releases: tagged memory and untethered SoC
3

Open SoC Debug
This is a combined release with lowRISC and Open SoC Debug.
• Open SoC Debug (http://opensocdebug.org) – An umbrella project for unified debug infrastructure
– Provide shared building blocks, interfaces and tools among different platforms
• Design principles – Abstraction from host interface connection:
16-bit parallel connection provided by Glip (http://www.glip.io) over UART/USB/JTAG/Ethernet
– Easy adoption: Modular design of debug modules
– Unified on-chip communication: Packet-switched on-chip network connecting all debug components
– Functionality: On-chip trace processing and off-chip trace analyses
4

Trace Debugging
• What is trace debugging – Collect instruction and user-defined traces for on/off chip
analysis
– Unlike run-control debugging
– Non-intrusive, no interruption, minimal performance overhead
• Why use trace debugging – Multicore: timing, synchronization, race condition, etc.
– Detect performance inefficiency
– Complementary to run-control debugging
– Light-weight instrumentation
5

Overall Structure
6

Trace Debugger Internals
7
Host Interface
Bridge between Glip and debug ring
System Control Reset and pause control
Serial Comm. UART emulator
Memory Access Read/write L2
Core Trace Extract instruction trace
Software Trace User defined trace

Enumeration & System Control
• System Enumeration – Each debug module has a unique ID used as destination for
debug packets
– Fixed ID for Host Interface (0) and System Control (1)
– System Control has the total number of modules and communication parameters of the on-chip debug network
– Each debug module has a set of compulsory registers: type, vendor, version
– Host side debug software is then able to discover all modules by enumeration
• System Control – Total number of modules and parameters for debug network
– Set/Reset system and processor cores
8

Memory Access & Serial Comm.
• Memory Access – Provide a coherent access to L2
– Allow debugger to read/write memory/cache
– Allow load elf (program) or binary data
• Serial Comm. – Emulate a UART16550 IP.
– Allow UART communication through debugger (share debugger & UART cable)
– Can be instantiated multiple times if needed
9

Core Trace
• Function: collect information from the core execution – Reconstruct program flow
– Verify register values
– Performance analysis
• Trace collection – JAL (function call), jump and branch, change of privilege modes
– ToDo: more traces and run-time configurable filters
• Trace event generation – Packetized with timestamp, send to host over debug network
– Current: Simple overflow handling (drop but record #drops)
– Future:
• Better network flow control / QoS
• Circular buffering and trace recording to DRAM
10

Example Core Trace
11
# time event
06570d02 enter init_tls
06570d22 enter memcpy
06570d67 leave memcpy
06570d76 enter memset
06570dae leave memset
06570dcd leave memset
06570dd5 leave init_tls
06570ddb enter thread_entry
06570e22 leave thread_entry
06570e28 enter main
06570e60 enter trace_event0
06570e91 leave trace_event0
06570e96 enter trace_event1
06570ea9 leave trace_event1
06570eb3 enter trace_event2
06570eca leave trace_event2
06570ee3 leave main
06571085 enter exit
065710b3 enter syscall
06571131 change mode to 3
065711ba enter handle_trap
0657127e enter tohost_exit
Overflow, missed 12 events
Overflow, missed 25 events
Overflow, missed 28 events
Overflow, missed 28 events
Overflow, missed 28 events

Software Trace
• Function: minimally-invasive code instrumentation – Light-weighted alternative to printf()
– Performance measurement between code points, etc.
– Can be release unchanged (safety) with minimal performance impact
• Thread-safe trace procedure – A trace event: (id, value)
– Write to $a0 (value), tracked by Software Trace
– Write to a dedicated CSR with (id), which triggers an event
• Trace event generation (same with Core Trace) – Trace event generation
– Packetized with timestamp, send to host over debug network
– Future: Better network flow control / QoS
12

Example Software Trace
• Trace DMA durations
13
# time id value
00002590 0x1001 0xe20c000ac20fc588
00002593 0x1002 0x0000000000000001
00002595 0x1002 0xffff0800000c0000
00002597 0x1002 0xe20c000ac20fc588
00002985 0x1003 0x0000000000000001
#define TRACE(id,v) \
asm volatile ("mv a0,%0": :"r" ((uint64_t)v) : "a0"); \
asm volatile ("csrw 0x8f0, %0" :: "r"(id));
#define TRACE_DMA_BUFFER(b) TRACE(0x1001,b)
#define TRACE_DMA_START(i,s,b) TRACE(0x1002,i) \
TRACE(0x1002,s) \
TRACE(0x1002,b)
#define TRACE_DMA_FINISH(i) TRACE(0x1003,i)
uint8_t *buffer = malloc(42);
TRACE_DMA_BUFFER(buffer);
TRACE_DMA_START(slotid,src,buffer);
dma_transfer(slotid,incoming,buffer);
TRACE_DMA_FINISH(slotid);
T0
Header Source
Visualization
Trace Log

Debug Procedure
# reset and pause cores
reset -halt
# load a test program
mem loadelf test.elf 3
# enable core trace
ctm log ctm.log 4
# enable software trace
stm log stm.log 5
# open a terminal (xterm)
terminal 2
# run the test
start
14
ID Module
0 Host interface
1 System Control
2 Ser. Comm.
3 Mem. Access
4 Core Trace
5 Software Trace
Command Line Interface import opensocdebug
import sys
if len(sys.argv) < 2:
print "Usage: runelf.py <filename>"
exit(1)
elffile = sys.argv[1]
osd = opensocdebug.Session()
osd.reset(halt=True)
for m in osd.get_modules("STM"):
m.log("stm{:03x}.log".format(m.get_id()))
for m in osd.get_modules("CTM"):
m.log("ctm{:03x}.log".format(m.get_id()), elffile)
for m in osd.get_modules("MAM"):
m.loadelf(elffile)
osd.start()
Python Script

Extra Features of the Debugger
• Uniform debug environment for both Sim/FPGA – DPI based Glip interface for simulation.
– Support UART and trace debugging in both RTL and FPGA simulation.
• Python frontend – Allow further tool integration (deliver as a python library).
– Off-line trace analysis.
– Easy command extension.
15
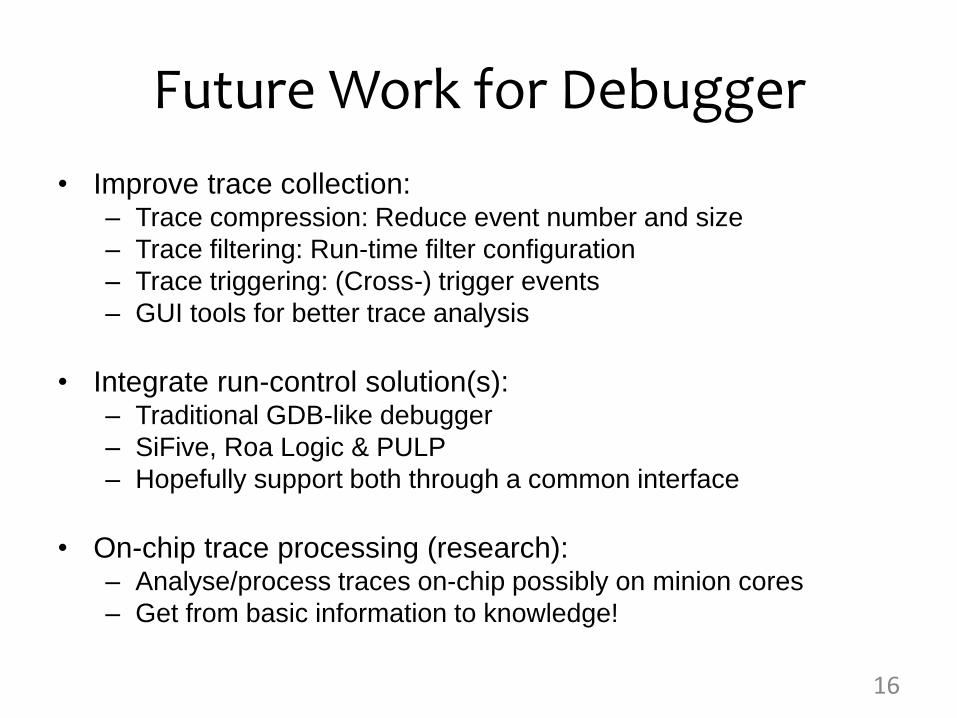
Future Work for Debugger
• Improve trace collection: – Trace compression: Reduce event number and size
– Trace filtering: Run-time filter configuration
– Trace triggering: (Cross-) trigger events
– GUI tools for better trace analysis
• Integrate run-control solution(s): – Traditional GDB-like debugger
– SiFive, Roa Logic & PULP
– Hopefully support both through a common interface
• On-chip trace processing (research): – Analyse/process traces on-chip possibly on minion cores
– Get from basic information to knowledge!
16

Available Boot Procedure
• Load from debugger (tethered) – Start FPGA and connect it with debugger
– Load program (Linux) by debugger
– Start the SoC from debugger
• Load from SD (untethered) – FPGA starts from an on-chip boot RAM
– Boot program load program (Linux) from SD
– Jump to the program loaded
17

Release v0.3
• Release available in July – A tutorial
http://www.lowrisc.org/docs/debug-v0.3/
– GitHub repository http://github.com/lowrisc/lowrisc-chip
• Key features – Trace debugging
– Low-cost FPGA board: Digilent NEXYS4-DDR
– Latest updates from Rocket-chip (up to 06/2016)
– Free development environment (Verilator + WebPACK)
– Full set of scripts/Makefiles
18

Schedule for Future Releases
• April 2015: v0.1 basic tagged memory
• December 2015: v0.2 untethered SoC
• July 2016: v0.3 trace debugger
• Optimizing tag cache
• Run-time tag checking
• Integrating minion cores (PULP)
19

General Updates from lowRISC
• Summer 2016 – 4 IMC interns: video / 2-D acceleration / performance counter
(tutorial/documentation)
– 5 GSoC projects: xv6 port, DDRx controller, Arduino library port to PULPino, Musl libc, OP-TEE trusted execution environment
• lowRISC development – New hire to look at minion core concepts
– Add tagged memory back to untethered SoC, thanks to Philipp Jantscher, Graz University of Technology
– Shim implementation currently under-way (Clifford Wolf)
20

Test Chip
21
Plan to finish the test chip RTL early 2017 and tape out afterwards.

Get Involved • All on GitHub, no hidden code.
• Submit pull request for bug fixes.
• Contact us for ideas, improvement, extensions.
Contribution is needed …
lowRISC: Peripherals, testing, compiler, Linux kernel, benchmarking, etc.
Open SoC Debug: GUI, trace analysis, support for more SoC platforms.
lowRISC
Website: http://www.lowrisc.org/
Mail list: [email protected]
GitHub: https://github.com/lowrisc/
E-mail: [email protected]
Open SoC Debug
Website: http://opensocdebug.org/
Mail List: [email protected]
GitHub: https://github.com/opensocdebug/
22


![Debugging IE Performance Issues - NicJ.net · Getting a Trace From an elevated command prompt: • Simple trace of system events o xperf.exe -on latency o [run scenario] o xperf.exe](https://static.fdocuments.us/doc/165x107/5fe04af600404462ba5ae919/debugging-ie-performance-issues-nicjnet-getting-a-trace-from-an-elevated-command.jpg)

