TPL Corp AR 2018 Part 1tplcorp.com/wp-content/uploads/2018/10/TPL-Corp-AR-2018...2018/10/16 · TPL...
246
2018 ANNUAL REPORT Disrupt. Innovate.
Transcript of TPL Corp AR 2018 Part 1tplcorp.com/wp-content/uploads/2018/10/TPL-Corp-AR-2018...2018/10/16 · TPL...

2018ANNUALREPORT
Disrupt. Innovate.

Table of Contents
COMPANY PROFILEVision and Mission 03Core Values 05Group Profile 07Company Information 09Geographical Presence 12
CHAIRMAN’S REVIEW REPORT 13
CEO’S MESSAGE 15
PROFILE OF DIRECTORS 19
SUSTAINABILITY 27
STAKEHOLDER'S INFORMATIONHorizontal Analysis Balance Sheet 41Horizontal Analysis Profit / Loss Accounts 42Vertical Analysis Balance Sheet 43Vertical Analysis Profit / Loss Accounts 44Cash Flow Analysis 45Ratio Analysis 46Graphical Presentation of Key Financial Ratios 47Statement of Value Addition 48
DIRECTOR'S REPORTEconomic Outlook 49Financial Highlight 49Group Performance 50Internal Control System 53Future Outlook 53Credit Rating 55Key Financial Data for the last Six Years 56Auditors 57Director’s Training 57Statement on Corporate and Financial Reporting Framework 57Pattern of Shareholding 58Additional Information 60Board Meetings 61Acknowledgments 61
FINANCIAL STATEMENTSAuditor’s Review Report 75Statement of Compliance with CCG 76Auditor’s Report to the Members 79Statement of Financial Position 85Statement of Profit and Loss Account 87Statement of Cash Flow 88Statement of Changes in Equity 90Notes to the Financial Statements 91
CONSOLIDATED FINANCIAL STATEMENTSAuditor’s Report to the Members 131Consolidated Statement of Financial Position 137Consolidated Statement of Profit and Loss Account 139Consolidated Statement of Cash Flow 140Consolidated Statement of Changes in Equity 142Notes to the Consolidated Financial Statements 143 SHAREHOLDERS'INFORMATIONNotice of Annual General Meeting 215Statement of Material Facts 220Proxy Form 240

Disrupt. Innovate. Create Value.Vision
MissionTo use disruptive technology to maximize stakeholder return and achieve sustainable growth for our portfolio companies.


Core valuesIntegrityWe are accountable for the highest standards of conduct, including honesty, productivity, and fairness in all aspects of our work. We fulfill our commitments as responsible citizens and employees.
Entrepreneurial SpiritTPL provides an innovative environment where entrepreneurial spirit amongst employees is always encouraged.
Value CreationWe are focused on talented employees effectively applying advanced technology and innovative solutions to create sustainable value for all stakeholders.
Team WorkWe give immense importance to team work and work together to ensure continuous improvement and respond vigorously to change.
DiversityWe give utmost importance to equality, inclusion and dignity for all at the work place.
Gender equalityWe strive to promote gender equality in all aspects of our work.

GROUP PROFILE
07 Disrupt. Innovate.
TPL Trakker Limited is Pakistan’s first and largest Telematics company operating since 1999. TPL Trakker offers vehicle based IoT solutions utilizing GPS/GSM technology. TPL Trakker works with various businesses spread across a broad spectrum of industries to equip them with advanced technology enabling monitoring of vehicle movement, driver behavior, fuel pilferage, driver safety and compliance. TPL Trakker is also one of the only tracking companies to offer stolen vehicle recovery services with recovery rate surpassing 90%.
TPL Maps, a part of TPL Corp was launched in 2016 and is the first indigenous digital mapping company of Pakistan providing GIS-based scalable solutions to businesses with the aim of contributing data to the community. Licensed by the Survey of Pakistan, TPL Maps has the largest location-based data collection with over 250+ cities mapped, approximately 4.4 million geocoded addresses and over 320,000+ kilometers of road network mapped across the country.
In addition to our mapping services, TPL Maps’ flagship offering includes the in-dash navigation hardware and software which is a state-of-the-art advanced system equipped with the latest technology that is tailored for the region to make navigation accurate, faster and on-point. Now TPL Maps has launched Pakistan’s first Location Based Services platform that will empower the digital economy and economic growth of the country.
TPL Life Insurance Limited aims to provide innovative Insurance solutions - catering to both life & health insurance needs of Corporates and Individuals. These solutions are developed by following international standards and are tailor made to cater to the diverse and varying insurance needs of the Pakistani Market. Embedding Technology, Digitalization and Ease at the core of everything that TPL Life does is the key what enables us to deliver an absolute and unmatchable customer experience to our clients.
TPL Life’s continuous investment towards innovation, technology and market intelligence allows in offering a wider range of unique and need based Life & Health Insurance solutions for individuals, small to large corporates and microfinance segments – A REALITY!
The principal activities of TPL Properties are to invest, purchase, develop, sell, rent out or dispose of real estate assets including commercial and residential buildings. TPL Properties Limited successfully completed its initial public offering, conducted entirely through a Book Building process, in June 2016. Centrepoint is TPL Properties first project and is designed as a state of the art complex. It adheres to the highest international standards of design and technology in commercial buildings and is a unique addition to Karachi’s skyline.
TPL Insurance is Pakistan's first direct insurance company with the aim to provide seamless insurance services to its customers through its 24 / 7 call center and integrated insurance systems. TPL Insurance has launched Pakistan’s first insurance customer app with distinguished features of policy issuance, claim lodging, self-surveys, endorsements and renewal of policies with further features and products to be included in the app soon. It is disrupting the concept of insurance by digitally enabling its business partners and customers in issuance of policies and servicing of customers. With the promise to lodge claims in less than 60 seconds and to process in 45 minutes, TPL Insurance upholds it unmatchable quality service standards through highly diligent insurance team and customer friendly processes. The Company is offering all lines of general insurance viz. Auto, Fire, Marine, Health, Home and Travel with both conventional and Takaful (Islamic insurance) solutions to ensure peace of mind for its customers.
TPL Rupiya, TPL Corps’ payment service vertical, is an e-payments company, offering solutions that are facilitating payments via bank, government and mobile account transactions. State Bank of Pakistan has already issued in-Principle approval to TPLR during the previous year.
Digital economics transformation has revolutionized the way we transact and manage payments. TPL Rupiya aims to build a payment ecosystem that will help to reduce the individual's reliance on cash to acquire day-to-day services. It will re-engage the under-banked, unhappily banked and underserved market with an intuitive mechanism that will bring the bank to clients’ phones while protecting their identities and ensuring secure transactions.
TPL Rupiya had also joined hands with UBL Omni to introduce cashless payments for the passengers of Lahore Transport Company enabling them to make daily commute payments using their UBL Omni bank accounts. It will also enable LTC passengers to avail a first of its kind “Tap n Pay” solution that allows fast payment and helps to reduce long checkout lines. TPL shall issue NFC (Near Field Communication) Cards for online payments and UBL Omni bank accounts will be linked for enabling these payments.
Being a preferred choice for generating powerful customer experiences, TPL Rupiya is proud to be nominated as a pre-qualified solution provider for Green line and Orange line bus projects. TPL Rupiya further envisions to extend its service reach across the transportation industry.
TPL e-Ventures is an early stage investor focused on deploying capital in Pakistani tech or tech enabled companies with a vision to build a world class platform known for catalyzing high potential / high impact entrepreneurs.
Established in 2001 as a licensed security company, TPL Security Services is a progressive and innovative security solutions provider, with unparalleled customer service. The company devotes extensive time and resources into hiring, training, developing and retaining the right people to fulfill each client's needs. Executive protection that includes mobile squads, 24/7 operations and an IT-enabled control room, amongst a host of other features, ensures deployment efficiency and customized solutions to keep you secure.
08

Company information

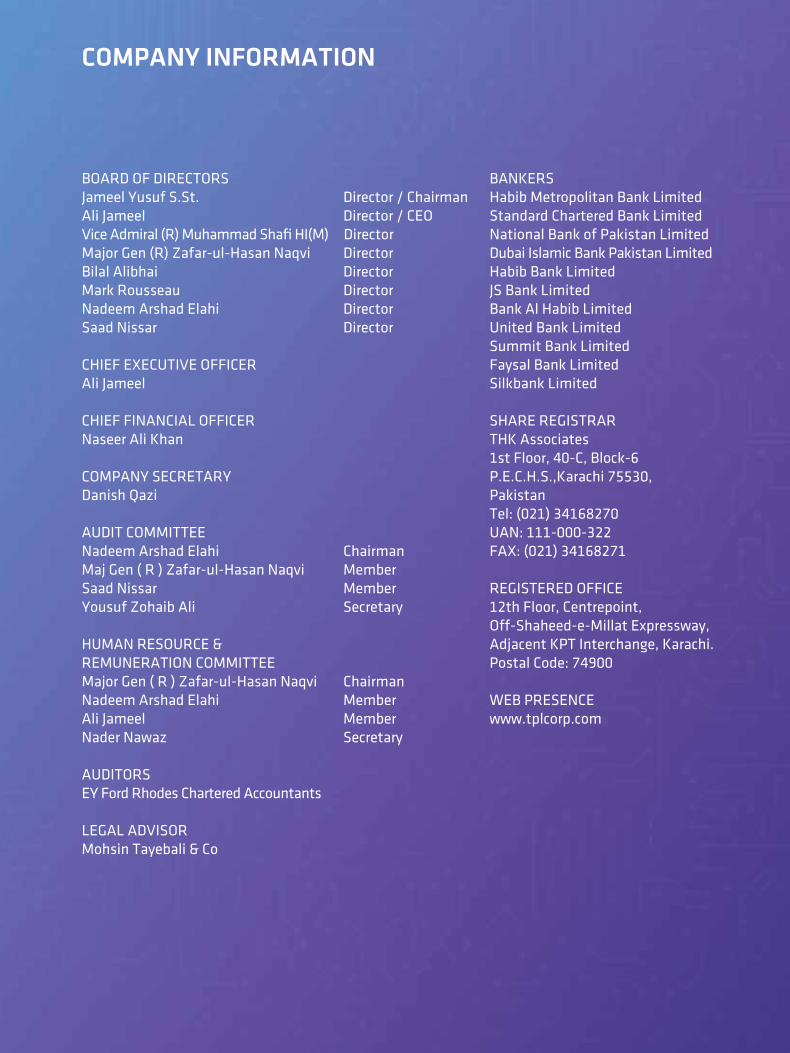
BOARD OF DIRECTORS Jameel Yusuf S.St. Director / ChairmanAli Jameel Director / CEOVice Admiral (R) Muhammad Shafi HI(M) DirectorMajor Gen (R) Zafar-ul-Hasan Naqvi DirectorBilal Alibhai DirectorMark Rousseau DirectorNadeem Arshad Elahi DirectorSaad Nissar Director
CHIEF EXECUTIVE OFFICER Ali Jameel
CHIEF FINANCIAL OFFICER Naseer Ali Khan
COMPANY SECRETARY Danish Qazi
AUDIT COMMITTEE Nadeem Arshad Elahi ChairmanMaj Gen ( R ) Zafar-ul-Hasan Naqvi Member Saad Nissar Member Yousuf Zohaib Ali Secretary
HUMAN RESOURCE &REMUNERATION COMMITTEEMajor Gen ( R ) Zafar-ul-Hasan Naqvi ChairmanNadeem Arshad Elahi Member Ali Jameel Member Nader Nawaz Secretary
AUDITORS EY Ford Rhodes Chartered Accountants
LEGAL ADVISORMohsin Tayebali & Co
BANKERSHabib Metropolitan Bank LimitedStandard Chartered Bank LimitedNational Bank of Pakistan LimitedDubai Islamic Bank Pakistan LimitedHabib Bank LimitedJS Bank LimitedBank Al Habib LimitedUnited Bank LimitedSummit Bank LimitedFaysal Bank LimitedSilkbank Limited
SHARE REGISTRARTHK Associates1st Floor, 40-C, Block-6P.E.C.H.S.,Karachi 75530,PakistanTel: (021) 34168270UAN: 111-000-322FAX: (021) 34168271
REGISTERED OFFICE12th Floor, Centrepoint,Off-Shaheed-e-Millat Expressway,Adjacent KPT Interchange, Karachi.Postal Code: 74900
WEB PRESENCEwww.tplcorp.com
COMPANY INFORMATION

GEOGRAPHICAL PRESENCE
KARACHICORPORATE OFFICE12th &13th Floor, Centrepoint, Off Shaheed-e-MillatExpressway, Adjacent KPT Interchange,Karachi, Postal code-74900
LAHORE OFFICE51-M, Denim Road, Quaid-e-Azam Industrial Estate(Kot Lakhpat), LahoreUAN: +92-42-111-000-300FAX: +92-42-35157233
TPL TRAKKER INSTALLATION CENTER20-B, Block 6, P.E.C.H.S., Karachi (Behind Bank Al HabibIslamic Banking Branch on Main Shahrah-e-Faisal)Phone: +92-21-34324011-13UAN: +92-21-111-000-300FAX: +92-21-34324014
ISLAMABAD OFFICE10th Floor (South) ISE Towers, 55-B Jinnah Avenue, BlueArea, Islamabad.UAN: +92-51-111-000-300FAX: +92-51-2895073
MULTAN OFFICEHouse No. 5, Suraj Miani Road, Opp. Ashraf CardiacClinic, Chungi No. 1, MultanUAN: +92-61-111-000-300FAX: +92-61-4519391FAISALABAD OFFICEP-6161, West Canal Road, FaisalabadUAN: 041-111-000-300,Phone: +92-41-8501471-3Fax: +92-41-8501470
HYDERABAD OFFICEA-8 District Council Complex, Hyderabad.Phone: +92-22-2728676FAX: +92-22-27831542nd Floor Plot #15/5, Main Auto Bhan Road RailwayCooperative Housing societyHyderabad.


CHAIRMAN’S REVIEW REPORT
I am pleased to present the performance review of the Board of Directors of Company. Despite fierce com-petition within the sector of Information Technology, the Company continued to deliver strong business growth due to innovation and modernization.
The Board played a very important role in taking the Company forward due to its persistent guidance. Due to constant assistance and oversight of the Board, the Company was able to ensure transparency in the compliance and corporate governance.
The Board comprises of individuals with considerable diversified experience and skill. The performance of the Board has been remarkable and the Committees worked efficiently in accordance with the require-ments enshrined under the Listed Companies (Code of Corporate Governance) Regulations, 2017.
During the year, the Hon’ble High Court of Sindh approved the Scheme of Arrangement, whereby the name of the Company changed from TPL Trakker Limited to TPL Corp Limited and under the current structure, the Company now holds investment in all its subsidiaries. Subsequent to the approval of the Scheme of Arrangement, all assets and liabilities pertaining to mapping and tracking businesses have been transferred to TPL Maps (Pvt.) Limited and TPL Trakker Limited.
All the Group Companies performed well and the decisions taken by the Board were implemented enabling the Company to work efficiently. Moreover, the Board Committees performed exceptionally well. The Audit Committee focused on the risk management within the regular course of business, whereas the Human Resource and Remuneration Committee ensured that the HR Policies regarding performance management, staffing and compensation (monetary and non-monetary) are properly aligned with the Company’s long term plans. In addition, the Board effectively carried out Board Performance Appraisal at the end of the financial year in terms of which the performance was found to be satisfactory.
Moreover, it gives me immense pleasure to inform the shareholders that the Board acted on a fully informed basis in the best interest of the Company and its stakeholders. The Board has got overall responsibility to approve and oversee implementation of the Company’s strategic objectives and to set ‘tone at the top’ in order to promote a sound corporate culture. Moving forward, I am confident that the Company with the guidance of the Board would surpass all expectations by exponential growth in the coming years.
Jameel Yusuf (S.St.)Chairman as of June 30, 2018


This past year will go down as critical in the history of TPL – we have set the foundations for what we
believe will unlock exponential growth across the industries we serve in as we look to firmly establish
TPL as a forward thinking technology driven group of companies.
TPL Corp’s launch was not just a change in name and structure alone but a new promise and a new vision
for powerful business growth driven by a digital mindset. The structural change has positioned TPL Corp
to better manage its portfolio companies and allowed for a more investor friendly structure for both local
and foreign investors. TPL Corp stands firmly on its promise of innovation and disruption; continuously
challenging the old ways of executing business by applying an agile methodology across its portfolio.
Last year we invested in enterprise capabilities that have allowed TPL Corp to win in a volatile economy.
Our decisions on investments, capital expenditures, products, services and building a sustainable digital
ecosystem helped our businesses achieve superior customer performance outcomes and long-term
value creation for our stakeholders.
Our flagship Tracking business, TPL Trakker, delivered great results while tackling the challenges that
were presented to it head on. The business took a drastic shift in direction when launching the first and
most powerful mobile app for asset tracking resulting in the empowerment of our customers with
convenience and information on the go. Moving forward, through Telematics we will be able to improve
efficiency, as we start monitoring Driver Behavior, fuel consumption, and other health, safety and
environment (HSE) standards.
Globally location will be the key reference point for technology growth and otherwise. Location data will
play a vital role in business reach more accurately and efficiently; from ordering food, to calling a cab, to
voting at a polling station, weather reports, demographic data and even events. At TPL Maps, we are not
only mapping locations accurately but also enabling businesses to build services by using the data
acquired through our Location Based Services (LBS) platform. As such, TPL Maps looks to build industry
specific location solutions and is working on bringing new technologies to the market such as Aerial
mapping via drones, Artificial intelligence-based insurance via maps, branch planning and proximity
advertising solutions.
CEO’S MESSAGE

Furthermore, the company looks to continue its growth in the in-car navigation segment and looks to
engage with new entrants expected in the auto industry. We have expanded our navigation software to
Honda and upcoming ISUZU vehicles as well as other OEM’s. With Indus Motors we have increased the
volume of business by doubling the sales in Corolla 1.8. In the year 2017-18 we have also laid the
foundation for our automobile hardware solution which includes AVN units, Wireless chargers, sensors,
OBD devices and other such innovative solutions. In the year 2018-19 we are expected to grow 5X in our
mapping business with the help of increased hardware and the LBS platform.
Our General Insurance strategy requires us to leverage digital technologies in line with developments in
the insurance sector, globally. As such, we are in the process of digitalizing our claims process to make it
paperless in order to further improve our customer experience. Additionally, our Customer app has also
been launched for our auto insurance customers that facilitates policy buying, lodging of claims,
self-survey of vehicles and damages, requesting endorsements and the renewal of policies. Moving
forward the company looks towards growth across new insurance lines to build upon its impressive auto
insurance portfolio.
In the Life & Health Insurance sector, TPL Life is reshaping the life insurance market and reassembling it
to a customer-focused digital ecosystem. The company is and will continue to create new business
models to increase its reach in the digital space. We have collaborated with local and international
players to build new products, services and customer experiences on our digital platform which
simultaneously pushes the boundaries of new product development & Innovation.
TPL Properties stands out as a symbol of quality by setting a new standard in property development in
the Country. After the success of the iconic Center Point we are now committed to further raise the bar
by developing two new properties in the business Hub of Karachi. We have engaged with top tier
architects and designers from around the world who have agreed to work in Pakistan. While we strive for
the highest standards in construction quality, we also keep in mind the heritage, culture, environment &
eco-friendly nature and automation of our sites which reflects on the responsible identity of the
business group.
With TPL Rupiya, our aim is not to be just another fintech player in the market; we want to redefine the
concept of financial inclusion. Our focus is on repeat transactions, smaller ticket size and empowerment
of masses with digital financial services. Our core at TPL Rupiya is making payments digitally simple and
economically viable. Our partnership in this space is growing steadily and we are committed for long
term play in digital payments. After the completion of our pilot projects we will enable our own
ecosystem on our payments platform and make it accessible to the public so they too can benefit from
our services.
Our strategic focus on empowering the startup ecosystem in Pakistan is the ethos behind TPL eVentures
where we look to make investments in Pakistani tech or tech-enabled businesses. We strongly believe
in the collaborative benefits of developing a synergistic ecosystem for our portfolio companies and the
industry at large. Our expertise, time and investments are therefore committed towards the incubation
of ideas that are in are in sync with our digital mindset and data driven technologies. Pakistan has a
youth bulge that is moving towards entrepreneurship – TPL e-Ventures is looking to provide them with
a platform to grow. Our teams regularly work with incubators and accelerators to identify opportunities
for investment, provide mentoring to startups and connect them to collaborative opportunities across
the group.
Best,
Ali Jameel

Board of Directors


Jameel Yusuf (S.St.)
ChairmanMr. Jameel Yusuf Ahmed is a businessman by profession and is the Chairman of TPL Corp Ltd. He was the founder Chairman of Citizen-Police Liaison Committee (CPLC), and remained its Chairman from September 1989 to March 2003. He is also the Director of Asia Crime Prevention Foundation (ACPF) and is the founding trustee of "PANAH", a shelter home established for women in distress.
Mr. Yusuf is also a member of Advisory Council Fellowship Fund for Pakistan (FFFD) since 2004. He was awarded Presidential Award "Sitara-e-Shujaat" for gallantry services in August 1992 and was also nominated for the First United Nations Vienna Civil Society Award in 1999.
Ali Jameel
CEOMr. Ali Jameel is the CEO of TPL Corp Ltd. He is also the director of TRG Pakistan Ltd. Formerly Mr. Jameel was the Chief Executive Officer of Jahangir Siddiqui, Investment Bank. He has also held several advisory posts in Board of Investment, Economic Advisory Council, Pakistan’s information technology and telecommunication sectors, including appointments on the task Force on Telecom Deregulation, the Fiscal Incentive Group on the IT Commission and the Task Force on Venture Capital. Mr. Jameel received his B.Sc. degree in Economics from London School of Economics. He is also an Associate Member of the Institute of Chartered Accountants in England & Wales and qualified in 1994 at KPMG Peat Marwick in London.

Mark Rousseau
DirectorMr. Mark Rousseau is responsible for overseeing the company’s operations in six continents and has focused on putting optimal structures and group strategy in place to meet the changing needs of both consumer and fleet customers. Wholly owned and third party distribution models are used to drive overall service and delivery to new levels.
Saad Nissar
DirectorMr. Saad Nissar is an experienced marketing professional. He joined TPL Trakker Limited in the year 2000 at its inception as National Sales Manager. Mr. Saad Nissar has been instrumental in setting up and executing retail network nationwide, successful packaging and promotion of fleet management and portfolio management services in the corporate sector and Financial Institution Groups (FIG) of Pakistan respectively. Mr. Nissar was appointed as Director of TPL Insurance effective July 2005 and consequently he assumed the role of Chief Executive Officer. TPL Insurance has won “Brands of the Year Award” for five consecutive years under his leadership. Mr. Nissar holds an MBA degree from the Institute of Business Administration.
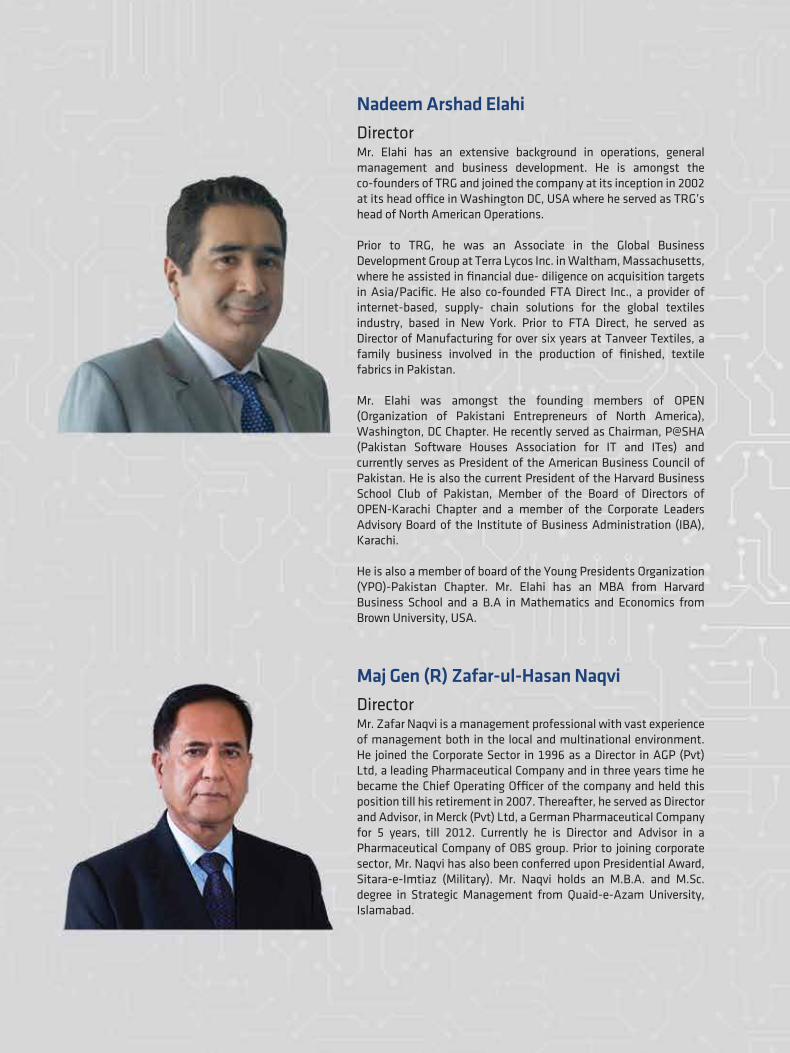
Nadeem Arshad Elahi
DirectorMr. Elahi has an extensive background in operations, general management and business development. He is amongst the co-founders of TRG and joined the company at its inception in 2002 at its head office in Washington DC, USA where he served as TRG’s head of North American Operations.
Prior to TRG, he was an Associate in the Global Business Development Group at Terra Lycos Inc. in Waltham, Massachusetts, where he assisted in financial due- diligence on acquisition targets in Asia/Pacific. He also co-founded FTA Direct Inc., a provider of internet-based, supply- chain solutions for the global textiles industry, based in New York. Prior to FTA Direct, he served as Director of Manufacturing for over six years at Tanveer Textiles, a family business involved in the production of finished, textile fabrics in Pakistan.
Mr. Elahi was amongst the founding members of OPEN (Organization of Pakistani Entrepreneurs of North America), Washington, DC Chapter. He recently served as Chairman, P@SHA (Pakistan Software Houses Association for IT and ITes) and currently serves as President of the American Business Council of Pakistan. He is also the current President of the Harvard Business School Club of Pakistan, Member of the Board of Directors of OPEN-Karachi Chapter and a member of the Corporate Leaders Advisory Board of the Institute of Business Administration (IBA), Karachi.
He is also a member of board of the Young Presidents Organization (YPO)-Pakistan Chapter. Mr. Elahi has an MBA from Harvard Business School and a B.A in Mathematics and Economics from Brown University, USA.
Maj Gen (R) Zafar-ul-Hasan Naqvi
DirectorMr. Zafar Naqvi is a management professional with vast experience of management both in the local and multinational environment. He joined the Corporate Sector in 1996 as a Director in AGP (Pvt) Ltd, a leading Pharmaceutical Company and in three years time he became the Chief Operating Officer of the company and held this position till his retirement in 2007. Thereafter, he served as Director and Advisor, in Merck (Pvt) Ltd, a German Pharmaceutical Company for 5 years, till 2012. Currently he is Director and Advisor in a Pharmaceutical Company of OBS group. Prior to joining corporate sector, Mr. Naqvi has also been conferred upon Presidential Award, Sitara-e-Imtiaz (Military). Mr. Naqvi holds an M.B.A. and M.Sc. degree in Strategic Management from Quaid-e-Azam University, Islamabad.

Vice Admiral (R) Muhammad Shafi, HI(M)
DirectorMr. Shafi was commissioned in 1974 into the operation branch of Pakistan Navy where he held various positions including Commander Coastal Areas (responsible for the defence of Pakistan’s coast), Commander Logistics (Commanded over 12,000 service and civilian personnel and responsible for all logistics in the Pakistan Navy), Commander of 25th Destroyer Squadron of Pakistan Navy and also Commanded Pakistan Naval Destroyer PNS Shahjahan and Frigate PNS Shamsher.He has also held various other positions including Assistant Chief of the Naval Staff (Plans), Deputy Chief of Naval Staff (Training & Personnel as well as Operations), Director General Naval Intelligence and Principal Staff Officer to the Chief of Naval Staff. He has been the Member of the Board of Trustees of Karachi Port Trust, Chairman of Pakistan National Shipping Corporation and Chairman of Port Qasim Authority. He is also the author of Information Warfare; Research paper at NDU, Maritime Options for Pakistan; Thesis at Naval War College, Rhode Island, USA, Customs, Traditions and Ceremonials in the Pakistan Navy. He also holds prestigious Military awards which include Hilal-e-Imtiaz, Sitara-e-Imtiaz and Tamgha-e-Imtiaz. He has obtained his MSc in Defence and Strategic Studies from National Defence University, Islamabad in the year 2001 and his BSc in Physics and Mathematics from Karachi University, 1974. He has also obtained many other additional qualifications including a certification in financial management from Naval Officers Training Centre, USA – 1990.
Bilal Alibhai
DirectorMr. Bilal Alibhai is a third generation entrepreneur and has been Group Executive Director at Bilal General Transport, Dubai, UAE (and subsidiaries) since 2002. The group is one of the UAE’s leading providers of transportation, equipment rental, and other services to the construction industry. He is also a director of Rashwell Company LLC, Dubai, a leading commodities trading business in UAE. Mr. Alibhai holds a BBA (Hons) degree from Queen’s University, Canada, with a concentration in finance and strategy.

Sustainability Report


27 Disrupt. Innovate.
INTRODUCTION
The purpose of this report is not only to communicate our sustainability strategies, management approaches and performances, but also comprehensively introduce our ongoing activities for our sustainable development toward the societies and environment in which we operate.
SUSTAINABILITY REPORT

28
IMPACT PORTFOLIO
SUSTAINABILITY GOALSSustainability forms the core of our strategic vision and serves as a guiding principle for our business objectives. Our sustainability goals are based on the Sustainable Development Goals 2030 by United Nations. In the last financial year, the group allocated PKR 19.6 Million for health and environmental initiatives.
ENVIRONMENTAL PERFORMANCETPL Corp offers a wide range of business opportunities while offering a sustainable ecosystem that provides greater assurance for smooth business operations. We implement high environmental standards so that our actions today will provide the energy needed for economic growth, social well-being, and a healthy environment tomorrow. We seek to reduce the environmental impact of our business activities and contribute to global environmental protection by recognizing that a better, more prosperous future is intrinsically linked to the well-being and health of our planet.
Since Pakistan is ranked seventh in the list of countries most vulnerable to climate change, we work to manage our operations as efficiently as possible, taking initiatives to promote cleanliness, greenery and the reduction in carbon emissions. We also strive to conserve energy which in turn further reduces the emission of Greenhouse Gases (GHC) using smart technologies and solutions.
1,414employees trained in varioustechnical and soft skills
65%energy conserved by usingefficient technologies
beneficiaries were provided witheducational opportunities
trees planted in the area around our office
71,294beneficiaries provided withhealthcare facilities
radius public area surrounding our corporate head officeimpacted by gardening and cleaning facilities
1 km
166
1,000

Cleanliness and Plantation around TPL offices
TPL Corp is resolute in keeping the environment healthy and Verdant. We continuously carry out cleanliness and plantation drives around a 1 KM radius surrounding the corporate office and contribute tireless efforts to make sure we create a positive impact in the environment we operate in.
Conservation of Energy
Smart-lighting Solutions: We strongly believe in the conservation of energy, and have taken significant measures to implement smart lighting solutions in our offices for improved energy efficiency.
Double-glazed Glass Façade:
To minimize energy consumption, the head office is equipped with the high quality energy efficient glass façade.
Heat-Recovery System:
The offices Heat Recovery System is facilitated by a 2 x1 gas generator for uninterrupted independent power supply that helps to conserve energy,
New Supplier Screening
All vendors and suppliers intending to build a business relationship with the company are part of an extensive screening process.
Ozone Depleting Substances
We recognize the potential environmental impacts of our digital transformation, and prioritize the reduction of carbon footprints and energy used in our services to meet environmental standards.
Environmental Impacts in the Supply Chain
We manage our supply chain in a socially and environmentally responsible manner and source from approved suppliers whose ethical values and strict social and environmental standards mirror our own.
Preservation of Karachi Heritage
In the last financial year, we contributed PKR 1 million to sponsor a seminar on heritage preservation organized by the Institute of Architects Pakistan - Karachi Chapter on the challenges and opportunities faced when preserving Karachi’s heritage sites.
29 Disrupt. Innovate.

SOCIAL PERFORMANCE
HUMAN RESOURCE
Workforce Diversity
To help strengthen a culture of diversity and inclusion, we believe in and stand for fair and equal treat-ment for all, irrespective of origin, race, or gender. Under no circumstance do we tolerate under-age employment and forced labor.
Health & Safety
We are committed to maintaining a healthy and safe environment for all our employees and take reasonable steps to ensure that the environment is exposed to the lowest practicable of risk.
Employees Training & Development
We take great pride in investing time and funds on the training and education of our workforce. We believe one of the best investments we can make is in our employees and we provide them with the tools, training and opportunities they need to grow and reach their full potential, preparing them for future experiences and growth opportunities. We thus have a specific yearly budget allocated to regularly conducting technical and soft-skills training sessions for our employees.
Impact Numbers
1,414 employees were trained.
SOCIAL PERFORMANCE
HEALTHAccording to the Ministry of Planning Development and Reforms, 29.5% of Pakistan’s population falls below the national poverty line. In order to ensure the sustainable well-being of society there is a dire need for the provision of quality healthcare facilities, which can contribute positively towards the country’s prosperity. In view thereof, TPL Corp has prioritized healthcare in its CSR initiatives.
90Female employees
1,926Male employees
34Average age of employees
Fire drills conducted
2Safety drills conducted Fatalities
2 3
30

Fut’school League
A healthy lifestyle improves productivity at work. Keeping this in mind, a futsal carnival for children was organized by the company to raise awareness on healthy activities and a well-balanced, active lifestyle.
Pakistan Blind Sports Federation
What we did?
Pakistan Blind Cricket Council (PBCC) is a foundation for visually impaired cricketers in Pakistan. It controls and manages all the tours and matches undertaken by the cricket team. It was founded by Agha Shoukat Ali in 1996 for the development of cricket for visually impaired individuals.
TPL Crop organized an event, “Cricmania” for the Federation with TPL’s Cricket team in order to promote inclusion and give them due recognition as part of our society.
Impact Numbers
71,294patients were provided with healthcare facilities.
Digital ReachTPL Corp was able to reach out to 20,296 individuals in Pakistan through electronic mediums and encourage a healthy way of living. #Safeliving #TPLCares
31 Disrupt. Innovate.

Blood Donation by TPL Employees
Impact Numbers:
240
TPL Corp conducted an in house blood donation drive for various institutions, where 80 employees donated their blood. With an ageing population, more advanced life-saving medical procedures and new hospitals being established, more blood will be required ever year. According to WHO, each unit of donated blood can save up to three lives.
People benefitted from the blood donation drive at TPL Corp.
TPL Corp donated PKR 1 Million which funded the treatment of 20 patients.
What we did
TPL Corp donated PKR 200,000 to the hospital.
What we did
Patients’ Aid FoundationPatients’ Aid Foundation (PAF) is a non-profit organization committed to providing free treatment to the thousands of patients walking in to Jinnah Hospital Karachi looking for quality healthcare.
Aga Khan Hospital & Medical College FoundationThe Aga Khan Hospital & Medical College Foundation was established for setting up, maintaining, administering and running teaching hospitals as well as other health care facilities, medical colleges and various institutions of learning and research as specifically contained in its Memorandum of Association.
Bait-ul-SukoonBait-ul-Sukoon is the only free cancer hospital with a hospice in Pakistan. The Foundation provides complete Cancer treatment, including boarding and lodging with costs being borne by the institution.
What we did
Patients’ Aid Foundation was provided with PKR 7.5 million as a donation for the treatment of 75 patients. Moreover, TPL Corp contributed to the build of a new surgical complex with improved facilities, including 18 operation theatres, which will lead to the increase in the number of surgeries per year by 40,000.
32

What we did
What we did
TPL Corp will be contributing PKR 2 Million to Lady Dufferin Hospital for the development of infrastructural facilities.
TPL Corp donated PKR 2.5 million as financial assistance for the procurement of a dialysis machine and the treatment.
What we did
What we did
Patients Behbud Society for AKUHPatients Behbud Society for AKUH is an independent, charitable society responsible for collecting and disbursing zakat to deserving patients who visit the Aga Khan University Hospital and its secondary hospitals.
Indus HospitalIndus hospital focuses on providing free of charge healthcare facilities accessible to everyone. It has served over 900,000 underprivileged citizens of Pakistan. Indus Hospital is the only initiative of its kind, in the country to provide premium health-care in an impressive, state-of-the art health center completely free of charge.
Lady Dufferin HospitalLady Dufferin Hospital is the largest women’s hospital in Pakistan with one of the largest maternity facilities providing specialized care for women and infants.
Sindh Institute of Urology and Transplantation (SIUT)SIUT provides free medical treatment for problems relating to the kidney, liver, and various cancers. It is also a renowned center in Pakistan for ethical kidney transplantation. SIUT’s extensive facilities house state-of-the-art equipment, which enables them to provide free treatment to those in need.
TPL Corp donated PKR 5 million to PBS for AKUH to ensure that the Zakat money reached deserving people. The average cost of one patient at AKUH is PKR 180,000. We took responsibility of the treatment of 3 patients with cases so severe that they were turned down by other hospitals due to the complexity of the case or the unavailability of funds.
TPL Corp provided PKR 2.5 million financial assistance to Indus Hospital that saved the lives of a large number of patients. The patients were predominantly from the rural and urban strata with virtually no access to medical facilities.
33 Disrupt. Innovate.

TPL Corp contributed PKR 400,000 to the foundation to help saves the lives of children at risk.
Success Story in Health
Tahira
Tahira had a comfortable life in her hometown of Sujawal until one day when her niece had a major breathing problem and stopped feeding. With limited healthcare facilities in Sujawal, her sister lost all hope of saving her child. The resilient Tahira travelled all the way to Karachi and was rushed to NICH Emergency Room, an initiative of Child life Foundation. Within two days, Tahira’s niece recovered. With the funding of TPL Corp, 571 patients like Tahira’s niece are able to get free treatment.
What we did
Child Life Foundation ChildLife Foundation is a non-profit organization that provides essential quality medical care to children at an imminent risk of life. The foundation treats more than a million children every year through its emergency rooms, primary care clinics and preventive care programme.
SOCIAL PERFORMANCE
EDUCATIONAs many as 44% children between the ages of 5 and 16 in Pakistan are still out of school (Ministry of Federal Education & Professional Training – Government of Pakistan, 2017). Education is vital to transform the life of a child but for many this is a distant dream. With a focus in the field of education, TPL Corp has generously supported and promoted various educational organizations.
Impact Numbers
166students were impacted in the field education.
34

What we did
What we did
Hunar FoundationHunar Foundation’s key objective is to provide school graduates and other young adults with interna-tional standard vocational training that meets the expectations of the market, leading to employment or small business creations.
Kashmir Education FoundationKEF’s mission is to groom and educate underprivileged students. They encourage students with inquisi-tive minds that have the zest for knowledge and possess self-confidence to attain academic excellence and uphold universal human values.
Impact Numbers:
30underprivileged students’ academics responsibility taken by TPL Corp.
Mentorship SessionsMs. Anika Effendi Group Head - External Relations and CSR at TPL Corp is taking the company’s mission forward by holding mentorship sessions at various educational institutes to share her vast experience in the corporate world. Students have been enlightened with the sessions which taught them about the organizational culture, work ethics and management of workload pressure.
PKR 250,000 was donated as financial assistance to three underprivileged students to get training in the areas of Electrical & Electronics Technology and Mechanical Manufacturing.
TPL Corp is taking its vision forward to create a difference in society by acting upon its CSR objective plans to hold engagement sessions to reflect empathy for the lesser privileged of society. Further-more, we took the responsibility of providing education to students at the institute.
35 Disrupt. Innovate.

What we did
TPL Corp sponsored the Venice Biennale to support art and architecture by contributing an amount of PKR 300,000
What we did
TPL Corp organized a zoo visit as an educational activity for the students of the Street Schools. This activity was initiated to spread smiles across the faces of 25 students enrolled there.
What we did
TPL Corp sponsored a seminar, which was organized by IAP for the Preservation of Karachi’s Heritage. Numerous journalists attended the seminar from the print and electronic media. At the seminar TPL Corp announced the “Jameel Yusuf Heritage Award” of PKR 100,000 to motivate the youth and recognize the efforts of young architects in Pakistan. The award will be presented annually to young architects with outstanding contributions to the field of heritage.
Venice BiennaleThe Venice Biennale is one of the most prestigious cultural institutions in the world. Ever since its founding in 1895, it has been the avant-garde promoter of new artistic trends and organizer of interna-tional events in contemporary arts in accordance with a multi-disciplinary model, which characterizes its unique nature.
Street SchoolStreet Schools are the initiatives that provide basic education to children in need. The Street School was the first of its kind in Pakistan, which educated children found begging on streets.
Institute of Architects, PakistanInstitute of Architects, Pakistan is a voluntary body of architects in the country. It was established in 1957 by a small group of architects who had been trained in the west either working for the government or were in practice. IAP was formally registered in 1968 under the Societies Act, and subsequently registered in 1968 under the Companies Ordinance, with the Securities and Exchange Commission of Pakistan (SECP)
PAF KIETPakistan Air Force - Karachi Institute of Economics & Technology (PAF-KIET) is an established degree-awarding institute in the private sector, recognized by the Higher Education Commission (HEC) Pakistan. It's a joint collaboration of Pakistan Air Force (PAF) and Pakistan Educational Foundation (PEF).
TPL Corp held a mentorship session at PAF KIET that addressed the topic of “Corporate Ethics”.
What we did
36

What we did
Impact NumbersThis session benefitting 100 students was conducted by Anika Effendi, Group Head External Relations and CSR.
Institute of Business Administration (IBA)IBA is an autonomous degree-awarding institute based in Karachi. It has established itself as a premier business school with a track record of over fifty years of producing quality undergraduates and post-graduates in Business and Computer Sciences.
ImpactTPL Corp has a long-term commitment to develop the infrastructure of the institute.
Habib UniversityHabib University is a liberal arts and sciences university that offers an interdisciplinary education, drawing from the fields of science, engineering, arts, humanities and the social sciences.
Fazilia Trust PakistanFazilia Trust Pakistan comprises of a team of diversified development practitioners; all strongly adhered to the universal commitment of helping their nation achieve targets of the Millennium Development Goals. The trust management is governed by 11 Board of Trustees, who are selected by a general body, comprising of 200 members (with a gender sensitive distribution) from across Pakistan. Fazilia believes in the ability of individuals to help bring positive and sustainable change in theirs as well as in the lives of people around them.Fazilia believes in bringing about a positive and sustainable change in the lives of the underprivileged and downtrodden by providing basic facilities of health and education.
What we did
To enhance the interpersonal skills of the students, an event hall was built which has been dedicated to the company in appreciation of the ongoing efforts for the institution.
What we did
PKR 2 Million was contributed to sponsor the education of two students studying in the undergraduate program.
We strongly believing in promoting education for all children regardless of their background and social class, thus sponsoring the education of 9 children who had proved to show a keen interest in and excel in their academics.
37 Disrupt. Innovate.

Success Story in Education
Iqran Rasheed:Aiming to become a documentary filmmaker, Iqran Rasheed, studies at the Communication Studies & Design programme at Habib University. Coming from an underprivileged background and having studied at the TCF schools, Iqran never imagined attending Pakistan’s first liberal arts and Science University. The scholarship allowed him to attend the first-class institution and helped him shape his future. Apart from keeping a remarkable academic standing of 3.5 CGPA he also got a chance to explore his hidden talents.
During his first year he founded the student club Kawish and served as its President. Kawish aims to help students from underprivileged areas with their education by teaching them Mathematics and English. Through his hard work and dedication, he made it to the Dean’s list. He served as a student senator for CSD 2019 in student government for a year. Also being a member of Habib University’s Choir, he got a chance to learn music from Rajab Ali Khan and polish his skills as a singer.
Moreover, he received an award for the best short story in Arzu Anthology and performed his piece at the Karachi Literature Festival 2018. This was his first ever short story and published piece of work, which would not have been possible without the help of his teachers at Habib University and the support received from TPL Corp.
Mehreen Khan:Mehreen Khan, a Social Development and Policy student of the class of 2019 is a determined and ambitious student. She has worked her way towards a higher education and is grateful for the support she received along the way. Having been educated on a scholarship at a TCF school in Baldia Town, she feels responsible to make a change for the future generations.
As a result of the scholarship provided by TPL Corp at Habib University, Mehreen has been able to pursue her dream to receive a higher education. In her words, “Habib University is a diverse place with students representing all social classes and educational backgrounds from across the country. With this diversity, HU has built a strong community and together with the unique academic programme of the Liberal Core, I feel I am learning more than I dreamed of. By studying in the SDP program I have learnt to understand myself and respect the society and cultures around me. Through my higher education, I have been able to intern with The Tribune and have had 2 stories published. In future, I wish to join the UN so that I can connect my experiences with local development needs, especially for girls’ education.”
Noman Saleem:When Noman was asked, what he aims to be in the future he uttered, “a man who helps orphans gain an education”. Nine years old, Noman, was abandoned by his father, who was a drug addict. With the funds from TPL Corp to Fazilia Trust, he is not only attaining formal education, but also a shelter to live a secure life. He achieved an overall grade of 75% in his last semester and aims to graduate first in his class in his final semester.
38

Stakeholder’s Information


HORIZONTAL ANALYSIS BALANCE SHEET
41 Disrupt. Innovate.
Rup
ees
Var
ianc
e %
R
upee
s V
aria
nce
%
Rup
ees
Var
ianc
e %
R
upee
s V
aria
nce
%
Rup
ees
Var
ianc
e %
R
upee
s V
aria
nce
%
20
182
017
20
162
015
20
142
013
-
Fi
xed
Asse
ts
2,2
14,0
71,5
87
23%
1,
799,
520,
629
38
% 1,
305,
464,
831
-1%
1,32
1,226
,709
96
% 67
5,35
4,82
0 35
% 49
9,09
8,93
0 9%
Inta
ngib
le A
sset
s 2
,627
,633
,102
50
%
1,74
9,48
1,140
15
% 1,
520,
261,0
40
5%
1,45
1,210
,613
-1
8%
1,77
2,43
6,94
5
-1%
1,782
,735
,967
0%
Inve
stm
ent P
rope
rty
5,3
22,6
78,2
73
22%
4
,348
,453
,273
6%
4
,090
,415
,737
6%
3
,846
,097
,684
10
0%
-
0%
-
0%De
velo
pmen
t pro
pert
y 1,
090,
147,
420
23
%
888
,738
,740
10
0%
-
0%
-
0%
-
0%
-
0%Lo
ng-t
erm
inve
stm
ents
-
-1
00%
5
36,2
85,3
30
6%
506
,417
,217
4%
4
87,17
6,15
0
-51%
7
7317
5902
6%
72
6,93
8,70
0 2%
Long
term
loan
s 4
36,5
77
-47%
8
26,5
38
92%
430
,466
-2
5%
573
,844
-1
00%
126,
945,
250
10
152%
1,2
38,2
44
-56%
Long
term
dep
osits
6
9,91
7,93
2
54%
4
5,51
8,14
7
26%
36,
207,
905
18
% 3
0,71
4,38
4
20%
25,
585,
297
46
% 17
,541
,876
13
%De
ferr
ed ta
x
113,
639,
834
36
%
83,
451,9
67
17%
71,4
58,8
24
2%
70,
288,
697
10
0%
-
0%
-
0%In
tres
t Acc
rud
-
0%
-
0%
-
0%
-
-1
00%
12,4
48,3
94
6%
11,71
0,15
1 2%
Due
from
rela
ted
part
ies
-
0%
-
0%
-
0%
-
-100
% 8
,961
,944
13
3%
3,85
0,14
2 22
6%St
ock-
in-t
rade
3
26,6
91,7
67
-9%
3
57,2
16,9
27
21%
294
,125,
367
16
% 2
53,4
13,7
77
7%
236
,915
,721
74
% 13
5,84
6,31
6 10
5%Tr
ade
debt
s
1,41
2,18
7,46
9
10%
1,
280,
586,
976
18
% 1,
086,
022,
757
24
% 8
73,15
9,70
3
32%
663
,276
,164
35
% 49
1,316
,839
11%
Shor
t-te
rm in
vest
men
ts
1,38
7,68
1,407
34
2%
314
,120,
415
117
% 14
4,57
2,24
3
-7%
155,
081,1
66
6677
% 2
,288
,362
6%
2,
158,
872
3%Lo
an a
nd a
dvan
ces
147,
837,
318
41
0%
28,
989,
687
-1
2%
33,
126,
089
-5
3%
70,
421,5
89
244%
2
0,44
6,10
2
-81%
10
7,68
7,58
4 -7
%Tr
ade
depo
sits
and
prep
aym
ents
3
52,5
58,8
25
142%
14
5,39
1,626
26
0%
40,
430,
992
-4
4%
72,
083,
588
9%
6
6,112
,179
8%
61
,248
,493
27
9%Ac
crue
d m
ark-
up
23,
913,
319
21
2%
7,6
58,6
94
-2%
7,8
22,17
8
-84%
4
7,77
5,30
9
6%
44,
949,
403
6%
42
,404
,646
29
%O
ther
rece
ivabl
es
684
,474
,624
34
19%
19
,448
,697
13
8%
8,18
3,39
3
50%
5,4
55,13
2
-82%
3
0,115
,393
14
% 26
,375
,355
-2
6%Du
e fr
om re
late
d pa
rtie
s
11,7
06,5
48
28%
9
,132,
004
-6
7%
27,
695,
462
-4
% 2
8,74
7,65
7
55%
18,5
34,0
57
-24%
24
,527
,597
-7
7%Pr
emiu
m d
ue b
ut u
npai
d -
-1
00%
6
1,284
,561
10
0%
-
0%
-
-100
% 12
5,63
9,67
9 117
% 57
,886
,915
2%
Defe
rred
com
misi
on e
xpen
se
124,
090,
599
10
0%
0%
0%
-1
00%
84,
337,
023
114
% 39
,396
,454
7%
Taxa
tion-
net
16
1,761
,130
-1
1%
181,4
97,17
1 65
% 11
0,111
,218
64
% 6
7,32
2,91
0
100%
-100
% 6,
376,
877
100%
Cash
and
ban
k bal
ance
s 9
52,4
49,7
88
94%
4
90,10
4,43
1 -4
7%
927
,774
,474
25
5%
261
,706
,141
130%
11
3,61
1,956
110
% 54
,169,
443
121%
TOTA
L A
SSET
S 17
,023
,877
,519
12,3
47,7
06,9
53
10
,210
,520
,193
9,04
2,45
5,05
3
4,
801,1
32,5
91
4,
092,
509,
401
Issue
d, s
ubsc
ribed
and
pai
d-up
cap
ital
2,3
72,9
77,6
30
9%
2,17
2,48
9,63
0
0%
2,17
2,48
9,63
0
0%
2,17
2,48
9,63
0
0%
2,17
2,48
9,63
0
0%
2,17
2,48
9,63
0 16
%Ca
pita
l Res
erve
6
0,85
5,76
2
100%
-
0%
-
0%
-
0%
-
0%
-
0%Re
venu
e Re
serv
e 5
65,18
0,31
5
3%
548
,301
,049
3%
5
33,8
16,9
97
-41%
9
01,17
6,24
0
147%
3
64,7
46,3
29
46%
249,
664,
399
33%
Surp
lus
on re
valu
atio
n of
Fixe
d As
sets
2
28,0
61,0
64
0%
228
,790
,596
10
0%
-
0%
-
0%
-
0%
-
0%No
n-Co
ntro
lling
Intr
est
4,2
20,9
02,7
95
6%
3,9
78,0
88,0
25
58%
2,5
25,4
20,5
72
213%
8
06,5
60,2
05
337%
18
4,73
3,97
4
11%
166,
845,
875
10%
Long
term
loan
3
08,13
3,42
0
6%
290
,277
,330
47
3%
50,
653,
413
-5
8%
121,6
66,6
72
100%
-
-100
% 16
,666
,668
-6
7%Lo
ng te
rm fi
nanc
ing
3,2
87,12
7,28
0
30%
2,5
23,5
42,5
14
-8%
2,7
46,8
66,8
09
15%
2,3
80,3
24,8
31
751%
2
79,8
29,5
29
100%
-
0%De
ferr
ed lia
bilit
ies
6,2
06,4
90
-47%
11
,729
,338
9%
10
,738
,080
-3
3%
16,13
7,60
1 -1
6%
19,2
37,0
82
-40%
32
,003
,184
56%
Due
to re
late
d Pa
rtie
s -
0%
-
-100
% 3
2,33
8,17
8
-92%
38
3,45
1,093
10
0%
-
0%
-
0%Pr
ovisi
on fo
r out
stan
ding
cla
ims
-
0%
-
0%
-
0%
-
-1
00%
140,
519,
886
10
3%
69,14
0,41
5 15
%Pr
ovisi
on fo
r une
arne
d pr
emiu
m
-
0%
-
0%
-
0%
-
-1
00%
550
,055
,724
43
% 38
4,10
4,14
7 12
%Ac
crue
d m
ark-
up
-
-100
% 4
,326
,432
-2
3%
5,6
12,5
55
-96%
13
5,21
9,10
2 10
0%
-
0%
-
0%Li
abilit
ies
agai
nst a
sset
s su
bjec
t
to fi
nanc
e le
ase
504
,016
-9
5%
10,9
75,9
35
-64%
3
0,21
7,50
6
-51%
61
,959
,628
25
1%
17,6
52,0
09
318%
4,
223,
100
-27%
Trad
e an
d ot
her p
ayab
les
1,43
1,299
,859
89
% 7
57,9
16,7
47
26%
620
,806
,027
-2
8%
859,
374,
125
90%
451
,579
,115
27
% 35
4,86
3,99
0 28
%Ac
crue
d m
ark-
up
131,6
03,0
69
25%
105,
627,
379
-4
1%
178,
348,
148
19
% 15
0,48
9,12
6 50
8%
24,
738,
934
3%
23
,953
,034
9%
Runn
ing
finan
ce u
nder
mar
k-up
a
rran
gem
ents
9
39,8
71,8
44
7%
876,
719,
637
10
8%
420,
965,
430
52
% 27
6,89
0,45
9 -3
3%
412
,519
,367
-1
3%
471,5
37,5
74
31%
Shor
t-te
rm fi
nanc
ing
419
,181,2
04
574%
6
2,23
8,72
2
-73%
2
34,19
9,47
6
208%
75
,920
,456
10
0%
-
-1
00%
35,0
00,0
00
-19%
Due
to re
late
d pa
rtie
s 5
04,9
88,18
2
474%
8
7,94
9,75
6
-4%
91,4
53,6
70
-63%
24
5,19
6,50
4 10
0%
-
0%
-
0%Li
abilit
ies
agai
nst i
nsur
ance
con
trac
ts
453
,328
,693
17
17%
24,9
50,9
23
0%
-
0%
-
0%
-
0%
-
-100
%Un
derw
ritin
g pr
ovisi
ons
824
,732
,832
10
0%
-
0%
-
0%
-
0%
-
0%
-
0%
Uncla
imed
divi
dend
1,
747,
962
62
% 1,
078,
801
100%
-
0%
-
0%
-
0%
-
0%
Unpa
id d
ivide
nd
3,0
00,0
00
0%
3,0
00,0
00
100%
-
0%
-
0%
-
0%
-
0%
Taxa
tion
- ne
t -
0%
-
0%
-
0%
-
-1
00%
22,
182,
529
0%
-
-100
%Cu
rren
t por
tion
of n
on-c
urre
nt lia
biliti
es
1,22
6,35
0,99
7
149%
4
92,14
2,69
1 9%
4
51,3
12,0
32
17%
384,
527,
132
193%
13
1,157
,303
112
% 61
,778
,654
12
%Ad
vanc
e m
onito
ring
fees
3
7,82
4,10
5
-77%
16
7,56
1,448
59
% 10
5,28
1,670
48
% 71
,072
,249
13
9%
29,
691,1
80
-41%
50
,238
,731
-6
6% TO
TAL
EQU
ITY
AND
LIA
BILI
TIES
17
,023
,877
,519
12,3
47,7
06,9
53
10
,210
,520
,193
9,04
2,45
5,05
3
4
,801
,132,
591
4
,092
,509
,401

HORIZONTAL ANALYSIS PROFIT AND LOSS ACCOUNT
42
Rup
ees
Var
ianc
e %
R
upee
s V
aria
nce
%
Rup
ees
Var
ianc
e %
R
upee
s V
aria
nce
%
Rup
ees
Var
ianc
e %
R
upee
s V
aria
nce
%
20
182
017
20
162
015
20
142
013
Turn
over
- n
et
3,4
71,4
16,10
4
60%
2,16
8,43
3,36
3 6%
2
,037
,361
,029
-6
% 2
,178,
542,
463
5%
2
,084
,621
,786
28
% 1,
625,
548,
583
21
%
Cost
of s
ales
(1
,960
,688
,714
) 68
% (1
,168,
704,
303)
26
% (9
29,3
32,9
14)
-29%
(1
,301
,779
,283
) 6%
(1
,233
,826
,819
) 28
% (9
60,2
11,17
3)
28%
Gro
ss p
rofit
1,
510,
727,
390
51
%
999
,729
,060
-1
0%
1,10
8,02
8,11
5
26%
8
76,7
63,18
0
3%
850
,794
,967
28
%
665
,337
,410
12
%
Dist
ribut
ion
expe
nses
(2
82,6
07,9
65)
32%
(214
,246
,828
) -4
% (2
22,15
3,24
4)
-2%
(226
,821
,445
) -6
% (2
40,0
48,8
57)
41%
(170
,712
,754
) 65
%
Adm
inist
rativ
e ex
pens
es
(1,0
09,13
9,95
7)
101%
(5
01,5
05,19
8)
27%
(393
,626
,600
) -1
2%
(448
,491
,211)
1%
(4
43,3
40,0
79)
16%
(381
,167,
295)
17
%
Oth
er o
pera
ting
expe
nses
(9
7,31
1,519
) 70
57%
(1,3
59,6
59)
-98%
(6
9,97
4,08
3)
-12%
(7
9,26
6,31
9)
1638
% (4
,561
,401
) 28
% (3
,570
,866
) -5
2%
Ope
ratin
g pr
ofit
121,6
67,9
49
-57%
2
82,6
17,3
75
-33%
4
22,2
74,18
8
246%
12
2,18
4,20
5
-25%
16
2,84
4,63
0
48%
10
9,88
6,49
5
-31%
Fina
nce
cost
s (5
07,5
68,0
32)
52%
(334
,819
,965
) -9
% (3
69,7
31,3
56)
18%
(312
,566
,150)
27
8%
(82,
788,
331)
6%
(78,
436,
944)
-1
6%
Oth
er In
com
e 1,
141,4
82,0
96
228%
3
48,3
74,2
35
43%
235
,642
,452
-6
5%
679
,838
,853
80
7%
74,
922,
124
13
% 6
6,25
6,46
3
-24%
Shar
e of
pro
fit fr
om
in
vest
men
t in
asso
ciate
s -
net
(13,
147,
234)
-1
78%
16,9
62,3
59
100%
8,
732,
144
-118
% (4
8,59
1,465
) -1
19%
46,
104,
498
10
0%
20,2
67,6
33
0%
Prof
it be
fore
taxa
tion
742
,434
,780
13
7%
313
,134,
004
5%
2
96,9
17,4
28
-33%
4
40,8
65,4
43
6%
201
,082
,921
70
%
117,
973,
647
-2
3%
Taxa
tion
(72,
229,
151)
61%
(44,
853,
506)
-3
1%
(65,
288,
456)
-6
89%
11,0
84,8
39
-116
% (6
8,24
2,38
3)
110%
(32,
543,
734)
-5
1%
Prof
it / (
Loss
) aft
er ta
xatio
n 6
70,2
05,6
29
150%
2
68,2
80,4
98
16%
2
31,6
28,9
72
-49%
4
51,9
50,2
82
30%
13
2,84
0,53
8
55%
8
5,42
9,91
3
-1%
Oth
er co
mpr
ehen
sive
inco
me
(12,
325,
742)
-1
05%
22
9,08
8,48
9 0%
-
-1
00%
4
49,7
06
247%
12
9,49
1 11
9%
59,
249
-1
02%
Tota
l com
preh
ensiv
e in
com
e 6
57,8
79,8
86
32%
49
7,36
8,98
7 16
%
231
,628
,972
-4
9%
452
,399
,988
30
%
132,
970,
029
56
%
85,
489,
162
3%
VERTICAL ANALYSIS OF BALANCE SHEET
43 Disrupt. Innovate.
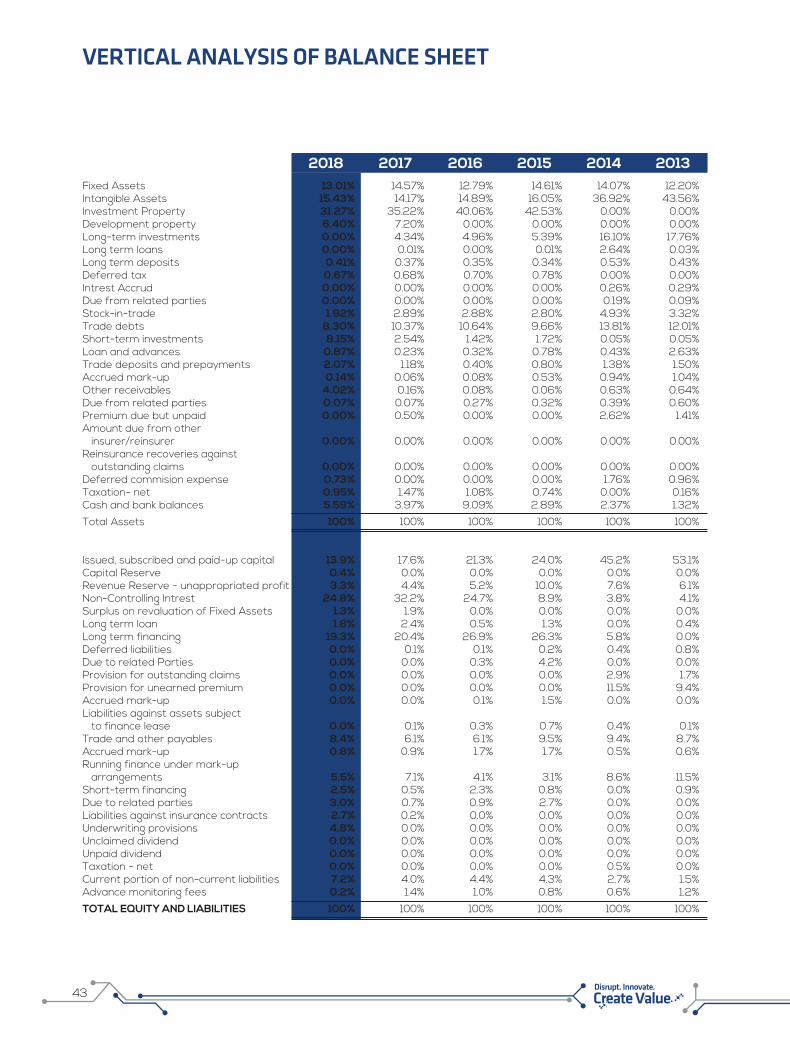
2017 2016 2015 2014 20132018Fixed Assets 13.01% 14.57% 12.79% 14.61% 14.07% 12.20%Intangible Assets 15.43% 14.17% 14.89% 16.05% 36.92% 43.56%Investment Property 31.27% 35.22% 40.06% 42.53% 0.00% 0.00%Development property 6.40% 7.20% 0.00% 0.00% 0.00% 0.00%Long-term investments 0.00% 4.34% 4.96% 5.39% 16.10% 17.76%Long term loans 0.00% 0.01% 0.00% 0.01% 2.64% 0.03%Long term deposits 0.41% 0.37% 0.35% 0.34% 0.53% 0.43%Deferred tax 0.67% 0.68% 0.70% 0.78% 0.00% 0.00%Intrest Accrud 0.00% 0.00% 0.00% 0.00% 0.26% 0.29%Due from related parties 0.00% 0.00% 0.00% 0.00% 0.19% 0.09%Stock-in-trade 1.92% 2.89% 2.88% 2.80% 4.93% 3.32%Trade debts 8.30% 10.37% 10.64% 9.66% 13.81% 12.01%Short-term investments 8.15% 2.54% 1.42% 1.72% 0.05% 0.05%Loan and advances 0.87% 0.23% 0.32% 0.78% 0.43% 2.63%Trade deposits and prepayments 2.07% 1.18% 0.40% 0.80% 1.38% 1.50%Accrued mark-up 0.14% 0.06% 0.08% 0.53% 0.94% 1.04%Other receivables 4.02% 0.16% 0.08% 0.06% 0.63% 0.64%Due from related parties 0.07% 0.07% 0.27% 0.32% 0.39% 0.60%Premium due but unpaid 0.00% 0.50% 0.00% 0.00% 2.62% 1.41%Amount due from other insurer/reinsurer 0.00% 0.00% 0.00% 0.00% 0.00% 0.00%Reinsurance recoveries against outstanding claims 0.00% 0.00% 0.00% 0.00% 0.00% 0.00%Deferred commision expense 0.73% 0.00% 0.00% 0.00% 1.76% 0.96%Taxation- net 0.95% 1.47% 1.08% 0.74% 0.00% 0.16%Cash and bank balances 5.59% 3.97% 9.09% 2.89% 2.37% 1.32%
Total Assets 100% 100% 100% 100% 100% 100% Issued, subscribed and paid-up capital 13.9% 17.6% 21.3% 24.0% 45.2% 53.1%Capital Reserve 0.4% 0.0% 0.0% 0.0% 0.0% 0.0%Revenue Reserve - unappropriated profit 3.3% 4.4% 5.2% 10.0% 7.6% 6.1%Non-Controlling Intrest 24.8% 32.2% 24.7% 8.9% 3.8% 4.1%Surplus on revaluation of Fixed Assets 1.3% 1.9% 0.0% 0.0% 0.0% 0.0%Long term loan 1.8% 2.4% 0.5% 1.3% 0.0% 0.4%Long term financing 19.3% 20.4% 26.9% 26.3% 5.8% 0.0%Deferred liabilities 0.0% 0.1% 0.1% 0.2% 0.4% 0.8%Due to related Parties 0.0% 0.0% 0.3% 4.2% 0.0% 0.0%Provision for outstanding claims 0.0% 0.0% 0.0% 0.0% 2.9% 1.7%Provision for unearned premium 0.0% 0.0% 0.0% 0.0% 11.5% 9.4%Accrued mark-up 0.0% 0.0% 0.1% 1.5% 0.0% 0.0%Liabilities against assets subject to finance lease 0.0% 0.1% 0.3% 0.7% 0.4% 0.1%Trade and other payables 8.4% 6.1% 6.1% 9.5% 9.4% 8.7%Accrued mark-up 0.8% 0.9% 1.7% 1.7% 0.5% 0.6%Running finance under mark-up arrangements 5.5% 7.1% 4.1% 3.1% 8.6% 11.5%Short-term financing 2.5% 0.5% 2.3% 0.8% 0.0% 0.9%Due to related parties 3.0% 0.7% 0.9% 2.7% 0.0% 0.0%Liabilities against insurance contracts 2.7% 0.2% 0.0% 0.0% 0.0% 0.0%Underwriting provisions 4.8% 0.0% 0.0% 0.0% 0.0% 0.0%Unclaimed dividend 0.0% 0.0% 0.0% 0.0% 0.0% 0.0%Unpaid dividend 0.0% 0.0% 0.0% 0.0% 0.0% 0.0%Taxation - net 0.0% 0.0% 0.0% 0.0% 0.5% 0.0%Current portion of non-current liabilities 7.2% 4.0% 4.4% 4.3% 2.7% 1.5%Advance monitoring fees 0.2% 1.4% 1.0% 0.8% 0.6% 1.2%
TOTAL EQUITY AND LIABILITIES 100% 100% 100% 100% 100% 100%

VERTICAL ANALYSIS OF PROFIT AND LOSS ACCOUNT
44
2017 2016 2015 2014 20132018Turnover - net 100% 100% 100% 100% 100% 100%
Cost of sales -56% -54% -46% -60% -59% -59%
Gross profit 44% 46% 54% 40% 41% 41%
Distribution expenses -8% -10% -11% -10% -12% -11%
Administrative expenses -29% -23% -19% -21% -21% -23%
Other operating expenses -3% 0% -3% -4% 0% 0%
Operating profit 4% 13% 21% 6% 8% 7%
Finance costs -15% -15% -18% -14% -4% -5%
Other Income 33% 16% 12% 31% 4% 4%
Share of profit from investment in associates - net -0.4% 1% 0% -2% 2% 1%
Exchange loss - net 0% 0% 0% 0% 0% 0%
Profit before taxation 21% 14% 15% 20% 10% 7%
Taxation -2% -2% -3% 1% -3% -2%
Profit after taxation 19% 12% 11% 21% 6% 5%
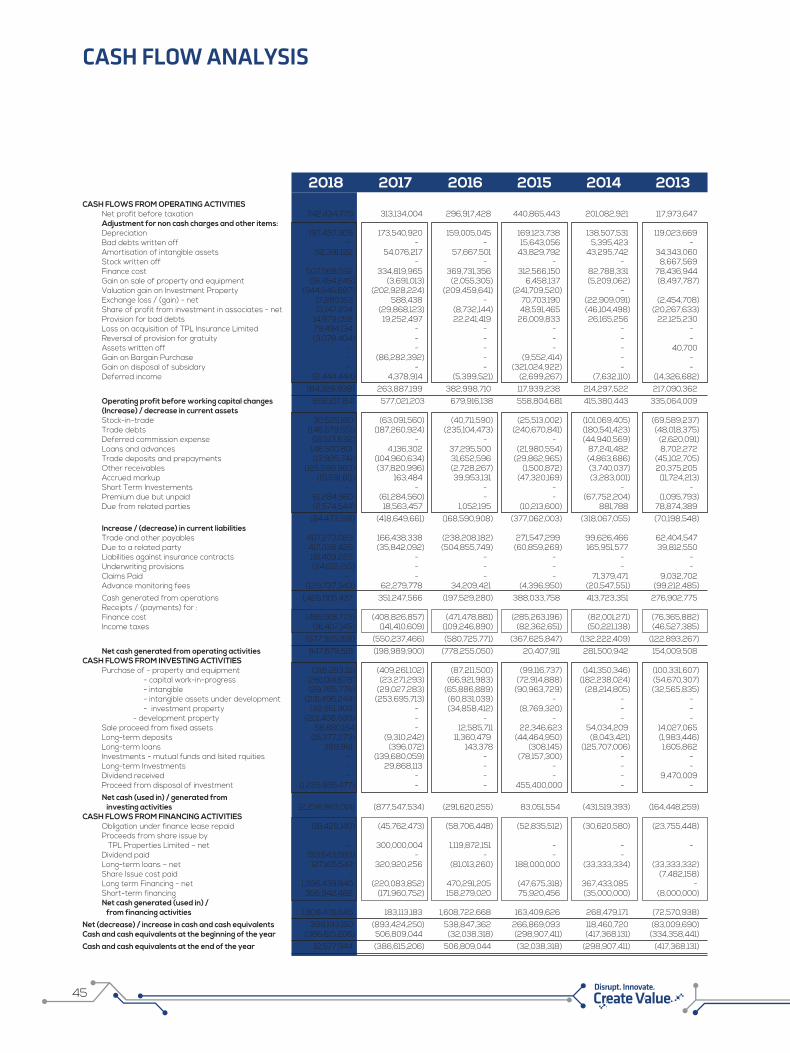
CASH FLOW ANALYSIS
45 Disrupt. Innovate.
2017 2016 2015 2014 20132018CASH FLOWS FROM OPERATING ACTIVITIES Net profit before taxation 742,434,779 313,134,004 296,917,428 440,865,443 201,082,921 117,973,647 Adjustment for non cash charges and other items: Depreciation 197,437,309 173,540,920 159,005,045 169,123,738 138,507,531 119,023,669 Bad debts written off - - - 15,643,056 5,395,423 - Amortisation of intangible assets 52,391,122 54,076,217 57,667,501 43,829,792 43,295,742 34,343,060 Stock written off - - - - - 8,667,569 Finance cost 507,568,032 334,819,965 369,731,356 312,566,150 82,788,331 78,436,944 Gain on sale of property and equipment (16,454,245) (3,691,013) (2,055,305) 6,458,137 (5,209,062) (8,497,787) Valuation gain on Investment Property (944,646,887) (202,928,224) (209,459,641) (241,709,520) - Exchange loss / (gain) - net 17,280,153 588,438 - 70,703,190 (22,909,091) (2,454,708) Share of profit from investment in associates - net 13,147,234 (29,868,123) (8,732,144) 48,591,465 (46,104,498) (20,267,633) Provision for bad debts 14,979,058 19,252,497 22,241,419 26,009,833 26,165,256 22,125,230 Loss on acquisition of TPL Insurance Limited 79,494,134 - - - - - Reversal of provision for gratuity (3,078,404) - - - - - Assets written off - - - - - 40,700 Gain on Bargain Purchase - (86,282,392) - (9,552,414) - - Gain on disposal of subsidary - - - (321,024,922) - - Deferred income (2,444,444) 4,378,914 (5,399,521) (2,699,267) (7,632,110) (14,326,682) (84,326,938) 263,887,199 382,998,710 117,939,238 214,297,522 217,090,362 Operating profit before working capital changes 658,107,841 577,021,203 679,916,138 558,804,681 415,380,443 335,064,009 (Increase) / decrease in current assets Stock-in-trade 30,525,160 (63,091,560) (40,711,590) (25,513,002) (101,069,405) (69,589,237) Trade debts (146,579,551) (187,260,924) (235,104,473) (240,670,841) (180,541,423) (48,018,375) Deferred commission expense (18,513,632) - - - (44,940,569) (2,620,091) Loans and advances 146,500,801 4,136,302 37,295,500 (21,980,554) 87,241,482 8,702,272 Trade deposits and prepayments (13,925,741) (104,960,634) 31,652,596 (29,862,965) (4,863,686) (45,102,705) Other receivables (125,598,960) (37,820,996) (2,728,267) (1,500,872) (3,740,037) 20,375,205 Accrued markup (15,591,611) 163,484 39,953,131 (47,320,169) (3,283,001) (11,724,213) Short Term Investements - - - - - - Premium due but unpaid 61,284,560 (61,284,560) - - (67,752,204) (1,095,793) Due from related parties (2,574,544) 18,563,457 1,052,195 (10,213,600) 881,788 78,874,389 (84,473,518) (418,649,661) (168,590,908) (377,062,003) (318,067,055) (70,198,548) Increase / (decrease) in current liabilities Trade and other payables 407,273,023 166,438,338 (238,208,182) 271,547,299 99,626,466 62,404,547 Due to a related party 417,038,426 (35,842,092) (504,855,749) (60,859,269) 165,951,577 39,812,550 Liabilities against insurance contracts 181,409,223 - - - - - Underwriting provisions (24,612,215) - - - - - Claims Paid - - - - 71,379,471 9,032,702 Advance monitoring fees (129,737,343) 62,279,778 34,209,421 (4,396,950) (20,547,551) (99,212,485) Cash generated from operations 1,425,005,437 351,247,566 (197,529,280) 388,033,758 413,723,351 276,902,775 Receipts / (payments) for : Finance cost (485,918,773) (408,826,857) (471,478,881) (285,263,196) (82,001,271) (76,365,882) Income taxes (91,407,145) (141,410,609) (109,246,890) (82,362,651) (50,221,138) (46,527,385) (577,325,918) (550,237,466) (580,725,771) (367,625,847) (132,222,409) (122,893,267) Net cash generated from operating activities 847,679,519 (198,989,900) (778,255,050) 20,407,911 281,500,942 154,009,508 CASH FLOWS FROM INVESTING ACTIVITIES Purchase of - property and equipment (318,283,111) (409,261,102) (87,211,500) (99,116,737) (141,350,346) (100,331,607) - capital work-in-progress (261,014,678) (23,271,293) (66,921,983) (72,914,888) (182,238,024) (54,670,307) - intangible (29,765,776) (29,027,283) (65,886,889) (90,963,729) (28,214,805) (32,565,835) - intangible assets under development (231,496,244) (253,695,713) (60,831,039) - - - - investment property (32,951,900) - (34,858,412) (8,769,320) - - - development property (201,408,680) - - - - - Sale proceed from fixed assets 58,880,164 - 12,585,711 22,346,623 54,034,209 14,027,065 Long-term deposits (15,377,273) (9,310,242) 11,360,479 (44,464,950) (8,043,421) (1,983,446) Long-term loans 389,961 (396,072) 143,378 (308,145) (125,707,006) 1,605,862 Investments - mutual funds and lsited rquities - (139,680,059) - (78,157,300) - - Long-term Investments - 29,868,113 - - - - Dividend received - - - - - 9,470,009 Proceed from disposal of investment (1,225,935,477) - - 455,400,000 - - Net cash (used in) / generated from investing activities (2,256,963,014) (877,547,534) (291,620,255) 83,051,554 (431,519,393) (164,448,259)CASH FLOWS FROM FINANCING ACTIVITIES Obligation under finance lease repaid (18,428,140) (45,762,473) (58,706,448) (52,835,512) (30,620,580) (23,755,448) Proceeds from share issue by TPL Properties Limited – net - 300,000,004 1,119,872,151 - - - Dividend paid (53,643,080) - - - - Long-term loans – net 127,165,543 320,920,256 (81,013,260) 188,000,000 (33,333,334) (33,333,332) Share Issue cost paid - (7,482,158) Long term Financing - net 1,396,439,840 (220,083,852) 470,291,205 (47,675,318) 367,433,085 - Short-term financing 356,942,482 (171,960,752) 158,279,020 75,920,456 (35,000,000) (8,000,000) Net cash generated (used in) / from financing activities 1,808,476,645 183,113,183 1,608,722,668 163,409,626 268,479,171 (72,570,938)Net (decrease) / increase in cash and cash equivalents 399,193,150 (893,424,250) 538,847,362 266,869,093 118,460,720 (83,009,690)Cash and cash equivalents at the beginning of the year (386,615,206) 506,809,044 (32,038,318) (298,907,411) (417,368,131) (334,358,441)Cash and cash equivalents at the end of the year 12,577,944 (386,615,206) 506,809,044 (32,038,318) (298,907,411) (417,368,131)

RATIO ANALYSIS
46
2017 2016 2015 2014 20132018Profitability Ratios
Gross Profit to Sales percent 44% 46% 54% 40% 41% 41%Net Profit to Sales percent 19% 12% 11% 21% 6% 5%EBITDA Margin to sales percent 43% 40% 43% 44% 22% 22%Return on Equity percent 9% 4% 4% 12% 5% 3%Return on Capital Employed percent 6% 3% 3% 6% 4% 3% Liquidity Ratios
Current Ratio Ratio 0.93 1.12 1.27 0.89 1.31 1.05Quick / Acid test ratio Ratio 0.88 0.98 1.13 0.77 1.09 0.92Cash to Current Liabilities Ratio 0.16 0.19 0.44 0.13 0.11 0.05Cashflow from Operations to sales Ratio 0.24 -0.10 -0.38 0.01 0.14 0.09 Activity/ Turnover Ratios
Inventory turnover Number of times 6 4 3 5 7 10No of days in inventory (Days) Number of days 64 102 108 69 55 38Debtor turnover Number of times 3 2 2 3 4 3No of days in Receivables (Days) Number of days 140 197 175 129 101 105Credit turnover Number of times 2 2 1 2 3 3No of days in Payables Number of days 206 219 291 184 119 120Operating cycle Number of days -2 79 -8 14 37 23Total asset turnover percent 20% 18% 20% 24% 43% 40%Fixed assets turnover percent 157% 121% 156% 165% 309% 326% Investment Valuation Ratios
Earning per Share Ratio 0.07 0.09 0.29 1.54 1.52 0.32 Capital structure Ratios
Financial leverage Ratio Ratio 0.92 0.64 0.80 0.95 0.32 0.24Debt Equity Ratio Ratio 0.48 0.41 0.55 0.80 0.37 0.20Interest cover Ratio Ratio 2.46 1.94 1.80 2.41 3.43 2.50

GRAPHICAL PRESENTATION OF KEY FINANCIAL RATIOS
47 Disrupt. Innovate.
Total Equity
8000
6000
4000
2000
02012
20132014 2015 2016 2017 2018
Milli
ons
Gross Profit
60%
50%
40%
30%
20%
10%
0%2012 2013 2014 2015 2016 2017 2018
Capital Employed vs Return
1600140012001000800600400200
0
Milli
ons
2012Gross profit Operating profit Profit / (Loss) after taxation
2013 2014 2015 2016 2017 2018
Net Profit
25%
20%
15%
10%
5%
0%2012 2013 2014 2015 2016 2017 2018
EBITDA Margin
50%
40%
30%
20%
10%
0%2012 2013 2014 2015 2016 2017 2018
Return on Total Assets
6%
5%
4%
3%
2%
1%
0%2012 2013 2014 2015 2016 2017 2018
Capital Employed vs Return
12000
10000
8000
6000
4000
2000
0
7%
6%
5%
4%
3%
2%
1%
0%2012 2013 2014 2015 2016 2017 2018
Milli
ons
Revenue vs Gross Profit
4000
3000
2000
1000
0
6%
5%
4%
3%
2%
1%
0%2012 2013 2014 2015 2016 2017 2018
Milli
ons

48
STATEMENT OF VALUE ADDITION AND ITS DISTRIBUTION
2018Amount in Rs.
% 2017Amount in Rs.
%
WEALTH GENERATED Total revenue inclusive of sales tax other income 5,047,811,221 2,813,971,462 Cost of Sales and services (2,109,885,336) (1,050,311,448) 2,937,925,885 100% 1,763,660,014 100% WEALTH DISTRIBUTION To Employees Salaries, benefits and other costs 973,206,805 33% 599,499,492 34% To Government Income tax, sales tax, excise duty and others 520,289,406 18% 325,055,011 18% To Society Donation towards education, health and environment 19,624,091 1% 15,063,000 1% To Provider of Capital Dividend to shareholders 54,312,241 2% 25,574,673 1%Markup / Interest expenses on borrowed funds 504,771,525 17% 330,027,621 19% To Company Depreciation, amortization & retained profit 865,721,817 29% 468,440,217 27% 2,937,925,885 100% 1,763,660,014 100%
Wealth Distribution 2018
To Employees
To Government
To Society
To Providerof Capital
To Company
33%
18%1%
19%
29%
Wealth Distribution 2017
To Employees
To Government
To Society
To Providerof Capital
To Company
34%
18%1%
20%
27%

DIRECTORS’ REPORT
49 Disrupt. Innovate.
On behalf of the Board of Directors of TPL Corp Limited, I am pleased to present the annual financial statements with the performance review of the Company for the year ended June 30th, 2018.
1. ECONOMIC OUTLOOKAccording to the Economic Survey of Pakistan, GDP growth was 5.28% during FY 2017-18 and the country’s GDP crossed the $305 billion mark. The inflation rate in FY 2017-18 clocked in at around 4.1% and the interest rate was being maintained at 5.75% during the first three quarters but has shown an upward trend since March 2018 and increased to 6.5% in June 2018. The Pakistan Stock Exchange has shown a bearish trend during 2017-18 as compared to 2016-17. This decline was mainly because of uncertainty prevailing in the market due to depreciation in PKR vs USD and the general elections. However, subsequent to year end and after the general elections, PSX is showing a positive trend.
During FY 2017-18 sales of cars increased by 16.8%. This, combined with brighter prospects of CPEC and a successful political transition is expected to boost investors’ confidence in the economy.
2. FINANCIAL HIGHLIGHTS
Profitability and Growth – Consolidated
The group performed well during the period under review; consolidated revenue stood at Rs. 3,471 million (Rs. 5,007 million including Takaful business of TPL Insurance Limited), with a growth of 60.1% over the corresponding period of last year. Profit before tax was reported at Rs. 742 million as compared to Rs. 313 million in the corresponding period. The Group reported earnings per share of Rs. 0.07 as compared to Rs. 0.09 in the corresponding period.
During the period under review two milestones were achieved. One was the acquisition of 69.1% shares of TPL Insurance Limited from Greenoaks Global Holdings Limited. Our post-acquisition shareholding in TPL Insurance Limited stands at 93.51%. Secondly, the Group successfully completed the scheme of arrangement whereby TPL Trakker Limited has been renamed as TPL Corp Limited and now acts as the Group investment holding company. Furthermore, two new wholly owned subsidiaries of TPL Corp Limited have been formed, namely, TPL Trakker Limited & TPL Maps (Private) Limited. These subsidiaries include the vehicle tracking and maps businesses respectively.
Revenue
Year Revenue Growth
2015
2016
2017
2018
2,178,542
2,037,361
2,168,433
3,471,416
5%
-6%
6%
60%
Rupees in thousands
Consolidated Revenue
4,000,000
3,000,000
2,000,000
1,000,000
0
‘Rup
ees
00
0’
2015 2016 2017 2018
Profit before Tax
3. GROUP PERFORMANCEA brief review of different businesses is as follows;
a. TPL Trakker Limited
The Tracking business achieved total revenues of Rs 1.660 billion demonstrating overall revenue growth of 10% over last year. We also experienced very strong growth of 55% in volumes for our container business mostly due to the EPZA project which commenced during the year. The increase in revenues of 10% was also a result of the acquisition of new customers, development of our franchise network across Pakistan and expansion of our service offerings.
Profit before tax was Rs 129.92 million with a very strong increase of 64% over last year. The increase in profit can be attributed to higher revenues as well as tight control over costs of sales and administrative costs.
Standalone Revenue:
Profit before Tax:
b. TPL Maps (Private) Limited
TPL Maps, which now stands as an independent entity of TPL Corp, was initiated in 2015 as a strategic business unit of TPL Trakker and over the last two years we have invested substantial resources and time in building Pakistan’s finest and most comprehensive Digital Mapping solution.
With 800,000+ downloads, TPL Maps is becoming the Map of choice for Pakistani businesses and consumers. Our strength derives from our accurate and large geocode database as well as our local language feature.
In the navigation space we have expanded our services via signing an OEM agreement with ISUZU and Honda apart from the existing arrangements with our flagship customer Indus Motor Company and Pak Suzuki. Our navigation footprint grew due to the development of our online and open market sales channels. With the high rate of growth in mobile internet users and new vehicle manufacturers entering the market, TPL Maps is in the ideal position to further strengthen its market position in the future.
TPL Maps successfully completed its first project in Kingdom of Saudi Arabia for maps technology deployment for the largest GIS Company in Saudi Arabia M/S Farsi Geo Tech.
TPL Maps also signed MoUs with US based INRIX, UK based mapping service WHAT3WORDS and Global Maps giant HERE Technologies, headquartered in Germany. These initiatives are expected to add substantial top line and bottom line growth in the future.
c. TPL Life Insurance Limited
TPL Life continued to build upon its core life and health insurance businesses. Gross Premium for the year ended June 30, 2018 has improved by almost 234% since last year while Corporate as well as the Retail business have shown considerable growth during the period as compared to last year.
The major initiatives taken during the period were as follows:
1. TPL Muavin (online agent training and management system. This is Pakistan’s first interactive portal for sales force)

50
On behalf of the Board of Directors of TPL Corp Limited, I am pleased to present the annual financial statements with the performance review of the Company for the year ended June 30th, 2018.
1. ECONOMIC OUTLOOKAccording to the Economic Survey of Pakistan, GDP growth was 5.28% during FY 2017-18 and the country’s GDP crossed the $305 billion mark. The inflation rate in FY 2017-18 clocked in at around 4.1% and the interest rate was being maintained at 5.75% during the first three quarters but has shown an upward trend since March 2018 and increased to 6.5% in June 2018. The Pakistan Stock Exchange has shown a bearish trend during 2017-18 as compared to 2016-17. This decline was mainly because of uncertainty prevailing in the market due to depreciation in PKR vs USD and the general elections. However, subsequent to year end and after the general elections, PSX is showing a positive trend.
During FY 2017-18 sales of cars increased by 16.8%. This, combined with brighter prospects of CPEC and a successful political transition is expected to boost investors’ confidence in the economy.
2. FINANCIAL HIGHLIGHTS
Profitability and Growth – Consolidated
The group performed well during the period under review; consolidated revenue stood at Rs. 3,471 million (Rs. 5,007 million including Takaful business of TPL Insurance Limited), with a growth of 60.1% over the corresponding period of last year. Profit before tax was reported at Rs. 742 million as compared to Rs. 313 million in the corresponding period. The Group reported earnings per share of Rs. 0.07 as compared to Rs. 0.09 in the corresponding period.
During the period under review two milestones were achieved. One was the acquisition of 69.1% shares of TPL Insurance Limited from Greenoaks Global Holdings Limited. Our post-acquisition shareholding in TPL Insurance Limited stands at 93.51%. Secondly, the Group successfully completed the scheme of arrangement whereby TPL Trakker Limited has been renamed as TPL Corp Limited and now acts as the Group investment holding company. Furthermore, two new wholly owned subsidiaries of TPL Corp Limited have been formed, namely, TPL Trakker Limited & TPL Maps (Private) Limited. These subsidiaries include the vehicle tracking and maps businesses respectively.
Revenue
Year PBT Growth
2013
2014
2015
2016
2017
2018
117,974
201,083
440,865
296,917
313,134
742,435
-23%
70%
119%
-33%
5%
137%
Rupees in thousands
Profit before Tax
3. GROUP PERFORMANCEA brief review of different businesses is as follows;
a. TPL Trakker Limited
The Tracking business achieved total revenues of Rs 1.660 billion demonstrating overall revenue growth of 10% over last year. We also experienced very strong growth of 55% in volumes for our container business mostly due to the EPZA project which commenced during the year. The increase in revenues of 10% was also a result of the acquisition of new customers, development of our franchise network across Pakistan and expansion of our service offerings.
Profit before tax was Rs 129.92 million with a very strong increase of 64% over last year. The increase in profit can be attributed to higher revenues as well as tight control over costs of sales and administrative costs.
Standalone Revenue:
Year Revenue Growth
2015
2016
2017
2018
1,457,620
1,537,181
1,506,282
1,660,647
4%
5%
-2%
10%
Rupees in thousands
Profit before Tax:
b. TPL Maps (Private) Limited
TPL Maps, which now stands as an independent entity of TPL Corp, was initiated in 2015 as a strategic business unit of TPL Trakker and over the last two years we have invested substantial resources and time in building Pakistan’s finest and most comprehensive Digital Mapping solution.
With 800,000+ downloads, TPL Maps is becoming the Map of choice for Pakistani businesses and consumers. Our strength derives from our accurate and large geocode database as well as our local language feature.
In the navigation space we have expanded our services via signing an OEM agreement with ISUZU and Honda apart from the existing arrangements with our flagship customer Indus Motor Company and Pak Suzuki. Our navigation footprint grew due to the development of our online and open market sales channels. With the high rate of growth in mobile internet users and new vehicle manufacturers entering the market, TPL Maps is in the ideal position to further strengthen its market position in the future.
TPL Maps successfully completed its first project in Kingdom of Saudi Arabia for maps technology deployment for the largest GIS Company in Saudi Arabia M/S Farsi Geo Tech.
TPL Maps also signed MoUs with US based INRIX, UK based mapping service WHAT3WORDS and Global Maps giant HERE Technologies, headquartered in Germany. These initiatives are expected to add substantial top line and bottom line growth in the future.
c. TPL Life Insurance Limited
TPL Life continued to build upon its core life and health insurance businesses. Gross Premium for the year ended June 30, 2018 has improved by almost 234% since last year while Corporate as well as the Retail business have shown considerable growth during the period as compared to last year.
The major initiatives taken during the period were as follows:
1. TPL Muavin (online agent training and management system. This is Pakistan’s first interactive portal for sales force)
800,000
700,000
600,000
500,000
400,000
300,000
200,000
100,000
02013 2014 2015 2016 2017 2018
‘Rup
ees
00
0’
Standalone Revenue
2,000,000
1,500,000
1,000,000
500,000
02015 2016 2017 2018
‘Rup
ees
00
0’
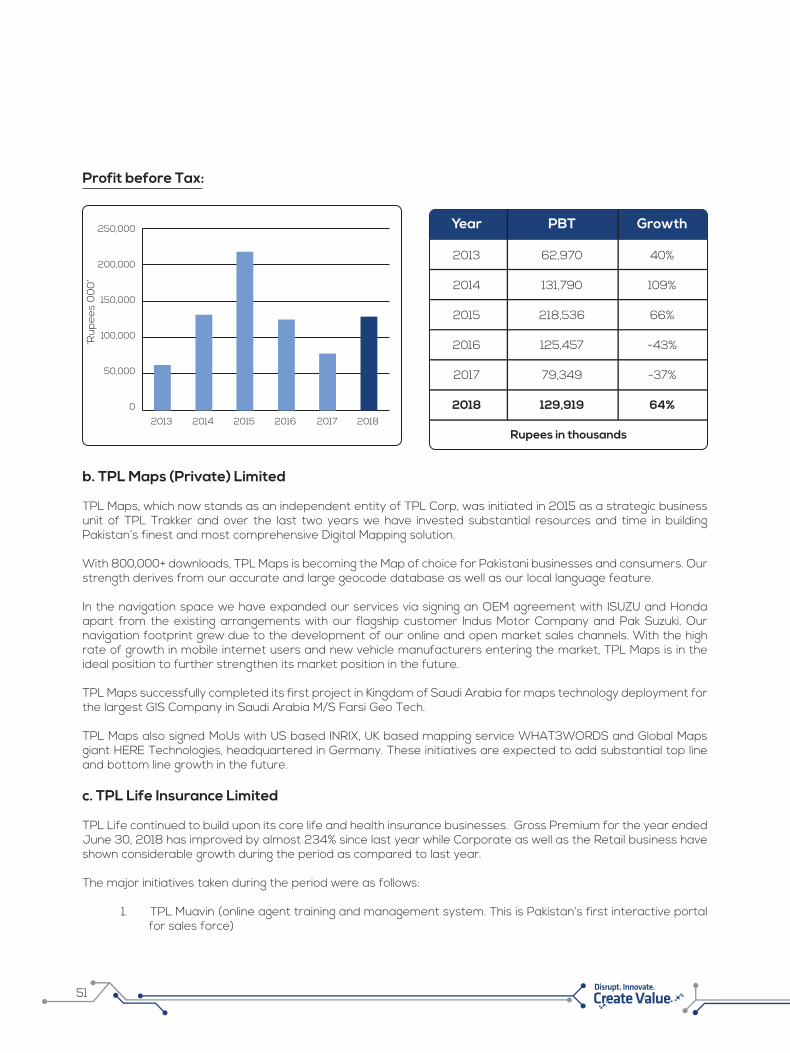
51 Disrupt. Innovate.
On behalf of the Board of Directors of TPL Corp Limited, I am pleased to present the annual financial statements with the performance review of the Company for the year ended June 30th, 2018.
1. ECONOMIC OUTLOOKAccording to the Economic Survey of Pakistan, GDP growth was 5.28% during FY 2017-18 and the country’s GDP crossed the $305 billion mark. The inflation rate in FY 2017-18 clocked in at around 4.1% and the interest rate was being maintained at 5.75% during the first three quarters but has shown an upward trend since March 2018 and increased to 6.5% in June 2018. The Pakistan Stock Exchange has shown a bearish trend during 2017-18 as compared to 2016-17. This decline was mainly because of uncertainty prevailing in the market due to depreciation in PKR vs USD and the general elections. However, subsequent to year end and after the general elections, PSX is showing a positive trend.
During FY 2017-18 sales of cars increased by 16.8%. This, combined with brighter prospects of CPEC and a successful political transition is expected to boost investors’ confidence in the economy.
2. FINANCIAL HIGHLIGHTS
Profitability and Growth – Consolidated
The group performed well during the period under review; consolidated revenue stood at Rs. 3,471 million (Rs. 5,007 million including Takaful business of TPL Insurance Limited), with a growth of 60.1% over the corresponding period of last year. Profit before tax was reported at Rs. 742 million as compared to Rs. 313 million in the corresponding period. The Group reported earnings per share of Rs. 0.07 as compared to Rs. 0.09 in the corresponding period.
During the period under review two milestones were achieved. One was the acquisition of 69.1% shares of TPL Insurance Limited from Greenoaks Global Holdings Limited. Our post-acquisition shareholding in TPL Insurance Limited stands at 93.51%. Secondly, the Group successfully completed the scheme of arrangement whereby TPL Trakker Limited has been renamed as TPL Corp Limited and now acts as the Group investment holding company. Furthermore, two new wholly owned subsidiaries of TPL Corp Limited have been formed, namely, TPL Trakker Limited & TPL Maps (Private) Limited. These subsidiaries include the vehicle tracking and maps businesses respectively.
Revenue
Profit before Tax
3. GROUP PERFORMANCEA brief review of different businesses is as follows;
a. TPL Trakker Limited
The Tracking business achieved total revenues of Rs 1.660 billion demonstrating overall revenue growth of 10% over last year. We also experienced very strong growth of 55% in volumes for our container business mostly due to the EPZA project which commenced during the year. The increase in revenues of 10% was also a result of the acquisition of new customers, development of our franchise network across Pakistan and expansion of our service offerings.
Profit before tax was Rs 129.92 million with a very strong increase of 64% over last year. The increase in profit can be attributed to higher revenues as well as tight control over costs of sales and administrative costs.
Standalone Revenue:
Profit before Tax:
b. TPL Maps (Private) Limited
TPL Maps, which now stands as an independent entity of TPL Corp, was initiated in 2015 as a strategic business unit of TPL Trakker and over the last two years we have invested substantial resources and time in building Pakistan’s finest and most comprehensive Digital Mapping solution.
With 800,000+ downloads, TPL Maps is becoming the Map of choice for Pakistani businesses and consumers. Our strength derives from our accurate and large geocode database as well as our local language feature.
In the navigation space we have expanded our services via signing an OEM agreement with ISUZU and Honda apart from the existing arrangements with our flagship customer Indus Motor Company and Pak Suzuki. Our navigation footprint grew due to the development of our online and open market sales channels. With the high rate of growth in mobile internet users and new vehicle manufacturers entering the market, TPL Maps is in the ideal position to further strengthen its market position in the future.
TPL Maps successfully completed its first project in Kingdom of Saudi Arabia for maps technology deployment for the largest GIS Company in Saudi Arabia M/S Farsi Geo Tech.
TPL Maps also signed MoUs with US based INRIX, UK based mapping service WHAT3WORDS and Global Maps giant HERE Technologies, headquartered in Germany. These initiatives are expected to add substantial top line and bottom line growth in the future.
c. TPL Life Insurance Limited
TPL Life continued to build upon its core life and health insurance businesses. Gross Premium for the year ended June 30, 2018 has improved by almost 234% since last year while Corporate as well as the Retail business have shown considerable growth during the period as compared to last year.
The major initiatives taken during the period were as follows:
1. TPL Muavin (online agent training and management system. This is Pakistan’s first interactive portal for sales force)
Year PBT Growth
2013
2014
2015
2016
2017
2018
62,970
131,790
218,536
125,457
79,349
129,919
40%
109%
66%
-43%
-37%
64%
Rupees in thousands
250,000
200,000
150,000
100,000
50,000
0
2013 2014 2015 2016 2017 2018
‘Rup
ees
00
0’
52
On behalf of the Board of Directors of TPL Corp Limited, I am pleased to present the annual financial statements with the performance review of the Company for the year ended June 30th, 2018.
1. ECONOMIC OUTLOOKAccording to the Economic Survey of Pakistan, GDP growth was 5.28% during FY 2017-18 and the country’s GDP crossed the $305 billion mark. The inflation rate in FY 2017-18 clocked in at around 4.1% and the interest rate was being maintained at 5.75% during the first three quarters but has shown an upward trend since March 2018 and increased to 6.5% in June 2018. The Pakistan Stock Exchange has shown a bearish trend during 2017-18 as compared to 2016-17. This decline was mainly because of uncertainty prevailing in the market due to depreciation in PKR vs USD and the general elections. However, subsequent to year end and after the general elections, PSX is showing a positive trend.
During FY 2017-18 sales of cars increased by 16.8%. This, combined with brighter prospects of CPEC and a successful political transition is expected to boost investors’ confidence in the economy.
2. FINANCIAL HIGHLIGHTS
Profitability and Growth – Consolidated
The group performed well during the period under review; consolidated revenue stood at Rs. 3,471 million (Rs. 5,007 million including Takaful business of TPL Insurance Limited), with a growth of 60.1% over the corresponding period of last year. Profit before tax was reported at Rs. 742 million as compared to Rs. 313 million in the corresponding period. The Group reported earnings per share of Rs. 0.07 as compared to Rs. 0.09 in the corresponding period.
During the period under review two milestones were achieved. One was the acquisition of 69.1% shares of TPL Insurance Limited from Greenoaks Global Holdings Limited. Our post-acquisition shareholding in TPL Insurance Limited stands at 93.51%. Secondly, the Group successfully completed the scheme of arrangement whereby TPL Trakker Limited has been renamed as TPL Corp Limited and now acts as the Group investment holding company. Furthermore, two new wholly owned subsidiaries of TPL Corp Limited have been formed, namely, TPL Trakker Limited & TPL Maps (Private) Limited. These subsidiaries include the vehicle tracking and maps businesses respectively.
Revenue
Profit before Tax
3. GROUP PERFORMANCEA brief review of different businesses is as follows;
a. TPL Trakker Limited
The Tracking business achieved total revenues of Rs 1.660 billion demonstrating overall revenue growth of 10% over last year. We also experienced very strong growth of 55% in volumes for our container business mostly due to the EPZA project which commenced during the year. The increase in revenues of 10% was also a result of the acquisition of new customers, development of our franchise network across Pakistan and expansion of our service offerings.
Profit before tax was Rs 129.92 million with a very strong increase of 64% over last year. The increase in profit can be attributed to higher revenues as well as tight control over costs of sales and administrative costs.
Standalone Revenue:
Profit before Tax:
b. TPL Maps (Private) Limited
TPL Maps, which now stands as an independent entity of TPL Corp, was initiated in 2015 as a strategic business unit of TPL Trakker and over the last two years we have invested substantial resources and time in building Pakistan’s finest and most comprehensive Digital Mapping solution.
With 800,000+ downloads, TPL Maps is becoming the Map of choice for Pakistani businesses and consumers. Our strength derives from our accurate and large geocode database as well as our local language feature.
In the navigation space we have expanded our services via signing an OEM agreement with ISUZU and Honda apart from the existing arrangements with our flagship customer Indus Motor Company and Pak Suzuki. Our navigation footprint grew due to the development of our online and open market sales channels. With the high rate of growth in mobile internet users and new vehicle manufacturers entering the market, TPL Maps is in the ideal position to further strengthen its market position in the future.
TPL Maps successfully completed its first project in Kingdom of Saudi Arabia for maps technology deployment for the largest GIS Company in Saudi Arabia M/S Farsi Geo Tech.
TPL Maps also signed MoUs with US based INRIX, UK based mapping service WHAT3WORDS and Global Maps giant HERE Technologies, headquartered in Germany. These initiatives are expected to add substantial top line and bottom line growth in the future.
c. TPL Life Insurance Limited
TPL Life continued to build upon its core life and health insurance businesses. Gross Premium for the year ended June 30, 2018 has improved by almost 234% since last year while Corporate as well as the Retail business have shown considerable growth during the period as compared to last year.
The major initiatives taken during the period were as follows:
1. TPL Muavin (online agent training and management system. This is Pakistan’s first interactive portal for sales force)
2. Digital health insurance (enabling customers to buy comprehensive health insurance within 3 minutes with a paperless mechanism)
3. Epidemic based health insurance (Health insurance against Dengue, Naegleria etc. offered through a digital medium)
4. OPD Sahulat (a comprehensive digital Out Patient insurance solution for corporates - another first in the market)
5. Health insurance mass retail arrangement for Shell Pakistan.
d. TPL Properties Limited
During the year under review the Company has maintained 100% tenancy of its rental portfolio besides enjoying the capital appreciation of its assets under the same portfolio hence realizing rental income as well as capital gains.
Consolidated revenue of the Company was Rs 553 million which represents an increase of 2% as compared to the same period last year due to the increase in maintenance rates during the year. Further, operational expenses have increased by 9% up from Rs. 149 million to Rs. 162 million primarily due to inflationary pressures. Gross profit reduced marginally from Rs. 392 million to Rs. 390 million during the year. However, other income has increased significantly due to a Rs. 1,180 million revaluation gain on the Company’s investment property. This resulted in Profit before Tax of Rs 1,195 million as compared to Rs 330 million last year.
e. TPL Insurance Limited
The Company is pursuing a high growth strategy in our non-motor lines which requires significant investment in infrastructure and human resources and whilst this may impact our short-term performance we expect to deliver profitable growth across all lines of business in the future. Net premium showed a growth of 11% and rose to Rs 2.16 billion as compared to Rs. 1.94 billion in the previous year. Motor insurance net premium grew by 10% to Rs 2.03 billion in the current year. Commercial Lines net premium grew by 135% to Rs 50.78 million in the current year.
Furthermore, our strategy also requires us to leverage technology in line with developments in the insurance sector globally. Hence, we are in the process of digitalizing the entire claims process to make it paperless in order to further improve our customer experience. Additionally, a customer app has also been launched for our auto insurance customers which facilitates policy buying, lodging of claims, self-survey of vehicles and damages, requesting endorsements and renewal of policies.
As a result of the above investments and further investments in the commercial lines business and technology our Profit before tax was Rs. 25 million.
During the period, Mr. Mohammad Amin Uddin joined as the Chief Executive Officer. Mr. Amin Uddin has vast experience in the financial services sector and has held various senior executive positions in Pakistan as well as the United Kingdom.
f. TPL Rupiya
TPL Rupiya is looking forward to integrating with leading banks and telecommunication companies in order to implement Pakistan’s first true interoperable mobile payment solution for the masses.
TPL Rupiya had also joined hands with UBL Omni and NPlanet to introduce cashless payments for the passengers of Lahore Transport Company enabling them to make daily commute payments using their UBL Omni bank accounts.

53 Disrupt. Innovate.
On behalf of the Board of Directors of TPL Corp Limited, I am pleased to present the annual financial statements with the performance review of the Company for the year ended June 30th, 2018.
1. ECONOMIC OUTLOOKAccording to the Economic Survey of Pakistan, GDP growth was 5.28% during FY 2017-18 and the country’s GDP crossed the $305 billion mark. The inflation rate in FY 2017-18 clocked in at around 4.1% and the interest rate was being maintained at 5.75% during the first three quarters but has shown an upward trend since March 2018 and increased to 6.5% in June 2018. The Pakistan Stock Exchange has shown a bearish trend during 2017-18 as compared to 2016-17. This decline was mainly because of uncertainty prevailing in the market due to depreciation in PKR vs USD and the general elections. However, subsequent to year end and after the general elections, PSX is showing a positive trend.
During FY 2017-18 sales of cars increased by 16.8%. This, combined with brighter prospects of CPEC and a successful political transition is expected to boost investors’ confidence in the economy.
2. FINANCIAL HIGHLIGHTS
Profitability and Growth – Consolidated
The group performed well during the period under review; consolidated revenue stood at Rs. 3,471 million (Rs. 5,007 million including Takaful business of TPL Insurance Limited), with a growth of 60.1% over the corresponding period of last year. Profit before tax was reported at Rs. 742 million as compared to Rs. 313 million in the corresponding period. The Group reported earnings per share of Rs. 0.07 as compared to Rs. 0.09 in the corresponding period.
During the period under review two milestones were achieved. One was the acquisition of 69.1% shares of TPL Insurance Limited from Greenoaks Global Holdings Limited. Our post-acquisition shareholding in TPL Insurance Limited stands at 93.51%. Secondly, the Group successfully completed the scheme of arrangement whereby TPL Trakker Limited has been renamed as TPL Corp Limited and now acts as the Group investment holding company. Furthermore, two new wholly owned subsidiaries of TPL Corp Limited have been formed, namely, TPL Trakker Limited & TPL Maps (Private) Limited. These subsidiaries include the vehicle tracking and maps businesses respectively.
Revenue
Profit before Tax
3. GROUP PERFORMANCEA brief review of different businesses is as follows;
a. TPL Trakker Limited
The Tracking business achieved total revenues of Rs 1.660 billion demonstrating overall revenue growth of 10% over last year. We also experienced very strong growth of 55% in volumes for our container business mostly due to the EPZA project which commenced during the year. The increase in revenues of 10% was also a result of the acquisition of new customers, development of our franchise network across Pakistan and expansion of our service offerings.
Profit before tax was Rs 129.92 million with a very strong increase of 64% over last year. The increase in profit can be attributed to higher revenues as well as tight control over costs of sales and administrative costs.
Standalone Revenue:
Profit before Tax:
b. TPL Maps (Private) Limited
TPL Maps, which now stands as an independent entity of TPL Corp, was initiated in 2015 as a strategic business unit of TPL Trakker and over the last two years we have invested substantial resources and time in building Pakistan’s finest and most comprehensive Digital Mapping solution.
With 800,000+ downloads, TPL Maps is becoming the Map of choice for Pakistani businesses and consumers. Our strength derives from our accurate and large geocode database as well as our local language feature.
In the navigation space we have expanded our services via signing an OEM agreement with ISUZU and Honda apart from the existing arrangements with our flagship customer Indus Motor Company and Pak Suzuki. Our navigation footprint grew due to the development of our online and open market sales channels. With the high rate of growth in mobile internet users and new vehicle manufacturers entering the market, TPL Maps is in the ideal position to further strengthen its market position in the future.
TPL Maps successfully completed its first project in Kingdom of Saudi Arabia for maps technology deployment for the largest GIS Company in Saudi Arabia M/S Farsi Geo Tech.
TPL Maps also signed MoUs with US based INRIX, UK based mapping service WHAT3WORDS and Global Maps giant HERE Technologies, headquartered in Germany. These initiatives are expected to add substantial top line and bottom line growth in the future.
c. TPL Life Insurance Limited
TPL Life continued to build upon its core life and health insurance businesses. Gross Premium for the year ended June 30, 2018 has improved by almost 234% since last year while Corporate as well as the Retail business have shown considerable growth during the period as compared to last year.
The major initiatives taken during the period were as follows:
1. TPL Muavin (online agent training and management system. This is Pakistan’s first interactive portal for sales force)
g. TPL e-Venture
Incorporated in November 2017, TPL e-Ventures (Private) Limited aims to invest in multiple startups across industries at a pre-seed and seed level in order to help them grow; this will enable us to increase the value of the initial investment. To date the company has made one investment in CompareOn (Pvt.) Ltd and their product KarloCompare. KarloCompare is a financial services price comparison website & marketplace where consumers can purchase/apply for auto loans, insurance policies, credit cards and even broadband internet. We are currently working with the team to integrate TPL Insurance and TPL Life products to further increase our digital sales.
Currently, the team is assessing a number of start-ups in order to identify investment opportunities. Moving forward, TPL e-Ventures will be working closely with incubators, accelerators, investors and other stakeholders to shape the narrative of Pakistan’s start-up eco-system while continuing to identify high-growth opportunities for investment.
h. TPL Security Services (Private) Limited
TPL Security Services (Private) Limited performed well, with a revenue growth of 26% as compared to the same period last year. The increase in revenue can be attributed to the expansion of our customer base and the Company’s constant efforts to explore new business opportunities.
4. INTERNAL CONTROL SYSTEM The Company has an internal control system, commensurate with the size, scale and complexity of its operations. The scope and authority of the Internal Audit function is defined in the Internal Audit Charter. To maintain its objectivity, the Internal Audit function reports to the Chairman of the Audit Committee of the Board. The Internal Audit Department monitors and evaluates the efficacy and adequacy of internal control systems in the Company, its compliance with operating systems, accounting procedures and policies at all locations of the Company and its subsidiaries. Based on the report of internal audit function, process owners undertake corrective action in their respective areas and thereby strengthen the controls. Significant audit observations and corrective actions thereon are presented to the Audit Committee of the Board.
5. FUTURE OUTLOOKStrategy and Focus Areas
a. TPL Trakker Limited
Digital Sales
TPL Trakker has set a clear digital vision for its businesses to deliver unparalleled digital experiences to its customers and as a result it has been able to generate better gross margins, better earnings and better net income through its digital assets.
Innovation
Industry 4.0, commonly referred to as the fourth industrial revolution, driven by advances in cyber-physical systems, the Internet of things, cloud computing and cognitive computing is changing how we live and work together and has profound implications for individuals and businesses.

54
On behalf of the Board of Directors of TPL Corp Limited, I am pleased to present the annual financial statements with the performance review of the Company for the year ended June 30th, 2018.
1. ECONOMIC OUTLOOKAccording to the Economic Survey of Pakistan, GDP growth was 5.28% during FY 2017-18 and the country’s GDP crossed the $305 billion mark. The inflation rate in FY 2017-18 clocked in at around 4.1% and the interest rate was being maintained at 5.75% during the first three quarters but has shown an upward trend since March 2018 and increased to 6.5% in June 2018. The Pakistan Stock Exchange has shown a bearish trend during 2017-18 as compared to 2016-17. This decline was mainly because of uncertainty prevailing in the market due to depreciation in PKR vs USD and the general elections. However, subsequent to year end and after the general elections, PSX is showing a positive trend.
During FY 2017-18 sales of cars increased by 16.8%. This, combined with brighter prospects of CPEC and a successful political transition is expected to boost investors’ confidence in the economy.
2. FINANCIAL HIGHLIGHTS
Profitability and Growth – Consolidated
The group performed well during the period under review; consolidated revenue stood at Rs. 3,471 million (Rs. 5,007 million including Takaful business of TPL Insurance Limited), with a growth of 60.1% over the corresponding period of last year. Profit before tax was reported at Rs. 742 million as compared to Rs. 313 million in the corresponding period. The Group reported earnings per share of Rs. 0.07 as compared to Rs. 0.09 in the corresponding period.
During the period under review two milestones were achieved. One was the acquisition of 69.1% shares of TPL Insurance Limited from Greenoaks Global Holdings Limited. Our post-acquisition shareholding in TPL Insurance Limited stands at 93.51%. Secondly, the Group successfully completed the scheme of arrangement whereby TPL Trakker Limited has been renamed as TPL Corp Limited and now acts as the Group investment holding company. Furthermore, two new wholly owned subsidiaries of TPL Corp Limited have been formed, namely, TPL Trakker Limited & TPL Maps (Private) Limited. These subsidiaries include the vehicle tracking and maps businesses respectively.
Revenue
Profit before Tax
3. GROUP PERFORMANCEA brief review of different businesses is as follows;
a. TPL Trakker Limited
The Tracking business achieved total revenues of Rs 1.660 billion demonstrating overall revenue growth of 10% over last year. We also experienced very strong growth of 55% in volumes for our container business mostly due to the EPZA project which commenced during the year. The increase in revenues of 10% was also a result of the acquisition of new customers, development of our franchise network across Pakistan and expansion of our service offerings.
Profit before tax was Rs 129.92 million with a very strong increase of 64% over last year. The increase in profit can be attributed to higher revenues as well as tight control over costs of sales and administrative costs.
Standalone Revenue:
Profit before Tax:
b. TPL Maps (Private) Limited
TPL Maps, which now stands as an independent entity of TPL Corp, was initiated in 2015 as a strategic business unit of TPL Trakker and over the last two years we have invested substantial resources and time in building Pakistan’s finest and most comprehensive Digital Mapping solution.
With 800,000+ downloads, TPL Maps is becoming the Map of choice for Pakistani businesses and consumers. Our strength derives from our accurate and large geocode database as well as our local language feature.
In the navigation space we have expanded our services via signing an OEM agreement with ISUZU and Honda apart from the existing arrangements with our flagship customer Indus Motor Company and Pak Suzuki. Our navigation footprint grew due to the development of our online and open market sales channels. With the high rate of growth in mobile internet users and new vehicle manufacturers entering the market, TPL Maps is in the ideal position to further strengthen its market position in the future.
TPL Maps successfully completed its first project in Kingdom of Saudi Arabia for maps technology deployment for the largest GIS Company in Saudi Arabia M/S Farsi Geo Tech.
TPL Maps also signed MoUs with US based INRIX, UK based mapping service WHAT3WORDS and Global Maps giant HERE Technologies, headquartered in Germany. These initiatives are expected to add substantial top line and bottom line growth in the future.
c. TPL Life Insurance Limited
TPL Life continued to build upon its core life and health insurance businesses. Gross Premium for the year ended June 30, 2018 has improved by almost 234% since last year while Corporate as well as the Retail business have shown considerable growth during the period as compared to last year.
The major initiatives taken during the period were as follows:
1. TPL Muavin (online agent training and management system. This is Pakistan’s first interactive portal for sales force)
TPL Trakker is gearing up for this disruption and has strategically commenced various innovative initiatives targeted towards strengthening its current position as the pre-eminent tracking and fleet management services provider in the Country and more.
Within the realm of vehicle telematics our initiatives include:
• Driving Behavior Scoring Solutions: That can help save lives and lower fuel consumption by improving driving behavior.
• Usage Based Insurance: Which uses driving behavior scores to help insurance companies price their premiums and high-risk policies accordingly, enabling our customers to reduce insurance costs based on good driving behavior.
• First Notice of Loss: Allowing our fleet management customers and insurance companies to conduct post-accident forensic investigations to identify factors that contributed to the accident to evaluate claims and mitigate losses.
• Remote Diagnostics: That can pre-empt faults before they occur, thereby preventing breakdowns.
New Solutions
In addition to the above mentioned vehicle telematics solutions that are designed to enhance, grow and retain our existing customer relationships we have also initiated the following innovative solutions that are targeted towards generating new revenue streams for the company:
• Tracking of school going children via their school vans and tracking of their attendance in school premises
• Fuel monitoring system to reconcile purchase and dispensing of fuel from pumps to control theft
• Water level monitoring system to reconcile purchase and usage of water
• Refrigeration and humidity monitoring systems for cold chain applications in logistics and retail chains
Going forward we will continue to deliver game-changing innovation and build teams by investing in people to encourage ambition, learning and development and foster sustainable growth.
b. TPL Maps (Private) Limited
Moving forward we aim to further strengthen our navigation software and also launch TPL Maps offline navigation system that would expand our customer base and generate additional revenues. We are also looking to venture into other software and hardware services for industry use with the vision to be pioneers in the Connected Cars space (which is expected to reach a market size of US$ 57 billion by 2021).
Another milestone achieved by TPL Maps is the launch of Pakistan’s first and only Location Based Services Platform (LBS Platform) which will unlock the unlimited potential of location data for business expansion and efficiencies. Some of the key services include Proximity Ad networks, GeoCode Search, Routing & VAS, as well as Mapping services.
TPL Maps is now also focusing on the use of new technologies and innovation in the GIS space. These initiatives include aerial mapping via drones, OBD data devices for automobiles, HD Mapping for driverless cars, use of Artificial Intelligence for predictive routes and other similar global technologies.

55 Disrupt. Innovate.
On behalf of the Board of Directors of TPL Corp Limited, I am pleased to present the annual financial statements with the performance review of the Company for the year ended June 30th, 2018.
1. ECONOMIC OUTLOOKAccording to the Economic Survey of Pakistan, GDP growth was 5.28% during FY 2017-18 and the country’s GDP crossed the $305 billion mark. The inflation rate in FY 2017-18 clocked in at around 4.1% and the interest rate was being maintained at 5.75% during the first three quarters but has shown an upward trend since March 2018 and increased to 6.5% in June 2018. The Pakistan Stock Exchange has shown a bearish trend during 2017-18 as compared to 2016-17. This decline was mainly because of uncertainty prevailing in the market due to depreciation in PKR vs USD and the general elections. However, subsequent to year end and after the general elections, PSX is showing a positive trend.
During FY 2017-18 sales of cars increased by 16.8%. This, combined with brighter prospects of CPEC and a successful political transition is expected to boost investors’ confidence in the economy.
2. FINANCIAL HIGHLIGHTS
Profitability and Growth – Consolidated
The group performed well during the period under review; consolidated revenue stood at Rs. 3,471 million (Rs. 5,007 million including Takaful business of TPL Insurance Limited), with a growth of 60.1% over the corresponding period of last year. Profit before tax was reported at Rs. 742 million as compared to Rs. 313 million in the corresponding period. The Group reported earnings per share of Rs. 0.07 as compared to Rs. 0.09 in the corresponding period.
During the period under review two milestones were achieved. One was the acquisition of 69.1% shares of TPL Insurance Limited from Greenoaks Global Holdings Limited. Our post-acquisition shareholding in TPL Insurance Limited stands at 93.51%. Secondly, the Group successfully completed the scheme of arrangement whereby TPL Trakker Limited has been renamed as TPL Corp Limited and now acts as the Group investment holding company. Furthermore, two new wholly owned subsidiaries of TPL Corp Limited have been formed, namely, TPL Trakker Limited & TPL Maps (Private) Limited. These subsidiaries include the vehicle tracking and maps businesses respectively.
Revenue
Profit before Tax
3. GROUP PERFORMANCEA brief review of different businesses is as follows;
a. TPL Trakker Limited
The Tracking business achieved total revenues of Rs 1.660 billion demonstrating overall revenue growth of 10% over last year. We also experienced very strong growth of 55% in volumes for our container business mostly due to the EPZA project which commenced during the year. The increase in revenues of 10% was also a result of the acquisition of new customers, development of our franchise network across Pakistan and expansion of our service offerings.
Profit before tax was Rs 129.92 million with a very strong increase of 64% over last year. The increase in profit can be attributed to higher revenues as well as tight control over costs of sales and administrative costs.
Standalone Revenue:
Profit before Tax:
b. TPL Maps (Private) Limited
TPL Maps, which now stands as an independent entity of TPL Corp, was initiated in 2015 as a strategic business unit of TPL Trakker and over the last two years we have invested substantial resources and time in building Pakistan’s finest and most comprehensive Digital Mapping solution.
With 800,000+ downloads, TPL Maps is becoming the Map of choice for Pakistani businesses and consumers. Our strength derives from our accurate and large geocode database as well as our local language feature.
In the navigation space we have expanded our services via signing an OEM agreement with ISUZU and Honda apart from the existing arrangements with our flagship customer Indus Motor Company and Pak Suzuki. Our navigation footprint grew due to the development of our online and open market sales channels. With the high rate of growth in mobile internet users and new vehicle manufacturers entering the market, TPL Maps is in the ideal position to further strengthen its market position in the future.
TPL Maps successfully completed its first project in Kingdom of Saudi Arabia for maps technology deployment for the largest GIS Company in Saudi Arabia M/S Farsi Geo Tech.
TPL Maps also signed MoUs with US based INRIX, UK based mapping service WHAT3WORDS and Global Maps giant HERE Technologies, headquartered in Germany. These initiatives are expected to add substantial top line and bottom line growth in the future.
c. TPL Life Insurance Limited
TPL Life continued to build upon its core life and health insurance businesses. Gross Premium for the year ended June 30, 2018 has improved by almost 234% since last year while Corporate as well as the Retail business have shown considerable growth during the period as compared to last year.
The major initiatives taken during the period were as follows:
1. TPL Muavin (online agent training and management system. This is Pakistan’s first interactive portal for sales force)
c. TPL Life Insurance Limited
The retail business segment of the Country is expected to get some boost in the form of positive development on income tax slabs revision for individuals and association of persons in the last Finance Act. This may result in enhanced buying power and more disposable income which is expected to have a positive impact on insurance products.
The launch of the Takaful line is also expected to bolster revenues in the coming months due to the inherent need for Shariah based takaful solutions in the retail and corporate sectors.
The Board of Directors are of the opinion that with clear objectives, a robust business model, innovative products and operational strategies, the Company has great potential in an environment in which health and life insurance has still not reached a majority of the population.
d. TPL Properties Limited
Currently the property sector especially in Karachi has slowed down due to the existing ban on high rise developments by the Supreme Court of Pakistan but we believe that the sector’s fundamentals are still strong with promising future growth potential. This is due to strong demand for quality commercial office spaces in Karachi and Lahore as well as robust demand for high end residential spaces which enables overall building systems efficiencies and automation for end users. In terms of the political and regulatory environment, there has been improved political certainty following the general elections. Further, the corporate regulator is also consistently improving regulations in line with regional best practices for real estate as well as other sectors with the aim of making them attractive for local and foreign investors. In line with this the Company has decided to venture into the Real Estate Investment Trust Management (RMC) business and has applied for the permission to form an RMC as a subsidiary of TPL Properties which has been duly received by the Company. The next steps would be to incorporate a Non-Banking Finance Company (NBFC) and apply for an RMC license which we expect to be completed in Q2 of FY 2019.
The above will pave the way for the Company to launch a REIT fund and convert its real estate asset portfolio to liquid assets while also realizing its valuation. This will further enable the Company to pay down all its debts thereby reducing financial costs and also provide the Company with cash to look into other potential property development ventures. Furthermore, as an RMC it will receive management fees from REIT funds which will add to its overall income sources.
e. TPL Insurance Limited
Pakistan’s automobile industry is anticipating new launches in 2018 with at least 3 new players entering the market. With CPEC projects commencing there will be significant opportunities in the commercial lines business. The strong growth anticipated in the motor insurance business as well as from commercial lines is expected to very favorably impact our results in the near future.
Subsequent to the year end, the Company’s treaty limits with reinsurers have been enhanced in excess of 50%. This will further assist the Company to underwrite additional business in the future.
6. CREDIT RATINGThe Pakistan Credit Rating Agency Limited (PACRA) has assigned a long-term entity rating of “A” (Single A) and short-term entity rating of “A1” (A one) to TPL Corp Limited. These ratings indicate a stable outlook and high credit quality.

56
On behalf of the Board of Directors of TPL Corp Limited, I am pleased to present the annual financial statements with the performance review of the Company for the year ended June 30th, 2018.
1. ECONOMIC OUTLOOKAccording to the Economic Survey of Pakistan, GDP growth was 5.28% during FY 2017-18 and the country’s GDP crossed the $305 billion mark. The inflation rate in FY 2017-18 clocked in at around 4.1% and the interest rate was being maintained at 5.75% during the first three quarters but has shown an upward trend since March 2018 and increased to 6.5% in June 2018. The Pakistan Stock Exchange has shown a bearish trend during 2017-18 as compared to 2016-17. This decline was mainly because of uncertainty prevailing in the market due to depreciation in PKR vs USD and the general elections. However, subsequent to year end and after the general elections, PSX is showing a positive trend.
During FY 2017-18 sales of cars increased by 16.8%. This, combined with brighter prospects of CPEC and a successful political transition is expected to boost investors’ confidence in the economy.
2. FINANCIAL HIGHLIGHTS
Profitability and Growth – Consolidated
The group performed well during the period under review; consolidated revenue stood at Rs. 3,471 million (Rs. 5,007 million including Takaful business of TPL Insurance Limited), with a growth of 60.1% over the corresponding period of last year. Profit before tax was reported at Rs. 742 million as compared to Rs. 313 million in the corresponding period. The Group reported earnings per share of Rs. 0.07 as compared to Rs. 0.09 in the corresponding period.
During the period under review two milestones were achieved. One was the acquisition of 69.1% shares of TPL Insurance Limited from Greenoaks Global Holdings Limited. Our post-acquisition shareholding in TPL Insurance Limited stands at 93.51%. Secondly, the Group successfully completed the scheme of arrangement whereby TPL Trakker Limited has been renamed as TPL Corp Limited and now acts as the Group investment holding company. Furthermore, two new wholly owned subsidiaries of TPL Corp Limited have been formed, namely, TPL Trakker Limited & TPL Maps (Private) Limited. These subsidiaries include the vehicle tracking and maps businesses respectively.
Revenue
Profit before Tax
3. GROUP PERFORMANCEA brief review of different businesses is as follows;
a. TPL Trakker Limited
The Tracking business achieved total revenues of Rs 1.660 billion demonstrating overall revenue growth of 10% over last year. We also experienced very strong growth of 55% in volumes for our container business mostly due to the EPZA project which commenced during the year. The increase in revenues of 10% was also a result of the acquisition of new customers, development of our franchise network across Pakistan and expansion of our service offerings.
Profit before tax was Rs 129.92 million with a very strong increase of 64% over last year. The increase in profit can be attributed to higher revenues as well as tight control over costs of sales and administrative costs.
Standalone Revenue:
Profit before Tax:
b. TPL Maps (Private) Limited
TPL Maps, which now stands as an independent entity of TPL Corp, was initiated in 2015 as a strategic business unit of TPL Trakker and over the last two years we have invested substantial resources and time in building Pakistan’s finest and most comprehensive Digital Mapping solution.
With 800,000+ downloads, TPL Maps is becoming the Map of choice for Pakistani businesses and consumers. Our strength derives from our accurate and large geocode database as well as our local language feature.
In the navigation space we have expanded our services via signing an OEM agreement with ISUZU and Honda apart from the existing arrangements with our flagship customer Indus Motor Company and Pak Suzuki. Our navigation footprint grew due to the development of our online and open market sales channels. With the high rate of growth in mobile internet users and new vehicle manufacturers entering the market, TPL Maps is in the ideal position to further strengthen its market position in the future.
TPL Maps successfully completed its first project in Kingdom of Saudi Arabia for maps technology deployment for the largest GIS Company in Saudi Arabia M/S Farsi Geo Tech.
TPL Maps also signed MoUs with US based INRIX, UK based mapping service WHAT3WORDS and Global Maps giant HERE Technologies, headquartered in Germany. These initiatives are expected to add substantial top line and bottom line growth in the future.
c. TPL Life Insurance Limited
TPL Life continued to build upon its core life and health insurance businesses. Gross Premium for the year ended June 30, 2018 has improved by almost 234% since last year while Corporate as well as the Retail business have shown considerable growth during the period as compared to last year.
The major initiatives taken during the period were as follows:
1. TPL Muavin (online agent training and management system. This is Pakistan’s first interactive portal for sales force)
7. KEY FINANCIAL DATA FOR THE LAST SIX YEARS
Balance Sheet 2018 2017 2016 2015 2014 2013 2012
Paid up share capital 2,372,978 2,172,490 2,172,490 2,172,490 2,172,490 2,172,490 1,872,490
Capital reserve 60,856 - - - - - -
Revenue reserve 565,180 548,301 533,817 901,176 364,746 249,664 187,199
Surplus on revaluation 228,061 228,791 - - - - -
Non-Controlling Intrest 4,220,903 3,978,088 2,525,421 806,560 184,734 166,846 151,304
Advance against sale of shares - - - - - - 300,000
Total Equity 7,447,978 6,927,669 5,231,727 3,880,226 2,721,970 2,589,000 2,510,993
Investments 7,800,507 6,087,598 4,741,405 4,488,355 775,464 729,098 718,183
Fixed assets 2,214,072 1,799,521 1,305,465 1,321,227 675,355 499,099 456,871
Other non current assets 2,811,627 1,879,278 1,628,358 1,552,788 1,946,378 1,817,076 1,815,567
Trade debts 1,412,187 1,254,031 1,086,023 873,160 663,276 491,317 443,298
Stock in trade 326,692 357,217 294,125 253,414 236,916 135,846 66,257
Other current assets 1,506,342 479,958 227,369 291,806 390,132 365,904 409,605
Cash and bank deposits 952,450 490,104 927,774 261,706 113,612 54,169 24,472
Total Assets 17,023,878 12,347,707 10,210,520 9,042,455 4,801,133 4,092,509 3,934,254
Long term and short term finance 6,181,169 4,255,897 3,934,215 3,301,289 841,158 589,206 512,765
Due to related parties 504,988 87,950 123,792 628,648 - - -
Other liabilities 2,889,743 1,076,191 920,786 1,232,292 1,238,005 914,303 910,496
Total Liabilities 9,575,900 5,420,038 4,978,793 5,162,229 2,079,163 1,503,509 1,423,261
Profit and Loss 2018 2017 2016 2015 2014 2013 2012
Revenue 3,471,416 2,168,433 2,037,361 2,178,542 2,084,622 1,625,549 1,346,296
Cost of Sales (1,960,689) (1,168,704) (929,333) (1,301,779) (1,233,827) (960,211) (750,676)
Gross Profit 1,510,727 999,729 1,108,028 876,763 850,795 665,337 595,620
Administrative and other expenses (1,389,059) (717,112) (685,754) (754,579) (687,950) (555,451) (436,367)
Financial Charges (507,568) (334,820) (369,731) (312,566) (82,788) (78,437) (93,194)
Other income 1,141,482 348,374 235,642 679,839 74,922 66,256 87,449
Profit/(Loss) from associates - net (13,147) 16,962 8732 (48,591) 46,104 20,668 -
Profit / (Loss) before tax 742,435 313,134 296,917 440,865 201,083 117,974 153,509
Profit / (Loss) after tax 670,206 268,280 231,629 451,950 132,841 85,430 86,505
Other Comprehensive Income (12,326) - - 450 129 59 (3,815)
Total Comprehensive Income 657,880 268280 231,629 452,400 132,970 85,489 82,690
EPS 0.07 0.09 0.29 1.54 0.53 0.32 0.40
(Rs. in thousands)

57 Disrupt. Innovate.
8. AUDITORS
M/s EY Ford Rhodes, Chartered Accountants retire and offer themselves for reappointment. The Board of Directors has recommended their appointment as auditors for the year ending June 30, 2019, at a fee to be mutually agreed.
9. DIRECTOR’S TRAINING
As required under 5.19.7 of the Pakistan Stock Exchange Listing Regulations and Regulation 20 of Listed Companies Code of Corporate Governance, 2017 the Company has duly complied with the requirement of the Directors Training Program.
STATEMENT ON CORPORATE AND FINANCIAL REPORTING FRAMEWORK
The Board is fully aware of its corporate responsibilities as envisaged under the Code of Corporate Governance, prescribed by the Securities and Exchange Commission of Pakistan and is pleased to certify that:
• The financial statements prepared by the Company present fairly its state of affairs, the result of its operations, cash flows and changes in equity.
• The Company has maintained proper books of accounts as required under the Companies Act 2017.
• The Company has followed consistently appropriate accounting policies in the preparation of Financial Statements and accounting estimates are based on reasonable and prudent judgment.
• International Financial Reporting Standard as applicable in Pakistan has been followed in the preparation of the financial statements and any departure from there have been adequately disclosed.
• The system of internal control is sound in design and has been effectively implemented monitored.
• Fundamentals of the Company are strong and there are no doubts about Company’s ability to continue as a going concern.
• The Company has followed the best practices of the Corporate Governance as laid down in the Listing Regulations of the stock exchanges and there has been no material departure there from.
• Key operating and financial data for the last six years in summarized form, is included in this annual report.
• The value of investments out of provident fund on the basis of audited accounts as on June 30, 2018 is Rs. 104.3 million.

58
10. PATTERN OF SHAREHOLDINGA statement of pattern of shareholding of the Company as at June 30, 2018 is as follows:
Pattern of holding of shares held by the shareholders of the Company as at June 30, 2018:
No. of shareholders From To Shares held
303 1 100 4,049 650 101 500 319,585 740 501 1,000 734,987 1680 1,001 5,000 5,189,276 713 5,001 10,000 6,026,281 271 10,001 15,000 3,520,932 210 15,001 20,000 3,934,000 152 20,001 25,000 3,627,000 83 25,001 30,000 2,383,500 60 30,001 35,000 2,009,770 46 35,001 40,000 1,796,500 40 40,001 45,000 1,746,238 58 45,001 50,000 2,883,000 16 50,001 55,000 844,500 12 55,001 60,000 703,500 13 60,001 65,000 828,000 16 65,001 70,000 1,096,236 17 70,001 75,000 1,261,000 17 75,001 80,000 1,339,500 4 80,001 85,000 328,500 4 85,001 90,000 352,000 7 90,001 95,000 649,500 40 95,001 100,000 3,997,877 6 100,001 105,000 619,500 5 105,001 110,000 543,000 3 110,001 115,000 342,500 4 115,001 120,000 477,500 8 120,001 125,000 998,500 2 125,001 130,000 256,500 3 130,001 135,000 400,000 3 135,001 140,000 418,500 5 140,001 145,000 721,000 7 145,001 150,000 1,050,000 1 155,001 160,000 160,000 1 160,001 165,000 163,000 1 165,001 170,000 170,000 5 170,001 175,000 873,500
Shareholder's Category Number of shares Percentage of Shareholding
Associated Companies 135,239,574 56.99%Banks, DFI, NBFI 10,432,000 4.40%Insurance Companies 35,000 0.01%Mutual Funds 432,500 0.18%General Public (Local) 76,517,578 32.25%General Public (Foreign) 3,613,558 1.52%Modarabas 153,000 0.06%Foreign Companies 2,264,000 0.95%Others 8,610,553 3.63%Total 237,297,763 100%

59 Disrupt. Innovate.
1 175,001 180,000 176,000 1 180,001 185,000 183,000 1 185,001 190,000 188,000 13 195,001 200,000 2,600,000 2 200,001 205,000 405,000 1 205,001 210,000 206,000 1 210,001 215,000 211,000 1 215,001 220,000 215,958 2 220,001 225,000 445,000 1 225,001 230,000 227,500 1 230,001 235,000 233,500 1 235,001 240,000 237,000 1 240,001 245,000 242,000 7 245,001 250,000 1,739,000 3 255,001 260,000 776,000 1 260,001 265,000 262,500 1 275,001 280,000 280,000 4 295,001 300,000 1,194,000 1 310,001 315,000 315,000 1 315,001 320,000 318,000 1 325,001 330,000 328,500 1 330,001 335,000 332,000 3 355,001 360,000 1,074,000 2 365,001 370,000 733,500 1 375,001 380,000 376,500 1 380,001 385,000 383,500 1 385,001 390,000 385,500 2 395,001 400,000 800,000 1 400,001 405,000 403,500 1 405,001 410,000 406,000 1 415,001 420,000 420,000 1 420,001 425,000 424,000 1 425,001 430,000 426,500 1 455,001 460,000 458,000 1 485,001 490,000 490,000 2 495,001 500,000 1,000,000 1 520,001 525,000 525,000 1 545,001 550,000 550,000 1 550,001 555,000 551,500 1 565,001 570,000 570,000 1 595,001 600,000 599,000 1 615,001 620,000 616,000 1 620,001 625,000 622,500 1 670,001 675,000 673,500 1 770,001 775,000 775,000 2 895,001 900,000 1,800,000 2 995,001 1,000,000 2,000,000 1 1,020,001 1,025,000 1,025,000 1 1,040,001 1,045,000 1,040,500 1 1,295,001 1,300,000 1,300,000 1 1,300,001 1,305,000 1,302,000 1 1,395,001 1,400,000 1,400,000 1 1,415,001 1,420,000 1,417,500 1 1,495,001 1,500,000 1,500,000 1 1,540,001 1,545,000 1,545,000 1 2,260,001 2,265,000 2,264,000 1 3,410,001 3,415,000 3,412,000 1 5,145,001 5,150,000 5,150,000 1 35,005,001 35,010,000 35,009,900 1 79,935,001 99,989,000 99,984,174 5,298 Company Total 237,297,763
No. of shareholders From To Shares held

TPL HoldTPL Holdings (Private) Limited 135,239,574TPL Direct Insurance Limited – Employees Provident Fund 347 Mutual Funds (name wise details) Adam Securities Ltd. - MF 70,500 AFC Umbrella Fund 2,264,000 Arif Habib Limited - MF 211,000 Asda Securities (Private) Limited - MF 15,500 Axis Global Limited - MF 257,000 Bawa Securities (Pvt) Ltd. - MF 100,000 BMA Capital Management Ltd. - MF 25,000 CDC - Trustee AKD Opportunity Fund 385,500 CDC - Trustee AKD Opportunity Fund 385,500 CDC - Trustee MCB Pakistan Stock Market Fund 47,000 CDC - Trustee MCB Pakistan Stock Market Fund 47,000 JS Global Capital Limited - MF 328,500 Market 786 (Private) Limited - MF 125,000 Mohammad Munir Mohammad Ahmed Khanani Securities(P)Ltd - MF 551,500 MRA Securities Limited - MF 188,000 N. U. A. Securities (Private) Limited - MF 113,500 Pearl Securities Limited - MF 622,500 Reliance Securities Limited - MF 124,000 Standard Capital Securities (Pvt) Limited - MF 1,000,000 Trust Securities & Brokerage Limited - MF 32,500 Trustee TPL Direct Insurance Ltd -Employees Provident Fund 347 Trustees Of First UDL Modaraba Staff Provident Fund 5,000 Trustees Of First UDL Modaraba Staff Provident Fund 5,000 Trustees Of Pakistan Mobile Communication Ltd-Provident Fund 50,000 Wateen Telecom Limited Staff Gratuity Fund 100,000 Directors, CEO and their spouse and minor children (name wise details) Following directors are nominee directors of TPL Holdings (Private) Limited anddo not hold any shares of the Company. Mr. Jameel Yusuf (S.St) Mr. Ali Jameel Mr. Saad Nissar Mr. Bilal Alibhai Following director is the independent director of the company and do not hold anyshares of the Company at June 30, 2018 Mr. Nadeem Arshad Elahi Non-Executive Directors NoneFollowing directors hold shares of the Company at June 30, 2018 Mr. Zafar-ul-Hassan Naqvi 500Mr. Muhammad Shafi 1
Associated Companies, undertakings and related parties (name wise details) No of shares held
60
11. ADDITIONAL INFORMATION

61 Disrupt. Innovate.
Shareholders holding five percent or more voting interest (name wise details) TPL Holdings (Private) Limited 135,239,574 Details of trading in the shares by the Directors, CEO, CFO, Company Secretary andtheir spouses and minor children None of the Directors, CEO, CFO, Company Secretary and their spouses and minor Children has traded in the shares of the Company during the year. None
12. BOARD MEETINGSThe Board of Directors held 6 meetings during the financial year. Attendance of Directors is indicated below:
ACKNOWLEDGEMENTWe would like to thank the shareholders of the Company for the confidence they have reposed in us. We also appreciate the valued support and guidance provided by the Securities and Exchange Commission of Pakistan, Federal Board of Revenue and the Pakistan Stock Exchange. We would also express our sincere thanks to the employees, strategic partners, vendors, suppliers and customers for their support in pursuit of our corporate objectives.
Associated Companies, undertakings and related parties (name wise details) No of shares held
Name of Director Meetings Attended
Mr. Jameel Yusuf (S. St.) 4
Mr. Ali Jameel (CEO) 6
Vice Admiral ( R ) Muhammad Shafi HI ( M ) 5
Mr. Mark Dean Rousseau 4
Mr. Saad Nissar 4
Mr. Nadeem Arshad Elahi 4
Major General ( R ) Zafar-Ul-Hassan Naqvi 4
Mr. Bilal Alibhai 4
Chief Executive Director

62
2015
2016
2017
2018
2,178,542
2,037,361
2,168,433
3,471,416
5%
-6%
6%
60%
Rupees in thousands
4,000,000
3,000,000
2,000,000
1,000,000
0
‘Rup
ees
00
0’
2015 2016 2017 2018

63 Disrupt. Innovate.
2013
2014
2015
2016
2017
2018
117,974
201,083
440,865
296,917
313,134
742,435
-23%
70%
119%
-33%
5%
137%
Rupees in thousands
800,000
700,000
600,000
500,000
400,000
300,000
200,000
100,000
02013 2014 2015 2016 2017 2018
‘Rup
ees
00
0’
2,000,000
1,500,000
1,000,000
500,000
02015 2016 2017 2018
‘Rup
ees
00
0’
2015
2016
2017
2018
1,457,620
1,537,181
1,506,282
1,660,647
4%
5%
-2%
10%
Rupees in thousands
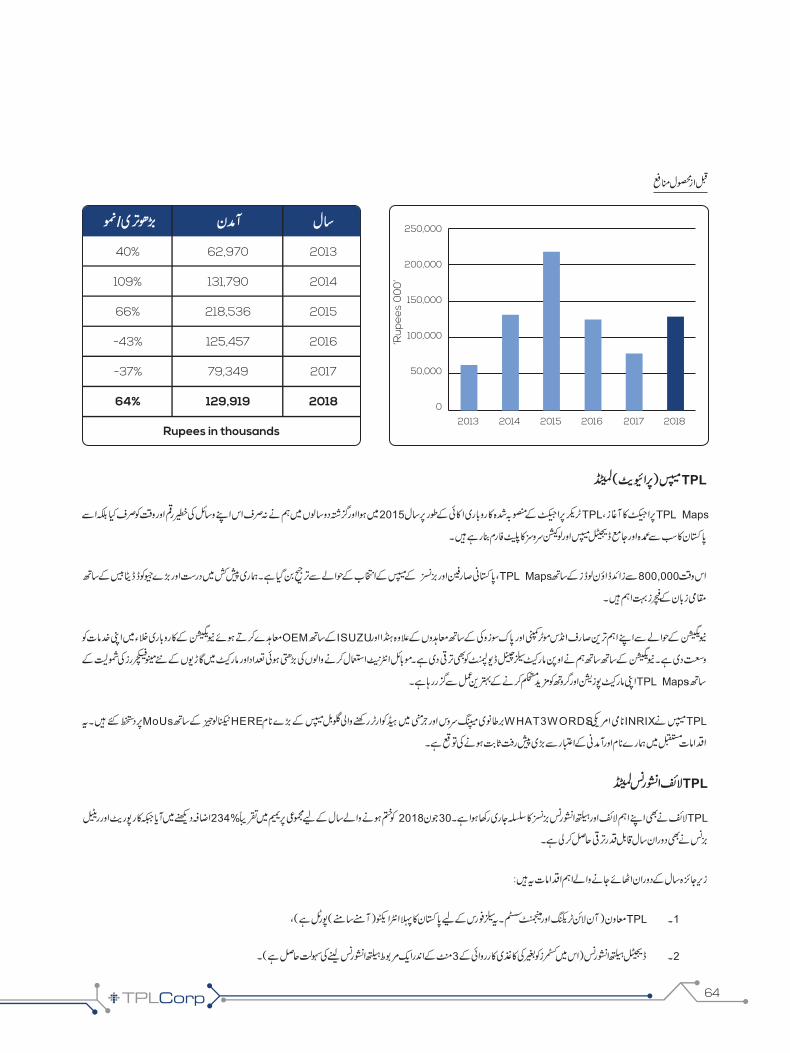
64
250,000
200,000
150,000
100,000
50,000
0
2013 2014 2015 2016 2017 2018
‘Rup
ees
00
0’
2013
2014
2015
2016
2017
2018
62,970
131,790
218,536
125,457
79,349
129,919
40%
109%
66%
-43%
-37%
64%
Rupees in thousands
65 Disrupt. Innovate.
1.195 0.33
2%

66

67 Disrupt. Innovate.

68

69 Disrupt. Innovate.
2017 20182016
2,372,978
60,856
565,180
228,061
4,220,903
-
7,447,978
7,800,507
2,214,072
2,811,627
1,412,187
326,692
1,506,342
952,450
17,023,878
4,954,818
504,988
4,116,094
9,575,900
3,471,416
(1,960,689)
1,510,727
(1,389,059)
(507,568)
1,141,482
(13,147)
742,435
670,206
(12,326)
657,880
0.07
2,172,490
-
548,301
228,791
3,978,088
-
6,927,669
6,087,598
1,799,521
1,879,278
1,280,587
357,217
453,402
490,104
12,347,707
3,763,754
87,950
1,568,334
5,420,038
2,168,433
(1,168,704)
999,729
(717,112)
(334,820)
348,374
16,962
313,134
268,280
229,088
497,369
0.09
2,172,490
-
533,817
-
2,525,421
-
5,231,727
4,741,405
1,305,465
1,628,358
1,086,023
294,125
227,369
927,774
10,210,520
3,482,903
91,454
1,404,437
4,978,793
2,037,361
(929,333)
1,108,028
(685,754)
(369,731)
244,375
-
296,917
231,629
-
231,629
0.29
2,172,490
-
901,176
-
806,560
-
3,880,226
4,488,355
1,321,227
1,552,788
873,160
253,414
291,806
261,706
9,042,455
2,916,762
245,197
2,000,270
5,162,229
2,178,542
(1,301,779)
876,763
(754,579)
(312,566)
679,839
(48,591)
440,865
451,950
450
452,400
1.54
2,172,490
-
580,103
-
184,734
-
2,937,326
990,821
675,355
1,946,378
663,276
236,916
390,132
113,612
5,016,489
710,001
-
1,369,162
2,079,163
2,084,622
(1,233,827)
850,795
(687,950)
(82,788)
74,922
261,461
416,439
348,197
129
348,326
1.52
2,172,490
-
249,664
-
166,846
-
2,589,000
729,098
499,099
1,817,076
491,317
135,846
365,904
54,169
4,092,509
527,427
-
976,082
1,503,509
1,625,549
(960,211)
665,337
(555,451)
(78,437)
86,524
-
117,974
85,430
59
85,489
0.32
1,872,490
-
187,199
-
151,304
300,000
2,510,993
718,183
456,871
1,815,567
443,298
66,257
409,605
24,472
3,934,254
457,629
-
965,631
1,423,261
1,346,296
(750,676)
595,620
(436,367)
(93,194)
87,449
-
153,509
86,505
(3,815)
82,690
0.40
2015201420132012
2017 201820162015201420132012
(Rs. in thousands)

70
135,239,57410,432,000
35,000432,500
76,517,5783,613,558
153,0002,264,0008,610,553
237,297,763
56.99%4.40%0.01%0.18%
32.25%1.52%
0.06%0.5%
3.63%100%

71 Disrupt. Innovate.
30365074016807132712101528360464058161213161717447
4065348233571115111
1321112111
1 101 501 1,001 5,001 10,001 15,001 20,001 25,001 30,001 35,001 40,001 45,001 50,001 55,001 60,001 65,001 70,001 75,001 80,001 85,001 90,001 95,001 100,001 105,001 110,001 115,001 120,001 125,001 130,001 135,001 140,001 145,001 155,001 160,001 165,001 170,001 175,001 180,001 185,001 195,001 200,001 205,001 210,001 215,001 220,001 225,001 230,001 235,001
100 500 1,000 5,000 10,000 15,000 20,000 25,000 30,000 35,000 40,000 45,000 50,000 55,000 60,000 65,000 70,000 75,000 80,000 85,000 90,000 95,000 100,000 105,000 110,000 115,000 120,000 125,000 130,000 135,000 140,000 145,000 150,000 160,000 165,000 170,000 175,000 180,000 185,000 190,000 200,000 205,000 210,000 215,000 220,000 225,000 230,000 235,000 240,000
4,049 319,585 734,987
5,189,276 6,026,281 3,520,932 3,934,000 3,627,000 2,383,500 2,009,770 1,796,500 1,746,238 2,883,000 844,500 703,500 828,000 1,096,236 1,261,000 1,339,500 328,500 352,000 649,500
3,997,877 619,500 543,000 342,500 477,500 998,500 256,500 400,000 418,500 721,000
1,050,000 160,000 163,000 170,000 873,500 176,000 183,000 188,000
2,600,000 405,000 206,000 211,000 215,958 445,000 227,500 233,500 237,000
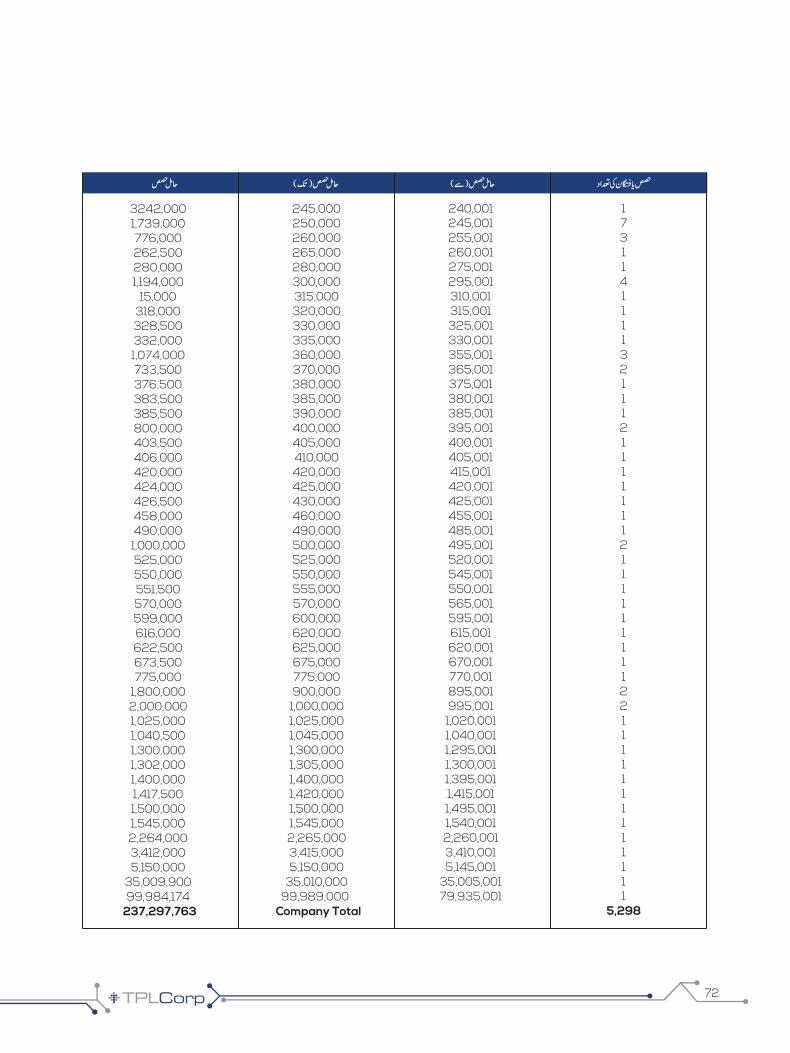
72
173114111132111211111112111111111221111111111111
5,298
240,001 245,001 255,001 260,001 275,001 295,001 310,001 315,001 325,001 330,001 355,001 365,001 375,001 380,001 385,001 395,001 400,001 405,001 415,001 420,001 425,001 455,001 485,001 495,001 520,001 545,001 550,001 565,001 595,001 615,001 620,001 670,001 770,001 895,001 995,001 1,020,001 1,040,001 1,295,001 1,300,001 1,395,001 1,415,001 1,495,001 1,540,001 2,260,001 3,410,001 5,145,001
35,005,001 79,935,001
245,000 250,000 260,000 265,000 280,000 300,000 315,000 320,000 330,000 335,000 360,000 370,000 380,000 385,000 390,000 400,000 405,000 410,000 420,000 425,000 430,000 460,000 490,000 500,000 525,000 550,000 555,000 570,000 600,000 620,000 625,000 675,000 775,000 900,000 1,000,000 1,025,000 1,045,000 1,300,000 1,305,000 1,400,000 1,420,000 1,500,000 1,545,000 2,265,000 3,415,000 5,150,000
35,010,000 99,989,000
Company Total
3242,000 1,739,000 776,000 262,500 280,000 1,194,000
15,000 318,000 328,500 332,000 1,074,000 733,500 376,500 383,500 385,500 800,000 403,500 406,000 420,000 424,000 426,500 458,000 490,000 1,000,000 525,000 550,000 551,500 570,000 599,000 616,000 622,500 673,500 775,000
1,800,000 2,000,000 1,025,000 1,040,500 1,300,000 1,302,000 1,400,000 1,417,500 1,500,000 1,545,000 2,264,000 3,412,000 5,150,000
35,009,900 99,984,174
237,297,763

73 Disrupt. Innovate.
135,239,574347
Adam Securities Ltd. - MFAFC Umbrella Fund
Arif Habib Limited - MFAsda Securities (Private) Limited - MF
Axis Global Limited - MFBawa Securities (Pvt) Ltd. - MF
BMA Capital Management Ltd. - MFCDC - Trustee AKD Opportunity FundCDC - Trustee AKD Opportunity Fund
CDC - Trustee MCB Pakistan Stock Market FundCDC - Trustee MCB Pakistan Stock Market Fund
JS Global Capital Limited - MFMarket 786 (Private) Limited - MF
Mohammad Munir Mohammad Ahmed Khanani Securities(P)Ltd - MFMRA Securities Limited - MF
N. U. A. Securities (Private) Limited - MFPearl Securities Limited - MF
Reliance Securities Limited - MFStandard Capital Securities (Pvt) Limited - MF
Trust Securities & Brokerage Limited - MFTrustee TPL Direct Insurance Ltd -Employees Provident Fund
Trustees Of First UDL Modaraba Staff Provident FundTrustees Of First UDL Modaraba Staff Provident Fund
Trustees Of Pakistan Mobile Communication Ltd-Provident FundWateen Telecom Limited Staff Gratuity Fund
70,500 2,264,000
211,000 15,500
257,000 100,000 25,000
385,500 385,500
47,000 47,000
328,500 125,000 551,500 188,000 113,500
622,500 124,000
1,000,000 32,500
347 5,000 5,000
50,000 100,000

74
5001
135,239,574
4
6
5
4
4
4
4
4
Chief Executive Director

75 Disrupt. Innovate.
Review Report on the Statement of Compliance Containedin Code of Corporate Governance, 2012 and the ListedCompanies (Code of Corporate Governance) Regulations, 2017
We have reviewed the enclosed Statement of Compliance with the Code of Corporate Governance, 2012 and the Listed Companies (Code of Corporate Governance) Regulations, 2017 (here-in-after referred to as ‘Codes’), prepared by the Board of Directors of TPL Corp Limited for the year ended 30 June 2018 in accordance with the requirements of Regulation 40 of the Listed Companies (Code of Corporate Governance) Regulations, 2017.
The responsibility for compliance with the Codes is that of the Board of Directors of the Company. Our responsibility is to review whether the Statement of Compliance reflects the status of the Company’s compliance with the provisions of the Codes and report if it does not and to highlight any non-compliance with the requirements of the Codes. A review is limited primarily to inquiries of the Company’s personnel and review of various documents prepared by the Company to comply with the Codes.
As a part of our audit of the financial statements we are required to obtain an understanding of the accounting and internal control systems sufficient to plan the audit and develop an effective audit approach. We are not required to consider whether the Board of Directors’ statement on internal control covers all risks and controls or to form an opinion on the effectiveness of such internal controls, the Company’s corporate governance procedures and risks.
The Codes require the Company to place before the Audit Committee, and upon recommendation of the Audit Committee, place before the Board of Directors for their review and approval, its related party transactions and also ensure compliance with the requirements of Section 208 of the Companies Act, 2017. We are only required and have ensured compliance of this requirement to the extent of the approval of the related party transactions by the Board of Directors upon recommendation of the Audit Committee. We have not carried out procedures to assess and determine the Company’s process for identification of related parties and that whether the related party transactions were undertaken at arm’s length price or not.
Based on our review, nothing has come to our attention which causes us to believe that the Statement of Compliance does not appropriately reflect the Company's compliance, in all material respects, with the requirements contained in the Codes as applicable to the Company for the year ended 30 June 2018.
Further, we highlight below instance of non-compliance with the requirement of the Listed Companies (Code of Corporate Governance) Regulations, 2017 as reflected in the paragraph reference where it is stated in the Statement of Compliance:
Reference Description
i. 5 The Company’s overall corporate strategy and defined level of materiality were approved subsequently by Board of Directors.
iii. 8 The formal policy for remuneration of directors is approved subsequently by Board of Directors.
iv. 12 The chairman of the HR and Remuneration committee is not an independent director.
Chartered Accountants Place: KarachiDate: 24 September, 2018
INDEPENDENT AUDITORS’ REVIEW REPORT TO THE MEMBERS OF TPL CORP LIMITED

76
STATEMENT OF COMPLIANCE WITH THE CODE OF CORPORATEGOVERNANCE, 2012 AND THE LISTED COMPANIES (CODE OFCORPORATE GOVERNANCE) REGULATIONS, 2017
Name of Company: TPL Corp LimitedYear ended: 30 June 2018
The Company has complied with the requirements of the Code of Corporate Governance, 2012 and the Listed Companies (Code Of Corporate Governance) Regulations, 2017 (here-in-after referred to as ‘Codes’) in the following manner:
1. The total number of Directors are eight (08) as per the following:
a. Male: 08 b. Female: -
2. The composition of the Board is as follows:
Category Names
Independent director Nadeem Arshad Elahi
Other Non-executive Directors 1. Mr. Jameel Yousuf 2. Mr. Bilal Alibhai 3. Mr. Mark Dean Rousseau 4. Mr. Zafar-ul-Hasan Naqvi 5. Mr. Mohammad Shafi 6. Mr. Saad Nissar
Executive Directors Mr. Mohammad Ali Jameel
3. The directors have confirmed that none of them is serving as a director on more than five listed companies, including this Company (excluding the listed subsidiaries of listed holding companies where applicable).
4. The Company has prepared a Code of Conduct and has ensured that appropriate steps have been taken to disseminate it throughout the Company along with its supporting policies and procedures.
5. The Board has developed a vision/mission statement and significant policies of the Company. However, overall corporate strategy and defined level of materiality were subsequently approved by the Board. A complete record of particulars of significant policies along with the dates on which they were approved or amended has been maintained.
6. All the powers of the Board have been duly exercised and decisions on relevant matters have been taken by Board/ Shareholders as empowered by the relevant provisions of the Companies Act, 2017 (“Act”) and Codes.
7. The meetings of the Board were presided over by the Chairman and, in his absence, by a Director elected by the Board for this purpose. The Board has complied with the requirements of Act and the Codes with respect to frequency, recording and circulating minutes of meeting of Board.
8. The Board of Directors has a formal policy and transparent procedures for remuneration of directors in accordance with the Act and the Codes and the same is approved subseqently by the Board.

77 Disrupt. Innovate.
STATEMENT OF COMPLIANCE WITH THE CODE OF CORPORATEGOVERNANCE, 2012 AND THE LISTED COMPANIES (CODE OFCORPORATE GOVERNANCE) REGULATIONS, 2017
9. The Board has duly complied with the Directors’ Training Program requirement and the criteria as prescribed in the Codes.
10. The Board has approved appointment of Chief Financial Officer, Company Secretary and Head of Internal Audit, including their remuneration and terms and conditions of employment and complied with relevant requirements of the Codes.
11. The Chief Financial Officer and Chief Execution Officer have duly endorsed the financial statements before approval of the Board.
12. The Board has formed committees comprising of members given below. However, the chairman of the HR
and Remuneration committee is not an independent member.
Audit Committee Mr. Nadeem Arshad Elahi – Chairman Mr. Zafar-ul-Hasan Naqvi – Member Mr. Saad Nissar – Member Mr. Yousuf Zohaib Ali – Secretary
HR and Remuneration Committee Mr. Zafar-ul-Hasan Naqvi – Chairman Mr. Mohammad Ali Jameel – Member Mr. Nadeem Arshad Elahi – Member Mr. Nader Nawaz – Secretary
13. The terms of reference of the aforesaid Committees have been formed, documented and advised to the Committee for compliance.
14. The frequency of meetings (quarterly/half yearly/ yearly) of the committee were as per following:
Name of Committee Frequency of Meeting
Audit Committee The Board Audit Committee has met on quarterly basis.
HR and Remuneration Committee The HR and Remuneration Committee has met on yearly basis.
15. The Board has set up an effective internal audit function which is considered suitably qualified and experienced for the purpose and is conversant with the policies and procedures of the Company.
16. The statutory auditors of the company have confirmed that they have been given a satisfactory rating under the quality control review program of the Institute of Chartered Accountants of Pakistan (ICAP) and registered with Audit Oversight Board of Pakistan, that they or any of the partners of the firm, their spouses and minor children do not hold shares of the Company and that the firm and all its partners are in compliance with International Federation of Accountants (IFAC) guidelines on code of ethics as adopted by the ICAP.

78
STATEMENT OF COMPLIANCE WITH THE CODE OF CORPORATEGOVERNANCE, 2012 AND THE LISTED COMPANIES (CODE OFCORPORATE GOVERNANCE) REGULATIONS, 2017
17. The statutory auditors or the persons associated with them have not been appointed to provide other services except in accordance with the Act, the Codes or any other regulatory requirement and the auditors have confirmed that they have observed IFAC guidelines in this regard.
18. We confirm that all other requirements of the Codes have been complied with, except for matters as stated in points 5, 8 and 12 above, towards which reasonable progress is being made by the Company to seek compliance shortly.
Jameel Yusuf (S.St)Chairman

Opinion
We have audited the annexed financial statements of TPL Corp Limited (the Company), which comprise the statement of financial position as at 30 June 2018, and the statement of profit or loss and other comprehensive income, the statement of changes in equity, the statement of cash flows for the year then ended, and notes to the financial statements, including a summary of significant accounting policies and other explanatory information, and we state that we have obtained all the information and explanations which, to the best of our knowledge and belief, were necessary for the purposes of the audit.
In our opinion and to the best of our information and according to the explanations given to us, the statement of financial position, statement of profit or loss and other comprehensive income, the statement of changes in equity and the statement of cash flows together with the notes forming part thereof conform with the accounting and reporting standards as applicable in Pakistan and give the information required by the Companies Act, 2017 (XIX of 2017), in the manner so required and respectively give a true and fair view of the state of the Companys affairs as at 30 June 2018 and of the loss and other comprehensive loss, the changes in equity and its cash flows for the year then ended.
Basis for Opinion
We conducted our audit in accordance with International Standards on Auditing (ISAs) as applicable in Pakistan. Our responsibilities under those standards are further described in the Auditors’ Responsibilities for the Audit of the Consolidated Financial Statements section of our report. We are independent of the Company in accordance with the International Ethics Standards Board for Accountants’ Code of Ethics for Professional Accountants as adopted by the Institute of Chartered Accountants of Pakistan (the Code), and we have fulfilled our other ethical responsibilities in accordance with the Code. We believe that the audit evidence we have obtained is sufficient and appropriate to provide a basis for our opinion.
Key Audit Matters
Key audit matters are those matters that, in our professional judgment, were of most significance in our audit of the financial statements of the current period. These matters were addressed in the context of our audit of the financial statements as a whole, and in forming our opinion thereon, and we do not provide a separate opinion on these matters.
79 Disrupt. Innovate.
INDEPENDENT AUDITORS' REPORTTo the members of TPL Corp Limited
Report on the Audit of the Financial Statements
EY Ford RhodesChartered AccountantsProgressive Plaza, Beaumont RoadP.O. Box 15541, Karachi 75530Pakistan
Tel: + 9221 3565 0007-11Fax: + 9221 3568 [email protected]/pk

80
(Refer note 1.5 to the accompanying financial statements) The principal activity of the Company was installation and sale of tracking devices, vehicle tracking and fleet management. However, on 17 November 2017, the Scheme of Arrangement was sanctioned / approved by the Honorable High Court of Sindh to split the Company business into the Retained Undertaking, Maps Undertaking and Trakker Undertaking on the effective date along with all its associated assets and liabilities, against the consideration of shares issued by respective entities i.e. TPL Maps (Pvt.) Limited and TPL Trakker Limited (here-in-after referred to as subsidiary companies).
Due to significance of this event and its impact on the Company's financial position and performance, we considered this a key audit matter.
Our audit procedures amongst others included:
- reviewed the Scheme of Arrangement Scheme) and checked its approval by the shareholders and sanctioned by the Honorable High Court of Sindh (the Court);
- considered the accounting implications of implementing the Scheme, in particular, the basis of determining the assets and liabilities transferred to the subsidiary companies; and
- reviewed the adequacy of related disclosures in the financial statements in accordance with the financial reporting standards.
Key audit matter How the matter was addressed in our audit
1. Carved-out of businesses to wholly-owned subsidiariesy
(Refer notes 9 and 46.4 to the accompanying financial statements)
The Company investment in subsidiaries represents the significant portion of its assets. These investments are measured at fair value on the basis of observable market prices, where such prices are available, and by applying valuation techniques, where quoted prices are not available. We considered valuation of subsidiaries as a key audit matter due to volatility in the quoted equity prices and the judgment involved in estimating future cashflows in relation to the subsidiaries for the purpose of applying valuation techniques.
Our audit procedures amongst others, comprised understanding the management process for valuation of investments, considered whether the application of methodologies are consistent with generally accepted valuation methodologies and prior periods, and that assumptions and inputs used are consistent, in all material respects, with the business' past performance and management business strategy.
In addition, in respect of investments classified as available for sale, we considered the implications of impairment in accordance with the requirements of the applicable financial reporting standards and the accounting policies of the Company. We involved our internal specialists to assess the appropriateness of the methodology and assumptions used by the management to determine the fair value of investment in unquoted subsidiaries. As part of these audit procedures, our internal specialists:
2. Valuation of investment In subsidiaries
Following are the key audit matters:

81 Disrupt. Innovate.
Key audit matter How the matter was addressed in our audit
We assessed the procedures applied by the management for identification of the changes required in the financial statements due to the application of the Act. We considered the adequacy and appropriateness of the additional disclosures and changes to the previous disclosures based on the new requirements. We also evaluated the sources of information used by the management for the preparation of the above referred disclosures and the internal consistency of such disclosures with other elements of the financial statements.
In respect of the change in accounting policy for the accounting and presentation of revaluation surplus as referred to note 5.5 to the financial statements; we assessed the accounting implications in accordance with the applicable financial reporting standards and evaluated its application in the context of the Company.
(Refer note 3 to the accompanying financial statements)
The Companies Act, 2017 (the Act) became applicable for the first time for the preparation of the Company's annual financial statements for the year ended 30 June 2018.
The Act forms an integral part of the statutory financial reporting framework as applicable to the Company and amongst others, prescribes the nature and content of disclosures in relation to various elements of the financial statements.
In the case of the Company, specific additional disclosures and changes to the existing disclosures have been included in note 3 to the financial statements.
3. Preparation of financial statements under Companies Act, 2017
- assessed whether, for a selection of models, the model valuation methodology is appropriate;
- reviewed the accuracy of key inputs used in the valuation such as the expected cash flows, discount and inflation rates used by benchmarking them with external data; and
- evaluated the Company's assessment, whether objective evidence of impairment exists for individual investments.
We tested the allocation of investments to the correct level (1 and 2) within the fair value hierarchy in line with the established policy, and that the policy classifications were appropriate.
We also assessed the adequacy of the related disclosures in the financial statements in accordance with the financial reporting standards.

82
Information Other than the Financial Statements and Auditors' Report Thereon
Management is responsible for the other information. The other information comprises the information included in the Annual Report, but does not include the financial statements and our auditors' report thereon.
Our opinion on the financial statements does not cover the other information and we do not express any form of assurance conclusion thereon.
In connection with our audit of the financial statements, our responsibility is to read the other information and, in doing so, consider whether the other information is materially inconsistent with the financial statements or our knowledge obtained in the audit or otherwise appears to be materially misstated. If, based on the work we have performed, we conclude that there is a material misstatement of this other information, we are required to report that fact. We have nothing to report in this regard.
Responsibilities of Management and Board of Directors for the Financial Statements
Management is responsible for the preparation and fair presentation of the financial statements in accordance with the accounting and reporting standards as applicable in Pakistan and the requirements of Companies Act, 2017 (XIX of 2017) and for such internal control as management determines is necessary to enable the preparation of financial statements that are free from material misstatement, whether due to fraud or error.
In preparing the financial statements, management is responsible for assessing the Company's ability to continue as a going concern, disclosing, as applicable, matters related to going concern and using the going concern basis of accounting unless management either intends to liquidate the Company or to cease operations, or has no realistic alternative but to do so.
Board of Directors is responsible for overseeing the Company's financial reporting process.
Auditors' Responsibilities for the Audit of the Financial Statements
Our objectives are to obtain reasonable assurance about whether the financial statements as a whole are free from material misstatement, whether due to fraud or error, and to issue an auditors' report that includes our opinion. Reasonable assurance is a high level of assurance, but is not a guarantee that an audit conducted in accordance with ISAs as applicable in Pakistan will always detect a material misstatement when it exists. Misstatements can arise from fraud or error and are considered material if, individually or in the aggregate, they could reasonably be expected to influence the economic decisions of users taken on the basis of these financial statements
As part of an audit in accordance with ISAs as applicable in Pakistan, we exercise professional judgment and maintain professional skepticism throughout the audit. We also:
• Identify and assess the risks of material misstatement of the financial statements, whether due to fraud or error, design and perform audit procedures responsive to those risks, and obtain audit evidence that is sufficient and appropriate to provide a basis for our opinion. The risk of not detecting a material misstatement resulting from fraud is higher than for one resulting from error, as fraud may involve collusion, forgery, intentional omissions, misrepresentations, or the override of internal control.
• Obtain an understanding of internal control relevant to the audit in order to design audit procedures that are appropriate in the circumstances, but not for the purpose of expressing an opinion on the effectiveness of the Company's internal control.
• Evaluate the appropriateness of accounting policies used and the reasonableness of accounting estimates and related disclosures made by management.
• Conclude on the appropriateness of management's use of the going concern basis of accounting and, based on the audit evidence obtained, whether a material uncertainty exists related to events or conditions that may cast significant doubt on the Company's ability to continue as a going concern. If we conclude that a material uncertainty exists, we are required to draw attention in our auditors' report to the related disclosures in the financial statements or, if such disclosures are inadequate, to modify our opinion. Our conclusions are based on the audit evidence obtained up to the date of our auditors' report. However, future events or conditions may cause the Company to cease to continue as a going concern.
• Evaluate the overall presentation, structure and content of the financial statements, including the disclosures, and whether the financial statements represent the underlying transactions and events in a manner that achieves fair presentation.
We communicate with the Board of Directors regarding, among other matters, the planned scope and timing of the audit and significant audit findings, including any significant deficiencies in internal control that we identify during our audit.
We also provide the Board of Directors with a statement that we have complied with relevant ethical requirements regarding independence, and to communicate with them all relationships and other matters that may reasonably be thought to bear on our independence, and where applicable, related safeguards.
From the matters communicated with the Board of Directors, we determine those matters that were of most significance in the audit of the financial statements of the current period and are therefore the key audit matters. We describe these matters in our auditors' report unless law or regulation precludes public disclosure about the matter or when, in extremely rare circumstances, we determine that a matter should not be communicated in our report because the adverse consequences of doing so would reasonably be expected to outweigh the public interest benefits of such communication.
Report on Other Legal and Regulatory Requirements
Based on our audit, we further report that in our opinion:
a) proper books of account have been kept by the Company as required by the Companies Act, 2017 (XIX of 2017);
b) the statement of financial position, the statement of profit or loss and other comprehensive income, the statement of changes in equity and the statement of cash flows together with the notes thereon have been drawn up in conformity with the Companies Act, 2017 (XIX of 2017) and are in agreement with the books of account and returns;
c) investments made, expenditure incurred and guarantees extended during the year were for the purpose of the Company's business; and
d) zakat deductible at source under the Zakat and Ushr Ordinance, 1980 (XVIII of 1980), was deducted by the Company and deposited in the Central Zakat Fund established under section 7 of that Ordinance.
The engagement partner on the audit resulting in this independent auditors' report is Arif Nazeer
Key audit matter How the matter was addressed in our audit
Further, the Company, has also changed its accounting policy relating to presentation and measurement of surplus on revaluation of fixed assets as a consequence of the application of the Act with retrospective effect. The impact of the said change in accounting policy has been disclosed in note 5.5 to the financial statements.
The above changes and enhancements in the financial statements are considered important and a key audit matter because of the volume and significance of the changes in the financial statements resulting from the transition to the new reporting requirements under the Act.
83 Disrupt. Innovate.
Information Other than the Financial Statements and Auditors' Report Thereon
Management is responsible for the other information. The other information comprises the information included in the Annual Report, but does not include the financial statements and our auditors' report thereon.
Our opinion on the financial statements does not cover the other information and we do not express any form of assurance conclusion thereon.
In connection with our audit of the financial statements, our responsibility is to read the other information and, in doing so, consider whether the other information is materially inconsistent with the financial statements or our knowledge obtained in the audit or otherwise appears to be materially misstated. If, based on the work we have performed, we conclude that there is a material misstatement of this other information, we are required to report that fact. We have nothing to report in this regard.
Responsibilities of Management and Board of Directors for the Financial Statements
Management is responsible for the preparation and fair presentation of the financial statements in accordance with the accounting and reporting standards as applicable in Pakistan and the requirements of Companies Act, 2017 (XIX of 2017) and for such internal control as management determines is necessary to enable the preparation of financial statements that are free from material misstatement, whether due to fraud or error.
In preparing the financial statements, management is responsible for assessing the Company's ability to continue as a going concern, disclosing, as applicable, matters related to going concern and using the going concern basis of accounting unless management either intends to liquidate the Company or to cease operations, or has no realistic alternative but to do so.
Board of Directors is responsible for overseeing the Company's financial reporting process.
Auditors' Responsibilities for the Audit of the Financial Statements
Our objectives are to obtain reasonable assurance about whether the financial statements as a whole are free from material misstatement, whether due to fraud or error, and to issue an auditors' report that includes our opinion. Reasonable assurance is a high level of assurance, but is not a guarantee that an audit conducted in accordance with ISAs as applicable in Pakistan will always detect a material misstatement when it exists. Misstatements can arise from fraud or error and are considered material if, individually or in the aggregate, they could reasonably be expected to influence the economic decisions of users taken on the basis of these financial statements
As part of an audit in accordance with ISAs as applicable in Pakistan, we exercise professional judgment and maintain professional skepticism throughout the audit. We also:
• Identify and assess the risks of material misstatement of the financial statements, whether due to fraud or error, design and perform audit procedures responsive to those risks, and obtain audit evidence that is sufficient and appropriate to provide a basis for our opinion. The risk of not detecting a material misstatement resulting from fraud is higher than for one resulting from error, as fraud may involve collusion, forgery, intentional omissions, misrepresentations, or the override of internal control.
• Obtain an understanding of internal control relevant to the audit in order to design audit procedures that are appropriate in the circumstances, but not for the purpose of expressing an opinion on the effectiveness of the Company's internal control.
• Evaluate the appropriateness of accounting policies used and the reasonableness of accounting estimates and related disclosures made by management.
• Conclude on the appropriateness of management's use of the going concern basis of accounting and, based on the audit evidence obtained, whether a material uncertainty exists related to events or conditions that may cast significant doubt on the Company's ability to continue as a going concern. If we conclude that a material uncertainty exists, we are required to draw attention in our auditors' report to the related disclosures in the financial statements or, if such disclosures are inadequate, to modify our opinion. Our conclusions are based on the audit evidence obtained up to the date of our auditors' report. However, future events or conditions may cause the Company to cease to continue as a going concern.
• Evaluate the overall presentation, structure and content of the financial statements, including the disclosures, and whether the financial statements represent the underlying transactions and events in a manner that achieves fair presentation.
We communicate with the Board of Directors regarding, among other matters, the planned scope and timing of the audit and significant audit findings, including any significant deficiencies in internal control that we identify during our audit.
We also provide the Board of Directors with a statement that we have complied with relevant ethical requirements regarding independence, and to communicate with them all relationships and other matters that may reasonably be thought to bear on our independence, and where applicable, related safeguards.
From the matters communicated with the Board of Directors, we determine those matters that were of most significance in the audit of the financial statements of the current period and are therefore the key audit matters. We describe these matters in our auditors' report unless law or regulation precludes public disclosure about the matter or when, in extremely rare circumstances, we determine that a matter should not be communicated in our report because the adverse consequences of doing so would reasonably be expected to outweigh the public interest benefits of such communication.
Report on Other Legal and Regulatory Requirements
Based on our audit, we further report that in our opinion:
a) proper books of account have been kept by the Company as required by the Companies Act, 2017 (XIX of 2017);
b) the statement of financial position, the statement of profit or loss and other comprehensive income, the statement of changes in equity and the statement of cash flows together with the notes thereon have been drawn up in conformity with the Companies Act, 2017 (XIX of 2017) and are in agreement with the books of account and returns;
c) investments made, expenditure incurred and guarantees extended during the year were for the purpose of the Company's business; and
d) zakat deductible at source under the Zakat and Ushr Ordinance, 1980 (XVIII of 1980), was deducted by the Company and deposited in the Central Zakat Fund established under section 7 of that Ordinance.
The engagement partner on the audit resulting in this independent auditors' report is Arif Nazeer

84
Information Other than the Financial Statements and Auditors' Report Thereon
Management is responsible for the other information. The other information comprises the information included in the Annual Report, but does not include the financial statements and our auditors' report thereon.
Our opinion on the financial statements does not cover the other information and we do not express any form of assurance conclusion thereon.
In connection with our audit of the financial statements, our responsibility is to read the other information and, in doing so, consider whether the other information is materially inconsistent with the financial statements or our knowledge obtained in the audit or otherwise appears to be materially misstated. If, based on the work we have performed, we conclude that there is a material misstatement of this other information, we are required to report that fact. We have nothing to report in this regard.
Responsibilities of Management and Board of Directors for the Financial Statements
Management is responsible for the preparation and fair presentation of the financial statements in accordance with the accounting and reporting standards as applicable in Pakistan and the requirements of Companies Act, 2017 (XIX of 2017) and for such internal control as management determines is necessary to enable the preparation of financial statements that are free from material misstatement, whether due to fraud or error.
In preparing the financial statements, management is responsible for assessing the Company's ability to continue as a going concern, disclosing, as applicable, matters related to going concern and using the going concern basis of accounting unless management either intends to liquidate the Company or to cease operations, or has no realistic alternative but to do so.
Board of Directors is responsible for overseeing the Company's financial reporting process.
Auditors' Responsibilities for the Audit of the Financial Statements
Our objectives are to obtain reasonable assurance about whether the financial statements as a whole are free from material misstatement, whether due to fraud or error, and to issue an auditors' report that includes our opinion. Reasonable assurance is a high level of assurance, but is not a guarantee that an audit conducted in accordance with ISAs as applicable in Pakistan will always detect a material misstatement when it exists. Misstatements can arise from fraud or error and are considered material if, individually or in the aggregate, they could reasonably be expected to influence the economic decisions of users taken on the basis of these financial statements
As part of an audit in accordance with ISAs as applicable in Pakistan, we exercise professional judgment and maintain professional skepticism throughout the audit. We also:
• Identify and assess the risks of material misstatement of the financial statements, whether due to fraud or error, design and perform audit procedures responsive to those risks, and obtain audit evidence that is sufficient and appropriate to provide a basis for our opinion. The risk of not detecting a material misstatement resulting from fraud is higher than for one resulting from error, as fraud may involve collusion, forgery, intentional omissions, misrepresentations, or the override of internal control.
• Obtain an understanding of internal control relevant to the audit in order to design audit procedures that are appropriate in the circumstances, but not for the purpose of expressing an opinion on the effectiveness of the Company's internal control.
• Evaluate the appropriateness of accounting policies used and the reasonableness of accounting estimates and related disclosures made by management.
• Conclude on the appropriateness of management's use of the going concern basis of accounting and, based on the audit evidence obtained, whether a material uncertainty exists related to events or conditions that may cast significant doubt on the Company's ability to continue as a going concern. If we conclude that a material uncertainty exists, we are required to draw attention in our auditors' report to the related disclosures in the financial statements or, if such disclosures are inadequate, to modify our opinion. Our conclusions are based on the audit evidence obtained up to the date of our auditors' report. However, future events or conditions may cause the Company to cease to continue as a going concern.
• Evaluate the overall presentation, structure and content of the financial statements, including the disclosures, and whether the financial statements represent the underlying transactions and events in a manner that achieves fair presentation.
We communicate with the Board of Directors regarding, among other matters, the planned scope and timing of the audit and significant audit findings, including any significant deficiencies in internal control that we identify during our audit.
We also provide the Board of Directors with a statement that we have complied with relevant ethical requirements regarding independence, and to communicate with them all relationships and other matters that may reasonably be thought to bear on our independence, and where applicable, related safeguards.
From the matters communicated with the Board of Directors, we determine those matters that were of most significance in the audit of the financial statements of the current period and are therefore the key audit matters. We describe these matters in our auditors' report unless law or regulation precludes public disclosure about the matter or when, in extremely rare circumstances, we determine that a matter should not be communicated in our report because the adverse consequences of doing so would reasonably be expected to outweigh the public interest benefits of such communication.
Report on Other Legal and Regulatory Requirements
Based on our audit, we further report that in our opinion:
a) proper books of account have been kept by the Company as required by the Companies Act, 2017 (XIX of 2017);
b) the statement of financial position, the statement of profit or loss and other comprehensive income, the statement of changes in equity and the statement of cash flows together with the notes thereon have been drawn up in conformity with the Companies Act, 2017 (XIX of 2017) and are in agreement with the books of account and returns;
c) investments made, expenditure incurred and guarantees extended during the year were for the purpose of the Company's business; and
d) zakat deductible at source under the Zakat and Ushr Ordinance, 1980 (XVIII of 1980), was deducted by the Company and deposited in the Central Zakat Fund established under section 7 of that Ordinance.
The engagement partner on the audit resulting in this independent auditors' report is Arif Nazeer
EY Ford RhodesChartered Accountants
Date: 24 September 2018Karachi
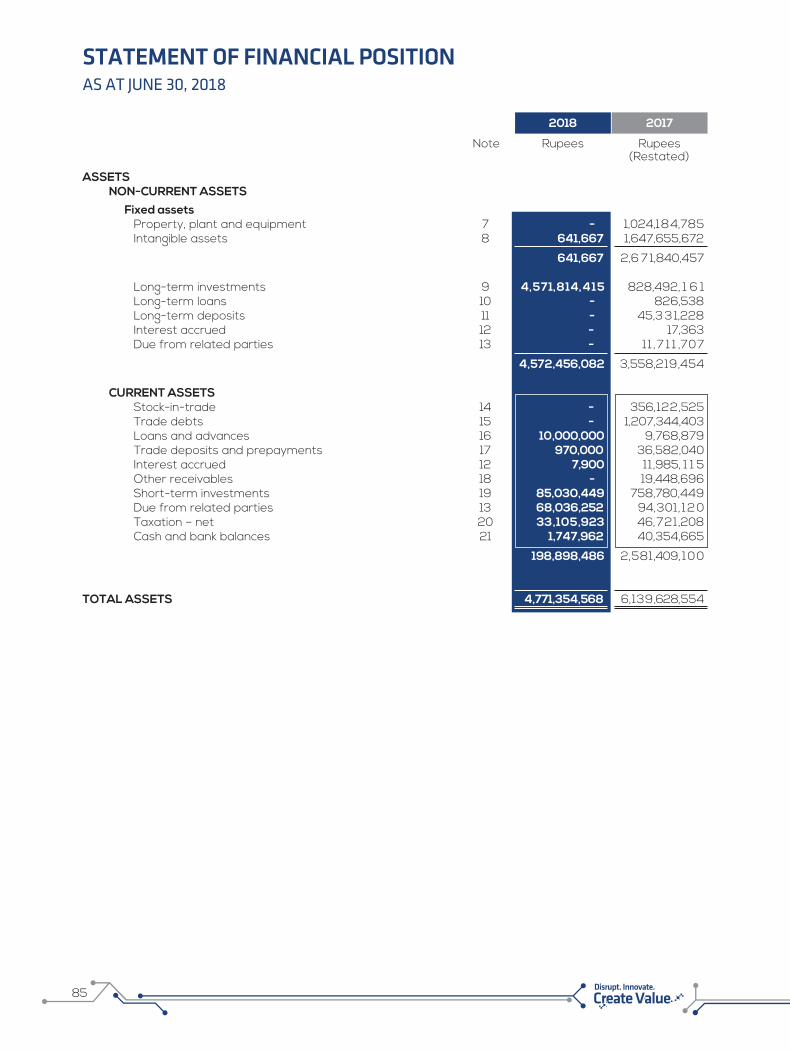
2018 2017
Note Rupees Rupees(Restated)
85 Disrupt. Innovate.
STATEMENT OF FINANCIAL POSITIONAS AT JUNE 30, 2018
ASSETS NON-CURRENT ASSETS Fixed assets Property, plant and equipment 7 - 1,024,184,785 Intangible assets 8 641,667 1,647,655,672
641,667 2,6 7 1,840,457 Long-term investments 9 4,571,814,415 828,492, 1 6 1 Long-term loans 10 - 826,538 Long-term deposits 11 - 45,3 3 1,228 Interest accrued 12 - 17,363 Due from related parties 13 - 1 1 ,7 1 1 ,707
4,572,456,082 3,558,219,454
CURRENT ASSETS Stock-in-trade 14 - 356,122,525 Trade debts 15 - 1,207,344,403 Loans and advances 16 10,000,000 9,768,879 Trade deposits and prepayments 17 970,000 36,582,040 Interest accrued 12 7,900 11 ,985, 1 1 5 Other receivables 18 - 19,448,696 Short-term investments 19 85,030,449 758,780,449 Due from related parties 13 68,036,252 94,301, 120 Taxation – net 20 33,105,923 46,721,208 Cash and bank balances 21 1,747,962 40,354,665
198,898,486 2,581,409, 100
TOTAL ASSETS 4,771,354,568 6,139,628,554

86
STATEMENT OF FINANCIAL POSITIONAS AT JUNE 30, 2018
2018 2017
Note Rupees Rupees(Restated)
EQUITY AND LIABILITIES SHARE CAPITAL AND RESERVES Share capital Authorised 330,000,000 (2017: 230,000,000) ordinary 3,300,000,000 2,300,000,000 shares of Rs.10/- each Issued, subscribed and paid-up capital 22 2,372,977,630 2 , 172,489,630 Capital reserve 60,855,762 - Revenue reserves 689,376,880 789,218,929 Surplus on revaluation of property, plant and equipment - 228,790,596
3,123,210,272 3,190,499, 155 NON-CURRENT LIABILITIES Long-term financing 24 398,226,229 622,968, 7 5 1 Liabilities against assets subject to finance lease 25 - 10,975,935 Deferred income 26 - 2,444,444 Long-term loans 27 - 290,277,330 Deferred tax liability - net 28 - 1 , 1 6 1,733
398,226,229 927,828,193 CURRENT LIABILITIES Trade and other payables 29 4,200,000 513,832,883 Accrued mark-up 30 6,492,426 49,228,099 Short-term financing 31 - 62,238,722 Running finance under mark-up arrangements 32 - 876,719,637 Current portion of non-current liabilities 33 789,477,679 259,892,691 Due to related parties 34 445,000,000 87,748,925 Unclaimed dividend 1,747,962 1,078,801 Unpaid dividend 3,000,000 3,000,000 Advance monitoring fees 35 - 167,561,448
1,249,918,067 2,021,301,206CONTINGENCIES AND COMMITMENTS 36 TOTAL EQUITY AND LIABILITIES 4,771,354,568 6,139,628,554 The annexed notes from 1 to 54 form an integral part of these financial statements.
Chief Executive Chief Financial Officer Director

STATEMENT OF PROFIT OR LOSS AND OTHERCOMPREHENSIVE INCOME
87 Disrupt. Innovate.
FOR THE YEAR ENDED JUNE 30, 20182018 2017
Note Rupees Rupees(Restated)
Turnover - net 37 - 1,506,281,655 Cost of sales and services 38 - (716,495,191) Gross profit - 789,786,464 Distribution expenses 39 - (239,918,365) Administrative expenses 40 (41,079,823) (368,525,475) Operating (loss) / profit (41,079,823) 181,342,624 Other operating expenses 41 - (1,359,659) Finance costs 42 (61,968,477) (149,727,603) Other income 43 7,900 49,093,642 (Loss) / profit before taxation (103,040,400) 79,349,004 Taxation 44 - (22,445,698) (Loss) / profit for the year (103,040,400) 56,903,306 Other comprehensive income Other comprehensive income to be reclassified to profit or loss in subsequent periods (net of tax) Unrealised gain / (loss) on available-for-sale 456,462,566 (14,054,297) investments at fair value Other comprehensive income not to be reclassified to profit or loss in subsequent periods (net of tax) Surplus on revaluation of property, plant and equipment - 229,088,489 Other comprehensive income for the year - net of tax 456,462,566 215,034,192 Total comprehensive income for the year 353,422,166 271,937,498 (Loss) / earnings per share – basic and diluted 45 (0.43) 0.26 The annexed notes from 1 to 54 form an integral part of these financial statements.
Chief Executive Chief Financial Officer Director

88
FOR THE YEAR ENDED JUNE 30, 2018
STATEMENT OF CASH FLOWS
2018 2017
Note Rupees RupeesCASH FLOWS FROM OPERATING ACTIVITIES (Loss) / profit before taxation (103,040,400) 79,349,003 Adjustment for non-cash charges and other items: Depreciation 7.1.1 - 136,247,540 Amortisation 8.1 18,333 50,103,602 Provision for doubtful debts 40 - 17,452,497 Finance costs 42 61,968,477 149,727,603 Gain on disposal of investment in TPL Life Insurance Limited 43 - (18,500,707) Gain on disposal of property, plant and equipment 43 - (3,691,013) Exchange loss – net 41 - 588,438 Deferred income 43 - (2,933,336)
61,986,810 328,994,624
Operating (loss) / profit before working capital changes (41,053,590) 408,343,627 (Increase) / decrease in current assets Stock-in-trade - (118,824,188) Trade debts - (187,202,066) Loans and advances (10,000,000) (473,047) Trade deposits and prepayments (970,000) 261,356 Other receivables - (11,265,299) Interest accrued (7,900) 13,629,077 Due from related parties (65,993,982) 222,324,881
(76,971,882) (81,549,286) Increase / (decrease) in current liabilities Trade and other payables (37,526,269) 155,262,189 Due to related parties 445,000,000 19,589,664 Advance monitoring fees - 62,279,778
Cash flows generated from operations 289,448,259 563,925,972 Payments for: Finance costs (47,760,964) (204,018,549) Income taxes – net 20 - (68,663,762)
(47,760,964) (272,682,31 1)
Net cash flows generated from operating activities 241,687,295 291,243,661
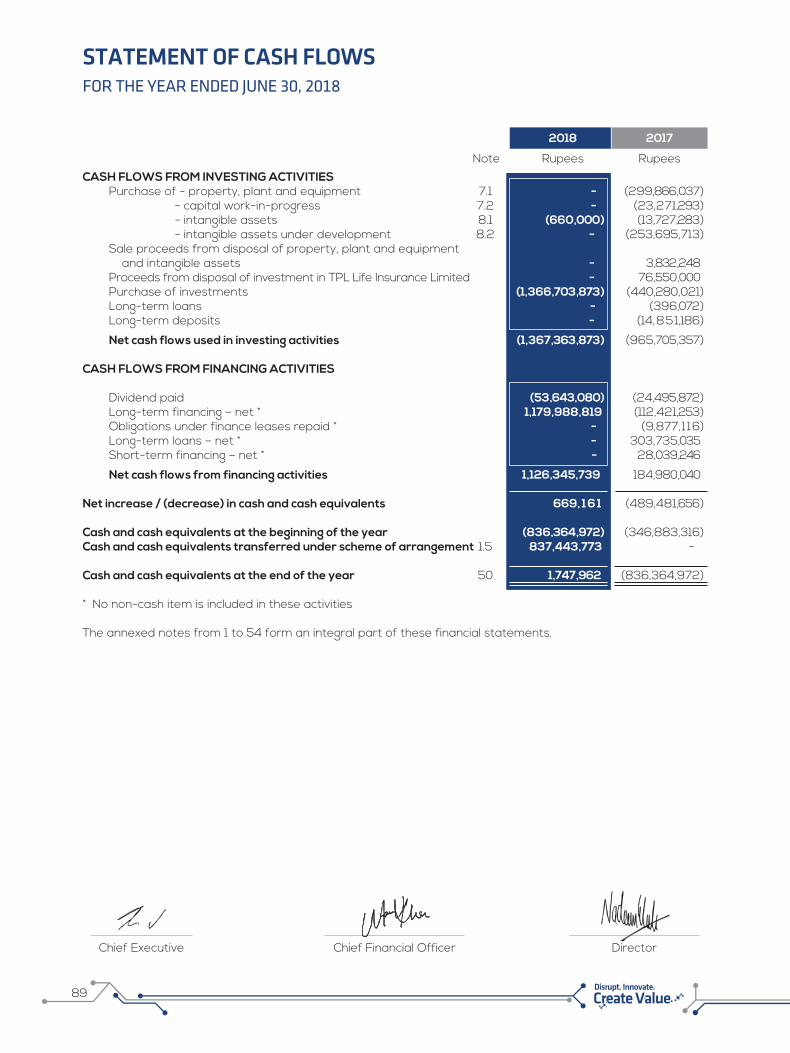
89 Disrupt. Innovate.
FOR THE YEAR ENDED JUNE 30, 2018
STATEMENT OF CASH FLOWS
CASH FLOWS FROM INVESTING ACTIVITIES Purchase of - property, plant and equipment 7.1 - (299,866,037) - capital work-in-progress 7.2 - (23,271,293) - intangible assets 8.1 (660,000) (13,727,283) - intangible assets under development 8.2 - (253,695,713) Sale proceeds from disposal of property, plant and equipment and intangible assets - 3,832,248 Proceeds from disposal of investment in TPL Life Insurance Limited - 76,550,000 Purchase of investments (1,366,703,873) (440,280,021) Long-term loans - (396,072) Long-term deposits - (14,851,186)
Net cash flows used in investing activities (1,367,363,873) (965,705,357) CASH FLOWS FROM FINANCING ACTIVITIES Dividend paid (53,643,080) (24,495,872) Long-term financing – net * 1,179,988,819 (112,421,253) Obligations under finance leases repaid * - (9,877,116) Long-term loans – net * - 303,735,035 Short-term financing – net * - 28,039,246
Net cash flows from financing activities 1,126,345,739 184,980,040 Net increase / (decrease) in cash and cash equivalents 669, 1 6 1 (489,481,656)
Cash and cash equivalents at the beginning of the year (836,364,972) (346,883,316)Cash and cash equivalents transferred under scheme of arrangement 1.5 837,443,773 -
Cash and cash equivalents at the end of the year 50 1,747,962 (836,364,972) * No non-cash item is included in these activities The annexed notes from 1 to 54 form an integral part of these financial statements.
2018 2017
Note Rupees Rupees
Chief Executive Chief Financial Officer Director

90
FOR THE YEAR ENDED JUNE 30, 2018
STATEMENT OF CHANGES IN EQUITY
Balance as at July 1, 2016 2,172,489,630 - 687,918,808 83,727,893 - 771,646,701 2,944,136,331 Profit for the year - - 56,903,305 - - 56,903,305 56,903,305 Other comprehensive income / (loss) for the year, net of tax - - - (14,054,297) 229,088,489 215,034,192 215,034,192
Total comprehensive income for the year - - 56,903,305 (14,054,297) 229,088,489 271,937,497 271,937,497 Final dividend for the year ended June 30, 2016 @ Re.0.25 per share - - (25,574,673) - - (25,574,673) (25,574,673) Surplus on revaluation of property and equipment realised: - on account of incremental depreciation charged on related assets for the year (note 23) - - 425,561 - (425,561) - - - deferred tax thereon - - (127,668) - 127,668 - - - - 297,893 - (297,893) - - Balance as at June 30, 2017 - restated (note 5.5) 2,172,489,630 - 719,545,333 69,673,596 228,790,596 1,018,009,525 3,190,499,155 Reserves transferred under Scheme of Arrangement (note 1.5) - - (398,951,974) - (228,790,596) (627,742,570) (627,742,570)
Balance as at July 01, 2017 2,172,489,630 - 320,593,359 69,673,596 - 390,266,955 2,562,756,585 Reserve arising as a consequence of Scheme of Arrangement (note 1.5) - 60,855,762 - - - 60,855,762 60,855,762 Issuance of ordinary shares (notes 1.5 & 22.2) 200,488,000 - - - - - 200,488,000 Loss for the year - - (103,040,400) - - (103,040,400) (103,040,400) Other comprehensive income for the year, net of tax - - - 456,462,566 - 456,462,566 456,462,566 Total comprehensive (loss) / income for the year - - (103,040,400) 456,462,566 - 353,422,166 353,422,166 Final dividend for the year ended June 30, 2017 @ Re.0.25 per share - - (54,312,241) - - (54,312,241) (54,312,241) Balance as at June 30, 2018 2,372,977,630 60,855,762 163,240,718 526,136,162 - 750,232,642 3,123,210,272 The annexed notes from 1 to 54 form an integral part of these financial statements.
Issued, subscribed
and paid-up capital
Reserve created under
Scheme of Arrangement
(note 1.5)Unappropriat
ed profitAvailable for sale reserve
Surplus on revaluation of
property, plant and equipment(notes 5.5 & 23)
Total reserves
----------------------------------------------------------------------------------------- Rupees ----------------------------------------------------------------------------------------
Total Equity
Capital reserve Revenue reserves
Chief Executive Chief Financial Officer Director

FOR THE YEAR ENDED JUNE 30, 2018
NOTES TO THE FINANCIAL STATEMENTS
91 Disrupt. Innovate.
1. LEGAL STATUS AND OPERATIONS 1.1 TPL Trakker Limited (the Company) was incorporated in Pakistan on December 04, 2008 as a private
limited company under the repealed Companies Ordinance, 1984 (now Companies Act, 2017). In year 2009, the Company was converted into a public company and got listed on Pakistan Stock Exchange Limited on July 16, 2012. During the year, the name of the Company has been changed to TPL Corp Limited with effect from 24 November 2017. The registered office of the Company is situated at Centrepoint Building, Off Shaheed-e-Millat Expressway, Near KPT Interchange Flyover, Karachi. Currently, the principal activity of the Company is to make investment in group and other companies.
Geographical location and addresses of business units are as under: 1.2 Location Address Corporate office, Karachi 12th and 13th Floor, Centrepoint, Off Shaheed-e-Millat Expressway,
Adjacent KPT Interchange, Karachi. Regional offices: Karachi office 20-B, Block 6, P.E.C.H.S., Karachi. Hyderabad office A-8 District Council Complex, Hyderabad. Lahore office 51-M, Denim Road, Quaid-e-Azam Industrial Estate, Kot Lakhpat, Lahore. Islamabad office 10th Floor (South) ISE Towers, 55-B, Jinnah Avenue, Blue Area, Islamabad. Faisalabad office P6161, West Canal road, Adjacent to Toyota Faisalabad Motors, Faisalabad.
Multan office House No. 5, Suraj Miani Road, Opp. Ashraf Cardiac Clinic, Chungi No. 1, Multan. Peshawar office C-7 & C-8 3rd Floor, Jasmine Arcade, Fakhr-e-Alam Road, Peshawar. 1.3 TPL Holdings (Private) Limited is the parent company, which holds 135,244,574 (2017: 114,950,274)
ordinary shares of the Company representing 56.99 percent (2017: 52.91 percent) shareholding as of the reporting date.
1.4 During the year, the authorised share capital of the Company has been increased from 230,000,000
ordinary shares to 330,000,000 ordinary shares having face value of Rs.10 each. 1.5 During the year, the Scheme of Arrangement (the Scheme) was executed on July 01, 2017 among the
Company, TPL Maps (Pvt.) Limited [TMPL], TPL Trakker Limited (formerly known as TPL Vehicle Tracking (Private) Limited) [TTL] and TPL Holdings (Private) Limited [THPL] for:
- separating / demerging of the Company’s Maps Undertaking and Trakker Undertaking and merging
and amalgamating the same with and into TMPL and TTL against the issue of shares by respective entities to the Company; and
- separating / demerging the Properties Undertaking (i.e. 21,104,000 ordinary shares of TPL Properties
Limited (TPLP) having face value of Rs.10 each) from THPL and merging and amalgamating the same with and into the Company, against the issue of shares of the Company to THPL, along with all ancillary matters.
The shareholders of the Company in their extra ordinary general meeting held on April 14, 2017 approved
the Scheme under Sections 284 to 288 of the repealed Companies Ordinance, 1984 (now Companies Act, 2017). The Scheme was sanctioned / approved by the Honorable High Court of Sindh vide its order number J.C.M. Petition No.48 of 2016 dated November 17, 2017 and in accordance therewith, the effective date of Scheme was July 01, 2017. Accordingly:

As at June 30, Maps Trakker Retained Note 2017 Undertaking Undertaking Undertaking
(Rupees) (Rupees) (Rupees) (Rupees) ASSETS NON - CURRENT ASSETS Fixed assets Property, plant and equipment 7 1,024,184,785 3,442,032 1,020,742,753 - Intangible assets 8 1,647,655,672 490,165,515 1,157,490,157 -
2,671,840,457 493,607,547 2,178,232,910 - Long-term investments 9 828,492,161 - - 828,492,161 Long-term loans 10 826,538 - 826,538 - Long-term deposits 11 45,331,228 140,000 45,191,228 - Interest accrued 12 17,363 - 17,363 - Due from related parties 13 11,711,707 - 11,711,707 -
3,558,219,454 493,747,547 2,235,979,746 828,492,161 CURRENT ASSETS Stock-in-trade 14 356,122,525 59,660 356,062,865 - Trade debts 15 1,207,344,403 28,100,677 1,179,243,726 - Loans and advances 16 9,768,879 - 9,768,879 - Trade deposits and prepayments 17 36,582,040 398,282 36,183,758 - Interest accrued 12 11,985,115 - 11,985,115 - Other receivables 18 19,448,696 - 19,448,696 - Short-term investments 19 758,780,449 - - 758,780,449 Due from related parties 13 94,301,120 - 92,258,850 2,042,270 Taxation – net 20 46,721,208 - - 46,721,208 Cash and bank balances 21 40,354,665 - 39,275,864 1,078,801
2,581,409,100 28,558,619 1,744,227,753 808,622,728 Total assets 6,139,628,554 522,306,166 3,980,207,499 1,637,114,889
92
a) the undertaking comprising the assets, liabilities and obligations of the Company shall be split into three (03) separate segments i.e. Maps Undertaking (i.e. maps and navigation), Trakker Undertaking (i.e. trakker / vehicle tracking services) and the Retained Undertaking (i.e. investments, etc).
b) the segment comprising all the assets, liabilities and obligations of the Maps Undertaking shall be carved out and, as at the effective date, stand merged with, transferred to, vested in, and be assumed by TMPL and ordinary shares of TMPL at par shall be issued to the Company.
c) the segment comprising all the assets, liabilities and obligations of the Trakker Undertaking shall be
carved out and, as at the effective date, stand merged with, transferred to, vested in, and be assumed by TTL and ordinary shares of TTL at par shall be issued to the Company.
d) upon the merger and transfer of the Maps and Trakker Undertakings to TMPL and TTL in the manner prescribed under the Scheme, the Company shall continue to own and operate the Retained Undertaking, TMPL and TTL shall own and operate the Maps and Trakker Undertaking respectively, each as independent companies without any company being wound up.
e) the assets, liabilities and obligations of THPL shall be split into two separate segments i.e. Properties Undertaking and Holdings Undertaking and accordingly, the Properties Undertaking shall be carved out and, as at the effective date, stand merged with, transferred to vested in, and be assumed by the Company. As consideration, the 20,048,800 ordinary shares of the Company at par shall be issued to THPL in a swap ratio of 0.95 of the Company shares for every one (01) shares of TPLP (note 22.2).
f) the carrying values of assets and liabilities of Maps and Trakker Undertakings transferred to TMPL and TTL, consequent to the Scheme, as of effective date i.e. July 01, 2017 are as follows:
FOR THE YEAR ENDED JUNE 30, 2018
NOTES TO THE FINANCIAL STATEMENTS

93 Disrupt. Innovate.
As at June 30, Maps Trakker Retained Note 2017 Undertaking Undertaking Undertaking
(Rupees) (Rupees) (Rupees) (Rupees)
NON-CURRENT LIABILITIES Long-term financing 24 622,968,751 - 622,968,751 - Liabilities against assets subject to finance lease 25 10,975,935 10,975,935 - - Deferred income 26 2,444,444 - 2,444,444 - Long-term loans 27 290,277,330 - 290,277,330 - Deferred tax liability - net 28 1,161,733 - 1,161,733 -
927,828,193 - 927,828,193 - CURRENT LIABILITIES Trade and other payables 29 517,911,684 13,040,754 445,450,574 59,420,356 Accrued mark-up 30 49,228,099 - 49,228,099 - Short term financing 31 62,238,722 - 62,238,722 - Running finance under mark-up arrangements 32 876,719,637 - 876,719,637 - Current portion of non-current liabilities 33 259,892,691 - 259,892,691 - Due to related parties 34 87,748,925 - 87,748,925 - Advance monitoring fees 35 167,561,448 - 167,561,448 -
2,021,301,206 13,040,754 1,948,840,096 59,420,356 Total liabilities 2,949,129,399 13,040,754 2,876,668,289 59,420,356 Net assets before reserves 3,190,499,155 509,265,412 1,103,539,210 1,577,694,533 Revenue reserves - unappropriated profit 789,218,929 125,974,614 272,977,360 390,266,955 Surplus on revaluation of property, plant and equipment 23 228,790,596 - 228,790,596 - Net assets transferred 2,172,489,630 383,290,798 601,771,254 1,187,427,578 1.6 These financial statements are the separate financial statements of the Company, in which
investments in the below mentioned subsidiaries and associates have been accounted for at fair value and cost less accumulated impairment losses, if any, respectively. As of reporting date, the Company has the following subsidiaries and associates:
% of shareholding
2018 2017 Subsidiaries TPL Insurance Limited [TIL] - (note 9.1) 93.51 - TPL Properties Limited [TPLP] - (note 9.2) 29.62 20.11 Centrepoint Management Services (Private) Limited (sub-subsidiary) [CMS] 29.62* 20.11* HKC Limited (sub-subsidiary) [HKC] 29.62* 20.11* G-18 (Private) Limited (sub-subsidiary) [G-18] 29.62* - TPL Life Insurance Limited [TPL Life] - (note 9.3) 86.43 86.02 TPL Maps (Pvt.) Limited [TMPL] - (note 9.4) 100 100 TPL Trakker Limited [TTL] - (note 9.5) 100 100 TPL Security Services (Private) Limited [TSS] - (note 9.6) 99.9 99.9 TPL Rupiya (Private) Limited [TRPL] - (note 9.7) 99.9 - Associates TPL Insurance Limited [TIL] - (note 9.1) - 24.39 Trakker Middle East LLC [TME] – (note 19.1) 29 29 * Represents direct holding of TPLP as at the reporting date.
FOR THE YEAR ENDED JUNE 30, 2018
NOTES TO THE FINANCIAL STATEMENTS
94
2. SUMMARY OF SIGNIFICANT TRANSACTIONS AND EVENTS Following is the summary of significant transaction and events that have affected the Company's
financial position and performance of the Company:
a) Transferred businesses to TMPL and TTL and acquisition of additional investment of TPLP under the Scheme of Arrangement - note 1.5.
b) Acquisition of additional shares of TPL Insurance Limited - note 9.1. c) Issue of term finance certificates - note 24. d) Adoption of Companies Act, 2017 - note 3. 3. STATEMENT OF COMPLIANCE These financial statements have been prepared in accordance with the accounting and reporting
standards as applicable in Pakistan. The accounting and reporting standards applicable in Pakistan comprise of International Financial Reporting Standards (IFRSs), issued by International Accounting Standard Board (IASB) as notified under Companies Act, 2017 (the Act) and, provisions of and directives issued under the Act. Where the provisions of and directives issued under the Act differ from the IFRSs, the provisions of and directives issued under the Act have been followed.
The Act has also brought certain changes with regard to the preparation and presentation of these financial statements. These changes, amongst others, included change in nomenclature of primary statements and change in respect of presentation and measurement of surplus on revaluation of property, plant and equipment (note 5.5). Further, the disclosure requirements contained in the Fourth Schedule of the Act have been revised, resulting in elimination of duplicative disclosure with the IFRSs disclosure requirements and incorporation of additional amended disclosures including, but not limited to, particulars of immovable assets of the Company (note 7.1.6), management assessment of sufficiency of tax provision in the financial statements (note 44.2), change in threshold for identification of executives (notes 10 and 47), additional disclosure requirements for related parties (notes 6 and 48) etc.
4. BASIS OF PREPARATION These financial statements have been prepared under the ‘historical cost’ convention, unless otherwise
specifically stated.
5. SUMMARY OF SIGNIFICANT ACCOUNTING POLICIES 5.1 Standards, amendments and interpretations adopted during the year The accounting policies adopted in the preparation of these financial statements are consistent with
those of the previous financial year except as stated below: Amended Standards The Company has adopted the following amended standards which became effective for the current year: IAS 7 Statement of Cash Flows - Disclosure Initiative - (Amendment) IAS 12 Income Taxes - Recognition of Deferred Tax Assets for Unrealised losses (Amendments) The adoption of the above amendments to accounting standards did not have any material effect on
these financial statements.
FOR THE YEAR ENDED JUNE 30, 2018
NOTES TO THE FINANCIAL STATEMENTS

95 Disrupt. Innovate.
5.2 Significant accounting judgments, estimates and assumptions The preparation of financial statements in conformity with accounting and reporting standards requires
the use of certain critical accounting estimates. It also requires management to exercise its judgments in the process of applying the Company’s accounting policies. Judgments, estimates and assumptions are continually evaluated and are based on historic experience and other factors, including expectations of future events that are believed to be reasonable under the circumstances. Revisions to accounting estimates are recognised in the period in which the estimate is revised and in any future periods affected.
In the process of applying the Company’s accounting policies, management has made the following
judgments, estimates and assumptions which are significant to these financial statements:
a) Investment in subsidiaries The Company value its investment in subsidiaries at fair value using fair value hierachy; Level 1 - quoted
prices (unadjusted) in active markets, Level 2 - valuations based on directly or indirectly observable market input and Level 3 - valuations based on unobservable market input. The Company deterimines whether objective evidence of impairment exists for individual investments. In these cases, the difference between amortised cost and fair value is transferred from other comprehensive income to the profit or loss. In addition, the determination of fair value of unquoted subsidiaries involves inherent subjectivity, key assumptions (such as future cash flow forecasts, discount and growth rates and volatility), and estimation relation to valuation inputs and techniques. Any change in these assumptions and estimates may have significant impact on the fair value of investments with corresponding impact in other comprehensive income.
b) Recognition of tax and deferred tax The provision for taxation is accounted for by the Company after taking into account the relevant laws and
decisions taken by appellate authorities. Instances, where the Company's view differs from the view taken by the tax authorities at the assessment stage and where the Company considers that its view on items of material nature is in accordance with law, the amounts are shown as contingent liabilities / assets.
Other areas where judgments, estimates and assumptions involved are disclosed in respective notes to
these financial statements. 5.3 Property, plant and equipment
5.3.1 Owned Property, plant and equipment (except for leasehold land and buildings on leasehold land) are
stated at cost less accumulated depreciation and impairment losses, if any. Leasehold land and buildings on leasehold land are stated at revalued amounts, which are the fair value at the date of revaluation. Subsequently, these are stated at revalued amounts less subsequent accumulated depreciation and subsequent impairment losses, if any. Depreciation is charged to profit or loss applying the straight-line method. Depreciation on additions during the year is charged from the month of addition when the asset is available for use, whereas, depreciation on disposals is charged upto the month in which the disposal takes place.
Rates of depreciation which are disclosed in note 7.1 to these financial statements are designed
to write-off the cost over the estimated useful lives of the assets. Major renewals and improvements for assets are capitalised and the assets so replaced, if any,
are retired. Maintenance and normal repairs are charged to profit or loss, as and when incurred. Assets residual values, useful lives and method of depreciation are reviewed and adjusted, if
appropriate at each reporting date. An asset’s carrying amount is written down immediately to its recoverable amount if the asset’s carrying amount is greater than its estimated recoverable amount.
FOR THE YEAR ENDED JUNE 30, 2018
NOTES TO THE FINANCIAL STATEMENTS
96
Valuations are performed frequently enough to ensure that the fair value of a revalued asset does not differ materially from its carrying amount at the reporting date. Accumulated depreciation at the date of the revaluation is eliminated against the gross carrying amount of the asset and the net amount restated to the revalued amount of the asset.
An item of property, plant and equipment is derecognised upon disposal or when no future
economic benefits are expected to arise from the continued use of the asset. Gains or losses on disposal or retirement of an asset represented by the difference between the sale proceeds and the carrying amount of the asset is charged to profit or loss.
5.3.2 Capital work-in-progress Capital work-in-progress is stated at cost less accumulated impairment losses, if any, and
consists of expenditure incurred and advances made in respect of operating fixed assets in the course of their acquisition, erection, construction and installation. The assets are transferred to relevant category of operating fixed assets when they are available for use.
5.3.3 Leased Finance leases, which transfer to the Company, all the risks and benefits incidental to ownership
of leased items are capitalised at the inception of lease. Assets subject to finance lease are initially recorded at the lower of the present value of minimum lease payments under the lease agreements and the fair value of the leased assets. The related obligation under the lease less financial charges allocated to future period are shown as a liability. Income arising from sale and leaseback transactions, if any, is deferred and is amortised equally over the lease period.
Financial charges are calculated at the interest rate implicit in the lease and are charged to profit or loss. Leased assets are depreciated on a straight line basis at the same rate as Company's owned assets as disclosed in note 7.1 to these financial statements.
5.4 Intangibe assets Intangible assets other than goodwill, customers related intangible assets and marketing related
intangible assets are stated at cost less accumulated amortisation and accumulated impairment losses, if any. Goodwill, customers related intangible assets and marketing related intangible assets are stated at cost less accumulated impairment losses, if any, as their useful life is indefinite and are tested for impairment annually. For other intangibles, amortisation is charged to the profit or loss applying the straight line method, whereby, the cost of intangible asset is written off over its useful economic life. The amortisation rate of the intangible assets are stated in note 8.1 to these financial statements. Full month's amortisation is charged in the month of addition when the asset is available for use, whereas, amortisation on disposals is charged upto the month in which the disposal takes place.
5.4.1 Intangible assets under development Intangible assets under development are stated at cost less accumulated impairment losses, if
any, and consists of expenditure incurred and advances made in respect of intangible assets under developement in the course of their acquisition, erection, development and installation. The assets are transferred to relevant category of intangible assets when they are available for use
5.4.2 Business combinations and Goodwill The Company uses acquisition method of accounting for acquisition of assets or class of assets,
whereby, the purchase consideration is allocated to the identifiable assets, liabilities and contingent liabilities assumed based on the fair value at the date of acquisition. Acquisition related costs are expensed as incurred and included in administrative expenses.
FOR THE YEAR ENDED JUNE 30, 2018
NOTES TO THE FINANCIAL STATEMENTS

97 Disrupt. Innovate.
Goodwill is initially measured at the acquisition date, being the excess of:
a) the aggregate of consideration transferred, the amount of any non-controlling interest in the acquiree and in a business combination achieved in stages, the acquisition date fair value of the previously held equity interest in the acquiree; and
b) the net of the acquisition date amounts of the identifiable assets acquired and the liabilities
assumed.
In case the fair value attributable to the Company’s interest in the identifiable net assets exceeds the fair value of consideration, the Company recognises the resulting gain in the statement of profit and loss on the acquisition date.
Goodwill acquired in a business combination is measured subsequent to initial recognition, at cost
less accumulated impairment losses, if any, and is tested annually or whenever, there is an indication of impairment. Impairment loss in respect of goodwill is recognised in profit or loss.
5.5 Surplus on revaluation of property, plant and equipment A revaluation surplus is recorded in other comprehensive income and credited to the asset revaluation
surplus in equity. However, to the extent that it reverses a revaluation deficit of the same asset previously recognised in profit or loss, the increase is recognised in profit or loss. A revaluation deficit is recognised in the statement of profit or loss, except to the extent that it offsets an existing surplus on the same asset recognised in the asset revaluation surplus.
An annual transfer from the asset revaluation surplus to unappropriated profit is made for the
difference between depreciation based on the revalued carrying amount of the asset and depreciation based on the asset’s original cost. Additionally, accumulated depreciation as at the revaluation date is eliminated against the gross carrying amount of the asset and the net amount is restated to the revalued amount of the asset. Upon disposal, any revaluation surplus relating to the particular asset being sold is transferred to unappropriated profit.
During the year, the Company has changed its accounting policy for presentation and measurement of
surplus on revaluation of property, plant and equipment, due to adoption of the Companies Act, 2017 (the Act), which became applicable for the first time for the preparation of the Company's annual financial statements for the year ended June 30, 2018. The above change in the accounting policy has been applied retrospectively and comparative information have been restated in accordance with the requirement of International Accounting Standard (lAS) 16 ‘Property, Plant and Equipment’ and lAS 8 ‘Accounting Policies, Changes in Accounting Estimates and Errors. There is no impact of this change in accounting policy on the financial statements prior to 2017. Accordingly, the Company has not presented its statement of financial position as at the beginning of the earliest comparative period i.e., July 01, 2016, and related notes in accordance with requirement of lAS 1 ‘Presentation of Financial Statements’ (Revised) (lAS 1). Had the accounting policy not been changed, the surplus on revaluation of property, plant and equipment would have been shown as a separate line item below equity in the statement of financial position amounting to Rs.228.791 million for the year ended 30 June 2017.
5.6 Investments The management of the Company determines the appropriate classification of its investments at the
time of purchase.
5.6.1 Investments in subsidiaries Investment in subsidiaries are stated at fair value (note 5.6.4). 5.6.2 Investments in associates Investments in associates are stated at cost less accumulated impairment losses, if any, in the value of
FOR THE YEAR ENDED JUNE 30, 2018
NOTES TO THE FINANCIAL STATEMENTS

98
such investments. A reversal of impairment loss on associates is recognised as it arises provided the increased carrying value does not exceed cost.
5.6.3 At fair value through profit or loss Financial assets at fair value through profit or loss include financial assets held-for-trading and
financial assets designated upon initial recognition at fair value through profit or loss. Financial instruments are classified as held-for-trading if they are acquired for the purpose of selling and repurchasing in near term. Held-for-trading assets are acquired principally for the purpose of generating profit from short-term fluctuations in price. Financial instruments are designated at fair value through profit or loss, if the Company manages such investments and makes sales and purchase decision based on their fair value in accordance with the Company’s investment strategy.
All investments classified as investments at fair value through profit or loss are initially measured at cost being fair value of consideration given. All transaction costs are recognised directly in profit or loss. At subsequent dates, these investments are measured at fair value, determined on the basis of prevailing market prices, with any resulting gain or loss recognised directly in the profit or loss.
5.6.4 Available-for-sale Investments intended to be held for an indefinite period of time which may be sold in response to
need for liquidity or changes in market conditions are classified as available-for-sale. At initial recognition, available-for-sale investments are measured at fair value plus directly attributable transaction costs.
After initial recognition, investments which are classified as available-for-sale are measured at
fair value with unrealised gains or losses recognised in other comprehensive income in the available-for-sale reserve until, the investment is sold, derecognised or is determined to be impaired, at which time the cumulative gain or loss is reclassified to the profit or loss and removed from the available-for-sale reserve.
The fair value of those investments representing listed equity and other securities i.e. debt instruments are determined on the basis of year-end bid prices obtained from stock exchange quotations and quotes from brokers.
5.7 Impairment
5.7.1 Financial assets The Company assesses at each reporting date whether there is any objective evidence that a
financial asset or a group of financial assets is impaired. A financial asset or a group of financial assets is deemed to be impaired if, and only if, there is objective evidence of impairment as a result of one or more events that has occurred after the initial recognition of the asset (an incurred ‘loss event’) and that loss event has an impact on the estimated future cash flows of the financial asset or the group of financial assets that can be reliably estimated. Any impairment losses on financial assets including financial assets carried at amortised cost are recognised in profit or loss.
5.7.2 Non-financial assets, goodwill and investments in subsidiaries and associates The Company assesses at each reporting date whether there is an indication that an asset may
be impaired. If any indication exists, or when annual impairment testing for an asset is required, the Company estimates the asset’s recoverable amount. An asset’s recoverable amount is the higher of an asset’s fair value less costs to sell and its value in use. Where the carrying amount of an asset exceeds its recoverable amount, the asset is considered impaired and is written down to its recoverable amount.
FOR THE YEAR ENDED JUNE 30, 2018
NOTES TO THE FINANCIAL STATEMENTS

99 Disrupt. Innovate.
In assessing value in use, the estimated future cash flows are discounted to their present value using a pre-tax discount rate that reflects current market assessments of the time value of money and the risks specific to the asset. The fair value less costs to sell calculation is based on available data from binding sales transactions, conducted at arm’s length, for similar assets or observable market prices less incremental costs to sell of the asset.
In determining fair value less costs to sell, the recent market transactions are taken into account.
If no such transactions can be identified, an appropriate valuation model is used. These calculations are corroborated by valuation multiples, quoted share prices for publicly traded companies or other fair value indicators.
Goodwill is tested for impairment annually at year end and when the circumstances indicate that
the carrying value may be impaired. Impairment is determined for goodwill by assessing the recoverable amount of each cash generating unit (CGU) or group of CGUs to which the goodwill relates. When the recoverable amount of CGU is less than its carrying amount, an impairment loss is recognised.
Intangible assets with indefinite useful lives are tested for impairment annually at year end either
individually or at the CGU level, as appropriate, and when circumstances indicate that the carrying value may be impaired.
For assets excluding goodwill, an assessment is made at each reporting date as to whether there
is any indication that previously recognised impairment losses may no longer exist or may have decreased. If such indication exists, the Company estimates the asset’s recoverable amount.
A previously recognised impairment loss is reversed only if there has been a change in the
assumptions used to determine the asset’s recoverable amount since the last impairment loss was recognised. The reversal is limited so that the carrying amount of the asset does not exceed its recoverable amount, nor exceed the carrying amount that would have been determined, net of depreciation, had no impairment loss been recognised for the asset in prior years. Such reversal is recognised in the profit or loss.
Impairment losses relating to goodwill are not reversed in future periods.
5.8 Stock-in-trade Stock-in-trade is valued at the lower of cost, determined on a first-in-first-out basis and net realisable
value. Items in transit are valued at cost comprising invoice value plus other charges incurred thereon.
Spare parts and loose tools are valued at lower of weighted average cost and net realisable value, except items in transit, which are stated at cost. Spare parts and loose tools are charged to cost of goods sold on an estimated consumption pattern.
Net realisable value is the estimated selling price in the ordinary course of business less estimated costs
of completion and estimated costs necessarily to be incurred to make the sale. 5.9 Trade debts and other receivables Trade debts originated by the Company are recognised and carried at original invoice amount less
provision for doubtful debts, if any. An estimated provision for doubtful debt is made when collection of the full amount is no longer probable. No provision is made in respect of the active customers which are considered good. Bad debts are written-off, as and when identified.
Other receivables and receivables from related parties are recognised and carried at cost which is the fair value of the consideration to be received in the future for goods and services.
FOR THE YEAR ENDED JUNE 30, 2018
NOTES TO THE FINANCIAL STATEMENTS
100
5.10 Cash and cash equivalents Cash and cash equivalents are stated at cost and are defined as cash in hand, cash at banks and
short-term highly liquid investments that are readily convertible to known amounts of cash and subject to insignificant risk of changes in value. For the purpose of cash flow statement, cash and cash equivalents comprise bank balances including short-term deposits net of book overdraft, if any.
5.11 Staff retirement benefits - Defined contribution plan The Company operates a recognised provident fund (defined contribution scheme) for its permanent
employees who have completed the minimum qualifying period of service. Equal monthly contributions are made, both by the Company and the employees at the rate of 8.33 percent of the basic salary. The contribution of the Company for the year is charged to the profit or loss.
5.12 Taxation Current Provision for current taxation is computed on taxable income at the current rates of taxation, after taking into
account tax credits and rebates available, if any, in accordance with the provision of the Income Tax Ordinance, 2001. It also includes any adjustment to tax payable in respect of prior years. However, for income covered under final tax regime, taxation is based on applicable tax rates under such regime.
Deferred Deferred tax is recognised using the balance sheet method, on all temporary differences arising at the
reporting date between the tax bases of assets and liabilities and their carrying amounts for financial reporting purposes.
Deferred tax liabilities are recognised for all taxable temporary differences, while deferred tax assets are recognised for all deductible temporary differences, carry-forward of unused tax losses and unused tax credits, to the extent that it is probable that taxable profit will be available against which the deductible temporary differences, carry forwards of unused tax losses and unused tax credits can be utilised.
The carrying amount of deferred tax assets is reviewed at each reporting date and reduced to the extent that it is no longer probable that sufficient taxable profit will be available to allow all or part of the deferred tax asset to be utilised. Unrecognised deferred tax assets are reassessed at each reporting date and are recognised to the extent that it has become probable that future taxable profits will allow deferred tax asset to be recovered.
Deferred tax assets and liabilities are measured at the tax rates that are expected to apply to the period
when the asset is realised or the liability is settled, based on tax rates (and tax laws) that have been enacted or substantially enacted at the reporting date. Deferred tax is charged or credited to the profit or loss.
Deferred tax relating to items recognised directly in the other comprehensive income is recognised in the
other comprehensive income and not in profit or loss. Deferred tax assets and deferred tax liabilities are offset only if there is a legally enforceable right to
offset current tax assets and liabilities and they relate to the income tax levied by the same tax authority.
5.13 Trade and other payables Liabilities for trade and other payables are carried at cost which is the fair value of the consideration to
be paid in the future for goods and services received, whether or not billed to the Company.
FOR THE YEAR ENDED JUNE 30, 2018
NOTES TO THE FINANCIAL STATEMENTS
101 Disrupt. Innovate.
5.14 Provisions Provisions are recognised when the Company has a present (legal or constructive) obligation as a result
of past events and it is probable that an outflow of resources embodying economic benefits will be required to settle the obligation and a reliable estimate of the obligation can be made. Provisions are reviewed at each reporting date and accordingly adjusted to reflect current best estimates.
5.15 Operating leases / Ijarah agreements Leases, where a significant portion of the risks and rewards of ownership are retained by the lessor, are
classified as operating lease. Payments made under operating leases (net of any incentives received from the lessor) / ijarah agreements are charged to the profit or loss on a straight line basis over the lease / ijarah term.
5.16 Revenue recognition Revenue is recognised to the extent that it is probable that the economic benefits will flow to the
Company and the revenue can be reliably measured, regardless of when the payment is being made. Revenue is measured at fair value of the consideration received or receivable, excluding discounts, rebates, and sales tax or duty. The Company assesses its revenue arrangements against specific criteria in order to determine if it is acting as a principal or an agent. The Company has concluded that it is acting as a principal in all its revenue arrangements. The following are the specific recognition criteria that must be met before revenue is recognised:
- Revenue from sales is recognised when goods are installed. - Monitoring fees, equipment rental and other service charges are recorded on accrual basis. - Income on bank accounts is recorded using effective interest rate. - Dividend income is recognised when the right to receive the dividend is established. - Other income, if any, is recognised on accrual basis. 5.17 Foreign currency translation Transactions in foreign currencies are translated into Pakistani Rupee at the rate ruling at the date of the
transaction. Monetary assets and liabilities denominated in foreign currencies are retranslated at the exchange rate ruling at the reporting date. Exchange gains and losses are recognised in statement of profit and loss. Non-monetary items that are measured in terms of historical cost in a foreign currency are translated using the exchange rates as at the dates of the initial transactions. Non-monetary items measured at fair value in a foreign currency are translated using the exchange rates at the date when the fair value was determined.
5.18 Financial instruments All the financial assets and financial liabilities are recognised at the time when the Company becomes a
party to the contractual provisions of the instrument. All financial assets are derecognised at the time when the Company loses control of the contractual rights that comprise the financial assets. All financial liabilities are derecognised at the time when they are extinguished that is, when the obligation specified in the contract is discharged, cancelled, or expired. Any gains or losses on derecognition of financial assets and financial liabilities are taken to profit or loss.
5.19 Offsetting of financial assets and financial liabilities A financial asset and a financial liability is offset and the net amount is reported in the statement of
financial position, if the Company has a legally enforceable right to set off the transaction and also intends either to settle on a net basis or to realise the asset and settle the liability simultaneously. Income and expenses arising from such assets and liabilities are also offset accordingly.
FOR THE YEAR ENDED JUNE 30, 2018
NOTES TO THE FINANCIAL STATEMENTS

102
5.20 Borrowing costs Borrowing and other related costs directly attributable to the acquisition, construction or production of
qualifying assets, which are assets that necessarily take a substantial period of time to get ready for their intended use, are added to the cost of those assets, until such time as the assets are substantially ready for their intended use. All other borrowing costs are recognised as an expense in the period in which they are incurred.
5.21 Dividend and appropriation to reserves Dividend and appropriation to reserves are recognised in the financial statements in the period, in which
these are approved. However, if these are approved after the reporting period but before the financial statements are authorised for issue, they are disclosed in the notes to the financial statements.
5.22 Segment reporting Operating segments are reported in a manner consistent with the internal reporting provided to the
Chief Operating Decision Maker. Segment results, assets and liabilities include items directly attributable to a segment. Segment capital expenditure is the total cost incurred during the year to acquire property, plant and equipment and intangible assets.
5.23 Earnings per share The Company presents basic and diluted earnings per share (EPS) data for its ordinary shares. Basic
EPS is calculated by dividing the profit or loss attributable to ordinary shareholders of the Company by the weighted average number of ordinary shares outstanding during the period. Diluted EPS is determined by adjusting the profit or loss attributable to ordinary shareholders and the weighted average number of ordinary shares outstanding for the effects of all dilutive potential ordinary shares.
5.24 Standards, interpretations and amendments to approved accounting standards that are not yet effective The following standards, amendments and interpretations with respect to the approved accounting
standards as applicable in Pakistan would be effective from the dates mentioned below against the respective standard or interpretation:
Effective date (annual periods beginning Standards on or after)
IFRS 2 Share-based Payments – Classification and Measurement of Share-based Payments Transactions (Amendments) January 01, 2018
IFRS 4 Insurance Contracts: Applying IFRS 9 Financial Instruments with IFRS 4 Insurance Contracts – (Amendments) January 01, 2018 IFRS 9 Financial Instruments July 01, 2018 IFRS 9 Prepayment Features with Negative Compensation – (Amendments) January 01, 2019 IFRS 10 Consolidated Financial Statements and IAS 28 Investment in Associates
and Joint Ventures - Sale or Contribution of Assets between an Investor and its Associate or Joint Venture (Amendment) Not yet finalised
IFRS 15 Revenue from Contracts with Customers July 01, 2018 IFRS 16 Leases January 01, 2019 IAS 19 Plan Amendment, Curtailment or Settlement (Amendments) January 01, 2019 IAS 28 Long-term Interests in Associates and Joint Ventures – (Amendments) January 01, 2019 IAS 40 Investment Property: Transfers of Investment Property (Amendments) January 01, 2018 IFRIC 22 Foreign Currency Transactions and Advance Consideration January 01, 2018 IFRIC 23 Uncertainty over Income Tax Treatments January 01, 2019 The above standards and amendments are not expected to have any material impact on the
Company's financial statements in the period of initial application.
FOR THE YEAR ENDED JUNE 30, 2018
NOTES TO THE FINANCIAL STATEMENTS
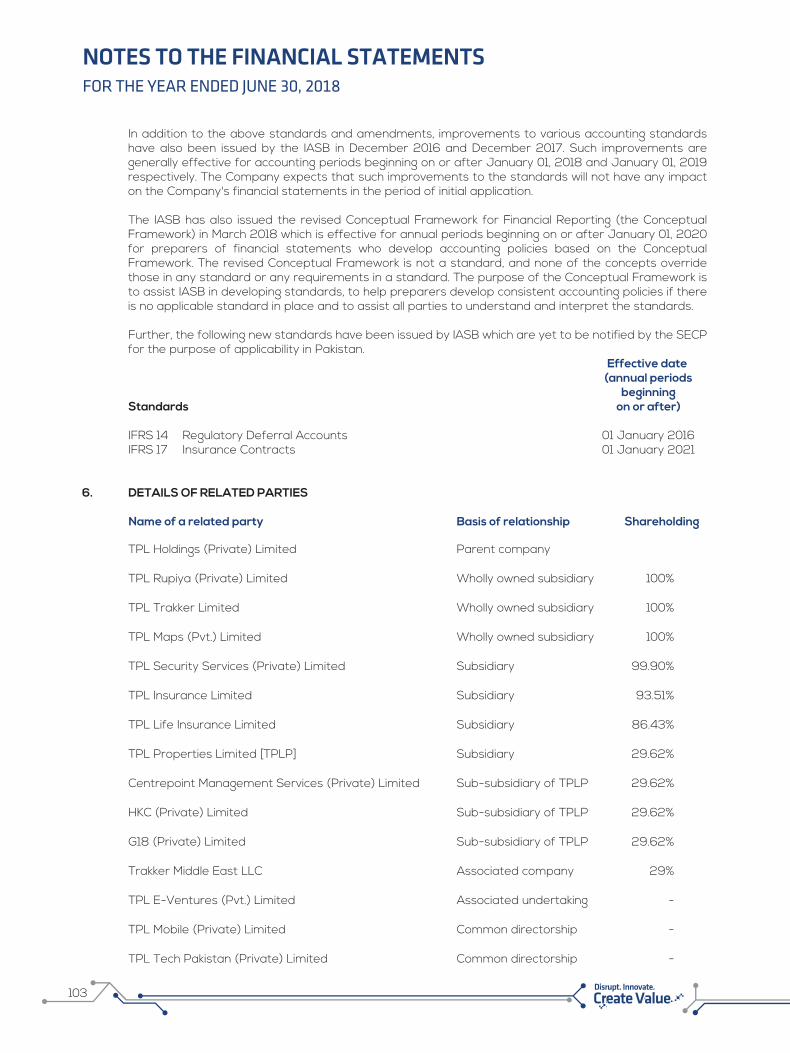
Name of a related party Basis of relationship Shareholding
Sapphire Fibers Limited Common directorship -
Agriauto Industries Limited Common directorship -
IBEX Global Solutions (Private) Limited Common directorship -
Virtual World (Private) Limited Common directorship -
Digital Globe Services (Private) Limited Common directorship -
Afiniti Software Solutions (Private) Limited Common directorship -
Vestrue DMCC, Dubai, UAE Common directorship -
Vestrue Holdings Limited, Dubai, UAE Common directorship -
Kulsum Holdings Limited, Dubai, UAE Common directorship -
Brans Holdings Limited, Dubai, UAE Common directorship -
Rashwell Company LLC, Dubai, UAE Common directorship -
Slaide (Pty) Ltd Common directorship -
Macanta (Pty) Ltd Common directorship -
Fleetcam (Pty) Ltd Common directorship -
Cherosco (Pty) Ltd Common directorship -
Casi International (Pty) Ltd Common directorship -
TPL Direct Finance (Private) Limited Common directorship -
The Resource Group Pakistan Limited Common directorship -
TPL Logistics (Private) Limited Common directorship -
Trakker Energy (Pvt.) Ltd Common directorship
TRG (Private) Limited Common directorship
103 Disrupt. Innovate.
In addition to the above standards and amendments, improvements to various accounting standards have also been issued by the IASB in December 2016 and December 2017. Such improvements are generally effective for accounting periods beginning on or after January 01, 2018 and January 01, 2019 respectively. The Company expects that such improvements to the standards will not have any impact on the Company's financial statements in the period of initial application.
The IASB has also issued the revised Conceptual Framework for Financial Reporting (the Conceptual
Framework) in March 2018 which is effective for annual periods beginning on or after January 01, 2020 for preparers of financial statements who develop accounting policies based on the Conceptual Framework. The revised Conceptual Framework is not a standard, and none of the concepts override those in any standard or any requirements in a standard. The purpose of the Conceptual Framework is to assist IASB in developing standards, to help preparers develop consistent accounting policies if there is no applicable standard in place and to assist all parties to understand and interpret the standards.
Further, the following new standards have been issued by IASB which are yet to be notified by the SECP for the purpose of applicability in Pakistan.
Effective date (annual periods beginning Standards on or after)
IFRS 14 Regulatory Deferral Accounts 01 January 2016 IFRS 17 Insurance Contracts 01 January 2021 6. DETAILS OF RELATED PARTIES Name of a related party Basis of relationship Shareholding TPL Holdings (Private) Limited Parent company
TPL Rupiya (Private) Limited Wholly owned subsidiary 100%
TPL Trakker Limited Wholly owned subsidiary 100%
TPL Maps (Pvt.) Limited Wholly owned subsidiary 100%
TPL Security Services (Private) Limited Subsidiary 99.90%
TPL Insurance Limited Subsidiary 93.51%
TPL Life Insurance Limited Subsidiary 86.43%
TPL Properties Limited [TPLP] Subsidiary 29.62%
Centrepoint Management Services (Private) Limited Sub-subsidiary of TPLP 29.62%
HKC (Private) Limited Sub-subsidiary of TPLP 29.62%
G18 (Private) Limited Sub-subsidiary of TPLP 29.62%
Trakker Middle East LLC Associated company 29%
TPL E-Ventures (Pvt.) Limited Associated undertaking -
TPL Mobile (Private) Limited Common directorship -
TPL Tech Pakistan (Private) Limited Common directorship -
FOR THE YEAR ENDED JUNE 30, 2018
NOTES TO THE FINANCIAL STATEMENTS

104
Name of a related party Basis of relationship Shareholding
Sapphire Fibers Limited Common directorship -
Agriauto Industries Limited Common directorship -
IBEX Global Solutions (Private) Limited Common directorship -
Virtual World (Private) Limited Common directorship -
Digital Globe Services (Private) Limited Common directorship -
Afiniti Software Solutions (Private) Limited Common directorship -
Vestrue DMCC, Dubai, UAE Common directorship -
Vestrue Holdings Limited, Dubai, UAE Common directorship -
Kulsum Holdings Limited, Dubai, UAE Common directorship -
Brans Holdings Limited, Dubai, UAE Common directorship -
Rashwell Company LLC, Dubai, UAE Common directorship -
Slaide (Pty) Ltd Common directorship -
Macanta (Pty) Ltd Common directorship -
Fleetcam (Pty) Ltd Common directorship -
Cherosco (Pty) Ltd Common directorship -
Casi International (Pty) Ltd Common directorship -
TPL Direct Finance (Private) Limited Common directorship -
The Resource Group Pakistan Limited Common directorship -
TPL Logistics (Private) Limited Common directorship -
Trakker Energy (Pvt.) Ltd Common directorship
TRG (Private) Limited Common directorship
2018 2017
Note Rupees Rupees
7. PROPERTY, PLANT AND EQUIPMENT Operating fixed assets 7.1 - 999,237,294 Capital work-in-progress 7.2 - 24,947,491
- 1,024,184,785
FOR THE YEAR ENDED JUNE 30, 2018
NOTES TO THE FINANCIAL STATEMENTS
In addition to the above standards and amendments, improvements to various accounting standards have also been issued by the IASB in December 2016 and December 2017. Such improvements are generally effective for accounting periods beginning on or after January 01, 2018 and January 01, 2019 respectively. The Company expects that such improvements to the standards will not have any impact on the Company's financial statements in the period of initial application.
The IASB has also issued the revised Conceptual Framework for Financial Reporting (the Conceptual
Framework) in March 2018 which is effective for annual periods beginning on or after January 01, 2020 for preparers of financial statements who develop accounting policies based on the Conceptual Framework. The revised Conceptual Framework is not a standard, and none of the concepts override those in any standard or any requirements in a standard. The purpose of the Conceptual Framework is to assist IASB in developing standards, to help preparers develop consistent accounting policies if there is no applicable standard in place and to assist all parties to understand and interpret the standards.
Further, the following new standards have been issued by IASB which are yet to be notified by the SECP for the purpose of applicability in Pakistan.
Effective date (annual periods beginning Standards on or after)
IFRS 14 Regulatory Deferral Accounts 01 January 2016 IFRS 17 Insurance Contracts 01 January 2021 6. DETAILS OF RELATED PARTIES Name of a related party Basis of relationship Shareholding TPL Holdings (Private) Limited Parent company
TPL Rupiya (Private) Limited Wholly owned subsidiary 100%
TPL Trakker Limited Wholly owned subsidiary 100%
TPL Maps (Pvt.) Limited Wholly owned subsidiary 100%
TPL Security Services (Private) Limited Subsidiary 99.90%
TPL Insurance Limited Subsidiary 93.51%
TPL Life Insurance Limited Subsidiary 86.43%
TPL Properties Limited [TPLP] Subsidiary 29.62%
Centrepoint Management Services (Private) Limited Sub-subsidiary of TPLP 29.62%
HKC (Private) Limited Sub-subsidiary of TPLP 29.62%
G18 (Private) Limited Sub-subsidiary of TPLP 29.62%
Trakker Middle East LLC Associated company 29%
TPL E-Ventures (Pvt.) Limited Associated undertaking -
TPL Mobile (Private) Limited Common directorship -
TPL Tech Pakistan (Private) Limited Common directorship -

105 Disrupt. Innovate.
7.1 Operating fixed assets
As atJuly 01,
2017
As atJune 30,
2018
COST / REVALUED AMOUNT ACCUMULATED DEPRECIATION
WRITTENDOWNVALUE
As atJuly 01,
2017
As atJune 30,
2018
As atJune 30,
2018
Transferredunder
Scheme(note 1.5)
Transferredunder
Scheme(note 1.5)
---------------------------------------------- (Rupees) -------------------------------------------------
Deprec- iationRate
%
Owned Leasehold land (note 7.1.4) 413,000,000 (413,000,000) - - - - - - Building on leasehold land (note 7.1.4) 60,055,960 (60,055,960) - 20,753,489 (20,753,489) - - 5 Computers and accessories 214,438,887 (214,438,887) - 201,537,010 (201,537,010) - - 33.33 Generators 6,502,202 (6,502,202) - 6,502,202 (6,502,202) - - 20 Electrical equipments (notes 7.1.2) 642,816,821 (642,816,821) - 246,731,681 (246,731,681) - - 20-25 Furniture and fittings 156,158,720 (156,158,720) - 82,158,320 (82,158,320) - - 20 Vehicles 101,972,245 (101,972,245) - 65,327,874 (65,327,874) - - 20 Construction of shed 6,048,277 (6,048,277) - 6,048,277 (6,048,277) - - 20 Mobile phones 24,051,161 (24,051,161) - 17,491,749 (17,491,749) - - 33.33 1,625,044,273 (1,625,044,273) - 646,550,602 (646,550,602) - - Leased Computers and accessories 46,000,408 (46,000,408) - 43,948,435 (43,948,435) - - 33.33 Electrical equipments 3,570,700 (3,570,700) - 3,128,806 (3,128,806) - - 20 Vehicles 40,793,930 (40,793,930) - 32,144,422 (32,144,422) - - 20 Generators 16,000,400 (16,000,400) - 6,400,152 (6,400,152) - - 20 Mobile phones 279,800 (279,800) - 279,800 (279,800) - - 20 106,645,238 (106,645,238) - 85,901,615 (85,901,615) - - 2018 1,731,689,511 (1,731,689,511) - 732,452,217 (732,452,217) - -
FOR THE YEAR ENDED JUNE 30, 2018
NOTES TO THE FINANCIAL STATEMENTS

106
As atJuly 01,
2016
As atJune 30,
2017
COST / REVALUED AMOUNT ACCUMULATED DEPRECIATION
WRITTENDOWNVALUE
As atJuly 01,
2016
As atJune 30,
2017
As atJune 30,
2017
Additions / (disposals)/
transfers
Charge for the year /
(disposals) / transfers note 7.1.1)
---------------------------------------------- (Rupees) -------------------------------------------------
Deprec- iationRate
%
Owned Leasehold land (note 7.1.4) 194,124,965 218,875,035 413,000,000 - - - 413,000,000 - Building on leasehold land (note 7.1.4) 45,465,312 14,590,648 60,055,960 18,031,203 2,722,286 20,753,489 39,302,471 5 Computers and accessories 206,403,199 5,186,157 214,438,887 186,804,221 14,732,789 201,537,010 12,901,877 33.33 *2,849,531 Generators 6,502,202 - 6,502,202 6,480,372 21,830 6,502,202 - 20 Electrical equipments (notes 7.1.2) 301,868,796 278,394,969 642,816,821 184,529,066 63,217,425 246,731,681 396,085,140 20-25 (1,014,810) (1,014,810) *3,564,900 **60,002,966 Furniture and fittings 140,502,987 11,964,309 156,158,720 56,981,005 25,489,116 82,158,320 74,000,400 20 (311,801) (311,801) *4,003,225 Vehicles 107,863,229 - 101,972,245 56,904,570 14,314,288 65,327,874 36,644,371 20 (5,890,984) (5,890,984) Construction of shed 6,048,277 - 6,048,277 6,048,277 - 6,048,277 - 20 Mobile phones 19,526,409 4,320,602 24,051,161 13,399,188 4,202,776 17,491,749 6,559,412 33.33 (251,450) (110,215) *455,600 1,028,305,376 533,331,720 1,625,044,273 529,177,902 124,700,510 646,550,602 978,493,671 (7,469,045) (7,327,810) *10,873,256 **60,002,966 Leased Computers and accessories 46,000,408 - 46,000,408 40,347,050 3,601,385 43,948,435 2,051,973 33.33 Electrical equipments 3,570,700 - 3,570,700 2,440,333 688,473 3,128,806 441,894 20 Vehicles 38,300,180 - 40,793,930 28,087,326 4,057,096 32,144,422 8,649,508 20 *2,493,750 Generators 16,000,400 - 16,000,400 3,200,076 3,200,076 6,400,152 9,600,248 20 Mobile phones 279,800 - 279,800 279,800 - 279,800 - 20 104,151,488 - 106,645,238 74,354,585 11,547,030 85,901,615 20,743,623 *2,493,750
2017 1,132,456,864 533,331,720 1,731,689,511 603,532,487 136,247,540 732,452,217 999,237,294 (7,469,045) (7,327,810) *13,367,006 **60,002,966 * Represents transfers from capital work-in-progress to owned and leased assets (note 7) ** Represents transfers from stock-in-trade to owned assets
FOR THE YEAR ENDED JUNE 30, 2018
NOTES TO THE FINANCIAL STATEMENTS
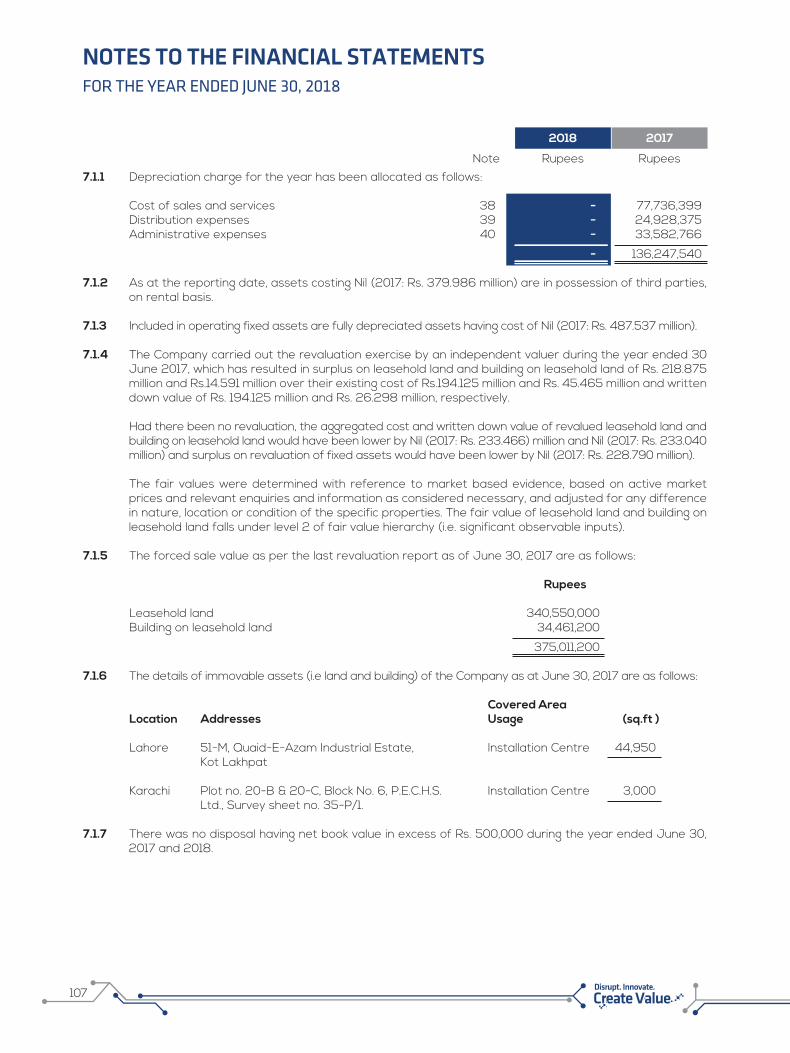
107 Disrupt. Innovate.
2018 2017
Note Rupees Rupees7.1.1 Depreciation charge for the year has been allocated as follows: Cost of sales and services 38 - 77,736,399 Distribution expenses 39 - 24,928,375 Administrative expenses 40 - 33,582,766
- 136,247,540 7.1.2 As at the reporting date, assets costing Nil (2017: Rs. 379.986 million) are in possession of third parties,
on rental basis. 7.1.3 Included in operating fixed assets are fully depreciated assets having cost of Nil (2017: Rs. 487.537 million). 7.1.4 The Company carried out the revaluation exercise by an independent valuer during the year ended 30
June 2017, which has resulted in surplus on leasehold land and building on leasehold land of Rs. 218.875 million and Rs.14.591 million over their existing cost of Rs.194.125 million and Rs. 45.465 million and written down value of Rs. 194.125 million and Rs. 26.298 million, respectively.
Had there been no revaluation, the aggregated cost and written down value of revalued leasehold land and building on leasehold land would have been lower by Nil (2017: Rs. 233.466) million and Nil (2017: Rs. 233.040 million) and surplus on revaluation of fixed assets would have been lower by Nil (2017: Rs. 228.790 million).
The fair values were determined with reference to market based evidence, based on active market prices and relevant enquiries and information as considered necessary, and adjusted for any difference in nature, location or condition of the specific properties. The fair value of leasehold land and building on leasehold land falls under level 2 of fair value hierarchy (i.e. significant observable inputs).
7.1.5 The forced sale value as per the last revaluation report as of June 30, 2017 are as follows: Rupees Leasehold land 340,550,000 Building on leasehold land 34,461,200
375,011,200 7.1.6 The details of immovable assets (i.e land and building) of the Company as at June 30, 2017 are as follows: Covered Area Location Addresses Usage (sq.ft ) Lahore 51-M, Quaid-E-Azam Industrial Estate, Installation Centre 44,950
Kot Lakhpat Karachi Plot no. 20-B & 20-C, Block No. 6, P.E.C.H.S. Installation Centre 3,000
Ltd., Survey sheet no. 35-P/1. 7.1.7 There was no disposal having net book value in excess of Rs. 500,000 during the year ended June 30,
2017 and 2018.
FOR THE YEAR ENDED JUNE 30, 2018
NOTES TO THE FINANCIAL STATEMENTS

108
2018 2017
Note Rupees Rupees
7.2 Capital work-in-progress Opening balance 24,947,491 18,505,613 Additions during the year - 23,271,293 Transferred during the year: - operating fixed assets 7.1 - (13,367,006) - TPL Insurance Limited (a subsidiary company) - (3,462,409) - Transferred under the Scheme 1.5 (24,947,491) -
Closing balance - 24,947,491
8. INTANGIBLE ASSETS Intangible assets 8.1 641,667 1,333,128,920 Intangible assets under development 8.2 - 314,526,752
1.5 641,667 1,647,655,6728.1 Intangible assets
Owned Goodwill (8.4) 403,380,571* (403,380,571) - - - - - -
Customers related intangible assets 453,635,249* (453,635,249) - - - - - -
Marketing related intangible assets 289,021,582* (289,021,582) - - - - - -
Internally generated computer softwares 25,840,000* (25,840,000) - 25,840,000* (25,840,000) - - 13.33
Maps database 147,858,790* (147,858,790) - 60,991,745* (60,991,745) - - 5
Softwares 288,289,819 660,000 660,000 188,065,346 18,333 18,333 641,667 20-33.33 (288,289,819)* (188,065,346)
PTA license 1,000,500* (1,000,500) - 1,000,500* (1,000,500) - - 6.67
Decarta maps 22,884,695* (22,884,695) - 22,884,695* (22,884,695) - - 20
2018 1,631,911,206* (1,631,911,206) 660,000 298,782,286* (298,782,286) 18,333 641,667 660,000 18,333 *Represents assets transferred under Scheme (note 1.5).
As atJuly 01,
2017
As atJune 30,
2018
COSTACCUMULATED DEPRECIATION
IMPAIRMENT
WRITTENDOWNVALUE
As atJuly 01,
2017
Charge for the year
*transfers
As atJune 30,
2018
As atJune 30,
2018
Amortis- ationRate
Additions*(transfers)
---------------------------------------- (Rupees) ------------------------------------------- %
As atJuly 01,
2016
As atJune 30,
2017
COSTACCUMULATED DEPRECIATION
IMPAIRMENT
WRITTENDOWNVALUE
As atJuly 01,
2016
Charge for the year
*transfers
As atJune 30,
2017
As atJune 30,
2017
Amortis- ationRate
Additions*(transfers)
---------------------------------------------- (Rupees) -------------------------------------------------% Owned Goodwill 403,380,571 - 403,380,571 - - - 403,380,571 -
Customers related intangible assets 453,635,249 - 453,635,249 - - - 453,635,249 -
Marketing related intangible assets 289,021,582 - 289,021,582 - - - 289,021,582 -
Internally generated computer softwares 25,840,000 - 25,840,000 24,973,491 866,509 25,840,000 - 13.33
Maps database 147,858,790 - 147,858,790 53,598,805 7,392,940 60,991,745 86,867,045 5
Softwares 274,562,536 13,727,283 288,289,819 146,221,193 41,844,153 188,065,346 100,224,473 20-33.33
PTA license 1,000,500 - 1,000,500 1,000,500 - 1,000,500 - 6.67
Decarta maps 22,884,695 - 22,884,695 22,884,695 - 22,884,695 - 20
2017 1,618,183,923 13,727,283 1,631,911,206 248,678,684 50,103,602 298,782,286 1,333,128,920
FOR THE YEAR ENDED JUNE 30, 2018
NOTES TO THE FINANCIAL STATEMENTS

109 Disrupt. Innovate.
2018 2017
Note Rupees Rupees
8.2 Intangible assets under development Opening balance 314,526,752 60,831,039 Additions during the year - 253,695,713 Transferred under Scheme 1.5 (314,526,752) -
Closing balance - 314,526,752 8.3 Amortisation expense has been charged to cost of sales (note 38).
9. LONG-TERM INVESTMENTS Investment in subsidiary companies – available-for-sale at fair value TPL Insurance Limited [TIL] 9.1 1,659,369,999 - TPL Properties Limited [TPLP] 9.2 754,174,200 - TPL Life Insurance Limited [TPL Life] 9.3 375,630,807 364,893,455 TPL Maps (Pvt.) Limited [TMPL] 1.5 & 9.4 460,187,842 100 TPL Trakker Limited [TTL] 1.5 & 9.5 1,224,751,713 100 TPL Security Services (Private) Limited [TSS] 9.6 65,341,794 61,098,613 TPL Rupiya (Private) Limited [TPLR] 9.7 32,358,060 - 4,571,814,415 425,992,268 Investment in associated company – at cost TPL Insurance Limited [TIL] 9.1 - 402,499,893
4,571,814,415 828,492,161 9.1 The Company holds 77,323,859 (2017: 18,419,000) ordinary shares of Rs.10/- each, representing 93.51
percent (2017: 24.39 percent) of the share capital of TIL as of the reporting date. The market value per share of TIL is Rs.21.46 (2017: Rs.24.60). Out of 77,323,859 ordinary shares of TIL held by the Company, 12,066,900 ordinary shares are pledged with financial institutions against various financing facilities transferred to TTL (a subsidiary company), under the Scheme as disclosed in note 1.5 to these statements, and 65,256,314 ordinary shares are pledged against issue of term finance certificates (note 24).
During the year, the Company has purchased additional 52,196,397 ordinary shares (representing 69.12 percent shareholding) at a cost of Rs.1,252.714 million under the terms and conditions of Sale and Purchase Agreement (SPA) signed with Greenoaks Global Holding Limited (the seller) dated March 23, 2017. Resultantly, the shareholding of the Company in TIL has been increased, by virtue of which, TIL becomes a subsidiary company during the year.
9.2 The Company holds 81,004,000 (2017: 55,000,000) ordinary shares of Rs.10/- each, representing 29.62
percent (2017: 20.1 percent) of the share capital of TPLP as of the reporting date. The market value per share is Rs. 9.30 (2017: Rs.12.25). Out of 81,004,000 ordinary shares of TPLP held by the Company, 72,600,000 ordinary shares are pledged against various financing facilities transferred to TTL under the Scheme as disclosed in note 1.5 to these financial statements.
During the year, the Company has been allotted 21,104,000 ordinary shares of TPLP under the Scheme as disclosed in note 1.5 to these financial statements, for which legal formalities to transfer the shares are in process. In additon, the Company has also changed its intention to dispose of investment in TPLP and considered the same as strategic investments. Accordingly, the same has been classified from current assets to non-current assets.
FOR THE YEAR ENDED JUNE 30, 2018
NOTES TO THE FINANCIAL STATEMENTS
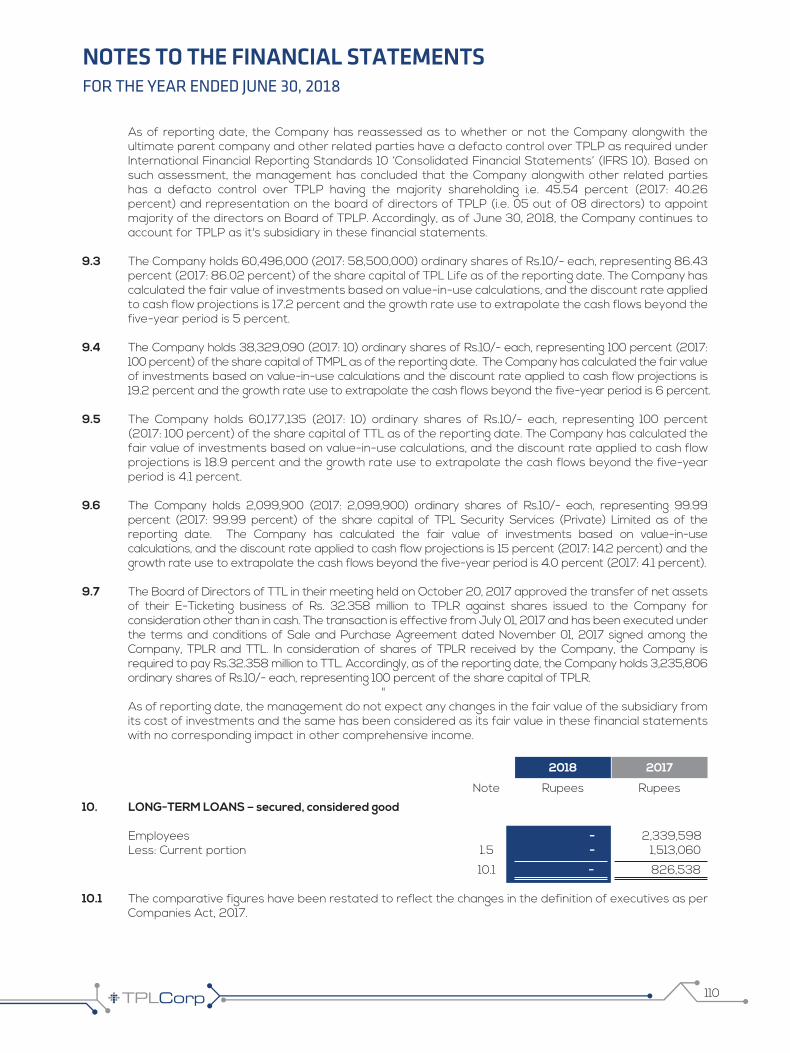
As of reporting date, the Company has reassessed as to whether or not the Company alongwith the ultimate parent company and other related parties have a defacto control over TPLP as required under International Financial Reporting Standards 10 ‘Consolidated Financial Statements’ (IFRS 10). Based on such assessment, the management has concluded that the Company alongwith other related parties has a defacto control over TPLP having the majority shareholding i.e. 45.54 percent (2017: 40.26 percent) and representation on the board of directors of TPLP (i.e. 05 out of 08 directors) to appoint majority of the directors on Board of TPLP. Accordingly, as of June 30, 2018, the Company continues to account for TPLP as it's subsidiary in these financial statements.
9.3 The Company holds 60,496,000 (2017: 58,500,000) ordinary shares of Rs.10/- each, representing 86.43
percent (2017: 86.02 percent) of the share capital of TPL Life as of the reporting date. The Company has calculated the fair value of investments based on value-in-use calculations, and the discount rate applied to cash flow projections is 17.2 percent and the growth rate use to extrapolate the cash flows beyond the five-year period is 5 percent.
9.4 The Company holds 38,329,090 (2017: 10) ordinary shares of Rs.10/- each, representing 100 percent (2017:
100 percent) of the share capital of TMPL as of the reporting date. The Company has calculated the fair value of investments based on value-in-use calculations and the discount rate applied to cash flow projections is 19.2 percent and the growth rate use to extrapolate the cash flows beyond the five-year period is 6 percent.
9.5 The Company holds 60,177,135 (2017: 10) ordinary shares of Rs.10/- each, representing 100 percent
(2017: 100 percent) of the share capital of TTL as of the reporting date. The Company has calculated the fair value of investments based on value-in-use calculations, and the discount rate applied to cash flow projections is 18.9 percent and the growth rate use to extrapolate the cash flows beyond the five-year period is 4.1 percent.
9.6 The Company holds 2,099,900 (2017: 2,099,900) ordinary shares of Rs.10/- each, representing 99.99
percent (2017: 99.99 percent) of the share capital of TPL Security Services (Private) Limited as of the reporting date. The Company has calculated the fair value of investments based on value-in-use calculations, and the discount rate applied to cash flow projections is 15 percent (2017: 14.2 percent) and the growth rate use to extrapolate the cash flows beyond the five-year period is 4.0 percent (2017: 4.1 percent).
9.7 The Board of Directors of TTL in their meeting held on October 20, 2017 approved the transfer of net assets
of their E-Ticketing business of Rs. 32.358 million to TPLR against shares issued to the Company for consideration other than in cash. The transaction is effective from July 01, 2017 and has been executed under the terms and conditions of Sale and Purchase Agreement dated November 01, 2017 signed among the Company, TPLR and TTL. In consideration of shares of TPLR received by the Company, the Company is required to pay Rs.32.358 million to TTL. Accordingly, as of the reporting date, the Company holds 3,235,806 ordinary shares of Rs.10/- each, representing 100 percent of the share capital of TPLR.
" As of reporting date, the management do not expect any changes in the fair value of the subsidiary from
its cost of investments and the same has been considered as its fair value in these financial statements with no corresponding impact in other comprehensive income.
10. LONG-TERM LOANS – secured, considered good Employees - 2,339,598 Less: Current portion 1.5 - 1,513,060
10.1 - 826,538 10.1 The comparative figures have been restated to reflect the changes in the definition of executives as per
Companies Act, 2017.
110
2018 2017
Note Rupees Rupees
FOR THE YEAR ENDED JUNE 30, 2018
NOTES TO THE FINANCIAL STATEMENTS

11. LONG-TERM DEPOSITS Security deposits - leased and ijarah assets - 33,010,985 Less: Current portion - 12,643,282 - 20,367,703 Utilities - 177,450 Rent deposits - 2,998,921 Cash margin against guarantees - 21,787,154 1.5 - 45,331,228 12. INTEREST ACCRUED - unsecured, considered good Accrued mark-up on current account with: Subsidiary companies - TPL Security Services (Private) Limited - 4,326,421 - TPL Properties Limited - 17,363 - 4,343,784 Associated companies - Trakker Middle East LLC. - 2,653,161 Others - TPL E-Ventures (Pvt.) Limited 7,900 - - Trakker Direct Finance (Private) Limited - 791,624 - TPL Logistics (Private) Limited - 323,475 - The Resource Group Pakistan Limited - 3,666,381 - TPL Rupiya (Private) Limited - 224,053 1.5 7,900 5,005,533 7,900 12,002,478 Less: Current portion 7,900 11,985,115 - 17,363 13. DUE FROM RELATED PARTIES – unsecured, considered good Subsidiary companies - TPL Security Services (Private) Limited 1.5 - 66,165,870 - TPL Properties Limited 1.5 - 11,711,707 - TPL Life Insurance Limited 1.5 - 16,960,976 - TPL Trakker Limited 13.1 67,869,512 1,621,135 - TPL Maps (Pvt.) Limited 1.5 - 421,135 67,869,512 96,880,823 Others - TPL E-Ventures (Pvt.) Limited 13.2 166,740 - - Trakker Direct Finance (Pvt.) Limited 1.5 - 771,300 - TPL Logistic (Private) Limited 1.5 - 778,522 - TPL Rupiya (Private) Limited 1.5 - 1,697,610 - The Resource Group Pakistan Limited 1.5 - 5,884,572 166,740 9,132,004 13.3 68,036,252 106,012,827 Less: Current portion 68,036,252 94,301,120 - 11,711,707
13.1 Represents interest free current account balance repayable on demand. 13.2 Represents current account balances carrying markup at the variable rate of 6 months KIBOR plus 3
percent per annum and is repayable on demand. 13.3 These are neither past due nor impaired.
111 Disrupt. Innovate.
2018 2017
Note Rupees Rupees
FOR THE YEAR ENDED JUNE 30, 2018
NOTES TO THE FINANCIAL STATEMENTS

112
13.4 The maximum amount outstanding at any time during the year calculated by reference to month end balances are as follows:
Subsidiary companies - TPL Security Services (Private) Limited - 71,122,023
- TPL Properties Limited - 248,995,135
- TPL Life Insurance Limited - 16,960,976
- TPL Trakker Limited 67,869,512 1,621,135
- TPL Maps (Pvt.) Limited - 421,135 Others - TPL E-Ventures (Pvt.) Limited 166,740 -
- Trakker Direct Finance (Pvt.) Limited - 771,300
- TPL Logistic (Private) Limited - 778,522
- TPL Rupiya (Private) Limited - 1,697,610
- The Resource Group Pakistan Limited - 5,884,572
14. STOCK-IN-TRADE Tracking devices - 347,658,183 Spare parts - 8,464,342
1.5 - 356,122,525 15. TRADE DEBTS - unsecured Considered good 15.1 - 1,207,344,403 Considered doubtful - 29,418,010 Less: Provision for doubtful debts 15.3 - (29,418,010)
- -
1.5 - 1,207,344,403 15.1 The ageing analysis of trade debts as of June 30, 2017 are as follows:
Related parties TPL Insurance Limited 10,061,362 4,981,068 1,137,301 524 3,942,469 The Resource Group Pakistan Limited 32,739 32,739 - - -
10,094,101 5,013,807 1,137,301 524 3,942,469 Other than related parties 1,197,250,302 501,957,748 494,563,323 75,602,993 125,126,238
2017 1,207,344,403 506,971,555 495,700,624 75,603,517 129,068,707
2018 2017
Note Rupees Rupees
Total
Neither past
due norimpaired
> 30 days upto120 days
Past due but not impaired> 121 days upto
180 days180 days
and above
---------------------------------- (Rupees) ---------------------------------
FOR THE YEAR ENDED JUNE 30, 2018
NOTES TO THE FINANCIAL STATEMENTS

113 Disrupt. Innovate.
2018 2017
Note Rupees Rupees
15.2 The maximum amount outstanding at any time during the year calculated by reference to month end balances are as follows:
TPL Insurance Limited - 35,026,807
The Resource Group Pakistan Limited - 32,739
15.3 Provision for doubtful debts Opening balance 29,418,010 26,476,168 Provision for the year - 17,452,497 Written off during the year 15.4 - (14,510,655) Transferred under Scheme 1.5 (29,418,010) -
Closing balance - 29,418,010 15.4 Includes amount written off of Nil (2017: Rs. 0.005 million) of TPL Insurance Limited (a related party).
16. LOANS AND ADVANCES Loans – secured, considered good Current portion of long-term loans - 1,513,060 Advances – unsecured, considered good - against issue of shares 16.1 10,000,000 - - suppliers 16.2 - 8,175,333 - others - 80,486
10,000,000 8,255,819
10,000,000 9,768,879 16.1 Represents advance paid to TPL E-Ventures (Pvt.) Limited (a related party) for the purchase of shares.
16.2 Includes advances paid to the following foreign companies as of June 30, 2017: Name of the company Name and address of investee Amount of Terms & conditions /
and jurisdiction company advance period (Rupees) Esun Industrial Company No.702,Building F1, Jinbi Yushui 909,725 For purchase of goods
Limited Shanzhuang, Shanqian Lvyou to be settled within Avenue,Huadu district, 90 days Guangzhou,China.
Traclogis Co. Ltd. 7/F block, 80 Bldg Huanan Industrial 682,175 For purchase of goods
Park, Liaobu Town Dongguan to be settled within Guangdong China 90 days
Sectrack 75 International Blvd, Suite 100, 666,339 For receiving of
Toronto, ON, Canada, M9W 6L9 services to be settled within 90 days
2,258,239
FOR THE YEAR ENDED JUNE 30, 2018
NOTES TO THE FINANCIAL STATEMENTS
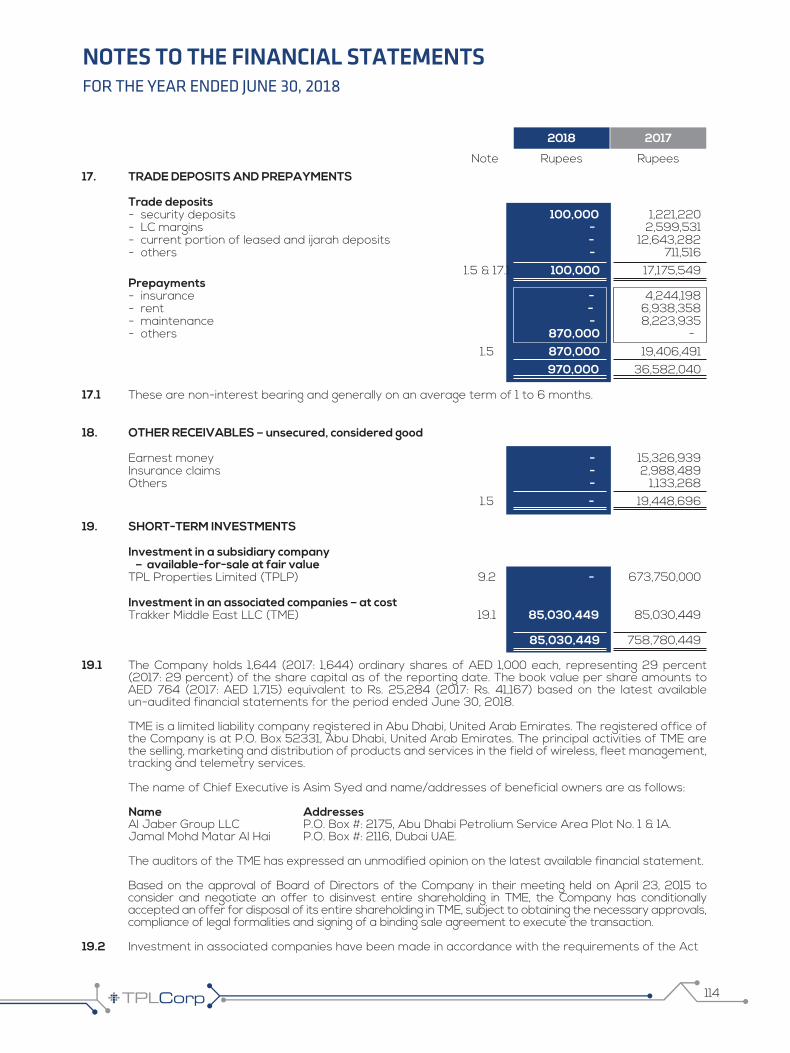
114
17. TRADE DEPOSITS AND PREPAYMENTS Trade deposits - security deposits 100,000 1,221,220 - LC margins - 2,599,531 - current portion of leased and ijarah deposits - 12,643,282 - others - 711,516 1.5 & 17.1 100,000 17,175,549 Prepayments - insurance - 4,244,198 - rent - 6,938,358 - maintenance - 8,223,935 - others 870,000 - 1.5 870,000 19,406,491 970,000 36,582,040 17.1 These are non-interest bearing and generally on an average term of 1 to 6 months.
18. OTHER RECEIVABLES – unsecured, considered good Earnest money - 15,326,939 Insurance claims - 2,988,489 Others - 1,133,268 1.5 - 19,448,696 19. SHORT-TERM INVESTMENTS Investment in a subsidiary company – available-for-sale at fair value TPL Properties Limited (TPLP) 9.2 - 673,750,000 Investment in an associated companies – at cost Trakker Middle East LLC (TME) 19.1 85,030,449 85,030,449 85,030,449 758,780,449 19.1 The Company holds 1,644 (2017: 1,644) ordinary shares of AED 1,000 each, representing 29 percent
(2017: 29 percent) of the share capital as of the reporting date. The book value per share amounts to AED 764 (2017: AED 1,715) equivalent to Rs. 25,284 (2017: Rs. 41,167) based on the latest available un-audited financial statements for the period ended June 30, 2018.
TME is a limited liability company registered in Abu Dhabi, United Arab Emirates. The registered office of
the Company is at P.O. Box 52331, Abu Dhabi, United Arab Emirates. The principal activities of TME are the selling, marketing and distribution of products and services in the field of wireless, fleet management, tracking and telemetry services.
The name of Chief Executive is Asim Syed and name/addresses of beneficial owners are as follows: Name Addresses Al Jaber Group LLC P.O. Box #: 2175, Abu Dhabi Petrolium Service Area Plot No. 1 & 1A. Jamal Mohd Matar Al Hai P.O. Box #: 2116, Dubai UAE. The auditors of the TME has expressed an unmodified opinion on the latest available financial statement. Based on the approval of Board of Directors of the Company in their meeting held on April 23, 2015 to
consider and negotiate an offer to disinvest entire shareholding in TME, the Company has conditionally accepted an offer for disposal of its entire shareholding in TME, subject to obtaining the necessary approvals, compliance of legal formalities and signing of a binding sale agreement to execute the transaction.
19.2 Investment in associated companies have been made in accordance with the requirements of the Act
2018 2017
Note Rupees Rupees
FOR THE YEAR ENDED JUNE 30, 2018
NOTES TO THE FINANCIAL STATEMENTS

115 Disrupt. Innovate.
20. TAXATION - net Opening balance – (refundable) / payable 46,721,208 (866,482) Provision for current and prior taxation - (21,076,072) Income tax paid and deducted at source - 68,663,762 Workers' Welfare Fund adjustment 29 (13,615,285) -
Closing balance – (refundable) 33,105,923 46,721,208
21. CASH AND BANK BALANCES Cash in hand - 646,139 At banks in: current accounts 1,747,962 39,572,712 saving accounts - 135,814
1.5 1,747,962 40,354,665
22. ISSUED, SUBSCRIBED AND PAID-UP CAPITAL
Ordinary shares of Rs.10/- each 30,009,900 30,009,900 - issued for cash 300,099,000 300,099,000 - issued for consideration other than cash 187,239,063 187,239,063 - opening balance 22.1 1,872,390,630 1,872,390,630 20,048,800 - - issued during the year 22.2 200,488,000 -
207,287,863 187,239,063 2,072,878,630 1,872,390,630 237,297,763 217,248,963 23.2 2,372,977,630 2,172,489,630
22.1 During the year ended June 30, 2009, the shareholders of the Company, namely Ali Bhai Group (AB) and Ali Jameel Group (AJ) and Digicore International (Pty) Limited entered into a Scheme of Arrangement, in respect of transfer of entire operations and exchange of assets of Trakker (Private) Limited into a new company in consideration for ordinary shares of the Company.
22.2 Represents ordinary shares alloted under the Scheme as disclosed in note 1.5 to these financial
statements, for which legal formalities related to issuance are in process. 22.3 These are ordinary shares carry one vote per share and right to dividend.
2018 2017
Note Rupees Rupees
2018 2017
Note Rupees Rupees
2018 2017
Number of shares
FOR THE YEAR ENDED JUNE 30, 2018
NOTES TO THE FINANCIAL STATEMENTS
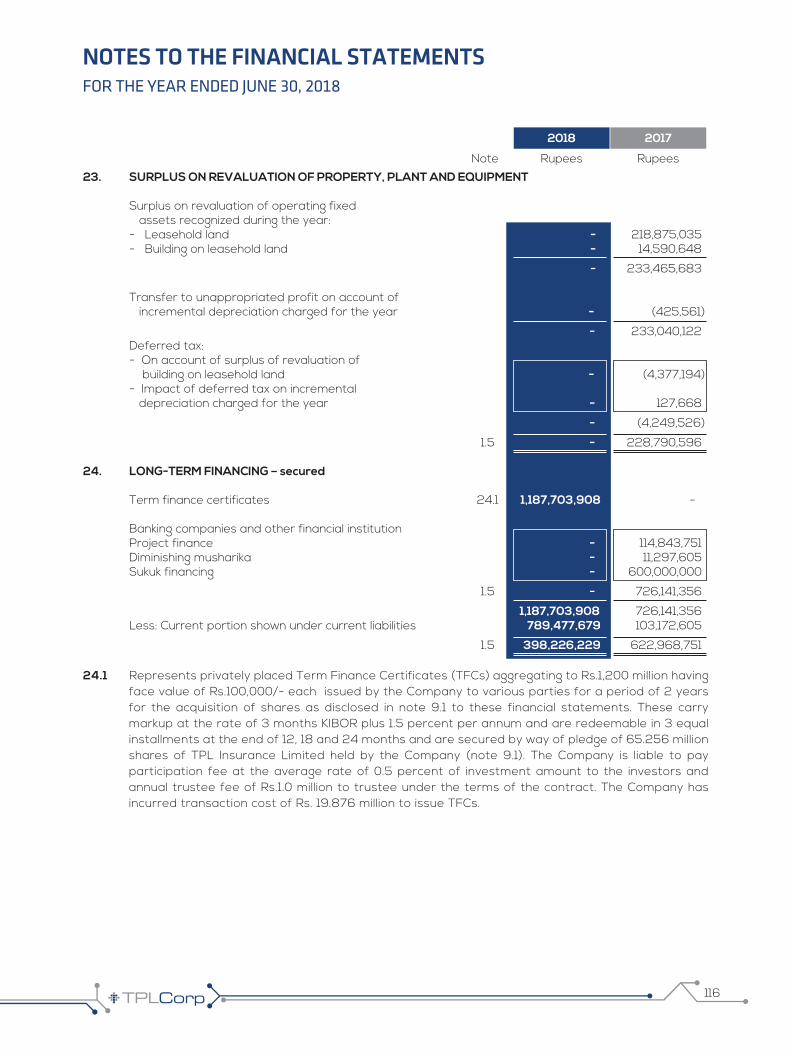
116
23. SURPLUS ON REVALUATION OF PROPERTY, PLANT AND EQUIPMENT Surplus on revaluation of operating fixed assets recognized during the year: - Leasehold land - 218,875,035 - Building on leasehold land - 14,590,648
- 233,465,683 Transfer to unappropriated profit on account of incremental depreciation charged for the year - (425,561)
- 233,040,122 Deferred tax: - On account of surplus of revaluation of building on leasehold land - (4,377,194) - Impact of deferred tax on incremental depreciation charged for the year - 127,668
- (4,249,526)
1.5 - 228,790,596 24. LONG-TERM FINANCING – secured Term finance certificates 24.1 1,187,703,908 - Banking companies and other financial institution Project finance - 114,843,751 Diminishing musharika - 11,297,605 Sukuk financing - 600,000,000
1.5 - 726,141,356
1,187,703,908 726,141,356 Less: Current portion shown under current liabilities 789,477,679 103,172,605
1.5 398,226,229 622,968,751 24.1 Represents privately placed Term Finance Certificates (TFCs) aggregating to Rs.1,200 million having
face value of Rs.100,000/- each issued by the Company to various parties for a period of 2 years for the acquisition of shares as disclosed in note 9.1 to these financial statements. These carry markup at the rate of 3 months KIBOR plus 1.5 percent per annum and are redeemable in 3 equal installments at the end of 12, 18 and 24 months and are secured by way of pledge of 65.256 million shares of TPL Insurance Limited held by the Company (note 9.1). The Company is liable to pay participation fee at the average rate of 0.5 percent of investment amount to the investors and annual trustee fee of Rs.1.0 million to trustee under the terms of the contract. The Company has incurred transaction cost of Rs. 19.876 million to issue TFCs.
2018 2017
Note Rupees Rupees
FOR THE YEAR ENDED JUNE 30, 2018
NOTES TO THE FINANCIAL STATEMENTS
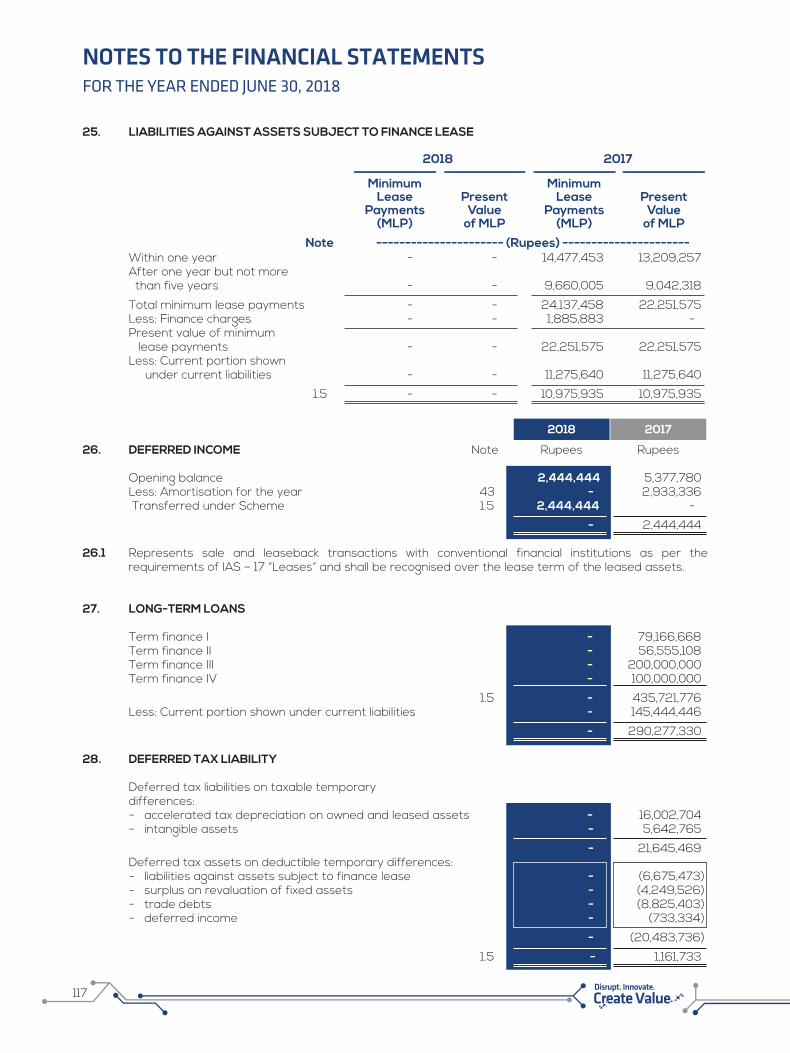
117 Disrupt. Innovate.
25. LIABILITIES AGAINST ASSETS SUBJECT TO FINANCE LEASE
Within one year - - 14,477,453 13,209,257 After one year but not more than five years - - 9,660,005 9,042,318
Total minimum lease payments - - 24,137,458 22,251,575 Less: Finance charges - - 1,885,883 - Present value of minimum lease payments - - 22,251,575 22,251,575 Less: Current portion shown under current liabilities - - 11,275,640 11,275,640
1.5 - - 10,975,935 10,975,935
26. DEFERRED INCOME Opening balance 2,444,444 5,377,780 Less: Amortisation for the year 43 - 2,933,336 Transferred under Scheme 1.5 2,444,444 -
- 2,444,444 26.1 Represents sale and leaseback transactions with conventional financial institutions as per the
requirements of IAS – 17 “Leases” and shall be recognised over the lease term of the leased assets. 27. LONG-TERM LOANS Term finance I - 79,166,668 Term finance II - 56,555,108 Term finance III - 200,000,000 Term finance IV - 100,000,000
1.5 - 435,721,776 Less: Current portion shown under current liabilities - 145,444,446
- 290,277,330 28. DEFERRED TAX LIABILITY Deferred tax liabilities on taxable temporary differences: - accelerated tax depreciation on owned and leased assets - 16,002,704 - intangible assets - 5,642,765
- 21,645,469 Deferred tax assets on deductible temporary differences: - liabilities against assets subject to finance lease - (6,675,473) - surplus on revaluation of fixed assets - (4,249,526) - trade debts - (8,825,403) - deferred income - (733,334)
- (20,483,736)
1.5 - 1,161,733
2018 2017
Note Rupees Rupees
Note
2018 2017
MinimumLease
Payments(MLP)
PresentValue
of MLP
MinimumLease
Payments(MLP)
PresentValue
of MLP
---------------------- (Rupees) ----------------------
FOR THE YEAR ENDED JUNE 30, 2018
NOTES TO THE FINANCIAL STATEMENTS

118
29. TRADE AND OTHER PAYABLES Creditors 29.1 - 277,093,232 Accrued liabilities 4,200,000 59,810,367 Unearned equipment rentals - 112,878,453 Other liabilities Sales commission payable - 2,606,657 Sales tax payable - 10,798,360 Withholding tax payable - 30,927,909 Workers’ Welfare Fund - 13,615,286 Provident fund - 4,440,821 Others - 1,661,798 - 64,050,831 1.5 4,200,000 513,832,883 29.1 It includes an amount of Nil (2017: Rs. 24.040 million and Rs. 6.104 million) payable to Centrepoint
Management Services (Private) Limited (sub-subsidiary Company) and TPL Properties Limited (a subsidiary Company).
30. ACCRUED MARK-UP Long-term financing 24 3,775,714 19,646,099 Long-term loans - 5,089,202 Short-term financing - 8,591,626 Running finance under mark-up arrangement - 15,901,172 Due to related parties 34 2,716,712 - 1.5 6,492,426 49,228,099 31. SHORT-TERM FINANCING Trust receipts 1.5 - 62,238,722
32. RUNNING FINANCE UNDER MARK-UP ARRANGEMENTS Running finance under mark-up arrangements 1.5 - 876,719,637
33. CURRENT PORTION OF NON-CURRENT LIABILITIES Long-term financing 24 789,477,679 103,172,605 Liabilities against assets subject to finance lease - 11,275,640 Long-term loans - 145,444,446 1.5 789,477,679 259,892,691
34. DUE TO RELATED PARTIES - unsecured Holding company - TPL Holdings (Private) Limited 34.1 445,000,000 69,143,564 Subsidiary company - TPL Insurance Limited (TIL) 1.5 - 18,275,776 Associated company - Trakker Middle East LLC. (TME) 1.5 - 329,585 445,000,000 87,748,925 34.1 Represents current account balance carrying markup at the variable rate of 6 months KIBOR plus 3
percent (2017: 6 months KIBOR plus 3 percent) per annum and is repayable on demand.
2018 2017
Note Rupees Rupees
FOR THE YEAR ENDED JUNE 30, 2018
NOTES TO THE FINANCIAL STATEMENTS

119 Disrupt. Innovate.
35. ADVANCE MONITORING FEES Opening balance 167,561,448 105,281,670 Additions during the year - 650,639,953 Less: Transferred to income during the year - (588,360,175) Transferred under Scheme 1.5 (167,561,448) -
Closing balance - 167,561,448
36. CONTINGENCIES AND COMMITMENTS 36.1 Contingencies Consequent to transfer of businesses by the Company under the Scheme as disclosed in note 1.5 to
these financial statements, the contingent liabilities and commitments relating to Maps and Trakker Undertakings were transferred to TMPL and TTL.
37. TURNOVER - net Equipment installation and sales - 305,443,830 Monitoring fees - 731,162,223 Equipment rentals - 553,196,517 Navigation services - 107,464,058 Other services - 79,254,541
- 1,776,521,169 Less: Sales tax - 270,239,514
- 1,506,281,655 38. COST OF SALES AND SERVICES Cost of equipment sold Opening stock - 293,838,894 Purchases - 144,339,220
- 438,178,114 Closing stock - (356,122,525)
- 82,055,589 Direct expenses Salaries, wages and benefits - 224,303,390 Activation and connection charges - 179,728,918 Insurance - 9,497,199 Vehicle running and maintenance - 15,706,499 Depreciation - 77,736,399 Amortisation - 50,103,602 License renewal fee - 2,674,312 Telephone - 7,145,689 Travelling and conveyance - 12,888,046 Electricity, gas and water - 15,482,159 Rent, rates and taxes - 33,176,476 Computer expenses - 5,996,913
- 634,439,602
- 716,495,191
2018 2017
Note Rupees Rupees
2018 2017
Rupees Rupees
FOR THE YEAR ENDED JUNE 30, 2018
NOTES TO THE FINANCIAL STATEMENTS

120
39. DISTRIBUTION EXPENSES Salaries, wages and benefits - 71,929,226 Commission expense - 53,235,922 Outsourcing expense - 13,224,384 Depreciation - 24,928,375 Sales promotion and publicity expenses - 35,442,875 Computer expenses - 1,923,089 Electricity, gas and water - 4,964,792 Postage and courier - 6,750,869 Printing and stationery - 2,257,612 Telephone - 2,291,467 Rent, rates and taxes - 10,638,975 Vehicle running and maintenance - 5,036,733 Insurance - 3,045,545 Travelling and conveyance - 4,132,917 Newspapers and periodicals - 115,584
- 239,918,365
40. ADMINISTRATIVE EXPENSES Salaries, wages and benefits 27,952,742 96,714,115 Legal and professional 6,552,336 36,514,374 Depreciation - 33,582,766 Amortisation 18,333 - Provision for doubtful debts - 17,452,497 Electricity, gas and water - 6,675,526 Rent, rates and taxes - 14,304,882 Travelling and conveyance 69,453 5,581,749 Repairs and maintenance - 16,427,931 Security service charges - 12,726,440 Vehicle running and maintenance - 6,772,257 Computer expenses 9,000 2,771,026 Telephone - 3,081,046 Training - 3,419,281 Auditors' remuneration 40.1 5,505,600 7,823,275 Insurance - 4,094,959 Entertainment - 24,657,410 Printing and stationery 352,359 3,116,807 Postage and courier - 9,077,038 Donations 40.2 & 40.3 - 7,556,000 Ijarah rentals - 45,485,200 Subscription - 3,383,740 Others 620,000 7,307,156
41,079,823 368,525,475
2018 2017
Note Rupees Rupees
FOR THE YEAR ENDED JUNE 30, 2018
NOTES TO THE FINANCIAL STATEMENTS

121 Disrupt. Innovate.
40.1 Auditors' remuneration Audit fee – standalone 800,000 2,750,000 Audit fee – consolidated 1,200,000 275,000 Code of corporate governance 250,000 175,000 Half yearly review and other assurance services 2,890,100 4,323,800 Out of pocket expenses 365,500 299,475
5,505,600 7,823,275 40.2 Recipients of donations do not include any donee in which a director or spouse had any interest. 40.3 Donations to the following donees are equal to or exceeds Rs. 0.5 million: Sindh Insititute of Urology and Transplantation - 2,500,000 The Indus Hospital - 2,500,000
- 5,000,000 40.4 Investments out of provident fund have been made in accordance with the provisions of Section 218 of
the Companies Act, 2017, and the conditions specified thereunder.
41. OTHER OPERATING EXPENSES Workers’ Welfare Fund - 771,221 Exchange loss – net - 588,438
- 1,359,659 42. FINANCE COSTS Mark-up on: - long-term financing 59,235,292 67,985,122 - liabilities against assets subject to finance lease - 2,855,909 - long-term loans - 12,540,355 - short-term financing - 4,534,834 - running finance under mark-up arrangements - 49,235,863 - due to related parties 2,733,185 8,895,446 Bank and other charges - 3,680,074
61,968,477 149,727,603 43. OTHER INCOME Income from financial assets: Interest income on loan given to employees - 83,555 Income on term deposits - 1,140,111 Mark-up on saving account - 1,457,655 Gain on disposal of investment in TPL Life Insurance Limited - 18,500,707
- 21,182,028 Income from related parties: Mark-up on current account with related parties 7,900 18,293,643 Income from assets other than financial assets: Deferred income - 2,933,336 Gain on disposal of property, plant and equipment - 3,691,013 Others - 2,993,622
- 9,617,971
7,900 49,093,642
2018 2017
Rupees Rupees
2018 2017
Rupees Rupees
FOR THE YEAR ENDED JUNE 30, 2018
NOTES TO THE FINANCIAL STATEMENTS

122
2018 2017
Rupees Rupees
2018 2017
Rupees Rupees
44. TAXATION Current - 30,125,633 Prior - (9,049,561)
- 21,076,072 Deferred - 1,369,626
- 22,445,698 44.1 The returns of the total income of the Company have been filed for and upto tax year 2017 which are
considered as deemed assessments. However, the case of the Company for the tax year 2017 has been selected for total audit u/s 177 of the Income Tax Ordinance, 2001.
44.2 The comparison of tax provisions as per financial statements and tax assesments for last three years
are as follows: Tax Tax Excess / Tax Year Note Provisions Assessments (short) provision (Rupees) (Rupees) (Rupees) 2015 34,046,711 38,082,455 (4,035,744) 2016 52,232,447 42,418,815 9,813,632 2017 44.1 30,125,633 30,125,633 - The Company computes tax provisions based on the generally accepted interpretations of the tax laws
to ensure that sufficient provision for the purpose of taxation is available. Accordingly, the management of the Company has assessed the sufficiency of the tax provisions and believes that the tax provisions are sufficient to reflect the actual tax liability of the Company.
44.3 As of June 30, 2018, the Company has accounting and taxable losses, and no revenue for the year.
Accordingly no provision has been made in these financial statements.
45. (LOSS) / EARNINGS PER SHARE – basic and diluted (Loss) / profit attributable to the ordinary shareholders (103,040,400) 56,903,306 ------- Number of shares ------- Weighted average number of ordinary shares in issue 237,297,763 217,248,963 (Loss) / earnings per share – basic and diluted (0.43) 0.26 There is no dilutive effect on basic earnings per share of the Company. 46. FINANCIAL RISK MANAGEMENT OBJECTIVES AND POLICIES The Company finances its operations through equity, borrowings and management of working capital
with a view of maintaining and appropriate mix between various sources of finance to minimize risks. Taken as a whole, the Company is exposed to market risk, credit risk, and liquidity risk. No changes were made in the objectives, policies or processes and assumptions during the year ended June 30, 2018. The policies for managing each of these risks are summarised below:
FOR THE YEAR ENDED JUNE 30, 2018
NOTES TO THE FINANCIAL STATEMENTS
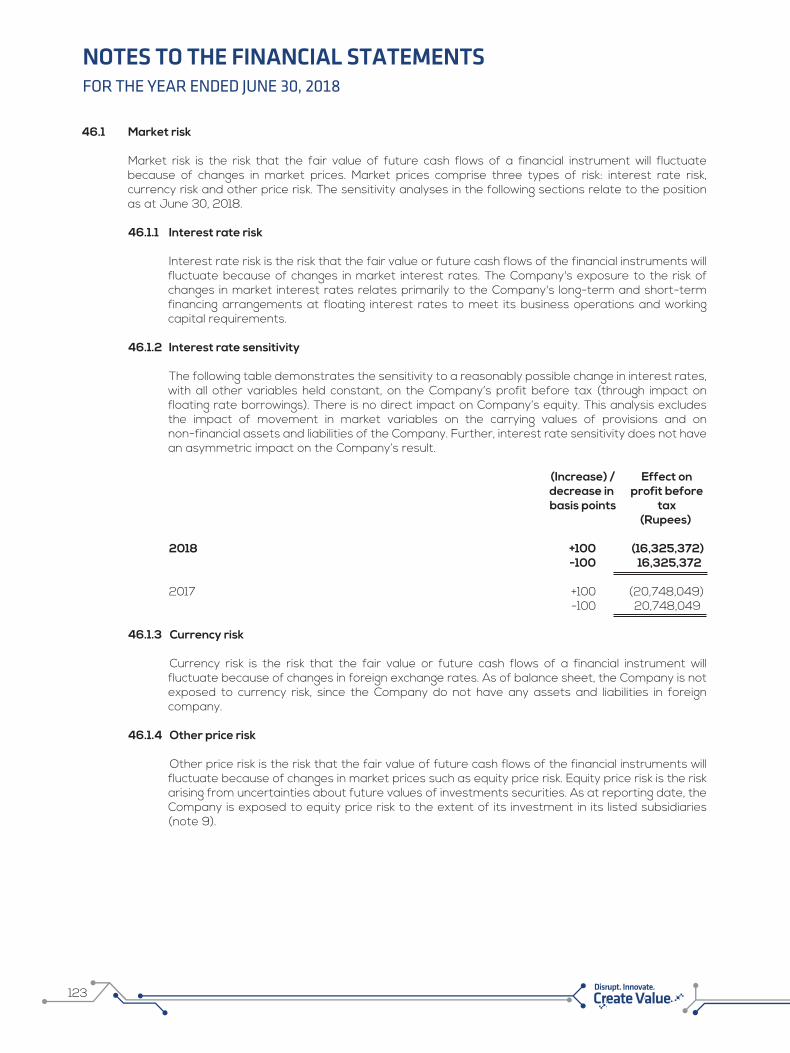
123 Disrupt. Innovate.
46.1 Market risk Market risk is the risk that the fair value of future cash flows of a financial instrument will fluctuate
because of changes in market prices. Market prices comprise three types of risk: interest rate risk, currency risk and other price risk. The sensitivity analyses in the following sections relate to the position as at June 30, 2018.
46.1.1 Interest rate risk Interest rate risk is the risk that the fair value or future cash flows of the financial instruments will
fluctuate because of changes in market interest rates. The Company's exposure to the risk of changes in market interest rates relates primarily to the Company's long-term and short-term financing arrangements at floating interest rates to meet its business operations and working capital requirements.
46.1.2 Interest rate sensitivity The following table demonstrates the sensitivity to a reasonably possible change in interest rates,
with all other variables held constant, on the Company’s profit before tax (through impact on floating rate borrowings). There is no direct impact on Company’s equity. This analysis excludes the impact of movement in market variables on the carrying values of provisions and on non-financial assets and liabilities of the Company. Further, interest rate sensitivity does not have an asymmetric impact on the Company’s result.
(Increase) / Effect on decrease in profit before basis points tax (Rupees)
2018 +100 (16,325,372) -100 16,325,372 2017 +100 (20,748,049) -100 20,748,049 46.1.3 Currency risk Currency risk is the risk that the fair value or future cash flows of a financial instrument will
fluctuate because of changes in foreign exchange rates. As of balance sheet, the Company is not exposed to currency risk, since the Company do not have any assets and liabilities in foreign company.
46.1.4 Other price risk Other price risk is the risk that the fair value of future cash flows of the financial instruments will
fluctuate because of changes in market prices such as equity price risk. Equity price risk is the risk arising from uncertainties about future values of investments securities. As at reporting date, the Company is exposed to equity price risk to the extent of its investment in its listed subsidiaries (note 9).
FOR THE YEAR ENDED JUNE 30, 2018
NOTES TO THE FINANCIAL STATEMENTS

124
46.2 Credit risk
46.2.1 Credit risk is the risk that one party to a financial instrument will cause a financial loss for the other party by failing to discharging an obligation. Out of the total financial assets of Rs. 4,770 million (2017: Rs. 3,036 million), the financial assets which are subject to credit risk amounted to Rs. 80.23 million (2017: Rs. 1,447 million). The Company’s credit risk is primarily attributable to its trade debtors and bank balances. The Company has large number of customers, including corporate and individuals, due to large number and diversity of its customer base, concentration of credit risk with respect to trade debtors is limited. Further, the Company manages its credit risk by obtaining advance monitoring fee for device and service charges and effective implementation of credit policy for its customers.
The credit quality of financial assets that are past due but not impaired is disclosed in note 15.1 to
these financial statements. As at reporting date, there are no financial assets that would otherwise be past due or impaired whose terms have been renegotiated.
46.2.2 The Company monitors the credit policy of its financial assets with reference to historical
performance of such assets and available external credit ratings. The carrying values of financial assets which are neither past due nor impaired are as under:
Long-term loans 10 - 2,339,598 Long-term deposits 11 - 45,331,228 Interest accrued 12 7,900 12,002,478 Due from related parties 13 68,036,252 106,012,827 Trade debts 15 - 506,971,555 Loans and advances 16 10,000,000 - Trade deposits 17 100,000 17,175,549 Other receivables 18 - 19,448,696 Bank balances 21 1,747,962 39,708,526
79,892,114 748,990,457
46.2.3 The credit quality of Company’s bank balances can be assessed with reference to external credit ratings as follows:
Bank Balances by short-term Rating Agency rating category A-1+ JCR-VIS - 4,337,307 A-1 PACRA - 13,733,118 A-1 JCR-VIS 1,747,962 - A2 JCR-VIS - 200,500 A1+ PACRA - 21,255,234 A1 PACRA - 182,367
1,747,962 39,708,526
2018 2017
Note Rupees Rupees
2018 2017
Rupees Rupees
FOR THE YEAR ENDED JUNE 30, 2018
NOTES TO THE FINANCIAL STATEMENTS

125 Disrupt. Innovate.
46.3 Liquidity risk Liquidity risk represents the risk that a Company will encounter difficulties in meeting obligations with the
financial liabilities. The Company's objective is to maintain a balance between continuity of funding and flexibility through the use of bank overdrafts, bank loans and finance lease.
The table below summarises the maturity profile of the Company's financial liabilities at June 30, 2018
and 2017 based on contractual undiscounted payment dates and present market interest rates:
June 30, 2018
Long-term financing - - 398,226,229 789,477,679 1,187,703,908 Trade and other payables - 4,200,000 - - 4,200,000 Accrued markup 2,716,712 3,775,714 - - 6,492,426 Unclaimed dividend 1,747,962 - - - 1,747,962 Unpaid dividend 3,000,000 - - - 3,000,000 Due to related parties 445,000,000 - - - 445,000,000
452,464,674 7,975,714 398,226,229 789,477,679 1,648,144,296
June 30, 2017
Long-term financing 1,622,794 29,842,599 71,707,213 622,968,750 726,141,356 Liabilities against assets
subject to finance lease - 2,655,772 10,553,485 9,042,318 22,251,575 Long-term loans 16,911,220 34,476,833 103,430,947 280,902,776 435,721,776 Trade and other payables 112,878,453 341,172,054 - - 454,050,507 Accrued markup 49,228,099 - - - 49,228,099 Short-term financing 62,238,722 - - - 62,238,722 Running finance under
markup arrangements 876,719,637 - - - 876,719,637 Unpaid dividend 3,000,000 - - - 3,000,000 Due to related parties 87,748,925 - - - 87,748,925
1,210,347,850 408,147,258 185,691,645 912,913,844 2,717,100,597
46.4 Fair value of financial instruments Fair value is the amount for which an asset could be exchanged, or a liability can be settled, between
knowledgeable willing parties in an arm's length transaction. The carrying amounts of all the financial instruments reflected in these financial statements approximate to their fair value.
46.4.1. Fair value hierarchy Financial Instruments carried at fair value are categorized as follows: Level 1: Quoted market price. Level 2: Valuation techniques (market observable) Level 3: Valuation techniques (non- market observables)
On demand Less than 3 months
3 to 12 months
1 to 5 years
Total
------------------------------- (Rupees) -------------------------------
On demand Less than 3 months
3 to 12 months
1 to 5 years
Total
------------------------------- (Rupees) -------------------------------
FOR THE YEAR ENDED JUNE 30, 2018
NOTES TO THE FINANCIAL STATEMENTS

126
46.4.2. The Company held the following financial instruments measured at fair value:
Financial assets June 30, 2018 Available-for-sale investments 4,571,814,415 2,413,544,199 2,158,270,216 - June 30, 2017 Available-for-sale investments 1,099,742,268 673,750,000 425,992,268 - 46.5 Capital management The primary objective of the Company’s capital management is to ensure that it maintains healthy capital
ratios in order to support its business sustain future development of the business and maximise shareholders value. No changes were made in the objectives, policies or processes during the year ended June 30, 2018.
The Company manages its capital structure and makes adjustment to it in the light of changes in
economic conditions. The Company monitors capital using a debt equity ratio, which is net debt divided by total capital plus net debt. Equity comprises of share capital and revenue reserves. The gearing ratio as at June 30, 2018 and 2017 are as follows:
Long-term financing 24 398,226,229 622,968,751 Liabilities against assets subject to finance lease 25 - 10,975,935 Long-term loans 27 - 290,277,330 Accrued mark-up 30 6,492,426 49,228,099 Short-term financing 31 - 62,238,722 Running finance under mark-up arrangements 32 - 876,719,637 Current portion of non-current liabilities 33 789,477,679 259,892,691
Total debts 1,194,196,334 2,172,301,165 Less: Cash and bank balances 21 1,747,962 40,354,665 Net debt 1,192,448,372 2,131,946,500 Share capital 22 2,372,977,630 2,172,489,630 Capital reserve 60,855,762 - Revenue reserves 689,376,880 789,218,929 Surplus on revaluation of property, plant
and equipment - 228,790,596
Total equity 3,123,210,272 3,190,499,155 Total capital 4,315,658,644 5,322,445,655 Gearing ratio 27.63% 40.06%
2018 2017
Note Rupees Rupees
Total Level 1 Level 2 Level 3------------------------- (Rupees) -------------------------
FOR THE YEAR ENDED JUNE 30, 2018
NOTES TO THE FINANCIAL STATEMENTS
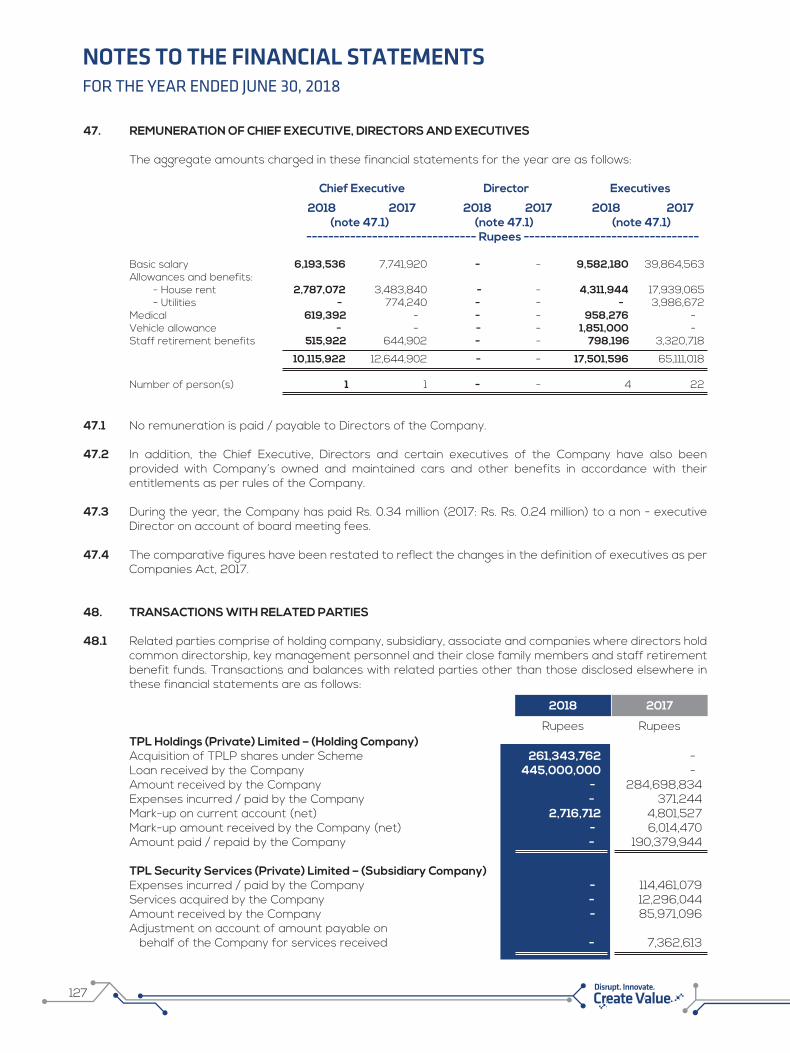
127 Disrupt. Innovate.
47. REMUNERATION OF CHIEF EXECUTIVE, DIRECTORS AND EXECUTIVES The aggregate amounts charged in these financial statements for the year are as follows: Chief Executive Director Executives
2018 2017 2018 2017 2018 2017 (note 47.1) (note 47.1) (note 47.1) ------------------------------- Rupees -------------------------------- Basic salary 6,193,536 7,741,920 - - 9,582,180 39,864,563 Allowances and benefits: - House rent 2,787,072 3,483,840 - - 4,311,944 17,939,065 - Utilities - 774,240 - - - 3,986,672 Medical 619,392 - - - 958,276 - Vehicle allowance - - - - 1,851,000 - Staff retirement benefits 515,922 644,902 - - 798,196 3,320,718
10,115,922 12,644,902 - - 17,501,596 65,111,018 Number of person(s) 1 1 - - 4 22
47.1 No remuneration is paid / payable to Directors of the Company. 47.2 In addition, the Chief Executive, Directors and certain executives of the Company have also been
provided with Company’s owned and maintained cars and other benefits in accordance with their entitlements as per rules of the Company.
47.3 During the year, the Company has paid Rs. 0.34 million (2017: Rs. Rs. 0.24 million) to a non - executive
Director on account of board meeting fees. 47.4 The comparative figures have been restated to reflect the changes in the definition of executives as per
Companies Act, 2017. 48. TRANSACTIONS WITH RELATED PARTIES 48.1 Related parties comprise of holding company, subsidiary, associate and companies where directors hold
common directorship, key management personnel and their close family members and staff retirement benefit funds. Transactions and balances with related parties other than those disclosed elsewhere in these financial statements are as follows:
TPL Holdings (Private) Limited – (Holding Company) Acquisition of TPLP shares under Scheme 261,343,762 - Loan received by the Company 445,000,000 - Amount received by the Company - 284,698,834 Expenses incurred / paid by the Company - 371,244 Mark-up on current account (net) 2,716,712 4,801,527 Mark-up amount received by the Company (net) - 6,014,470 Amount paid / repaid by the Company - 190,379,944 TPL Security Services (Private) Limited – (Subsidiary Company) Expenses incurred / paid by the Company - 114,461,079 Services acquired by the Company - 12,296,044 Amount received by the Company - 85,971,096 Adjustment on account of amount payable on behalf of the Company for services received - 7,362,613
2018 2017
Rupees Rupees
FOR THE YEAR ENDED JUNE 30, 2018
NOTES TO THE FINANCIAL STATEMENTS

128
TPL Properties Limited – (Subsidiary Company) Expenses incurred / paid by the Company - 35,126,409 Amount paid by the Company - 119,245,996 Amount received by the Company - 385,968,500 Mark-up amount received by the Company - 24,524,090 Mark-up on current account - 11,058,507
TPL Insurance Limited – (Subsidiary Company) (TIL) Sales made to TDIL - 508,076,841 Amount refunded by the the Company - 66,871,092 Expenses incurred / paid by the Company on behalf of TDIL - 74,338,590 Amount received from TDIL - 142,354,835 Mark-up on current account - 7,284,585 Payment made by the Company - 68,944,229 Assets purchased by the Company - 319,986,104 Expenditure incurred / paid by TDIL on behalf of the Company - 5,591,857 TPL Life Insurance Limited - (Subsidiary Company) Expenses incurred by the Company - 28,616,942 Expenses paid on behalf of the Company - 4,800,190 Advance paid against expenses - 18,000,000 Amount received by the Company - 4,697,776 Assets purchased by the Company - 158,000 Payments made by the Company - 16,000,000 TPL Trakker Limited - (Subsidiary Company) Expenses incurred on behalf of the Company 105,911,938 1,621,235 Amount received by the Company 181,032,586 - Amount paid to the Company 395,000,000 - Amount paid on behalf of the Company 42,061,494 - TPL Maps (Private) Limited (Subsidiary Company) Expenses incurred by the Company - 421,235 Centrepoint Management Services (Private) Limited – (Sub-subsidiary) Payment received by the Company - 33,415,422 Services rendered to the Company - 51,465,545 TPL Rupiya (Private) Limited - (Subsidiary Company) Expenses incurred by the Company. - 168,562 Markup on current account - 140,768 Trakker Middle East LLC. - (Associated Company) Expenses incurred / paid on behalf of the Company - 28,009 Trakker Direct Finance (Pvt) Limited (Common directorship) Expenses incurred / paid by the Company - 13,875 Mark-up on current account - 69,619 The Resource Group Pakistan Limited - (Common directorship) Mark-up on current account - 535,769
2018 2017
Rupees Rupees
FOR THE YEAR ENDED JUNE 30, 2018
NOTES TO THE FINANCIAL STATEMENTS

129 Disrupt. Innovate.
TPL Logistics (Private) Limited – (Common directorship) Expenses incurred / paid by the Company - 43,717 Markup on current account - 71,896 Staff retirement benefit TPL Trakker Limited – Provident fund Employer contribution 1,314,118 15,006,666
48.2 The related parties status of outstanding receivables and payables as at June 30, 2018 and 2017 are disclosed in respective notes to these financial statements.
48.3 Employees of the following group companies provide services to the Company and their cost are
proportionately charged to the Company: – TPL Holdings (Private) Limited – TPL Trakker Limited – TPL Maps (Pvt.) Limited – TPL Rupiya (Private) Limited
49. INFORMATION ABOUT OPERATING SEGMENTS Consequent to the Scheme of Arrangement as disclosed in note 1.5 to these financial statements, the
businesses of the Company has been transferred. Accordingly, for management purposes, the activities of the Company are organised into one operating segment i.e. Company, as whole.
Following is the geographical breakup of Company’s gross turnover:
Pakistan 1.5 - 1,506,281,654 The revenue information is based on the location of the customer. Non-current assets of the Company are confined within Pakistan and consist of property, plant and
equipment, intangible assets, long-term investments, loans, deposits and receivables. Revenue from TPL Insurance Limited (a customer and subsidiary company) aggregating to Nil (2017: Rs.
221.317 million) comprises more than 10 percent of the Company’s overall revenue related to tracking equipment installation, sales and monitoring fees.
50. CASH AND CASH EQUIVALENTS Cash and bank balances 21 1,747,962 40,354,665 Running finance under mark-up arrangements 32 - (876,719,637)
1,747,962 (836,364,972)
2018 2017
Rupees Rupees
2018 2017
Note Rupees Rupees
2018 2017
Note Rupees Rupees
FOR THE YEAR ENDED JUNE 30, 2018
NOTES TO THE FINANCIAL STATEMENTS

130
51. SUBSEQUENT EVENTS The Board of Directors of the Company in their meeting held on 17th August, 2018 have recommended
cash dividend @ Nil percent amounting to Rs. Nil million (2017: Rs. 54.31 million) on the existing paid-up value of the ordinary share capital for approval of the shareholders in the annual general meeting to be held on October 17, 2018.
52. DATE OF AUTHORISATION OF ISSUE These financial statements were authorised for issue on 17th August, 2018 by the Board of Directors of
the Company. 53. CORRESPONDING FIGURES Corresponding figures have been rearranged and reclassified, wherever considered necessary, for the
purposes of comparison and to reflect the substance of the transactions. Following major reclassification has been made during the year:
Reclassified Amount
From To in Rupees Unclaimed dividend Trade and other payable Statement of financial possition 1,078,801 Unpaid dividend Trade and other payable Statement of financial possition 3,000,000
54. GENERAL 54.1 Number of employees as at June 30, 2018 was 5 (2017: 897) and average number of employees during
the year was 5 (2017: 871). 54.2 All figures have been rounded off to the nearest rupee, unless otherwise stated.
FOR THE YEAR ENDED JUNE 30, 2018
NOTES TO THE FINANCIAL STATEMENTS
Chief Executive Chief Financial Officer Director

EY Ford RhodesChartered AccountantsProgressive Plaza, Beaumont RoadP.O. Box 15541, Karachi 75530Pakistan
Tel: + 9221 3565 0007-11Fax: + 9221 3568 [email protected]/pk
Opinion
We have audited the annexed consolidated financial statements of TPL Corp Limited and its subsidiaries (the Group), which comprise the consolidated statement of financial position as at 30 June 2018, and the consolidated statement of profit or loss and other comprehensive income, the consolidated statement of changes in equity and the consolidated statement of cash flows and for the year then ended, and notes to the consolidated financial statements, including a summary of significant accounting policies and other explanatory information.
In our opinion, consolidated financial statements give a true and fair view of the consolidated financial position of the Group as at 30 June 2018, and of its consolidated financial performance and its consolidated cash flows for the year then ended in accordance with the accounting and reporting standards as applicable in Pakistan.
Basis for Opinion
We conducted our audit in accordance with International Standards on Auditing (ISAs) as applicable in Pakistan. Our responsibilities under those standards are further described in the Auditors' Responsibilities for the Audit of the Consolidated Financial Statements section of our report. We are independent of the Group in accordance with the International Ethics Standards Board for Accountants' Code of Ethics for Professional Accountants as adopted by the Institute of the Chartered Accountants of Pakistan (the Code), and we have fulfilled our other ethical responsibilities in accordance with the Code. We believe that the audit evidence we have obtained is sufficient and appropriate to provide a basis for our opinion.
Key Audit Matters
Key audit matters are those matters that, in our professional judgment, were of most significance in our audit of the consolidated financial statements of the current period. These matters were addressed in the context of our audit of the consolidated financial statements as a whole, and in forming our opinion thereon, and we do not provide a separate opinion on these matters.
Following are the key audit matters:
(Refer note 10 to the accompanying consolidated financial statements)
The intangible assets includes goodwill, indefinite life and under development intangible assets having carrying value of Rs.2,443 million as of 30 June 2018, and tested for impairment at least on an annual basis.
Our audit procedures amongst others, included review of Group's intangible assets impairment process and evaluating the Group's assumptions used in assessing the recoverability of intangible assets, in particular, revenue and cash flow projections, useful economic lives and discount rates.
Key audit matter How the matter was addressed in our audit
1. Impairment of goodwill and intangible assets
131 Disrupt. Innovate.
INDEPENDENT AUDITORS’ REPORTTo the members of TPL Corp LimitedReport on the Audit of Consolidated Financial Statements

(Refer note 8 to the accompanying consolidatedfinancial statements)
The Group has purchased additional 69.12percent shareholding in TPL Insurance Limited (TIL) from Greenoaks Global Holding Limited (the seller) under the terms of sale and purchase agreement (SPA).
As a result of this transaction, the Group shareholding in TIL increased from 24.39 percent to 93.51 percent, by virtue of which, TIL becomes a subsidiary company on acquisition date i.e. 19 December 2017.
The said acquisition have been accounted for asa business combination under International Financial Reporting Standard (IFRS) 3 'Business Combinations' and as a result, the Group has a recognized provisional goodwill amounting to Rs.661 million.
As this acquisition represents a significant transaction for the year due to its impact on the current year's consolidated financial statements, we considered this as a key audit matter.
The determination of recoverable amount requires judgement in both identifying and then valuing the relevant CGUs, and the impairment assessment for such assets involves significant judgments and estimates about future business performance, with key assumptions including cash flows, inflation rates, the overall long-term growth rates, discount rates used and to the extent relevant, the fair value less costs to dispose. Changes in these assumptions might lead to a significant change in the carrying values of the related assets, for such reasons we considered this as a key audit matter.
With respect to the accounting for the acquisition of the subject transaction, we have, amongst others:
- analysed the transaction and the acquisition of control and discussed this with the management and those charged with governance;
- reviewed relevant underlying documents, including the minutes of Board of Directors meeting and SPA for related terms and conditions including consideration paid for acquired assets and liabilities assumed;
- assessed whether the accounting treatment complies with the requirements of IFRS 3 for identification, valuation and accounting of acquired assets and liabilities assumed against the consideration paid, and the recognition of provisional goodwill at acquisition date; and
- tested payment made to the seller from bank statements and transfer of shares from custodian statement.
We also reviewed the adequacy of disclosures in the consolidated financial statements in accordance with the financial reporting standards.
We involved our internal specialist to:
• assessed the key assumptions and methodologies used in the impairment analysis, in particular growth rates, inflation rate and discount rate applied;
• examined the business plans approved and assumptions used by management, including forecasted revenue base, profit from operations margin, working capital for terminal value calculations and cash flows necessary for the continuing use of the CGU's assets and allocated goodwill; and
• evaluated the sensitivity analysis performed by management around the key assumptions for various CGU's as well as performing break-even analysis on key assumptions, and challenged the outcomes of the assessment.
We also assessed the adequacy of disclosures in the consolidated financial statements in accordance with the financial reporting standards.
Key audit matter How the matter was addressed in our audit
2. Acquisition of TPL Insurance Limited
132

Key audit matter How the matter was addressed in our audit
(Refer note 11 to the accompanying consolidated financial statements)
The investment properties comprises Centrepoint Project', principally given as rented office premises to related parties and other companies and is accounted by the Group under fair value model. As of 30 June 2018, the fair value of investment properties amounted to Rs. 5,298 million constituting 31% of total assets of the Group.
In determining the fair value in respect of investment properties, the Group engaged an independent external valuer to perform the valuation, which involves use of assumptions and estimates in terms of estimated selling price, occupancy, condition, market projections, market rents and currency valuation. Changes in any of these key assumptions can have a material impact on the valuation of investment properties.
Due to significant management judgment and estimation relating to valuation assumptions that are inherently complex and require specialist input, and the investment properties value being material to the total assets, we considered this as a key audit matter.
Our audit procedures amongst others, comprised understanding the management valuation process, including the involvement of independent external valuer in performing the valuation of investment properties.
We assessed the competence of the management independent external valuer and reviewed the valuation report prepared by them to understand the basis and methodology used for valuation.
We involved our specialists to review the valuation report of management independent external valuer and to assess the appropriateness of the methodology, assumptions and estimates used to determine the fair value of investment properties under lAS 40 lnvestment Property' (lAS 40).
We also assessed the adequacy of the related disclosures in the consolidated financial statements in accordance with the financial reporting standards.
(Refer note 35 to the accompanying consolidated financial statements)
The Group operates life and general insurance businesses. The liabilities in respect of insurance contracts issued as of 30 June 2018 amounts to Rs. 453 million, which represent 3% of Groups total liabilities.
The methods used and significant assumptions applied in determining the insurance contract liabilities relating to life and general insurance business are disclosed in note 6.19 to the financial statements. We considered valuation of insurance liabilities as a key audit matter due to significant judgment involved in estimating the liabilities and use of experts in this regard.
In obtaining sufficient audit evidence: we tested controls over recording and settlement of claims both in respect of life and general insurance business.
for policy holders' liabilities in respect of life insurance business we assessed the professional competence of the actuary appointed by the management, the methods used and key assumptions applied in estimating the life insurance contract liabilities. In this regard, we also reviewed the accuracy and completeness of the data used for the actuarial valuation of insurance liabilities;
- in respect of general insurance contract liabilities (including IBNR and premium deficiency reserve) which are measured on the basis of undiscounted value of expected future payments, we reviewed historical loss experience and other factors considered by the actuary in developing the expectations of future claim liabilities based on the contract issued at the reporting date;
3. Valuation of investment properties
4. Liabilities against insurance contracts
133 Disrupt. Innovate.

Key audit matter How the matter was addressed in our audit
for general insurance claims we also evaluated the management estimates regarding cost of claims settlements by considering reports of independent surveyors and the estimates regarding salvage values of insured assets; and
we assessed the adequacy of disclosures made in respect of insurance contract liabilities in accordance with the approved accounting standards as applicable in Pakistan.
(Refer note 3 to the accompanying consolidatedfinancial statements)
The Companies Act, 2017 (the Act) became applicable for the first time for the preparation of the Group's annual consolidated financial statements for the year ended 30 June 2018.
The Act forms an integral part of the statutory financial reporting framework as applicable to the Group and amongst others, prescribes the nature and content of disclosures in relation to various elements of the consolidated financial statements.
In the case of the Group, specific additional disclosures and changes to the existing disclosures have been included in note 3 to the consolidated financial statements.
Further, the Group has also changed its accounting policy relating to presentation and measurement of surplus on revaluation of fixed assets as a consequence of the application of the Act with retrospective effect. The impact of the said change in accounting policy has been disclosed in note 6.5 to the consolidated financial statements.
The above changes and enhancements in the consolidated financial statements are considered important and a key audit matter because of the volume and significance of the changes in the consolidated financial statements resulting from the transition to the new reporting requirements under the Act.
We assessed the procedures applied by the management for identification of the changes required in the consolidated financial statements due to the application of the Act. We considered the adequacy and appropriateness of the additional disclosures and changes to the previous disclosures based on the new requirements. We also evaluated the sources of information used by the management for the preparation of the above referred disclosures and the internal consistency of such disclosures with other elements of the consolidated financial statements.
In respect of the change in accounting policy for the accounting and presentation of revaluation surplus as referred to note 6.5 to the consolidated financial statements; we assessed the accounting implications in accordance with the applicable financial reporting standards and evaluated its application in the context of the Group
5. Preparation of financial statements under Companies Act, 2017
134

Information Other than the Financial Statements and Auditors' Report Thereon
Management is responsible for the other information. The other information comprises the information included in the Annual Report, but does not include the consolidated financial statements and our auditors' report thereon.
Our opinion on the consolidated financial statements does not cover the other information and we do not express any form of assurance conclusion thereon.
In connection with our audit of the consolidated financial statements, our responsibility is to read the other information and, in doing so, consider whether the other information is materially inconsistent with the consolidated financial statements or our knowledge obtained in the audit or otherwise appears to be materially misstated. If, based on the work we have performed, we conclude that there is a material misstatement of this other information, we are required to report that fact. We have nothing to report in this regard.
Responsibilities of Management and the Board of Directors for the Consolidated Financial Statements
Management is responsible for the preparation and fair presentation of the consolidated financial statements in accordance with accounting and reporting standards as applicable in Pakistan and Companies Act, 2017 and for such internal control as management determines is necessary to enable the preparation of consolidated financial statements that are free from material misstatement, whether due to fraud or error.
In preparing the consolidated financial statements, management is responsible for assessing the Group's ability to continue as a going concern, disclosing, as applicable, matters related to going concern and using the going concern basis of accounting unless management either intends to liquidate the Group or to cease operations, or has no realistic alternative but to do so.
The Board of directors is responsible for overseeing the Group’s financial reporting process.
Auditors' Responsibilities for the Audit of the Consolidated Financial Statements
Our objectives are to obtain reasonable assurance about whether the consolidated financial statements as a whole are free from material misstatement, whether due to fraud or error, and to issue an auditors' report that includes our opinion. Reasonable assurance is a high level of assurance, but is not a guarantee that an audit conducted in accordance with ISAs as applicable in Pakistan will always detect a material misstatement when it exists. Misstatements can arise from fraud or error and are considered material if, individually or in the aggregate, they could reasonably be expected to influence the economic decisions of users taken on the basis of these consolidated financial statements.
As part of an audit in accordance with ISAs as applicable in Pakistan, we exercise professional judgment and maintain professional skepticism throughout the audit. We also:
• Identify and assess the risks of material misstatement of the consolidated financial statements, whether due to fraud or error, design and perform audit procedures responsive to those risks, and obtain audit evidence that is sufficient and appropriate to provide a basis for our opinion. The risk of not detecting a material misstatement resulting from fraud is higher than for one resulting from error, as fraud may involve collusion, forgery, intentional omissions, misrepresentations, or the override of internal control.
• Obtain an understanding of internal control relevant to the audit in order to design audit procedures that are appropriate in the circumstances, but not for the purpose of expressing an opinion on the effectiveness of the Group's internal control.
• Evaluate the appropriateness of accounting policies used and the reasonableness of accounting estimates and related disclosures made by management.
• Conclude on the appropriateness of management's use of the going concern basis of accounting and, based on the audit evidence obtained, whether a material uncertainty exists related to events or conditions that may cast significant doubt on the Group's ability to continue as a going concern. If we conclude that a material uncertainty exists, we are required to draw attention in our auditors' report to the related disclosures in the consolidated financial statements or, if such disclosures are inadequate, to modify our opinion. Our conclusions are based on the audit evidence obtained up to the date of our auditors' report. However, future events or conditions may cause the Group to cease to continue as a going concern.
• Evaluate the overall presentation, structure and content of the consolidated financial statements, including the disclosures, and whether the consolidated financial statements represent the underlying transactions and events in a manner that achieves fair presentation.
• Obtain sufficient appropriate audit evidence regarding the financial information of the entities or business activities within the Group to express an opinion on the consolidated financial statements. We are responsible for the direction, supervision and performance of the group audit. We remain solely responsible for our audit opinion.
We communicate with the Board of Directors regarding, among other matters, the planned scope and timing of the audit and significant audit findings, including any significant deficiencies in internal control that we identify during our audit.
We also provide the Board of Directors with a statement that we have complied with relevant ethical requirements regarding independence, and to communicate with them all relationships and other matters that may reasonably be thought to bear on our independence, and where applicable, related safeguards.
From the matters communicated with the Board of Directors, we determine those matters that were of most significance in the audit of the consolidated financial statements of the current period and are therefore the key audit matters. We describe these matters in our auditors' report unless law or regulation precludes public disclosure about the matter or when, in extremely rare circumstances, we determine that a matter should not be communicated in our report because the adverse consequences of doing so would reasonably be expected to outweigh the public interest benefits of such communication.
The engagement partner on the audit resulting in this independent auditors' report is Arif Nazeer.
135 Disrupt. Innovate.

Information Other than the Financial Statements and Auditors' Report Thereon
Management is responsible for the other information. The other information comprises the information included in the Annual Report, but does not include the consolidated financial statements and our auditors' report thereon.
Our opinion on the consolidated financial statements does not cover the other information and we do not express any form of assurance conclusion thereon.
In connection with our audit of the consolidated financial statements, our responsibility is to read the other information and, in doing so, consider whether the other information is materially inconsistent with the consolidated financial statements or our knowledge obtained in the audit or otherwise appears to be materially misstated. If, based on the work we have performed, we conclude that there is a material misstatement of this other information, we are required to report that fact. We have nothing to report in this regard.
Responsibilities of Management and the Board of Directors for the Consolidated Financial Statements
Management is responsible for the preparation and fair presentation of the consolidated financial statements in accordance with accounting and reporting standards as applicable in Pakistan and Companies Act, 2017 and for such internal control as management determines is necessary to enable the preparation of consolidated financial statements that are free from material misstatement, whether due to fraud or error.
In preparing the consolidated financial statements, management is responsible for assessing the Group's ability to continue as a going concern, disclosing, as applicable, matters related to going concern and using the going concern basis of accounting unless management either intends to liquidate the Group or to cease operations, or has no realistic alternative but to do so.
The Board of directors is responsible for overseeing the Group’s financial reporting process.
Auditors' Responsibilities for the Audit of the Consolidated Financial Statements
Our objectives are to obtain reasonable assurance about whether the consolidated financial statements as a whole are free from material misstatement, whether due to fraud or error, and to issue an auditors' report that includes our opinion. Reasonable assurance is a high level of assurance, but is not a guarantee that an audit conducted in accordance with ISAs as applicable in Pakistan will always detect a material misstatement when it exists. Misstatements can arise from fraud or error and are considered material if, individually or in the aggregate, they could reasonably be expected to influence the economic decisions of users taken on the basis of these consolidated financial statements.
As part of an audit in accordance with ISAs as applicable in Pakistan, we exercise professional judgment and maintain professional skepticism throughout the audit. We also:
• Identify and assess the risks of material misstatement of the consolidated financial statements, whether due to fraud or error, design and perform audit procedures responsive to those risks, and obtain audit evidence that is sufficient and appropriate to provide a basis for our opinion. The risk of not detecting a material misstatement resulting from fraud is higher than for one resulting from error, as fraud may involve collusion, forgery, intentional omissions, misrepresentations, or the override of internal control.
• Obtain an understanding of internal control relevant to the audit in order to design audit procedures that are appropriate in the circumstances, but not for the purpose of expressing an opinion on the effectiveness of the Group's internal control.
• Evaluate the appropriateness of accounting policies used and the reasonableness of accounting estimates and related disclosures made by management.
Chartered Accountants
Place: Karachi
Date: 24 September 2018
• Conclude on the appropriateness of management's use of the going concern basis of accounting and, based on the audit evidence obtained, whether a material uncertainty exists related to events or conditions that may cast significant doubt on the Group's ability to continue as a going concern. If we conclude that a material uncertainty exists, we are required to draw attention in our auditors' report to the related disclosures in the consolidated financial statements or, if such disclosures are inadequate, to modify our opinion. Our conclusions are based on the audit evidence obtained up to the date of our auditors' report. However, future events or conditions may cause the Group to cease to continue as a going concern.
• Evaluate the overall presentation, structure and content of the consolidated financial statements, including the disclosures, and whether the consolidated financial statements represent the underlying transactions and events in a manner that achieves fair presentation.
• Obtain sufficient appropriate audit evidence regarding the financial information of the entities or business activities within the Group to express an opinion on the consolidated financial statements. We are responsible for the direction, supervision and performance of the group audit. We remain solely responsible for our audit opinion.
We communicate with the Board of Directors regarding, among other matters, the planned scope and timing of the audit and significant audit findings, including any significant deficiencies in internal control that we identify during our audit.
We also provide the Board of Directors with a statement that we have complied with relevant ethical requirements regarding independence, and to communicate with them all relationships and other matters that may reasonably be thought to bear on our independence, and where applicable, related safeguards.
From the matters communicated with the Board of Directors, we determine those matters that were of most significance in the audit of the consolidated financial statements of the current period and are therefore the key audit matters. We describe these matters in our auditors' report unless law or regulation precludes public disclosure about the matter or when, in extremely rare circumstances, we determine that a matter should not be communicated in our report because the adverse consequences of doing so would reasonably be expected to outweigh the public interest benefits of such communication.
The engagement partner on the audit resulting in this independent auditors' report is Arif Nazeer.
136
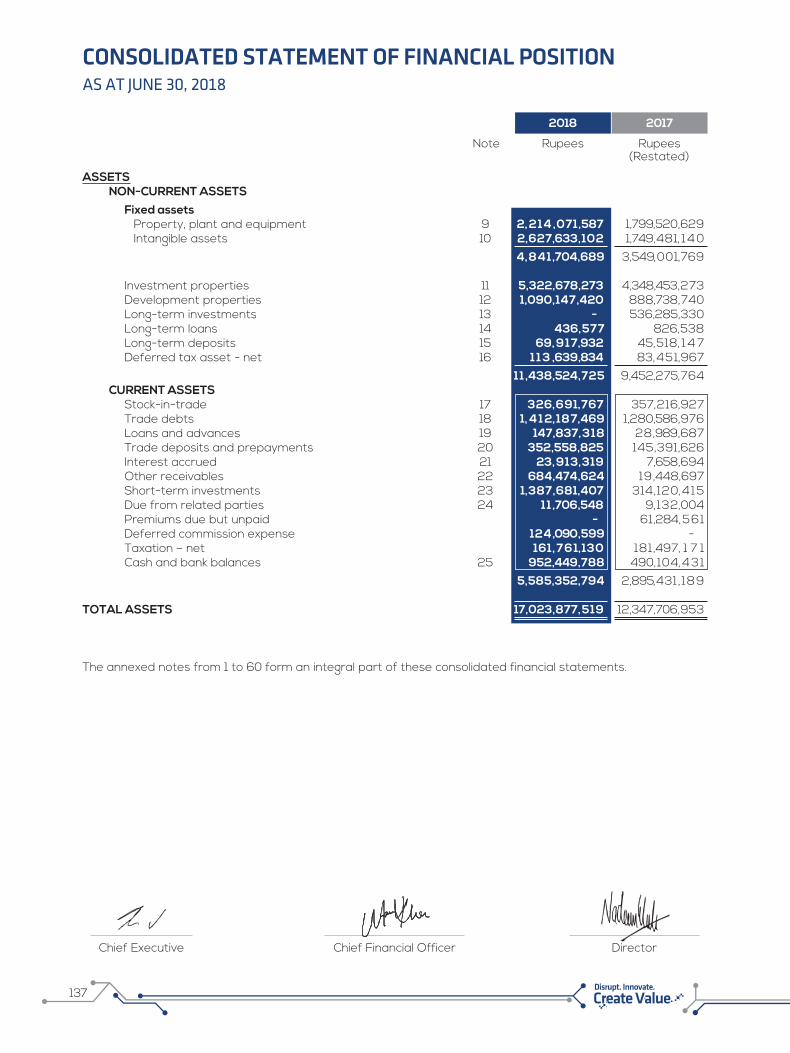
2018 2017
Note Rupees Rupees(Restated)
137 Disrupt. Innovate.
CONSOLIDATED STATEMENT OF FINANCIAL POSITIONAS AT JUNE 30, 2018
ASSETS NON-CURRENT ASSETS Fixed assets Property, plant and equipment 9 2,214,071,587 1,799,520,629 Intangible assets 10 2,627,633,102 1,749,481, 1 4 0 4,841,704,689 3,549,001,769 Investment properties 11 5,322,678,273 4,348,453,273 Development properties 12 1,090,147,420 888,738,740 Long-term investments 13 - 536,285,330 Long-term loans 14 436,577 826,538 Long-term deposits 15 69,917,932 45,518, 1 4 7 Deferred tax asset - net 16 1 1 3 ,639,834 83,451,967 1 1 ,438,524,725 9,452,275,764 CURRENT ASSETS Stock-in-trade 17 326,691,767 357,216,927 Trade debts 18 1, 4 1 2,187,469 1,280,586,976 Loans and advances 19 147,837,318 28,989,687 Trade deposits and prepayments 20 352,558,825 145,391,626 Interest accrued 21 23,913,319 7,658,694 Other receivables 22 684,474,624 19,448,697 Short-term investments 23 1,387,681,407 314,120,415 Due from related parties 24 1 1 ,706,548 9,132,004 Premiums due but unpaid - 61,284,561 Deferred commission expense 124,090,599 - Taxation – net 161,761,130 181,497, 1 7 1 Cash and bank balances 25 952,449,788 490,104,431 5,585,352,794 2,895,431 , 189 TOTAL ASSETS 17,023,877,519 12,347,706,953 The annexed notes from 1 to 60 form an integral part of these consolidated financial statements.
Chief Executive Chief Financial Officer Director

138
2018 2017
Note Rupees Rupees(Restated)
EQUITY AND LIABILITIES SHARE CAPITAL AND RESERVES Share capital Authorised 330,000,000 (2017: 230,000,000) ordinary shares of Rs.10/- each 3,300,000,000 2,300,000,000 Issued, subscribed and paid-up capital 26 2,372,977,630 2,172,489,630 Capital reserves 60,855,762 - Revenue reserves 565,180,315 548,301,049 Surplus on revaluation of property, plant and equipment 27 228,061,064 228,790,596 3,227,074, 7 7 1 2,949,581,275 Non-controlling interest 4,220,902,795 3,978,088,025 7,447,977,566 6,927,669,300 NON-CURRENT LIABILITIES Long-term financing 28 3,287,127,280 2,523,542,514 Liabilities against assets subject to finance lease 29 504,016 10,975,935 Long-term loans 30 308,133,420 290,277,330 Deferred liabilities 31 6,206,490 11,729,338 Accrued mark-up - 4,326,432 3,601,971,206 2,840,851,549 CURRENT LIABILITIES Trade and other payables 32 1,4 3 1 ,299,859 757,916,747 Accrued mark-up 33 131,603,069 105,627,379 Short-term financing 34 419, 1 8 1 ,204 62,238,722 Liabilities against insurance contracts 35 453,328,693 24,950,923 Underwriting provisions 36 824,732,832 - Running finance under mark-up arrangements 37 939,871,844 876,719,637 Current portion of non-current liabilities 38 1,226,350,997 492,142,691 Due to related parties 39 504,988,182 87,949,756 Unclaimed dividend 1,747,962 1,078,801 Unpaid dividend 3,000,000 3,000,000 Advance monitoring fees 40 37,824,105 167,561,448 5,973,928,747 2,579,186, 1 0 4 CONTINGENCIES AND COMMITMENTS 41 TOTAL EQUITY AND LIABILITIES 17,023,877,519 12,347,706,953
The annexed notes from 1 to 60 form an integral part of these consolidated financial statements.
CONSOLIDATED STATEMENT OF FINANCIAL POSITIONAS AT JUNE 30, 2018
Chief Executive Chief Financial Officer Director

CONSOLIDATED STATEMENT OF PROFIT OR LOSS ANDOTHER COMPREHENSIVE INCOME
139 Disrupt. Innovate.
FOR THE YEAR ENDED JUNE 30, 20182018 2017
Note Rupees Rupees(Restated)
Turnover - net 42 3, 4 7 1,416,104 2,168,433,363 Cost of sales and services 43 (1,960,688,714) (1,168,704,303) Gross profit 1, 5 1 0,727,390 999,729,060 Distribution expenses 44 (282,607,965) (214,246,828) Administrative expenses 45 (1,009,139,957) (501,505,198) Operating profit 218,979,468 283,977,034 Other expenses 46 (97, 3 1 1,519) (1,359,659) Finance costs 47 (507,568,032) (334,819,965) Other income 48 1, 1 4 1,482,096 348,374,235 Share of (loss) / profit from investment in associates - net 13.2 & 23.2 (13,147,234) 16,962,359 Profit before taxation 742,434,779 313,134,004 Taxation 49 (72,229, 1 5 1) (44,853,506) Profit for the year 670,205,628 268,280,498 Other comprehensive income to be reclassified to profit or loss in subsequent periods (net of tax): Unrealised loss on available-for-sale investments at fair value (12,325,742) - Other comprehensive income not to be reclassified to profit or loss in subsequent periods (net of tax): Surplus on revaluation of property, plant and equipment - 229,088,489 Other comprehensive (loss) / income for the year, net of tax (12,325,742) 229,088,489 Total comprehensive income for the year 657,879,886 497,368,987 Earnings per share – basic and diluted 50 0.07 0.09 Total comprehensive income attributable to:Owners of the Holding Company 15,949,396 19,746,261 Non-controlling interest 654,256,232 248,534,237 670,205,628 268,280,498 The annexed notes from 1 to 60 form an integral part of these consolidated financial statements.
Chief Executive Chief Financial Officer Director

140
FOR THE YEAR ENDED JUNE 30, 2018
CONSOLIDATED STATEMENT OF CASH FLOWS
2018 2017
Note Rupees RupeesCASH FLOWS FROM OPERATING ACTIVITIES Profit before taxation 742,434,779 313,134,004
Adjustment for non-cash charges and other items: Depreciation 9.1 197,437,309 173,540,920 Amortisation 10.1 52,391,122 54,076,217 Provision for doubtful debts 18.4 14,979,058 19,252,497 Finance costs 47 507,568,032 334,819,965 Gain on disposal of property, plant and equipment 48 (16,454,245) (3,691,013) Gain on bargain purchase 48 - (86,282,392) Valuation gain on investment property 48 (944,646,887) (202,928,224) Share of profit from investment in associates - net 13.2 13,147,234 (29,868,123) Loss on acquisition of TPL Insurance Limited 46 79,494,134 - Reversal of provision for gratuity 31.2 (3,078,404) - Exchange loss – net 46 17,280,153 588,438 Deferred income 31.1 (2,444,444) 4,378,914 (84,326,938) 263,887,199 Operating profit before working capital changes 658,107,841 577,021,203
(Increase) / decrease in current assets Stock-in-trade 30,525,160 (63,091,560) Trade debts (146,579,551) (187,260,924) Loans and advances 146,500,801 4,136,302 Trade deposits and prepayments (13,925,741) (104,960,634) Interest accrued (15,591, 6 1 1) 163,484 Other receivables (125,598,960) (37,820,996) Due from related parties (2,574,544) 18,563,457 Premiums due but unpaid 61,284,560 (61,284,560) Deferred commission expense (18,513,632) - (84,473,518) (431,555,431) Increase / (decrease) in current liabilities Trade and other payables 407,273,023 166,438,338 Liabilities against insurance contracts 181,409,223 - Underwriting provisions (24,612,215) - Due to related parties 417,038,426 (35,842,092) Advance monitoring fees (129,737,343) 62,279,778 851,371, 1 1 4 192,876,024 Cash flows from operations 1,425,005,437 351,247,566 Finance costs paid (485,918,773) (408,826,857) Income taxes paid (91,407,145) (141,410,609) (577,325,918) (550,237,466) Net cash flows from / (used in) operating activities 847,679,519 (198,989,900)
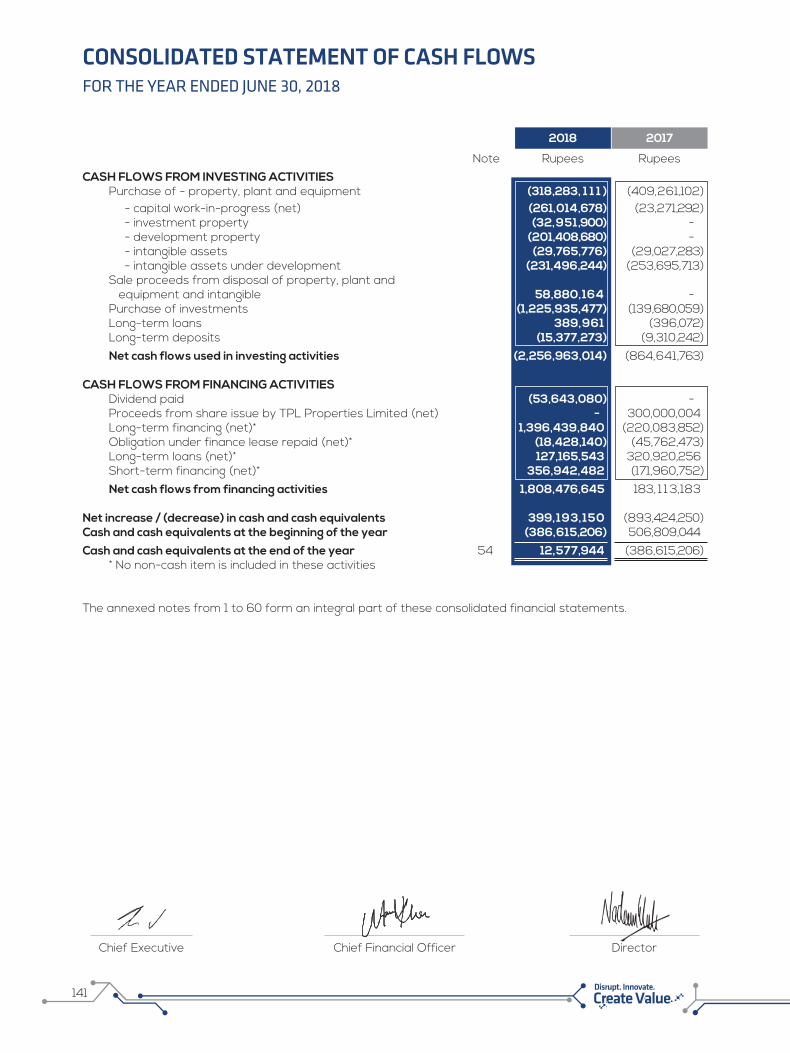
141 Disrupt. Innovate.
CASH FLOWS FROM INVESTING ACTIVITIES Purchase of - property, plant and equipment (318,283, 1 1 1 ) (409,261,102) - capital work-in-progress (net) (261,014,678) (23,271,292) - investment property (32,951,900) - - development property (201,408,680) - - intangible assets (29,765,776) (29,027,283) - intangible assets under development (231,496,244) (253,695,713) Sale proceeds from disposal of property, plant and equipment and intangible 58,880,164 - Purchase of investments (1,225,935,477) (139,680,059) Long-term loans 389,961 (396,072) Long-term deposits (15,377,273) (9,310,242) Net cash flows used in investing activities (2,256,963,014) (864,641,763) CASH FLOWS FROM FINANCING ACTIVITIES Dividend paid (53,643,080) - Proceeds from share issue by TPL Properties Limited (net) - 300,000,004 Long-term financing (net)* 1,396,439,840 (220,083,852) Obligation under finance lease repaid (net)* (18,428,140) (45,762,473) Long-term loans (net)* 127,165,543 320,920,256 Short-term financing (net)* 356,942,482 (171,960,752) Net cash flows from financing activities 1,808,476,645 183, 1 1 3,183 Net increase / (decrease) in cash and cash equivalents 399,193,150 (893,424,250)Cash and cash equivalents at the beginning of the year (386,615,206) 506,809,044 Cash and cash equivalents at the end of the year 54 12,577,944 (386,615,206) * No non-cash item is included in these activities
The annexed notes from 1 to 60 form an integral part of these consolidated financial statements.
2018 2017
Note Rupees Rupees
FOR THE YEAR ENDED JUNE 30, 2018
CONSOLIDATED STATEMENT OF CASH FLOWS
Chief Executive Chief Financial Officer Director
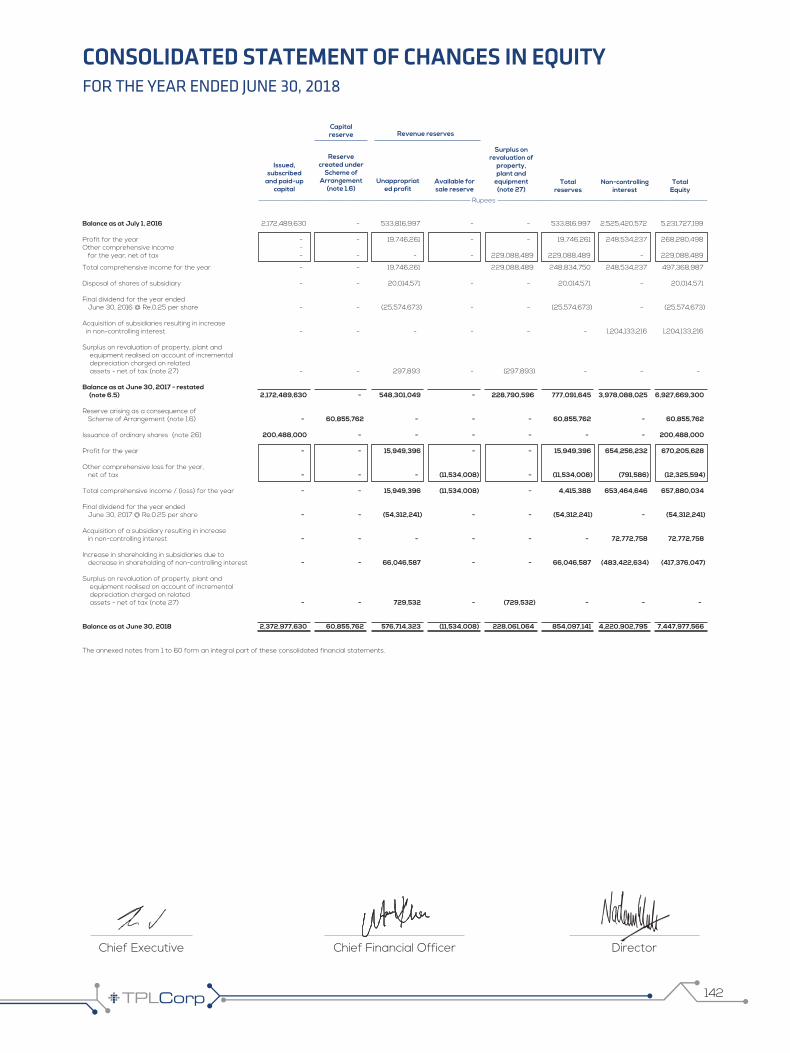
142
FOR THE YEAR ENDED JUNE 30, 2018
CONSOLIDATED STATEMENT OF CHANGES IN EQUITY
Balance as at July 1, 2016 2,172,489,630 - 533,816,997 - - 533,816,997 2,525,420,572 5,231,727,199 Profit for the year - - 19,746,261 - - 19,746,261 248,534,237 268,280,498 Other comprehensive income - for the year, net of tax - - - - 229,088,489 229,088,489 - 229,088,489
Total comprehensive income for the year - - 19,746,261 229,088,489 248,834,750 248,534,237 497,368,987 Disposal of shares of subsidiary - - 20,014,571 - - 20,014,571 - 20,014,571 Final dividend for the year ended June 30, 2016 @ Re.0.25 per share - - (25,574,673) - - (25,574,673) - (25,574,673) Acquisition of subsidiaries resulting in increase in non-controlling interest - - - - - - 1,204,133,216 1,204,133,216 Surplus on revaluation of property, plant and equipment realised on account of incremental depreciation charged on related assets - net of tax (note 27) - - 297,893 - (297,893) - - - Balance as at June 30, 2017 - restated (note 6.5) 2,172,489,630 - 548,301,049 - 228,790,596 777,091,645 3,978,088,025 6,927,669,300 Reserve arising as a consequence of Scheme of Arrangement (note 1.6) - 60,855,762 - - - 60,855,762 - 60,855,762 Issuance of ordinary shares (note 26) 200,488,000 - - - - - - 200,488,000 Profit for the year - - 15,949,396 - - 15,949,396 654,256,232 670,205,628 Other comprehensive loss for the year, net of tax - - - (11,534,008) - (11,534,008) (791,586) (12,325,594) Total comprehensive income / (loss) for the year - - 15,949,396 (11,534,008) - 4,415,388 653,464,646 657,880,034 Final dividend for the year ended June 30, 2017 @ Re.0.25 per share - - (54,312,241) - - (54,312,241) - (54,312,241) Acquisition of a subsidiary resulting in increase in non-controlling interest - - - - - - 72,772,758 72,772,758 Increase in shareholding in subsidiaries due to decrease in shareholding of non-controlling interest - - 66,046,587 - - 66,046,587 (483,422,634) (417,376,047) Surplus on revaluation of property, plant and equipment realised on account of incremental depreciation charged on related assets - net of tax (note 27) - - 729,532 - (729,532) - - - Balance as at June 30, 2018 2,372,977,630 60,855,762 576,714,323 (11,534,008) 228,061,064 854,097,141 4,220,902,795 7,447,977,566
The annexed notes from 1 to 60 form an integral part of these consolidated financial statements.
Issued, subscribed
and paid-up capital
Reserve created under
Scheme of Arrangement
(note 1.6)Unappropriat
ed profitAvailable for sale reserve
Surplus on revaluation of
property, plant and
equipment(note 27)
Total reserves
----------------------------------------------------------------------------------------- Rupees ----------------------------------------------------------------------------------------
Non-controlling interest
Total Equity
Capital reserve Revenue reserves
Chief Executive Chief Financial Officer Director

FOR THE YEAR ENDED JUNE 30, 2018
NOTES TO THE CONSOLIDATED FINANCIAL STATEMENTS
143 Disrupt. Innovate.
1. LEGAL STATUS AND OPERATIONS 1.1 The Group consists of TPL Corp Limited (the Holding Company) and its subsidiary companies i.e. TPL
Insurance Limited, TPL Properties Limited and its subsidiaries [i.e. Centrepoint Management Services (Private) Limited, HKC Limited and G-18 (Private) Limited], TPL Life Insurance Limited, TPL Maps (Pvt.) Limited, TPL Trakker Limited, TPL Security Services (Private) Limited and TPL Rupiya (Private) Limited that have been consolidated in these financial statements.
1.2 Holding Company
TPL Trakker Limited was incorporated in Pakistan on December 04, 2008 as a private limited company under the repealed Companies Ordinance, 1984 (now Companies Act, 2017). In year 2009, the Holding Company was converted into a public company and got listed on Pakistan Stock Exchange Limited on July 16, 2012. During the year, the name of the Holding Company has been changed to TPL Corp Limited with effect from November 24, 2017. Currently, the principal activity of the Company is to make investment in group and other companies. TPL Holdings (Private) Limited is the ultimate parent company by virtue of 56.99 percent (2017: 52.91 percent) shareholding as of the reporting date.
1.3 As of reporting date, the Holding Company has the following subsidiaries and associates: % of shareholding 2018 2017 Subsidiaries TPL Insurance Limited [TIL] 93.51 - TPL Properties Limited [TPLP] 29.62 20.11 Centrepoint Management Services (Private) Limited
(sub-subsidiary) [CMS] 29.62* 20.11* HKC Limited (sub-subsidiary) [HKC] 29.62* 20.11* G-18 (Private) Limited (sub-subsidiary) [G-18] 29.62* - TPL Life Insurance Limited [TPLL] 86.43 86.02 TPL Maps (Pvt.) Limited [TMPL] 100 100 TPL Trakker Limited [TTL] 100 100 TPL Security Services (Private) Limited [TSS] 99.90 99.90 TPL Rupiya (Private) Limited [TPLR] 99.99 - Associates TPL Insurance Limited [TIL] - 24.39 Trakker Middle East LLC [TME] 29 29 * Represents direct holding of TPLP as at the reporting date. 1.3.1 TPL Insurance Limited [TIL]
TIL was incorporated in Pakistan in 1992 as a public limited company under the repealed Companies Ordinance, 1984 (now Companies Act, 2017). During the year, the name of a subsidiary has been changed to TPL Insurance Limited (TIL). The principal activity of TIL is to carry on general insurance business. TIL is listed on Pakistan Stock Exchange Limited with effect from September 22, 2011. The financial year end of TIL is December 31.
In addition to general insurance business, TIL also operate as Window Takaful Operator (WTO) under permission from Securities and Exchange Commission of Pakistan (SECP). In this regard, the TIL has formed a Waqf / Participant Takaful Fund (PTF) which is managed by TIL under the Waqf deed. As of reporting date, the assets, liabilities, income and expenses of PTF are as follows

144
Total assets 738,479,779 669,372,723 Total liabilities 935,329,589 822,532,982 Underwriting results (61,177,212) (46,639,042) Deficit for the year (53,697,667) (43,684,723) Total comprehensive loss for the year (61,689,551) (43,519,646)
1.3.2 TPL Properties Limited [TPLP] TPLP was a private limited company incorporated in Pakistan on February 14, 2007 under the
repealed Companies Ordinance, 1984 (now Companies Act, 2017). Subsequently in 2016, TPLP has changed its status from private limited company to public company and got listed on Pakistan Stock Exchange Limited. The principal activity of TPLP is to invest, purchase, develop and build real estate and to sell, rent out or otherwise dispose off in any manner the real estate including commercial and residential buildings, houses, shops, plots or other premises. The financial year end of TPLP is June 30.
As of reporting date, the Holding Company has reassessed as to whether or not the Holding
Company alongwith the ultimate parent company and other related parties have a defacto control over TPLP as required under International Financial Reporting Standards 10 'Consolidated Financial Statements' (lFRS 10). Based on such assessment, the management has concluded that the Holding Company alongwith other related parties has a defacto control over TPLP having the majority shareholding of 45.54 percent (2017: 40.26 percent) and representation on the board of directors of TPLP (i.e. 05 out of 08 directors) to appoint majority of the directors on Board of TPLP. Accordingly, as of June 30, 2018, the Holding Company continues to account for TPLP as it's subsidiary in these consolidated financial statements.
1.3.3 Centrepoint Management Services (Private) Limited (sub-subsidiary) [CMS]
CMS was incorporated in Pakistan as a private limited company on August 10, 2011 under repealed Companies Ordinance, 1984 (now Companies Act, 2017. The principal activity of CMS is to provide building maintenance services to all kinds and description of residential and commercial buildings. The financial year end of CMS is June 30.
1.3.4 HKC Limited (sub-subsidiary) [HKC]
HKC was incorporated in Pakistan on September 13, 2005 as a public limited company under the repealed Companies Ordinance, 1984 (now Companies Act, 2017). HKC is principally engaged in the acquisition and development of real states and renovation of buildings and letting out. The financial year end of HKC is June 30. As of reporting date, HKC is not generating revenue as it is in the process of developing the property, therefore it is fully supported by the financial support of the TPLP to activate its full potential in order to make adequate profits and generate positive cashflows.
1.3.5 G-18 (Private) Limited (sub-subsidiary) [G-18]
G-18 is a private limited company incorporated during the year for the purpose of property development. However, as of the reporting date no share capital has been injected and G-18 has not commenced its operations.
2018 2017
Note Rupees Rupees
FOR THE YEAR ENDED JUNE 30, 2018
NOTES TO THE CONSOLIDATED FINANCIAL STATEMENTS

145 Disrupt. Innovate.
FOR THE YEAR ENDED JUNE 30, 2018
NOTES TO THE CONSOLIDATED FINANCIAL STATEMENTS
1.3.6 TPL Life Insurance Limited [TPLL] TPLL was incorporated on March,19 2008 under the repealed Companies Ordinance, 1984 (now
Companies Act, 2017) as a public limited company and is registered as a life insurance company with the Securities and Exchange Commission of Pakistan (SECP) under the Insurance Ordinance, 2000. TPLL obtained license to carry on life and related lines of insurance business on March 2, 2009. TPLL is engaged in life insurance business including ordinary life business, accidental and health business. The financial year end of TPLL is December 31.
1.3.7 TPL Maps (Pvt.) Limited
TPLM was incorporated in Pakistan on December 27, 2016 as a private limited company under the repealed Companies Ordinance, 1984 (now Companies Act, 2017). The principal activity of the TPLM is provide navigation services. The financial year end of TPLM is June 30.
1.3.8 TPL Trakker Limited [TTL]
TTL was incorporated in Pakistan on December 27, 2016 as a private limited company under the repealed Companies Ordinance, 1984 (now Companies Act, 2017). The principal activity of the TTL is installation and sale of tracking devices, vehicle tracking and fleet management. The financial year end of TPLL is June 30.
1.3.9 TPL Security Services (Private) Limited [TSS]
TSS is a private limited company incorporated on May 01, 2000 in Pakistan under the repealed Companies Ordinance, 1984 (now Companies Act, 2017). The principal activity of TSS is to provide security services. The financial year end of TSS is June 30. TSS is fully supported by the financial assistance of the Holding Company for smooth running of business operations.
1.3.10 TPL Rupiya (Private) Limited [TPLR] TPLR is incorporated as a private limited company in Pakistan on April 7, 2015 under the repealed
Companies Ordinance, 1984 (now Companies Act, 2017). The principal activity of the TPLR is to establish and operate as a Mobile Payment Switch that allows mobile payment users to make payment using Near Field Communication (NFC) enabled tag cards, under the Payment Systems Operators (PSOs) and Payment Service Providers (PSPs) Rules issued by State Bank of Pakistan (SBP) under Payment System and Electronic Fund Transfer Act, 2007. In this regard, SBP vide their letter No. PSD PR-03 (vii)/010743/2016 dated April 29, 2016 has granted conditional in-principle approval to TPLR which was further extended for three months valid till March 02, 2017 vide letter No. PSD PR-03 (vii)/001573/2017 dated January 20, 2017. TPLR is discussing various aspects of the approval with SBP and expects to receive the extension in due course of time. Currently, TPLR is engaged in the business of E-ticketing services transferred from one of the group companies. The financial year end of TPLR is June 30.
1.3.11 Trakker Middle East L.L.C. (TME) TME is a limited liability company registered in Abu Dhabi, United Arab Emirates. The registered
office of TME is at P.O. Box 52331, Abu Dhabi, United Arab Emirates. The principal activities of TME are the selling, marketing and distribution of products and services in the field of wireless, fleet management, tracking and telemetry services. The book value per share amounts to AED. 764 (2017: AED 1,715) based on the latest available un-audited financial statements for the period ended June 30, 2018.

146
FOR THE YEAR ENDED JUNE 30, 2018
NOTES TO THE CONSOLIDATED FINANCIAL STATEMENTS
The name of Chief Executive is Asim Syed and name/addresses of beneficial owners are as follows:
Name Addresses Al Jaber Group LLC P.O. Box #: 2175, Abu Dhabi Petrolium Service Area Plot No. 1 & 1A. Jamal Mohd Matar Al Hai P.O. Box #: 2116, Dubai UAE.
The auditors of the TME has expressed an unqualified opinion on the latest available financial statement. Based on the approval of Board of Directors of the Holding Company in their meeting held on April 23, 2015 to consider and negotiate an offer to disinvest entire shareholding in TME, the Holding Company had conditionally accepted an offer for disposal of its entire shareholding in TME, subject to obtaining the necessary approvals, compliance of legal formalities and signing of a binding sale agreement to execute the transaction.
1.4 Geographical location and addresses of business units of the Group are as under: Location Addresses a) Holding Company Corporate office, Karachi 12th and 13th Floor, Centrepoint Building, Off Shaheed-e-Millat
Expressway, Adjacent KPT Interchange, Karachi.
Regional offices: Karachi office 20-B, Block 6, P.E.C.H.S., Karachi. Hyderabad office A-8 District Council Complex, Hyderabad. Lahore office 51-M, Denim Road, Quaid-e-Azam Industrial Estate
Kot Lakhpat, Lahore. Islamabad office 10th Floor (South) ISE Towers, 55-B, Jinnah Avenue, Blue Area,
Islamabad. Faisalabad office P6161, West Canal road, Adjacent to Toyota Faisalabad Motors,
Faisalabad. Multan office House No. 5, Suraj Miani Road, Opp. Ashraf Cardiac Clinic,
Chungi No. 1, Multan. Peshawar office C-7 & C-8 3rd Floor, Jasmine Arcade, Fakhr-e-Alam Road,
Peshawar.
b) Subsidairy companies
Location Addresses Corporate / registered office at Karachi TPL Insurance Limited Centrepoint Building, Off Shaheed-e-Millat Expressway,
Adjacent KPT Interchange.

147 Disrupt. Innovate.
FOR THE YEAR ENDED JUNE 30, 2018
NOTES TO THE CONSOLIDATED FINANCIAL STATEMENTS
TPL Properties Limited Centrepoint Building, Off Shaheed-e-Millat Expressway, Adjacent KPT Interchange.
Centrepoint Management Services Centrepoint Building, Off Shaheed-e-Millat Expressway,
Adjacent KPT Interchange. (Private) Limited (sub-subsidiary) HKC Limited (sub-subsidiary) Centrepoint Building, Off Shaheed-e-Millat Expressway,
Adjacent KPT Interchange. Development property site Plot No 22/7, Street CL-9, Civil Lines Quarter, Karachi G-18 (Private) Limited (sub-subsidiary) Centrepoint Building, Off Shaheed-e-Millat Expressway, Adjacent KPT Interchange. TPL Life Insurance Limited Centrepoint Building, Off Shaheed-e-Millat Expressway,
Adjacent KPT Interchange. TPL Maps (Pvt.) Limited Centrepoint Building, Off Shaheed-e-Millat Expressway,
Adjacent KPT Interchange. TPL Trakker Limited Centrepoint Building, Off Shaheed-e-Millat Expressway,
Adjacent KPT Interchange. TPL Security Services (Private) Limited Centrepoint Building, Off Shaheed-e-Millat Expressway,
Adjacent KPT Interchange. TPL Rupiya (Private) Limited Centrepoint Building, Off Shaheed-e-Millat Expressway,
Adjacent KPT Interchange. 1.5 During the year, the authorised share capital of the Holding Company has been increased from
230,000,000 ordinary shares to 330,000,000 ordinary shares having face value of Rs.10 each.
1.6 During the year, the Scheme of Arrangement (the Scheme) was executed on July 01, 2017 among the Holding Company, TPL Maps (Pvt.) Limited, TPL Trakker Limited (formerly known as TPL Vehicle Tracking (Private) Limited) and TPL Holdings (Private) Limited [THPL, the ultimate parent company] for:
- separating / demerging of the Holding Company’s Maps Undertaking and Trakker Undertaking and merging and amalgamating the same with and into TMPL and TTL against the issue of shares by respective entities to the Holding Company; and
- separating / demerging the Properties Undertaking (i.e. 21,104,000 ordinary shares of TPL Properties Limited (TPLP) having face value of Rs.10 each) from THPL and merging and amalgamating the same with and into the Holding Company, against the issue of shares of the Holding Company to THPL, along with all ancillary matters.
The shareholders of the Holding Company in their extra ordinary general meeting held on April 14, 2017 approved the Scheme under Sections 284 to 288 of the repealed Companies Ordinance, 1984 (now Companies Act, 2017). The Scheme was sanctioned / approved by the Honorable High Court of Sindh vide its order number J.C.M. Petition No.48 of 2016 dated November 17, 2017 and in accordance therewith, the effective date of Scheme was July 01, 2017.

148
FOR THE YEAR ENDED JUNE 30, 2018
NOTES TO THE CONSOLIDATED FINANCIAL STATEMENTS
2. SUMMARY OF SIGNIFICANT TRANSACTIONS AND EVENTS
Following is the summary of significant transactions and events that have affected the Group financial position and performance:
a) Scheme of arrangement - note 1.6 b) Acquisition of additional shares of TPL Insurance Limited - note 8 c) Issue of term finance certificates - note 28 d) Adoption of Companies Act 2017 - note 3
3. STATEMENT OF COMPLIANCE These consolidated financial statements have been prepared in accordance with the accounting and
reporting standards as applicable in Pakistan. The accounting and reporting standards applicable in Pakistan comprise of International Financial Reporting Standards (IFRSs), issued by International Accounting Standard Board (IASB) as notified under Companies Act, 2017 (the Act) and, provisions of and directives issued under the Act. Where the provisions of and directives issued under the Act differ from the IFRSs, the provisions of and directives issued under the Act have been followed.
The Act has also brought certain changes with regard to the preparation and presentation of these consolidated financial statements. These changes, amongst others, included change in nomenclature of primary statements and change in respect of presentation and measurement of surplus on revaluation of property, plant and equipment (note 6.5). Further, the disclosure requirements contained in the Fourth Schedule of the Act have been revised, resulting in elimination of duplicative disclosure with the IFRSs disclosure requirements and incorporation of additional amended disclosures including, but not limited to, particulars of immovable assets of the Company (note 9.1.7), management assessment of sufficiency of tax provision in the financial statements (note 49.2), change in threshold for identification of executives (notes 14 and 52), additional disclosure requirements for related parties (notes 7 and 53), etc.
4. BASIS OF PREPARATION
These consolidaed financial statements have been prepared under the ‘historical cost’ convention, unless otherwise specifically stated.
5. BASIS OF CONSOLIDATION These consolidated financial statements comprises the financial statements of the Holding Company and
its subsidiaries as at June 30, 2018, here-in-after referred to as ‘the Group’. Subsidiaries Subsidiaries are those entities over which the Group has control. Control is achieved when the Group is
exposed, or has rights, to variable returns from its involvement with the investee and has the ability to affect those returns through its power over the investee.

149 Disrupt. Innovate.
FOR THE YEAR ENDED JUNE 30, 2018
NOTES TO THE CONSOLIDATED FINANCIAL STATEMENTS
Specifically, the Group controls an investee if, and only if, the Group has:
- power over the investee (i.e., existing rights that give it the current ability to direct the relevant activities of the investee);
- exposure, or rights, to variable returns from its involvement with the investee; and - the ability to use its power over the investee to affect its returns. Generally, there is a presumption that a majority of voting rights results in control. To support this presumption
and when the Group has less than a majority of the voting or similar rights of an investee, the Group considers all relevant facts and circumstances in assessing whether it has power over an investee, including:
- the contractual arrangement(s) with the other vote holders of the investee; - rights arising from other contractual arrangements; and - the Group’s voting rights and potential voting rights. The Group re-assesses whether or not it controls an investee if facts and circumstances indicate that
there are changes to one or more of the three elements of control. Subsidiaries are consolidated from the date on which the Group obtains control, and continue to be
consolidated until the date when such control ceases. Assets, liabilities, income and expenses of a subsidiary acquired or disposed off during the year are included in the profit or loss from the date the Group gains control until the date the Group ceases to control the subsidiary.
Identifiable assets acquired and liabilities and contingent liabilities assumed in a business combination
are measured initially at their fair values at the acquisition date, irrespective of the extent of any non-controlling interest. The excess of the cost of acquisition is recorded as goodwill. If the cost of acquisition is less than fair value of the net assets of the subsidiary acquired, the difference is recognised directly in the profit or loss.
After initial recognition, goodwill is measured at cost less accumulated impairment losses, if any. For the
purposes of impairment testing, goodwill acquired in a business combination is, on the acquisition date, allocated to each of the Group’s cash generating units that are expected to benefit from the combination. Goodwill is tested annually or whenever there is an indication of impairment exists. Impairment loss in respect of goodwill is recognised in profit or loss and is not reversed in future periods.
The assets, liabilities, income and expenses of subsidiary companies are consolidated on a line by line basis and the carrying value of investments held by the Holding Company is eliminated against the subsidiaries’ shareholders’ equity in the consolidated financial statements.
All intra-group transactions, balances, income, expenses and unrealised gains and losses on transactions
between Group companies are eliminated in full. The subsidiaries has same reporting period as that of the Holding Company, however, the accounting policies
of subsidiaries have been changed to confirm with accounting policies of the Group, wherever needed.
When the ownership of a subsidiary is less than 100 percent and, therefore, a non-controlling interest (NCI) exists, the NCI is allocated on its share of the total comprehensive income of the period, even if that results in a deficit balance.
A change in the ownership interest of subsidiary, without a loss of control, is accounted for as an equity
transaction. If the Group losses control over subsidiary, it derecognises the assets (including goodwill) and liabilities of the subsidiary, carrying amount of any NCI, cumulative translation differences recognised in equity, and recognises fair value of consideration received, any investment retained, surplus or deficit in the profit or loss, and reclassifies the Holding Company share of component previously recognised in other comprehensive income to profit or loss, or retained earnings, as appropriate.

150
FOR THE YEAR ENDED JUNE 30, 2018
NOTES TO THE CONSOLIDATED FINANCIAL STATEMENTS
Associates An associate is an entity over which the Group has significant influence. Significant influence is the power
to participate in the financial and operating policy decisions of the investee, but is not control or joint control over those policies. The considerations made in determining significant influence or joint control are similar to those necessary to determine control over subsidiaries.
The Group’s investment in its associate is accounted for using the equity method of accounting. Under
the equity method, the investment in the associate is carried in the statement of financial position at cost plus post acquisition changes in the Group’s share of net assets of the associate. Goodwill relating to the associate is included in the carrying amount of the investment and is not amortised or separately tested for impairment.
The Group’s share of its associate’s post-acquisition profits and losses is recognised in the profit or loss,
and its share of profit of post-acquisition movements in reserve is recognised in consolidated reserves. The cumulative post-acquisition movements are adjusted against the investment. When the Group’s share of losses in the associate equals or exceeds its interest in associate, including any other unsecured receivables, the Group does not recognise further losses, unless it has incurred obligations or made payments on behalf of the associate.
Unrealised gains on transactions between the Group and its associate are eliminated to the extent of
the Group’s interest in the associate. Unrealised losses are also eliminated unless the transaction provides evidence of an impairment of the asset transferred.
Upon loss of significant influence over the associate or joint control over the joint venture, the Group
measures and recognises any retained investment at its fair value. Any difference between the carrying amount of the associate or joint venture upon loss of significant influence or joint control and the fair value of the retained investment and proceeds from disposal is recognised in profit or loss.
6. SUMMARY OF SIGNIFICANT ACCOUNTING POLICIES
6.1 Standards, amendments and interpretations adopted during the year
The accounting policies adopted in the preparation of these consolidated financial statements are consistent with those of the previous financial year except as stated below:
Amended Standards
The Group has adopted the following amended standards which became effective for the current year:
IAS 7 Statement of Cash Flows - Disclosure Initiative - (Amendment) IAS 12 Income Taxes - Recognition of Deferred Tax Assets for Unrealised losses (Amendments)
The adoption of the above amendments to accounting standards did not have any material effect on these consolidated financial statements.
6.2 Significant accounting judgments, estimates and assumptions The preparation of consolidated financial statements in conformity with accounting and reporting standards
requires the use of certain critical accounting estimates. It also requires management to exercise its judgments in the process of applying the Group’s accounting policies. Judgments, estimates and assumptions are continually evaluated and are based on historic experience and other factors, including expectations of future events that are believed to be reasonable under the circumstances. Revisions to accounting estimates are recognised in the period in which the estimate is revised and in any future periods affected.

151 Disrupt. Innovate.
FOR THE YEAR ENDED JUNE 30, 2018
NOTES TO THE CONSOLIDATED FINANCIAL STATEMENTS
In the process of applying the Group’s accounting policies, management has made the following judgments, estimates and assumptions which are significant to these consolidated financial statements:
a) Operating fixed assets and intangible assets
The Group reviews the useful lives, methods of depreciation / amortisation and residual values of operating fixed assets on the reporting date. Any change in the estimates in future years might affect the carrying amounts of the respective items of operating fixed assets and intangible assets with a corresponding effect on the depreciation / amortisation charge and impairment. The Group assesses at each balance sheet date whether there is any indication that assets may be impaired. If such indication exists, the carrying amounts of such assets are reviewed to assess whether they are recorded in excess of their recoverable amount. Where carrying value exceeds recoverable amount, assets are written down to the recoverable amounts and the resulting impairment loss is recognized as expense in the profit and loss account, unless the asset is carried at revalued amount. Any impairment loss of revalued assets is treated as revaluation decrease.
b) Investment property
The Group carries its investment properties at fair value, with changes in fair value being recognised in the profit or loss. An independent valuation specialist is engaged by the Group to assess fair value of investment property based on values with reference to market-based evidence, using comparable prices adjusted for specific market factors such as nature, location and condition of the property.
c) Classification of property
The Group determines whether a property is classified as investment property or development property. Investment property comprises land and buildings (principally offices, commercial warehouse and retail property) that are not occupied substantially for use by, or in the operations of, the Group, nor for sale in the ordinary course of business, but are held primarily to earn rental income and capital appreciation. These buildings are substantially rented to tenants and not intended to be sold in the ordinary course of business. Development property comprises property that is held for sale in the ordinary course of business and principally covers residential property that the Group is developing and intends to sell before or on completion of construction.
d) Stock-in-trade / development property The Group reviews the net realisable value of stock-in-trade / development property to assess
any diminution in the respective carrying values. Net realisable value is determined with reference to estimated selling price less estimated expenditure to make the sales.
e) Provision for doubtful debts
The Group assesses the recoverability of its trade debts and other receivables if there is an objective evidence that the Group will not be able to collect all the amounts due according to the original terms. Significant financial difficulties of the debtors, probability that the debtor will enter bankruptcy and default or delinquency in payments are considered indicators that the trade debts and other receivables are impaired.
f) Investment at fair value
The Group value its investment at fair value using fair value hierachy; Level 1 - quoted prices (unadjusted) in active markets, Level 2 - valuations based on directly or indirectly observable market input and Level 3 - valuations based on unobservable market input. The Group determines whether objective evidence of impairment exists for individual investments. In these cases, the

152
FOR THE YEAR ENDED JUNE 30, 2018
NOTES TO THE CONSOLIDATED FINANCIAL STATEMENTS
difference between amortised cost and fair value is transferred from other comprehensive income to the profit or loss. In addition, the determination of fair value of unquoted investments involves inherent subjectivity, key assumptions and estimation relation to valuation inputs and techniques. Any change in these assumptions and estimates may have significant impact on the fair value of investments with corresponding impact in other comprehensive income.
g) Recognition of tax and deferred tax
The provision for taxation is accounted for by the Group after taking into account the relevant laws and decisions taken by appellate authorities. Instances, where the Group's view differs from the view taken by the tax authorities at the assessment stage and where the Group considers that its view on items of material nature is in accordance with law, the amounts are shown as contingent liabilities / assets.
l) Policyholders liabilities
Policyholders' liabilities are calculated by the appointed actuary on the basis of assumptions. calculation for premium deficiency reserve and claims incurred but not reported (IBNR) is calculated by the appointed actuary on the basis of assumptions that the claim lag patterns will follow the historical trend experience. If for any policy the reserve is negative, the negative value is excluded and the reserves for the policies is set equal to zero.
Other areas where judgments, estimates and assumptions involved are disclosed in respective notes to these consolidated financial statements.
6.3 Property, plant and equipment 6.3.1 Owned
Property, plant and equipment (except for leasehold land and buildings on leasehold land) are stated at cost less accumulated depreciation and impairment losses, if any. Leasehold land and buildings on leasehold land are stated at revalued amounts, which are the fair value at the date of revaluation. Subsequently, these are stated at revalued amounts less subsequent accumulated depreciation and subsequent impairment losses, if any. Depreciation is charged to profit or loss applying the straight-line method. Depreciation on additions during the year is charged from the month of addition when the asset is available for use, whereas, depreciation on disposals is charged upto the month in which the disposal takes place.
Rates of depreciation which are disclosed in note 9.1 to these consolidated financial statements are designed to write-off the cost over the estimated useful lives of the assets.
Major renewals and improvements for assets are capitalised and the assets so replaced, if any, are retired. Maintenance and normal repairs are charged to profit or loss, as and when incurred.
Assets residual values, useful lives and method of depreciation are reviewed and adjusted, if appropriate at each reporting date. An asset’s carrying amount is written down immediately to its recoverable amount if the asset’s carrying amount is greater than its estimated recoverable amount.
Valuations are performed frequently enough to ensure that the fair value of a revalued asset does not differ materially from its carrying amount at the reporting date. Accumulated depreciation at the date of the revaluation is eliminated against the gross carrying amount of the asset and the net amount restated to the revalued amount of the asset.

153 Disrupt. Innovate.
FOR THE YEAR ENDED JUNE 30, 2018
NOTES TO THE CONSOLIDATED FINANCIAL STATEMENTS
An item of property, plant and equipment is derecognised upon disposal or when no future economic benefits are expected to arise from the continued use of the asset. Gains or losses on disposal or retirement of an asset represented by the difference between the sale proceeds and the carrying amount of the asset is charged to profit or loss.
During the year, TTL has revised its accounting estimate regarding the depreciation of electrical equipment. The said assets would now be depreciated at the rate of 20 percent, as against 25 percent due to low wear and tear in tracking units and no major changes in technology. The above change has been accounted for as change in accounting estimate in accordance with IAS – 8 “Accounting Policies, Changes in Accounting Estimates and Errors”. Had there been no change in the aforesaid accounting estimate, the profit for the year would have been lower by Rs.27.709 million whereas the carrying value of property, plant and equipment of the Group would have been lower by the same amount.
6.3.2 Capital work-in-progress Capital work-in-progress is stated at cost less accumulated impairment losses, if any, and consists
of expenditure incurred and advances made in respect of operating fixed assets in the course of their acquisition, erection, construction and installation. The assets are transferred to relevant category of operating fixed assets when they are available for use.
6.3.3 Leased
Finance leases, which transfer to the Group, all the risks and benefits incidental to ownership of leased items are capitalised at the inception of lease. Assets subject to finance lease are initially recorded at the lower of the present value of minimum lease payments under the lease agreements and the fair value of the leased assets. The related obligation under the lease less financial charges allocated to future period are shown as a liability. Income arising from sale and leaseback transactions, if any, is deferred and is amortised equally over the lease period.
Financial charges are calculated at the interest rate implicit in the lease and are charged to profit or loss. Leased assets are depreciated on a straight line basis at the same rate as Group's owned assets as disclosed in note 9.1 to these consolidated financial statements.
6.4 Intangibe assets Intangible assets other than goodwill, customers related intangible assets and marketing related
intangible assets are stated at cost less accumulated amortisation and accumulated impairment losses, if any. Goodwill, customers related intangible assets and marketing related intangible assets are stated at cost less accumulated impairment losses, if any, as their useful life is indefinite and are tested for impairment annually. For other intangibles, amortisation is charged to the profit or loss applying the straight line method, whereby, the cost of intangible asset is written off over its useful economic life. The amortisation rate of the intangible assets are stated in note 10.1 to these consolidated financial statements. Full month's amortisation is charged in the month of addition when the asset is available for use, whereas, amortisation on disposals is charged upto the month in which the disposal takes place.
6.4.1 Intangible assets under development
Intangible assets under development are stated at cost less accumulated impairment losses, if any, and consists of expenditure incurred and advances made in respect of intangible assets under developement in the course of their acquisition, erection, development and installation. The assets are transferred to relevant category of intangible assets when they are available for use.

154
FOR THE YEAR ENDED JUNE 30, 2018
NOTES TO THE CONSOLIDATED FINANCIAL STATEMENTS
6.4.2 Business combinations and Goodwill The Group uses acquisition method of accounting for acquisition of assets or class of assets,
whereby, the purchase consideration is allocated to the identifiable assets, liabilities and contingent liabilities assumed based on the fair value at the date of acquisition. Acquisition related costs are expensed as incurred and included in administrative expenses.
Goodwill is initially measured at the acquisition date, being the excess of:
a) the aggregate of consideration transferred, the amount of any non-controlling interest in the acquiree and in a business combination achieved in stages, the acquisition date fair value of the previously held equity interest in the acquiree; and
b) the net of the acquisition date amounts of the identifiable assets acquired and the liabilities assumed.
In case the fair value attributable to the Group’s interest in the identifiable net assets exceeds the fair value of consideration, the Group recognises the resulting gain in the profit or loss on the acquisition date.
Goodwill acquired in a business combination is measured subsequent to initial recognition, at cost
less accumulated impairment losses, if any, and is tested annually or whenever, there is an indication of impairment. Impairment loss in respect of goodwill is recognised in profit or loss.
6.5 Surplus on revaluation of property, plant and equipment
A revaluation surplus is recorded in other comprehensive income and credited to the asset revaluation surplus in equity. However, to the extent that it reverses a revaluation deficit of the same asset previously recognised in profit or loss, the increase is recognised in profit or loss. A revaluation deficit is recognised in the profit or loss, except to the extent that it offsets an existing surplus on the same asset recognised in the asset revaluation surplus.
An annual transfer from the asset revaluation surplus to unappropriated profit is made for the difference between depreciation based on the revalued carrying amount of the asset and depreciation based on the asset’s original cost. Additionally, accumulated depreciation as at the revaluation date is eliminated against the gross carrying amount of the asset and the net amount is restated to the revalued amount of the asset. Upon disposal, any revaluation surplus relating to the particular asset being sold is transferred to unappropriated profit.
During the year, the Group has changed its accounting policy for presentation and measurement of surplus on revaluation of property, plant and equipment, due to adoption of the Companies Act, 2017 (the Act), which became applicable for the first time for the preparation of the Group's annual financial statements for the year ended June 30, 2018. The above change in the accounting policy has been applied retrospectively and comparative information have been restated in accordance with the requirement of International Accounting Standard (lAS) 16 ‘Property, Plant and Equipment’ and lAS 8 ‘Accounting Policies, Changes in Accounting Estimates and Errors. There is no impact of this change in accounting policy on the consolidated financial statements prior to 2017. Accordingly, the Group has not presented its consolidated statement of financial position as at the beginning of the earliest comparative period i.e., July 01, 2016, and related notes in accordance with requirement of lAS 1 ‘Presentation of Financial Statements’ (Revised) (lAS 1). Had the accounting policy not been changed, the surplus on revaluation of property, plant and equipment would have been shown as a separate line item below equity in the consolidated statement of financial position amounting to Rs.228.061 million for the year ended June 30, 2018.

155 Disrupt. Innovate.
FOR THE YEAR ENDED JUNE 30, 2018
NOTES TO THE CONSOLIDATED FINANCIAL STATEMENTS
6.6 Investment property Investment property comprises completed property and property under construction that is held to
earn rentals or for capital appreciation or both. Investment property is measured initially at cost including transaction costs. Transaction costs include
transfer taxes, professional fees for legal services and initial leasing commissions to bring the property to the condition necessary for it to be capable of operating. The carrying amount also includes the cost of replacing part of an existing investment property at the time that cost is incurred, if the recognition criteria is met.
Subsequent to initial recognition, investment property is stated at fair value which reflects market condition at reporting date. Gains or losses arising from changes in the fair values are included in the proft or loss in the year in which they arise, including the corresponding tax effect, if any. Fair values are determined based on an annual valuation performed by an accredited independent valuer.
Investment property under construction is measured at cost less accumulated impairment losses, if any. Cost includes the cost of land acquired for the development of project and other purchase cost, related government taxes, construction cost, borrowing cost and other overheads necessary to bring the premises for capital appreciation or rental earnings.
Investment property is derecognised when it has been disposed of or permanently withdrawn from use and no future economic benefit is expected from its disposal. Any gain or loss on the derecogntition of investment property are recognised in the proft or loss in the year of retirement or disposal. Gain or loss on the disposal of investment property are determined as the difference between net disposal proceeds and the carrying value of the asset.
Transfers are made to or from the investment property only when there is a change in use. For a transfer from investment property to owner-occupied, the deemed cost for subsequent accounting is the fair value at the date of change in use. If owner occupied property becomes an investment property, the Group accounts for such property in accordance with the policy stated under property, plant and equipment upto the date of change in use.
Maintenance and normal repairs are charged to profit or loss, as and when incurred. Major renewals and improvements, if any, are capitalised, if recognition criteria is met.
6.7 Investments The management of the Group determines the appropriate classification of its investments at the time
of purchase. 6.7.1 Held-to-maturity Investments with fixed maturity, where management has both the intent and the ability to hold to
maturity, are classified as held-to-maturity. These are initially measured at fair value plus transaction costs and are subsequently stated at amortised cost less provision for impairment, if any. Any premium paid or discount availed on acquisition of held-to-maturity investment is deferred and amortised over the term of investment, using the effective interest rate method. These are reviewed for impairment at year end and any losses arising from impairment in values are charged to the profit or loss.

156
FOR THE YEAR ENDED JUNE 30, 2018
NOTES TO THE CONSOLIDATED FINANCIAL STATEMENTS
6.7.2 At fair value through profit or loss
Financial assets at fair value through profit or loss include financial assets held-for-trading and financial assets designated upon initial recognition at fair value through profit or loss. Financial instruments are classified as held-for-trading if they are acquired for the purpose of selling and repurchasing in near term. Held-for-trading assets are acquired principally for the purpose of generating profit from short-term fluctuations in price. Financial instruments are designated at fair value through profit or loss, if the Group manages such investments and makes sales and purchase decision based on their fair value in accordance with the Group’s investment strategy.
All investments classified as investments at fair value through profit or loss are initially measured at cost being fair value of consideration given. All transaction costs are recognised directly in profit or loss. At subsequent dates, these investments are measured at fair value, determined on the basis of prevailing market prices, with any resulting gain or loss recognised directly in the profit or loss.
6.7.3 Available-for-sale
Investments intended to be held for an indefinite period of time which may be sold in response to need for liquidity or changes in market conditions are classified as available-for-sale. At initial recognition, available-for-sale investments are measured at fair value plus directly attributable transaction costs.
After initial recognition, investments which are classified as available-for-sale are measured at fair value with unrealised gains or losses recognised in other comprehensive income in the available-for-sale reserve until, the investment is sold, derecognised or is determined to be impaired, at which time the cumulative gain or loss is reclassified to the profit or loss and removed from the available-for-sale reserve.
The fair value of those investments representing listed equity and other securities i.e. debt instruments are determined on the basis of year-end bid prices obtained from stock exchange quotations and quotes from brokers.
6.8 Impairment 6.8.1 Financial assets The Group assesses at each reporting date whether there is any objective evidence that a financial
asset or a group of financial assets is impaired. A financial asset or a group of financial assets is deemed to be impaired if, and only if, there is objective evidence of impairment as a result of one or more events that has occurred after the initial recognition of the asset (an incurred ‘loss event’) and that loss event has an impact on the estimated future cash flows of the financial asset or the group of financial assets that can be reliably estimated. Any impairment losses on financial assets including financial assets carried at amortised cost are recognised in profit or loss.
6.8.2 Non-financial assets, goodwill and investments in subsidiaries and associates
The Group assesses at each reporting date whether there is an indication that an asset may be impaired. If any indication exists, or when annual impairment testing for an asset is required, the Group estimates the asset’s recoverable amount. An asset’s recoverable amount is the higher of an asset’s fair value less costs to sell and its value in use. Where the carrying amount of an asset exceeds its recoverable amount, the asset is considered impaired and is written down to its recoverable amount.

157 Disrupt. Innovate.
FOR THE YEAR ENDED JUNE 30, 2018
NOTES TO THE CONSOLIDATED FINANCIAL STATEMENTS
In assessing value in use, the estimated future cash flows are discounted to their present value using a pre-tax discount rate that reflects current market assessments of the time value of money and the risks specific to the asset. The fair value less costs to sell calculation is based on available data from binding sales transactions, conducted at arm’s length, for similar assets or observable market prices less incremental costs to sell of the asset.
In determining fair value less costs to sell, the recent market transactions are taken into account. If no such transactions can be identified, an appropriate valuation model is used. These calculations are corroborated by valuation multiples, quoted share prices for publicly traded companies or other fair value indicators.
Goodwill is tested for impairment annually at year end and when the circumstances indicate that the carrying value may be impaired. Impairment is determined for goodwill by assessing the recoverable amount of each cash generating unit (CGU) or group of CGUs to which the goodwill relates. When the recoverable amount of CGU is less than its carrying amount, an impairment loss is recognised.
Intangible assets with indefinite useful lives are tested for impairment annually at year end either individually or at the CGU level, as appropriate, and when circumstances indicate that the carrying value may be impaired.
For assets excluding goodwill, an assessment is made at each reporting date as to whether there is any indication that previously recognised impairment losses may no longer exist or may have decreased. If such indication exists, the Company estimates the asset’s recoverable amount.
A previously recognised impairment loss is reversed only if there has been a change in the assumptions used to determine the asset’s recoverable amount since the last impairment loss was recognised. The reversal is limited so that the carrying amount of the asset does not exceed its recoverable amount, nor exceed the carrying amount that would have been determined, net of depreciation, had no impairment loss been recognised for the asset in prior years. Such reversal is recognised in the profit or loss.
Impairment losses relating to goodwill are not reversed in future periods.
6.9 Stock-in-trade Stock-in-trade is valued at the lower of cost, determined on a first-in-first-out basis and net realisable
value. Items in transit are valued at cost comprising invoice value plus other charges incurred thereon.
Spare parts and loose tools are valued at lower of weighted average cost and net realisable value, except items in transit, which are stated at cost. Spare parts and loose tools are charged to cost of goods sold on an estimated consumption pattern.
Net realisable value is the estimated selling price in the ordinary course of business less estimated costs of completion and estimated costs necessarily to be incurred to make the sale.
6.10 Development properties Property acquired, constructed or in the course of construction for sale in the ordinary course of
business, rather than to be held for rental or capital appreciation, is classified as development properties. The Group will sell the completed housing units and not providing any construction services as a contractor engaged by the buyer. In addition, the buyer of housing units does not have an ability to specify the major structural elements of the design or major structural changes before construction and / or construction is in progress. All project costs incurred or to be incurred till the completion of project are capitalised as development properties and is stated in lower of cost and net realisable value. Accordingly, the cost of development properties under construction includes:
158
FOR THE YEAR ENDED JUNE 30, 2018
NOTES TO THE CONSOLIDATED FINANCIAL STATEMENTS
a) cost of leasehold land; b) amounts paid to contractors for construction; and c) planning and design costs, cost of site preparation, professional fee for legal services, property
transfer taxes, development charges, construction overheads and other related costs necessary to bring the premises in saleable condition.
d) contractors for developing inner perimeter, including but not limited to road development, amenities and utilities and other infrastructure.
Net realisable value is the estimated selling price in the ordinary course of business, based on market prices less costs to completion and the estimated costs of sale.
6.11 Trade debts and other receivables
Trade debts originated by the Group are recognised and carried at original invoice amount less provision for doubtful debts, if any. An estimated provision for doubtful debt is made when collection of the full amount is no longer probable. No provision is made in respect of the active customers which are considered good. Bad debts are written-off, as and when identified.
Other receivables and receivables from related parties are recognised and carried at cost which is the fair value of the consideration to be received in the future for goods and services.
6.12 Cash and cash equivalents
Cash and cash equivalents are stated at cost and are defined as cash in hand, cash at banks and short-term highly liquid investments that are readily convertible to known amounts of cash and subject to insignificant risk of changes in value. For the purpose of cash flow statement, cash and cash equivalents comprise bank balances including short-term deposits net of book overdraft, if any.
6.13 Staff retirement benefits
6.13.1 Defined contribution plan The Group operates a recognised provident fund (defined contribution scheme) for its permanent
employees who have completed the minimum qualifying period of service. Equal monthly contributions are made, both by the Group and the employees at the rate of 8.33 percent of the basic salary. The contribution of the Group for the year is charged to the profit or loss.
6.13.2 Defined benefit plan
TSS and TPLL operates an unfunded gratuity scheme covering all its employees completing the minimum qualifying period of under the scheme.
6.14 Taxation Current Provision for current taxation is computed on taxable income at the current rates of taxation, after taking
into account tax credits and rebates available, if any, in accordance with the provision of the Income Tax Ordinance, 2001. It also includes any adjustment to tax payable in respect of prior years. However, for income covered under final tax regime, taxation is based on applicable tax rates under such regime.

159 Disrupt. Innovate.
FOR THE YEAR ENDED JUNE 30, 2018
NOTES TO THE CONSOLIDATED FINANCIAL STATEMENTS
Deferred Deferred tax is recognised using the balance sheet method, on all temporary differences arising at the
reporting date between the tax bases of assets and liabilities and their carrying amounts for financial reporting purposes.
Deferred tax liabilities are recognised for all taxable temporary differences, while deferred tax assets are recognised for all deductible temporary differences, carry-forward of unused tax losses and unused tax credits, to the extent that it is probable that taxable profit will be available against which the deductible temporary differences, carry forwards of unused tax losses and unused tax credits can be utilised.
The carrying amount of deferred tax asset is reviewed at each reporting date and reduced to the extent that it is no longer probable that sufficient taxable profit will be available to allow all or part of the deferred tax asset to be utilised. Unrecognised deferred tax assets are reassessed at each reporting date and are recognised to the extent that it has become probable that future taxable profits will allow deferred tax asset to be recovered.
Deferred tax assets and liabilities are measured at the tax rates that are expected to apply to the period when the asset is realised or the liability is settled, based on tax rates (and tax laws) that have been enacted or substantially enacted at the reporting date. Deferred tax is charged or credited to the profit or loss.
Deferred tax relating to items recognised directly in the other comprehensive income is recognised in the other comprehensive income and not in profit or loss.
Deferred tax assets and deferred tax liabilities are offset only if there is a legally enforceable right to offset current tax assets and liabilities and they relate to the income tax levied by the same tax authority.
6.15 Trade and other payables
Liabilities for trade and other payables are carried at cost which is the fair value of the consideration to be paid in the future for goods and services received, whether or not billed to the Group.
6.16 Provisions
Provisions are recognised when the Group has a present (legal or constructive) obligation as a result of past events and it is probable that an outflow of resources embodying economic benefits will be required to settle the obligation and a reliable estimate of the obligation can be made. Provisions are reviewed at each reporting date and accordingly adjusted to reflect current best estimates.
6.17 Operating leases / Ijarah agreements Leases, where a significant portion of the risks and rewards of ownership are retained by the lessor, are
classified as operating lease. Payments made under operating leases (net of any incentives received from the lessor) / ijarah agreements are charged to the profit or loss on a straight line basis over the lease / ijarah term.
6.18 Revenue recognition Revenue is recognised to the extent that it is probable that the economic benefits will flow to the Group
and the revenue can be reliably measured, regardless of when the payment is being made. Revenue is measured at fair value of the consideration received or receivable, excluding discounts, rebates, and sales tax or duty. The Group assesses its revenue arrangements against specific criteria in order to determine if it is acting as a principal or an agent. The Group has concluded that it is acting as a principal in all its revenue arrangements. The following are the specific recognition criteria that must be met before revenue is recognised:

160
FOR THE YEAR ENDED JUNE 30, 2018
NOTES TO THE CONSOLIDATED FINANCIAL STATEMENTS
- Revenue from sales is recognised when risks and rewards are transferred, i.e., when tracking devices / goods are installed.
- Monitoring fees, rental income, service income from rendering of security, maintenance and other services are recorded on an accrual basis.
- Service income from rendering of security services are recorded, when they are rendered to the customer.
- Rental income receivable from operating leases are recognized at straight-line basis over the lease term except for contingent rental income which is recognised when it arises. Initial direct costs incurred in negotiating and arranging an operating lease are recognised as an expense over the lease term on the same basis as the lease income. Incentives for lessee to enter into lease agreements are spread evenly over the lease term, even if the payments are not made on such a basis. The lease term is the non-cancellable period of the lease together with any further term for which the tenant has the option to continue the lease, where, at the inception of the lease, the directors are reasonably certain that the tenant will exercise that option. Amounts received from tenants to terminate leases or to compensate for dilapidations are recognised in the profit or loss when the right to receive them arises.
- Revenue from sale of residential property is recognised when both: (i) construction is complete; and (ii) legal title to the property has been transferred.
- The revenue recognition policies for premium and commission from reinsurer are given under the
notes 6.19.2 and 6.19.6 below. - Gain / loss on sale / redemption of investments is taken to consolidated profit or loss in the year of
sale / redemption. - Income from held to maturity investments is recognised on a time proportionate basis taking
account the effective yield on the investments. - Dividend income is recognised when the right to receive the dividend is established. - Income on bank accounts is recorded using effective interest rate. 6.19 Insurance related policies 6.19.1 Insurance contracts Insurance contracts are those contracts where the Group (the insurer) has accepted significant
insurance risk from another party (the policy holders) by agreeing to compensate the policyholders if a specified uncertain future event (the insured event) adversely affects the policyholders.
Once a contract has been classified as an insurance contract, it remains an insurance contract for the remainder of its period, even if the insurance risk reduces significantly during this period, unless all rights and liabilities are extinguished or expired.
The Group underwrites non-life insurance contracts that can be categorised into fire and property damage, marine, aviation and transport, health, motor and miscellaneous contracts. Contracts may be concluded for a fixed term of one year, for less than one year and in some cases for more than one year. However, most of the contracts are for twelve months duration. Insurance contracts entered into by the Group under which the contract holder is another insurer (inwards reinsurance) of a facultative nature are included within the individual category of insurance contracts, other than those which fall under Treaty. The insurance risk involved in these contracts is similar to the contracts undertaken by the Group as insurer.

161 Disrupt. Innovate.
Fire and property insurance contracts mainly compensate the customers for damage suffered to their property. Customers who undertake commercial activities on their premises could also receive compensation for the loss of earnings caused by the inability to use the insured properties in their business activities (business interruption cover).
Marine, aviation and transport class of business provides coverage against loss and damage to goods in transit by any means of conveyance, physical loss or damage to aircraft, ships and liabilities to third parties and passengers arising from their use.
Motor insurance covers physical loss or damage to the vehicle and liabilities to third parties as provided under the requirements of the Motor Vehicle Ordinance, 1965.
All other insurances like cash in hand, cash in transit, personal accident, travel are included under
miscellaneous insurance cover.
The Group neither issues investments contracts nor does it issue insurance contracts with discretionary participation features (DPF).
These contracts are made with group companies, corporate clients and individuals residing or located in Pakistan.
6.19.2 Premium General insurance Premium income under a policy is recognized, evenly over the period of insurance from the date of
issuance of the policy till the date of its expiry. Administrative surcharge is recognised as income at the time policies are written.
Revenue from premiums is determined after taking into account the unearned portion of premium
by applying 1/24th method as prescribed by the Insurance Rules, 2017. The unearned portion of premium income is recognised as liability.
Premium due but unpaid under insurance contracts are recognised when due, at the fair value of
the consideration receivable less provision for doubtful debts, if any. If there is objective evidence that the receivable is impaired, the Group reduces the carrying amount of the receivable accordingly and recognizes it as impairment loss.
Life insurance - First year individual life and individual accident & health premiums are recognized once the
related policy have been issued and premiums received. Renewal premiums are recognized upon receipt of premium provided the policy is still in force.
- Premiums for group life, group health business are recognized as and when due. Receivables
under insurance contracts are recognized when due, at the fair value of the consideration receivable less provision for doubtful debts, if any. If there is objective evidence that the receivable is impaired, the Group reduces the carrying amount of the receivable accordingly and recognizes it as impairment loss.
FOR THE YEAR ENDED JUNE 30, 2018
NOTES TO THE CONSOLIDATED FINANCIAL STATEMENTS
162
6.19.3 Reinsurance contracts
Insurance contracts entered into by the Group with reinsurers for compensation of losses suffered on insurance contracts issued are reinsurance contracts. These reinsurance contracts include both facultative and treaty arrangement contracts and are classified in same categories of insurance contracts for the purpose of these consolidated financial statements. The Group recognises the entitled benefits under the contract as various reinsurance assets. Outward reinsurance premiums are accounted for in the same period as the related premiums for the direct or accepted reinsurance business being reinsured.
Reinsurance liabilities represent balances due to reinsurance companies. Amounts payable are estimated in a manner consistent with the related reinsurance contract. Reinsurance assets represent balances due from reinsurance companies. Amounts recoverable from reinsurers are estimated in a manner consistent with the provision for outstanding claims or settled claims associated with the reinsurance policies and are in accordance with the related reinsurance contract.
Reinsurance assets are not offset against related insurance liabilities. Income or expenses from reinsurance contract are not offset against expenses or income from related insurance assets.
Reinsurance premiums are recognized at the same time when the premium income is recognized. It is measured in line with the terms and condition of the reinsurance treaties.
The deferred portion of reinsurance premium ceded is recognised as a prepayment which is calculated by using 1/24th method as prescribed by the Insurance Rules, 2017.
The Group assesses its reinsurance assets for impairment on reporting date. If there is an objective evidence that the reinsurance asset is impaired, the Group reduces the carrying amount of the reinsurance asset to its recoverable amount and recognises that impairment loss in the profit or loss.
6.19.4 Claims expense General insurance Insurance claims include all claims incurred during the year, whether reported or not, related
internal and external claims handling costs that are directly related to the processing and settlement of claims, and any adjustments to claims outstanding from previous years.
The Group recognises liability in respect of all claims incurred upto the reporting date which is
measured at the undiscounted value of the expected future payments. The claims are considered to be incurred at the time of the incident giving rise to the claim except as otherwise expressly indicated in an insurance contract.
The liability for claims include amounts relating to unpaid reported claims, claims incurred but not
reported (IBNR) and expected claims settlement costs. Provision for liability in respect of unpaid reported claims is made on the basis of individual case estimates.
The provision for claims incurred but not reported (IBNR) is made at the reporting date. In
accordance with SECP circular no. 9 of 2016, the Group takes actuarial advice for the determination of IBNR claims. Provision for IBNR claims have been determined by analyzing the lag between the incurrence and reporting of motor and health business claims. For fire and marine businesses, as the Group has started these businesses during the current year, no historical data is available, therefore, industry wide-data has been used to calculate provision of IBNR claims. For travel business, in absence of credible industry wide-data, an average of all other classes has been used to determine provision for IBNR claims.
FOR THE YEAR ENDED JUNE 30, 2018
NOTES TO THE CONSOLIDATED FINANCIAL STATEMENTS
163 Disrupt. Innovate.
FOR THE YEAR ENDED JUNE 30, 2018
NOTES TO THE CONSOLIDATED FINANCIAL STATEMENTS
Life insurance
Claim expenses are recognized on the date the insured event is intimated except for individual life unit linked where claim expenses are recognized earlier of the date the policy cease to participate in the earnings of the fund and the date insured event is intimated. A liability for outstanding claims is recognized in respect of all claims incurred up to the reporting period, as soon as reliable estimates of the claim amount can be made. The liability for claims "Incurred But Not Reported"(IBNR) is included in policyholders' liabilities. Claims recoveries receivable from reinsurers are recognized as assets at the same time when the corresponding claims are recorded in accordance with the terms of the re-insurance contracts.
6.19.5 Reinsurance recoveries against outstanding claims
Claims recoveries against outstanding claims from the reinsurer and salvage are recognised as an asset at the same time as the claims which give rise to the right of recovery are recognised as a liability and are measured at the amount expected to be received.
6.19.6 Commission
Commission expense incurred in obtaining and recording policies is deferred and recognised in profit or loss as an expense in accordance with the pattern of recognition of premium revenue. Commission income from reinsurers is recognised at the time of issuance of the underlying insurance policy. These are deferred and recognised as liability and recognised in the profit or loss as revenue in accordance with the pattern of recognition of the reinsurance premiums.
6.19.7 Premium deficiency reserve The Group is required as per Insurance Rules, 2017, SEC (Insurance) Rules, 2002 and IFRS-4, to
maintain a provision in respect of premium deficiency for the class of business where the unearned premium reserve is not adequate to meet the expected future liability, after reinsurance, from claims and other expenses, including reinsurance expense, commissions and other underwriting expenses, expected to be incurred after the reporting date in respect of the unexpired policies in that class of business at the reporting date. The charge for premium deficiency reserve is recorded as an expense in the profit or loss and the same shall be recognized as a liability.
For this purpose, loss ratios for each class are estimated based on historical claim development.
Judgment is used in assessing the extent to which past trends may not apply in future or the effects of one-off claims. If these ratios are adverse, premium deficiency is determined. Further actuarial valuation has been carried out to determine the amount of premium deficiency reserve in respect of Health insurance as required by SRO 16 (I) / 2012 issued by Securities and Exchange Commission of Pakistan on 9 January 2012.
6.19.8 Acquisition cost Acquisition cost comprise of commission and other costs incurred in acquiring insurance policies
and include without limitation all forms of remuneration paid to insurance agents. These are recognized as an expense in the earlier of the financial year in which they are paid and financial year in which they become due and payable, except those which are directly referable to the acquisition or renewal of specific contracts that are recognised not later than the period in which the premium to which they refer is recognized as revenue.
164
FOR THE YEAR ENDED JUNE 30, 2018
NOTES TO THE CONSOLIDATED FINANCIAL STATEMENTS
6.19.9 Policyholders’ liabilities Policyholders’ liabilities including IBNR are stated at a value determined by the appointed actuary
through an actuarial valuation / advice carried out at each reporting date, in accordance with section 50 of the Insurance Ordinance, 2000. In determining the value both acquired policy values as well as estimated values which will be payable against risks which the Group underwrites are considered. The basis used are applied consistently from year to year. Calculation for premium deficiency reserve and claims incurred but not reported (IBNR) is calculated by the appointed actuary on the basis of assumptions that the claim pattern will follow the historical trend experience.
6.19.10 Receivables and payables related to insurance contract
Receivables and payables are recognised when due. These include amounts due to and from agents and policyholders.
6.19.11 Liability adequacy test
At each reporting date, liability adequacy tests are performed to ensure the adequacy of the contract liabilities. Any deficiency is immediately charged to profit or loss initially by writing off the deferred policy acquisition costs, if any, and by subsequently establishing a provision for losses arising from liability adequacy tests.
6.19.12 Statutory funds
The Group maintains statutory funds for accident and health businesses, conventional business and individual life unit linked. Assets, liabilities, revenues and expenses are recorded in the fund, if referable or, on the basis of actuarial advice if not referable. Other assets, liabilities, revenue and expenses are allocated to shareholders' funds. Policyholders' liabilities have been included in statutory funds on the basis of actuarial valuation carried out by the appointed actuary of the Group on the reporting date as required by Section 50 of the Insurance Ordinance, 2000. A capital transfer provided to statutory funds by the shareholders’ funds is recorded as a reduction in the shareholders’ equity.
6.20 Foreign currency translation
Transactions in foreign currencies are translated into Pakistani Rupee at the rate ruling at the date of the transaction. Monetary assets and liabilities denominated in foreign currencies are retranslated at the exchange rate ruling at the reporting date. Exchange gains and losses are recognised in profit or loss. Non-monetary items that are measured in terms of historical cost in a foreign currency are translated using the exchange rates as at the dates of the initial transactions. Non-monetary items measured at fair value in a foreign currency are translated using the exchange rates at the date when the fair value was determined.
6.21 Financial instruments
All the financial assets and financial liabilities are recognised at the time when the Group becomes a party to the contractual provisions of the instrument. All financial assets are derecognised at the time when the Group loses control of the contractual rights that comprise the financial assets. All financial liabilities are derecognised at the time when they are extinguished that is, when the obligation specified in the contract is discharged, cancelled, or expired. Any gains or losses on derecognition of financial assets and financial liabilities are taken to profit or loss.

165 Disrupt. Innovate.
FOR THE YEAR ENDED JUNE 30, 2018
NOTES TO THE CONSOLIDATED FINANCIAL STATEMENTS
6.22 Offsetting of financial assets and financial liabilities A financial asset and a financial liability is offset and the net amount is reported in the statement of
financial position, if the Group has a legally enforceable right to set off the transaction and also intends either to settle on a net basis or to realise the asset and settle the liability simultaneously. Income and expenses arising from such assets and liabilities are also offset accordingly.
6.23 Borrowing costs
Borrowing and other related costs directly attributable to the acquisition, construction or production of qualifying assets, which are assets that necessarily take a substantial period of time to get ready for their intended use, are added to the cost of those assets, until such time as the assets are substantially ready for their intended use. All other borrowing costs are recognised as an expense in the period in which they are incurred.
6.24 Dividend and appropriation to reserves
Dividend and appropriation to reserves are recognised in the consolidated financial statements in the period, in which these are approved. However, if these are approved after the reporting period but before the financial statements are authorised for issue, they are disclosed in the notes to the consolidated financial statements.
6.25 Segment reporting
Operating segments are reported in a manner consistent with the internal reporting provided to the Chief Operating Decision Maker. Segment results, assets and liabilities include items directly attributable to a segment. Segment capital expenditure is the total cost incurred during the year to acquire property, plant and equipment and intangible assets.
Segment results, assets and liabilities include items directly attributable to a segment as well as those allocated on a reasonable basis.
6.26 Earnings per share
The Group presents basic and diluted earnings per share (EPS) data for its ordinary shares. Basic EPS is calculated by dividing the profit or loss attributable to ordinary shareholders of the Group by the weighted average number of ordinary shares outstanding during the period. Diluted EPS is determined by adjusting the profit or loss attributable to ordinary shareholders and the weighted average number of ordinary shares outstanding for the effects of all dilutive potential ordinary shares.

166
FOR THE YEAR ENDED JUNE 30, 2018
NOTES TO THE CONSOLIDATED FINANCIAL STATEMENTS
6.27 Standards, interpretations and amendments to approved accounting standards that are not yet effective
The following standards, amendments and interpretations with respect to the approved accounting standards as applicable in Pakistan would be effective from the dates mentioned below against the respective standard or interpretation:
Effective date (annual periods beginning Standards on or after) IFRS 2 Share-based Payments – Classification and Measurement of
Share-based Payments Transactions (Amendments) January 01, 2018 IFRS 4 Insurance Contracts: Applying IFRS 9 Financial Instruments with IFRS 4 Insurance Contracts – (Amendments) January 01, 2018 IFRS 9 Financial Instruments July 01, 2018 IFRS 9 Prepayment Features with Negative Compensation – (Amendments) January 01, 2019 IFRS 10 Consolidated Financial Statements and IAS 28 Investment in
Associates and Joint Ventures - Sale or Contribution of Assets between an Investor and its Associate or Joint Venture (Amendment) Not yet finalised
IFRS 15 Revenue from Contracts with Customers July 01, 2018 IFRS 16 Leases January 01, 2019 IAS 19 Plan Amendment, Curtailment or Settlement (Amendments) January 01, 2019 IAS 28 Long-term Interests in Associates and Joint Ventures – (Amendments) January 01, 2019 IAS 40 Investment Property: Transfers of Investment Property (Amendments) January 01, 2018 IFRIC 22 Foreign Currency Transactions and Advance Consideration January 01, 2018 IFRIC 23 Uncertainty over Income Tax Treatments January 01, 2019 The above standards and amendments are not expected to have any material impact on the Group's
financial statements in the period of initial application, except for IFRS 15, for which management assessment is in process of evaluating the impact.
In addition to the above standards and amendments, improvements to various accounting standards have also been issued by the IASB in December 2016 and December 2017. Such improvements are generally effective for accounting periods beginning on or after January 01, 2018 and January 01, 2019 respectively. The Group expects that such improvements to the standards will not have any impact on the Group's financial statements in the period of initial application.
The IASB has also issued the revised Conceptual Framework for Financial Reporting (the Conceptual Framework) in March 2018 which is effective for annual periods beginning on or after January 01, 2020 for preparers of financial statements who develop accounting policies based on the Conceptual Framework. The revised Conceptual Framework is not a standard, and none of the concepts override those in any standard or any requirements in a standard. The purpose of the Conceptual Framework is to assist IASB in developing standards, to help preparers develop consistent accounting policies if there is no applicable standard in place and to assist all parties to understand and interpret the standards.
Further, the following new standards have been issued by IASB which are yet to be notified by the SECP
for the purpose of applicability in Pakistan.

167 Disrupt. Innovate.
FOR THE YEAR ENDED JUNE 30, 2018
NOTES TO THE CONSOLIDATED FINANCIAL STATEMENTS
Effective date (annual periods beginning Standards on or after)
IFRS 14 Regulatory Deferral Accounts 01 January, 2016
IFRS 17 Insurance Contracts 01 January, 2021
7. DETAILS OF RELATED PARTIES Name of a related party Basis of relationship Shareholding TPL Holdings (Private) Limited Parent company - TPL Rupiya (Private) Limited Wholly owned subsidiary 99.99% TPL Trakker Limited Wholly owned subsidiary 100% TPL Maps (Pvt.) Limited Wholly owned subsidiary 100% TPL Security Services (Private) Limited Subsidiary 99.90% TPL Insurance Limited Subsidiary 93.51% TPL Life Insurance Limited Subsidiary 86.43% TPL Properties Limited [TPLP] Subsidiary 29.62% Centrepoint Management Services
(Private) Limited Sub-subsidiary of TPLP 29.62% HKC (Private) Limited Sub-subsidiary of TPLP 29.62% G18 (Private) Limited Sub-subsidiary of TPLP 29.62% Trakker Middle East LLC Associated company 29% TPL E-Ventures (Pvt.) Limited Associated undertaking - TPL Mobile (Private) Limited Common directorship - TPL Tech Pakistan (Private) Limited Common directorship - Sapphire Fibers Limited Common directorship - IBEX Global Solutions (Private) Limited Common directorship - Virtual World (Private) Limited Common directorship - Digital Globe Services (Private) Limited Common directorship - Afiniti Software Solutions (Private) Limited Common directorship - Vestrue DMCC, Dubai, UAE Common directorship - Vestrue Holdings Limited, Dubai, UAE Common directorship - Kulsum Holdings Limited, Dubai, UAE Common directorship - Brans Holdings Limited, Dubai, UAE Common directorship - Rashwell Company LLC, Dubai, UAE Common directorship - Slaide (Pty) Ltd Common directorship - Macanta (Pty) Ltd Common directorship - Fleetcam (Pty) Ltd Common directorship - Cherosco (Pty) Ltd Common directorship - Casi International (Pty) Ltd Common directorship - TPL Direct Finance (Private) Limited Common directorship - The Resource Group Pakistan Limited Common directorship - TPL Logistics (Private) Limited Common directorship - Trakker Energy (Pvt.) Ltd Common directorship - TRG (Private) Limited Common directorship - Watan Foundation Common directorship - Agriauto Industries Limited Common directorship - Pakistan Oxygen Limited
(formerly Linde Pakistan Limited) Common directorship - Engro Corporation Limited Common directorship -

168
FOR THE YEAR ENDED JUNE 30, 2018
NOTES TO THE CONSOLIDATED FINANCIAL STATEMENTS
Adira Capital Holding (Private) Ltd. Common directorship - Noesis (Private) Ltd. Common directorship - Institute of Business Administration Common directorship - The i-care Pakistan Common directorship - State Bank of Pakistan Common directorship - Shakarganj Food Products Limited Common directorship - KASB Investment Management (Private) Limited Common directorship - Merit Packaging Limited Common directorship - Grant Thornton Consulting (Private) Limited Common directorship - JS Investment Limited Common directorship - Oosman Brothers (Private) Limited Common directorship - Paradigm Re Common directorship - Paradigm Services (Private) Capital Limited Common directorship - Clifton Land Limited Common directorship - TPL Properties Limited - Employees' Provident Fund Retirement benefit fund - Centrepoint Management Services
(Private) Limited - Employees' Provident Fund Retirement benefit fund - Trakker (Private) Limited Staff Provident Fund Retirement benefit fund -
8. BUSINESS COMBINATION The Holding Company has further acquired 52,196,397 ordinary shares of TPL Insurance Limited during
the year representing 69.12 percent shareholding at a consideration of Rs.1,252.714 million under the terms and conditions of Sale and Purchase Agreement (SPA) signed with Greenoaks Global Holding Limited (the seller) dated March 23, 2017. Resultantly, the shareholding of the Company in TIL has been increased, by virtue of which, TIL becomes a subsidiary company at the acquisition date i.e. December 19, 2017. The Holding Company acquired TIL to support its tracking business with the insurance facilities for its customers.
The fair value of the identifiable assets acquired and liabilities assumed of TIL as at the date of
acquisition were:
Fair value Carrying value recognised on as at date of acquisition acquisition Rupees Rupees Assets: Property, plant and equipment 79,476,151 79,476,151 Intangible assets 11,913,934 11,913,934 Investments 1,069,460,891 1,069,460,891 Loans and other receivables 274,370,944 274,370,944 Insurance / reinsurance receivables 258,493,866 258,493,866 Reinsurance recoveries against outstanding claims 21,515,947 21,515,947 Salvage recoveries accrued 40,201,885 40,201,885 Deferred commission expense 61,621,674 61,621,674 Deferred taxation 21,237,574 21,237,574 Prepayments 193,241,458 193,241,458 Cash and bank balances 133,592,489 133,592,489 Total assets of general takaful 335,497,378 335,497,378 Total assets 2,500,624,191 2,500,624,191

169 Disrupt. Innovate.
FOR THE YEAR ENDED JUNE 30, 2018
NOTES TO THE CONSOLIDATED FINANCIAL STATEMENTS
Liabilities: Underwriting provisions 805,746,745 805,746,745 Premium received in advance 2,779,623 2,779,623 Insurance / reinsurance payables 114,673,701 114,673,701 Other creditors and accruals 219,116,925 219,116,925 Taxation - provision less payment 2,733,398 2,733,398 Total liabilities of general takaful 234,267,828 234,267,828 Total liabilities 1,379,318,220 1,379,318,220 Total identifiable net assets at estimated fair value 1,121,305,971 1,121,305,971 Purchase consideration paid 1,252,713,528 Fair value of previously held equity interest at the acquisition date 456,791,196 Fair value of non-controlling interest at the acquisition date 72,772,757 1,782,277,481 Provisional goodwill at acquisition date 660,971,510 Net cash outflow on acquisition is as follows: Cash paid on acquisition 1,252,713,528 Cash acquired in subsidiary (133,592,489) Net cash outflow 1,119,121,039 For determining the fair value of assets and liabilities at the time of acquisition as required by IFRS 3
'Business Combination', the management has assessed that the fair value of the assets and liabilities acquired approximates to its carrying value on date of the acquisition. However, the management has decided to finalize the determination of valuation of assets acquired and liabilities assumed within one year from the acquisition date, which is allowed under IFRS 3 "Business Combinations" as measurement period, therefore provisional figures based on latest available annual audited financial statements for the year ended December 31, 2017 have been considered for the acquisition accounting.
The Group has elected to measure non-controlling interest in TIL at the proportionate share in the
recognised amount in the acquiree's net identifiable assets. As of June 30, 2018, the Holding Company holds 77,323,859 ordinary shares of TIL representing 93.51 percent of share capital of TIL.
9. PROPERTY, PLANT AND EQUIPMENT Operating fixed assets 9.1 1,967,447,745 1,774,573,133 Capital work-in-progress 9.3 246,623,842 24,947,496 2,214,071,587 1,799,520,629
2018 2017
Note Rupees Rupees

170
FOR THE YEAR ENDED JUNE 30, 2018
NOTES TO THE CONSOLIDATED FINANCIAL STATEMENTS9
.1 O
per
atin
g fi
xed
ass
ets
Ow
ned
Leas
ehol
d la
nd
413
,00
0,0
00
-
-
413
,00
0,0
00
-
-
-
-
413
,00
0,0
00
-
Bui
ldin
g on
leas
ehol
d la
nd
42
5,14
8,8
31
31,3
19,8
12
-
45
6,4
68
,64
3
28
,014
,310
8
,35
6,16
1
6,2
05
,99
0
42
,576
,46
1 4
13,8
92
,182
5
Mac
hine
ry
8,5
88
-
-
8,5
88
8
,58
8
-
-
8
,58
8
-
10
Com
put
ers
and
acce
ssor
ies
23
7,6
02
,26
5
32
,98
1,32
1
23
,50
9,9
90
2
20
,311
,716
2
20
,276
,28
1 2
0,6
94
,70
3
18
,89
6,4
54
18
7,16
2,7
15
33
,149
,00
1 3
3-3
3.3
3
*
43
1,25
2
(4
49
,611
)
(
1,95
8,0
00
)
****
(
72,2
55
,112
)
****
(
72,2
55
,112
) G
ener
ator
s 6
,50
2,2
02
-
****
(
1,06
1,13
7)
5,4
41,0
65
6
,50
2,2
02
-
****
(
1,06
1,13
7)
5,4
41,0
65
-
20
Pow
er g
ener
atio
n un
it 16
0,6
59
,152
-
2
,215
,59
7
162
,874
,74
9
17,8
93
,44
7
-
7,4
92
,59
4
25
,38
6,0
41
137,
48
8,7
08
3
.33
-5 El
ectr
ical
equ
ipm
ent
and
devi
ces
918
,188
,44
8
21,3
08
,34
0
3
7,74
3,5
11
1,15
0,3
77,4
21
30
2,0
73,2
01
15,4
00
,139
89
,08
0,3
83
3
82
,814
,33
7
76
7,5
63
,08
4
3.3
3-3
3.3
3
3
76,7
30
(
5,6
27,
752
)
**
197,
107,
45
6
**
**
(18
,111,6
34
)
(
6,2
35
,43
0)
-
****
(
18,11
1,63
4)
IT e
quip
men
t 3
3,0
50
,44
0
-
-
33
,05
0,4
40
18
,86
6,9
41
-
7,9
59
,55
3
26
,82
6,4
94
6
,22
3,9
46
2
0 Fu
rnitu
re a
nd f
ittin
gs
183
,106
,012
18
,74
2,7
97
9,6
98
,05
6
199
,615
,03
9
94
,45
4,2
77
4,9
93
,870
33
,149
,50
7
107,
54
3,3
39
9
2,0
71,7
00
16
.67-
20
*
14
,73
1,58
9
(5
,58
4,5
11)
(7,
193
,611
)
****
(
19,4
69
,80
4)
**
**
(19
,46
9,8
04
) V
ehic
les
109
,35
5,3
79
18,8
59
,22
3
16
,76
4,0
58
7
2,9
65
,73
7
69
,48
6,2
44
12
,34
6,0
40
19,9
31,5
67
2
2,6
71,5
86
5
0,2
94
,151
20
*
4
5,15
2,4
14
(79
,09
2,2
65
)
(
92
,96
5,3
37)
*****
(
24
,20
0,0
00
) C
onst
ruct
ion
of s
hed
6,0
48
,277
-
-
6,0
48
,277
6
,04
8,2
77
-
-
6
,04
8,2
77
-
2
0 M
obile
pho
nes
25
,43
4,8
39
-
3
,58
7,3
99
14
,776
,316
18
,166
,150
-
5
,46
5,2
32
9
,80
9,4
40
4
,96
6,8
76
33
.33
-50
*
7
5,7
00
(
1,63
8,10
0)
(2
,137,
780
)
****
(
12,18
3,8
42
)
****
(
12,18
3,8
42
) W
eap
ons
3,9
66
,03
3
-
4
23
,56
0
4,3
89
,59
3
2,10
8,5
06
-
4
16,3
22
2
,52
4,8
28
1,
86
4,7
65
10
-20
ICO
M b
ased
sta
tion
25
,00
0
-
-
2
5,0
00
2
2,2
82
-
1,
35
9
23
,64
1 1,
35
9
25
Leas
ehol
d im
pro
vem
ents
5
,00
7,0
00
-
2
70,0
00
5
,149
,00
0
127,
760
-
1,0
66
,00
0
1,19
3,7
60
3
,95
5,2
40
10
-33
(12
8,0
00
) G
ym e
quip
men
ts
11,4
15,17
4
-
2,7
63
,48
4
14,17
8,6
58
19
7,77
1 -
1,3
03
,22
1 1,
50
0,9
92
12
,677
,66
6
33
.33
2
,53
8,5
17,6
40
12
3,2
11,4
93
96
,975
,65
5 2
,75
8,6
80
,24
2
78
4,2
46
,23
7
61,
790
,913
190
,96
8,1
82
8
21,
53
1,5
64
1,
93
7,14
8,6
78
*
6
0,7
67,
68
5
(92
,39
2,2
39
)
**
197,
107,
45
6
**
**
(12
3,0
81,
52
9)
(110
,618
,15
8)
**
**
(12
3,0
81,
52
9)
**
***
(24
,20
0,0
00
)
----
----
----
----
----
----
----
----
----
----
----
----
----
----
----
----
----
----
----
----
----
----
- R
upee
s --
----
----
----
----
----
----
----
----
----
----
----
----
----
----
----
----
----
----
----
----
----
--
Dep
reca
tion
ra
te %
As
at J
une
30
, 20
18
WR
ITT
EN
D
OW
N V
ALU
E
As
at J
une
30
, 20
18
Cha
rge
for
the
year
/ (O
n d
isp
osal
s) /
tr
ansf
ers
/ w
rite
off
On
acq
uisi
tion
un
der
bus
ines
s co
mb
inat
ion
(not
e 8
)A
s at
Jul
y 0
1, 2
017
As
at J
une
30
, 20
18
Ad
dit
ion
/ (d
isp
osal
s) /
tr
ansf
ers
/ w
rite
off
Acq
uire
d u
nder
b
usin
ess
com
bin
atio
n (n
ote
8)
As
at J
uly
01,
20
17
CO
ST
/ R
EV
ALU
ED
AM
OU
NT
AC
CU
MU
LATE
D D
EP
RE
CIA
TIO
N

171 Disrupt. Innovate.
FOR THE YEAR ENDED JUNE 30, 2018
NOTES TO THE CONSOLIDATED FINANCIAL STATEMENTS
Leas
ed
Com
put
er a
nd a
cces
sorie
s 3
9,4
70,3
81
-
-
3
9,4
70,3
81
37,
418
,40
8
-
5
45
,318
3
7,9
63
,72
6
1,5
06
,65
5
33
.33
Elec
tric
al e
quip
men
t -
-
-
-
-
-
-
-
-
20
Mob
ile p
hone
s 2
79,8
00
-
-
279
,80
0
279
,80
0
-
-
2
79,8
00
-
20
Gen
erat
ors
16,0
00
,40
0
-
**
* (
16,0
00
,40
0)
-
6
,40
0,15
2
-
1,
86
6,7
13
-
-
20
**
*
(8
,26
6,8
65
) V
ehic
les
40
,05
4,6
30
-
*****
2
4,2
00
,00
0
64
,25
4,6
30
3
1,40
5,12
2
-
4
,05
7,0
96
3
5,4
62
,218
2
8,7
92
,412
2
0
95
,80
5,2
11
-
***
(16
,00
0,4
00
) 10
4,0
04
,811
7
5,5
03
,48
2
-
6
,46
9,1
27
7
3,7
05
,74
4
30
,29
9,0
67
****
* 2
4,2
00
,00
0
**
* (8
,26
6,8
65
) 2
018
2
,63
4,3
22
,85
1 12
3,2
11,4
93
96
,975
,65
5 2
,86
2,6
85
,05
3
85
9,7
49
,719
6
1,79
0,9
13
19
7,4
37,
30
9
89
5,2
37,
30
8
1,9
67,
44
7,74
5
*
6
0,7
67,
68
5
(92
,39
2,2
39
)
**
197,
107,
45
6
**
* (8
,26
6,8
65
)
(1
10,6
18,1
58
)
****
(1
23
,08
1,5
29
)
***
(16
,00
0,4
00
)
****
(1
23
,08
1,5
29
)
* Rep
rese
nts
tran
sfer
s fr
om c
apita
l wor
k-in
-pro
gres
s to
ow
ned
asse
ts (
note
9.3
). **
Rep
rese
nts
tran
sfer
s fr
om s
tock
-in-
trad
e to
ow
ned
asse
ts.
*** R
epre
sent
s as
sets
der
ecog
nise
d on
ter
min
atio
n of
leas
e.
**** R
epre
sent
s as
sets
writ
ten
off
durin
g th
e ye
ar.
*****
Rep
rese
nts
asse
ts d
isp
osed
off
und
er s
ale
and
leas
ebac
k ar
rang
emen
t.
----
----
----
----
----
----
----
----
----
----
----
----
----
----
----
----
----
----
----
----
----
----
- R
upee
s --
----
----
----
----
----
----
----
----
----
----
----
----
----
----
----
----
----
----
----
----
----
--
Dep
reca
tion
ra
te %
As
at J
une
30
, 20
18
WR
ITT
EN
D
OW
N V
ALU
E
As
at J
une
30
, 20
18
Cha
rge
for
the
year
/ (O
n d
isp
osal
s) /
tr
ansf
ers
/ w
rite
off
On
acq
uisi
tion
un
der
bus
ines
s co
mb
inat
ion
(not
e 8
)A
s at
Jul
y 0
1, 2
017
As
at J
une
30
, 20
18
Ad
dit
ion
/ (d
isp
osal
s) /
tr
ansf
ers
/ w
rite
off
Acq
uire
d u
nder
b
usin
ess
com
bin
atio
n (n
ote
8)
As
at J
uly
01,
20
17
CO
ST
/ R
EV
ALU
ED
AM
OU
NT
AC
CU
MU
LATE
D D
EP
RE
CIA
TIO
N

172
FOR THE YEAR ENDED JUNE 30, 2018
NOTES TO THE CONSOLIDATED FINANCIAL STATEMENTS
As atJuly 01,
2016
As atJune 30,
2017
COST / REVALUED AMOUNT ACCUMULATED DEPRECIATION
WRITTENDOWNVALUE
As atJuly 01,
2016
Charge for the year /
(disposals) / transfers
(note 5.1.1)
As atJune 30,
2017
As atJune 30,
2017
Deprec- iationRate
Additions /(disposals) /
transfers--------------------------------------- (Rupees) ------------------------------------------ %
Owned Leasehold land 194,124,965 218,875,035 413,000,000 - - - 413,000,000 - Building on leasehold land 410,558,183 14,590,648 425,148,831 23,487,978 4,526,332 28,014,310 397,134,521 5 Machinery 8,588 - 8,588 6,660 1,928 8,588 - 10 Computers and accessories 208,531,579 20,243,018 237,602,265 188,324,990 25,820,229 220,276,281 17,325,984 33-33.33 (551,890) (398,965) * 2,849,531 *** 6,530,027 *** 6,530,027 Generators 6,502,202 - 6,502,202 6,480,372 21,830 6,502,202 - 20 Power generation unit 92,048,400 6,892,240 160,659,152 5,766,671 5,901,502 17,893,447 142,765,705 3.33-5 *** 61,718,512 *** 6,225,274 Electrical equipment and devices 475,733,604 297,872,047 918,188,448 200,583,631 86,797,163 302,073,201 616,115,247 3.33-33.33 (1,172,810) (1,014,810) *** 82,187,741 *** 15,707,217 * 3,564,900 ** 60,002,966 IT equipment 30,831,740 2,218,700 33,050,440 10,944,367 7,922,574 18,866,941 14,183,499 20 Furniture and fittings 147,859,459 31,631,309 183,106,012 59,599,311 35,242,307 94,454,277 88,651,735 16.67-20 (387,981) (387,341) * 4,003,225 Vehicles (note 4.1.2) 111,611,714 3,634,649 109,355,379 59,580,683 15,796,545 69,486,244 39,869,135 20 (5,890,984) (5,890,984) Construction of shed 6,048,277 - 6,048,277 6,048,277 - 6,048,277 - 20 Mobile phones 20,509,087 4,905,602 25,434,839 13,813,436 4,479,598 18,166,150 7,268,689 33.33 (435,450) (126,884) * 455,600 Weapons 3,966,033 - 3,966,033 1,711,483 397,023 2,108,506 1,857,527 10 ICOM based station 25,000 - 25,000 20,922 1,360 22,282 2,718 25 Leasehold improvements - 5,007,000 5,007,000 - 127,760 127,760 4,879,240 10-33 Gym equipments - 11,415,174 11,415,174 - 197,771 197,771 11,217,403 33.33 1,708,358,831 617,285,422 2,538,517,640 576,368,781 187,233,921 784,246,236 1,754,271,403 (8,439,115) (7,818,984) * 10,873,256 *** 28,462,518 ** 60,002,966 *** 150,436,280 Leased Computer and accessories 46,000,408 *** (6,530,027) 39,470,381 40,347,050 3,601,385 37,418,408 2,051,973 33.33 (6,530,027) Power generation unit 61,718,512 *** (61,718,512) - 4,871,829 1,353,445 - - 20 (6,225,274) Electrical equipment 82,187,741 *** (82,187,741) - 12,731,792 2,975,425 - - 20 (15,707,217) Mobile phones 279,800 - 279,800 279,800 - 279,800 - 20 Generators 16,000,400 - 16,000,400 3,200,076 3,200,076 6,400,152 9,600,248 20 Vehicles 37,560,880 * 2,493,750 40,054,630 27,348,026 4,057,096 31,405,122 8,649,508 20 243,747,741 v * 2,493,750 95,805,211 88,778,573 15,187,427 75,503,482 20,301,729 *** (150,436,280) *** (28,462,518) 2017 1,952,106,572 617,285,422 2,634,322,851 665,147,354 175,543,223 859,749,718 1,774,573,133 (8,439,115) (7,818,984) * 13,367,006 **** 26,878,125 ** 60,002,966
* Represents transfers from capital work-in-progress to owned and leased assets (note 9.3) ** Represents transfers from stock-in-trade to owned assets *** Represents transfers from leased to owned assets **** Represents the opening accumulated depreciation of TPLL added into Charge for the year.

173 Disrupt. Innovate.
FOR THE YEAR ENDED JUNE 30, 2018
NOTES TO THE CONSOLIDATED FINANCIAL STATEMENTS
9.1.1 Depreciation charge for the year has been allocated as follows: Cost of sales and services 43 126,481,893 112,512,604 Distribution expenses 44 26,045,694 25,307,603 Administrative expenses 45 44,909,722 37,723,016 197,437,309 175,543,223 9.1.2 During the year, the Group has transferred tracking devices from stock-in-trade at a cost of Rs.
197.107 million (2017: Rs. 329.98 million) to owned assets. As of reporting date assets costing Rs. 619.765 million (2017: Rs. 379.986 million) are in possession of third parties, on rental basis.
9.1.3 Includes in operating fixed assets are fully depreciated assets having cost of Rs. 384.521 million (2017: Rs. 487.5 million).
9.1.4 The Group carried out the revaluation exercise by an independent valuer during the year ended
June 30, 2017, which has resulted in surplus on leasehold land and building on leasehold land of Rs. 218.875 million and Rs.14.591 million over their existing cost of Rs.194.125 million and Rs. 45.465 million and written down value of Rs. 194.125 million and Rs. 26.298 million, respectively.
Had there been no revaluation, the aggregated cost and written down value of revalued leasehold land and building on leasehold land would have been lower by Rs. 233.466 (2017: Rs. 233.466) million and 232.310 (2017: Rs. 233.040 million) and surplus on revaluation of fixed assets would have been lower by Rs. 228.061 (2017: Rs. 228.790 million).
The fair values were determined with reference to market based evidence, based on active market prices and relevant enquiries and information as considered necessary, and adjusted for any difference in nature, location or condition of the specific properties. The fair value of leasehold land and building on leasehold land falls under level 2 of fair value hierarchy (i.e. significant observable inputs).
9.1.5 The forced sale value as per the last revaluation report are as follows:
Leasehold land 340,550,000 340,550,000 Building on leasehold land 34,461,200 34,461,200 375,011,200 375,011,200 9.1.6 The immoveable assets of the Group are placed as security against various financing facilities
obtained from commercial banks as stated in notes 28, 30 and 37 respectively to these consolidated financial statements.
9.1.7 The details of immovable assets (i.e land and building) of the Group as at June 30, 2018 and 2017
are as follows: Covered Area (sq.ft ) Location Addresses Usage Lahore 51-M, Quaid-E-Azam Industrial Estate, Kot Lakhpat Installation Centre 44,950 Karachi Plot no. 20-B & 20-C, Block No. 6, P.E.C.H.S. Ltd.. Survey sheet no. 35-P/1. Installation Centre 3,000
2018 2017
Note Rupees Rupees
2018 2017
Rupees Rupees
174
FOR THE YEAR ENDED JUNE 30, 2018
NOTES TO THE CONSOLIDATED FINANCIAL STATEMENTS
9.2 The details of operating fixed assets disposed off during the year are as follows:
Description Written Original Accumulated down Sale Gain on Mode of Particulars of cost depreciation value proceeds disposals disposal buyers Location --------------------------------------------------- (Rupees) ---------------------------------------------------- Motor Vehicles Land Cruiser (BN-0005) 16,000,000 11,200,000 4,800,000 11,250,000 (6,450,000) Negotiation TLI (a related party) Karachi Range Rover (BM-0005) 30,683,374 21,610,303 9,073,071 20,000,000 (10,926,929) Negotiation TLI (a related party) Karachi Mercedes Benz (Class S) 24,200,000 - 24,200,000 24,000,000 200,000 Under sale Meezan Bank Karachi and lease back transactions 70,883,374 32,810,303 38,073,071 55,250,000 (17,176,929) Aggregate amount of assets disposed off having written down value less than Rs. 500,000 Owned Computers and accessories 1,958,000 449,611 1,508,389 900,000 608,389 Various Various Karachi Electrical equipment 6,235,430 5,627,751 607,679 220,000 387,679 Various Various Karachi Furniture and fittings 7,193,611 5,584,511 1,609,100 1,974,401 (365,301) Various Various Karachi Mobile phones 2,137,780 1,638,100 499,680 407,763 91,917 Various Various Karachi Leasehold improvements 128,000 - 128,000 128,000 - Negotiation Various Karachi Motor vehicles 46,281,963 46,281,962 - - - Various Various Karachi 63,934,784 59,581,935 4,352,848 3,630,164 722,684 2018 134,818,158 92,392,239 42,425,919 58,880,164 (16,454,245) 2017 8,439,115 8,439,115 - 3,832,248 3,832,248
9.3 Capital work-in-progres Opening balance 24,947,491 18,505,613 Additions during the year 261,014,678 23,271,293 Acquired under business combination 21,429,358 - Transfers during the year: - operating fixed assets 9.1 (60,767,685) (13,367,006) - TPL Insurance Limited - (3,462,409) Closing balance 246,623,842 24,947,491 9.3.1. Represents expenses incurred and advances made by the Group in respect of procurement of
computer equipment and software, office equipment, furniture and fixtures.
10. INTANGIBLE ASSETS Intangible assets 10.1 2,081,610,105 1,434,954,387 Intangible assets under development 10.2 546,022,997 314,526,753 2,627,633,102 1,749,481,140
2018 2017
Note Rupees Rupees
2018 2017
Note Rupees Rupees

175 Disrupt. Innovate.
FOR THE YEAR ENDED JUNE 30, 2018
NOTES TO THE CONSOLIDATED FINANCIAL STATEMENTS
Owned Goodwill (notes 8 and 10.4) 493,042,630 660,971,510 1,154,014,140 - - - 1,154,014,140 - Customers related intangible assets 453,635,249 - 453,635,249 - 175,135 175,135 453,460,114 - Marketing related intangible assets 289,021,582 - 289,021,582 - - - 289,021,582 - Internally generated computer softwares 25,840,000 - 25,840,000 25,840,000 - 25,840,000 - 13.33 Maps database 147,858,790 - 147,858,790 60,991,747 7,392,940 68,384,687 79,474,103 5 Software 325,883,507 29,765,776 370,945,136 213,495,624 44,823,047 265,304,970 105,640,166 20-33.33 * (3,604,380) 6,986,299 * 18,900,233 PTA license 1,000,500 - 1,000,500 1,000,500 - 1,000,500 - 6.67 Decarta maps 22,884,695 - 22,884,695 22,884,695 - 22,884,695 - 20 2018 1,759,166,953 690,737,286 2,465,200,092 324,212,566 52,391,122 383,589,987 2,081,610,105 (3,604,380) - * 18,900,233 * 6,986,299 * Represents acquired under business combination (note 8).
Owned Goodwill (note 10.4) 493,042,630 - 493,042,630 - - - 493,042,630 - Customers related intangible assets 453,635,249 - 453,635,249 - - - 453,635,249 - Marketing related intangible assets 289,021,582 - 289,021,582 - - - 289,021,582 - Internally generated computer softwares 25,840,000 - 25,840,000 24,973,490 866,508 25,840,000 - 13.33 Maps database 147,858,790 - 147,858,790 53,598,807 7,392,940 60,991,747 86,867,043 5 Software 282,229,224 43,654,283 325,883,507 153,625,177 59,870,447 213,495,624 112,387,883 20-33.33 PTA license 1,000,500 - 1,000,500 1,000,500 - 1,000,500 - 6.67 Decarta maps 22,884,695 - 22,884,695 22,884,695 - 22,884,695 - 20 2017 1,715,512,670 43,654,283 1,759,166,953 256,082,669 50,191,168 324,212,566 1,434,954,387 * 17,938,727
10.1 Intangible assets
As atJuly 01,
2017
As atJune 30,
2018
COST ACCUMULATED AMORTISATION /
IMPAIRMENT
WRITTENDOWNVALUE
As atJuly 01,
2017
Charge for the year /
(disposals) / acquired under
businesscombination
As atJune 30,
2018
As atJune 30,
2018
Amortisa- tion rate
%
Additions /(disposals) /
acquired underbusiness
combination--------------------------------------- (Rupees) ------------------------------------------
As atJuly 01,
2017
As atJune 30,
2018
COST ACCUMULATED AMORTISATION /
IMPAIRMENT
WRITTENDOWNVALUE
As atJuly 01,
2017
Charge for the year /
(disposals) / acquired under
businesscombination
As atJune 30,
2018
As atJune 30,
2018
Amortisa- tion rate
%
Additions /(disposals) /
acquired underbusiness
combination--------------------------------------- (Rupees) ------------------------------------------

176
FOR THE YEAR ENDED JUNE 30, 2018
NOTES TO THE CONSOLIDATED FINANCIAL STATEMENTS
10.2 Represents expenditure incurred for development of map database.
10.3 Amortisation charge for the year has been allocated as follows: Cost of sales and services 43 46,165,989 50,103,602 Administrative expenses 45 6,225,133 87,567 52,391,122 50,191,169 10.4 Impairment testing of goodwill, intangibles with indefinite lives and under development The Group has performed its annual impairment test on the following cash generating units as at June
30, 2018. Tracking business
Goodwill acquired through business combinations and intangibles with indefinite useful lives have been allocated and monitored at the Group level (tracking business - excluding non-operating assets). Intangible assets with indefinite useful lives include customer and marketing related intangibles assets. The Group has performed its annual impairment test as at June 30, 2018.
The recoverable amount is determined based on a value-in-use calculation using cash flow projections from financial budgets approved by the senior management covering a five year period and applying the expected value approach. The discount rate applied to cash flow projections is 18.9 percent (2017: 16.1 percent). The growth rate used to extrapolate the cash flows beyond the five-year period is 4.1 percent (2017: 4.1 percent). As a result of this analysis, the management did not identify any impairment for the cash generating unit to which goodwill of Rs. 403,380,571/- and intangibles with indefinite useful lives are allocated.
Real estate
Goodwill acquired through business combination have been allocated and monitored at the Group level (i.e. Real Estate business and related services). The Group calculated the recoverable amount of its investment based on the fair value less costs to sell using observable market prices less incremental costs to sell the asset including valuation of investment property, as prescribed under “Impairment of Assets” (IAS-36), which was higher than the carrying value. As a result of this analysis, the management did not identify any impairment for the cash generating unit to which goodwill of Rs. 59,328,763/- is allocated.
Insurance business
Goodwill acquired through business combinations have been allocated and monitored at the Group level (insurance business). The Group calculated the recoverable amount of its investment based on the fair value less cost to sell using observable market prices less incremental cost to sell the assets, as prescribed under IAS-36, which was higher than the carrying value. As a result of this assessment, the management did not identify any impairment for cash generating unit to which provisional goodwill of Rs. 660,971,510/- is allocated.
Other business Goodwill acquired through business combinations have been allocated and monitored at the Group level
(other business i.e. security and maps / nagivation services).The recoverable amount of sercurity services is determined based on value in use calculations, which was higher than the carrying value. The discount rate applied to cash flow projections is 15.0 percent (2017: 13.6 percent). The growth rate use to extrapolate the cash flows beyond the five-year period is 4.0 percent (2017: 4.1 percent). As a result of this assessment, the management did not identify any impairment for the cash generating unit to which goodwill of Rs. 30,333,296/- is allocated.
2018 2017
Note Rupees Rupees

177 Disrupt. Innovate.
FOR THE YEAR ENDED JUNE 30, 2018
NOTES TO THE CONSOLIDATED FINANCIAL STATEMENTS
In addition, the group has carried out an impairment assessment for Maps/Navigation business (including intangible assets under development) based on the value-in-use calculations and the discount rate applied to the cashflow projections is 19.2 percent and the growth rate used to extrpolate the cashflows beyond the prior year period is 6.0 percent. As a result of this assessment, the management did not identify any impairment in the carrying value of intangible assets under development of Rs. 546.023 million.
Key assumptions used in value-in-use calculations
The calculation of value-in-use is most sensitive to the following assumptions: · Discount rates · Key business assumptions
Discount rates
The discount rate reflects current market assessment of the rate of return required for the business and is calculated using the Capital Asset Pricing Model. The discount rate reflects the target Weighted Average Cost of Capital of the Group.
Key business assumptions
These assumptions are based on industry data for growth rates, management assess how the unit’s position might change over the projected period. Management expects revenues and margins to improve on the basis of multiple strategies planned including increase in vehicle tracking sales volume and greater focus on container tracking and navigation businesses.
Sensitivity to changes in assumptions
Management believes that after considering the various scenarios no reasonably possible change in any of the above key assumptions would cause the carrying value of the unit to materially exceed its recoverable amount.
11. INVESTMENT PROPERTIES Investment property - completed 11.1 5,298,404,608 4,340,262,571 Investment property - under construction 11.2 24,273,665 8,190,702 5,322,678,273 4,348,453,273 11.1 The movement in investment property during the year is as follows: As at 01 July 4,340,262,571 4,090,415,737 Add: Additons to investment property 16,868,937 46,918,610 Less: Transferred to property, plant and equipment (share of owner occupied property) (3,373,787) - 4,353,757,721 4,137,334,347 Add: Remeasurement adjustment 48 944,646,887 202,928,224 As at June 30 5,298,404,608 4,340,262,571 11.1.1 Investment property comprises of leasehold land having area of 2,914 square yards and building
thereon, situated at 66/3-2, Shaheed-e-Millat Expressway, near KPT Interchange Flyover, Karachi, hereinafter refered to as Centrepoint Project.
2018 2017
Note Rupees Rupees

178
FOR THE YEAR ENDED JUNE 30, 2018
NOTES TO THE CONSOLIDATED FINANCIAL STATEMENTS
11.1.2 An independent valuation of Centrepoint Project was carried out by an independent professional valuer on June 30, 2018 and the fair value of Rs. 6,165 million (2017: Rs. 4,967 million) was determined with reference to market based evidence, active market prices and relevant information. Accordingly, the fair value adjustment for the year of Rs. 944.646 million (2017: Rs. 202.928 million) [excluding the impact related to owner occupied property of Rs. 236.161 million (2017: Rs. 85.837 million)] property is recognised in the profit or loss. The fair value of investment property fall under level 2 of fair value hierarchy (i.e. significant observable inputs).
11.1.3 Forced sale value of the investment property is Rs. 5,911.053 million.
11.2 Represents expenses incurred on various projects of the Group related to the construction of investment property.
12. DEVELOPMENT PROPERTIES Land 801,225,879 801,225,879 Design and consultancy 120,730,826 27,083,115 Project management and anciliary costs 113,671,817 28,305,340 Other project costs 54,518,898 32,124,406 12.1 1,090,147,420 888,738,740 12.1 Represents Group project under construction at Plot No 22/7, Street CL-9, Civil Lines Quarter, Karachi
and currently in the initial stages for approval of design followed by commencement of construction on receipt of approval.
13. LONG-TERM INVESTMENTS Investment in associated company – at equity method TPL Insurance Limited 8 - 536,285,330 13.1 Movement of investment in an associated company Balance at the beginning of the year 536,285,330 506,417,217 Share of profit for the current year (un-audited) 7,180,014 29,868,113 Less: Derecognition of investment on further acquisition 543,465,344 - Balance at the end of the year 8 - 536,285,330 13.2 The summarised financial information of an associate based on the financial statements for the year
ended June 30, 2018 and 2017, is as follows:
Total assets - 2,426,809,165 Total liabilities - 1,098,086,255 Revenues - 1,276,616,522 Profit after tax - 122,434,687
2018 2017
Note Rupees Rupees
2018 2017
Note Rupees Rupees
2018 2017
Note Rupees Rupees

179 Disrupt. Innovate.
FOR THE YEAR ENDED JUNE 30, 2018
NOTES TO THE CONSOLIDATED FINANCIAL STATEMENTS
14. LONG-TERM LOANS – secured, considered good Executives * 14.1 & 14.2 474,427 - Employees 889,012 2,339,598
14.3 1,363,439 2,339,598 Less: Current portion 19 926,862 1,513,060
436,577 826,538 * The comparative figures have been restated to reflect the changes in the definition of executives as per
Companies Act, 2017.
14.1 Reconciliation of the carrying amount of loans to executives Disbursements 687,098 - Less: Repayments / adjustments 212,671 -
Balance as on June 30 474,427 - 14.2 The maximum aggregate amount of loans due from the executives at the end of any month during the
year was Rs. 2.184 million (2017: Rs. 3.380 million).
14.3 The loans are provided to employees of the Holding Company for the purchase of furniture and fixtures, renovation of house and marriage of self / children in accordance with the terms of employment and carrying mark-up at the rate of 5 percent (2017: 5 percent) per annum. Further, it also includes loans provided on interest free basis amounting to Rs. 0.280 million (2017: Rs. 0.612 million). All loans are repayable over a period of two years in equal monthly installments and are secured against salaries and provident fund balances of the employees.
15. LONG-TERM DEPOSITS Security deposits - leased and ijarah assets 61,537,417 33,010,985 Less: Current portion 20 21,935,962 12,643,282
39,601,455 20,367,703 Utilities 317,450 177,450 Rent deposits 3,662,756 2,998,921 Cash margin against guarantees 15.1 26,049,352 21,787,154 Others 286,919 186,919
15.2 69,917,932 45,518,147 15.1 Represents cash margin on guarantee issued by a commercial bank on behalf of the Group.
15.2 These are non-interest bearing and generally on a term of more than a year.
2018 2017
Note Rupees Rupees
2018 2017
Rupees Rupees
2018 2017
Rupees Rupees

180
FOR THE YEAR ENDED JUNE 30, 2018
NOTES TO THE CONSOLIDATED FINANCIAL STATEMENTS
16. DEFERRED TAX ASSET - NET Deferred tax asset on deductible temporary differences: - unused tax losses 154,170,834 156,911,219 - surplus on revaluation of fixed assets 4,249,526 4,249,526 - liabilities against assets subject to finance lease - net 4,058,945 6,675,473 - provision for doubtful debts 16,320,628 8,825,403 - liabilities against insurance contracts 4,041,493 - - unrealised loss on avaliable for sale investments 15,776,474 - - deferred income 733,334 733,334 - provision for gratuity 4,419,877 3,669,062 203,771,111 181,064,017 Deferred tax liability on taxable temporary differences:
- accelerated tax depreciation on owned and leased assets (56,921,026) (53,679,949) - intangible assets (5,642,765) (5,695,305) - advance against rent from tenants (27,567,486) (38,236,796) (90,131,277) (97,612,050) 113,639,834 83,451,967
17. STOCK-IN-TRADE Tracking devices 17.1 & 17.2 316,069,079 347,658,183 Spare parts 17.3 9,828,416 8,464,342 Tools 794,272 1,094,402 326,691,767 357,216,927 17.1 Includes stock of Rs.42.731 million (2017: Rs. 13.149 million) held with third parties on account of stock given
for demo and repair purposes.
17.2 Includes stock of Rs. 79.956 million (2017: Rs. 95.646 million) held with third parties on account of on-site container tracking installations.
17.3 Represents Bonnet Locks, Window Motors etc. which are held for sale.
18. TRADE DEBTS - unsecured Considered good - tracking devices 18.1 & 18.2 1,342,441,724 1,206,636,562 - security services 39,379,872 31,120,422 - rent 14,272,037 26,555,792 - electricity, air conditioning and other services 16,093,836 16,274,200 1,412,187,469 1,280,586,976 Considered doubtful 30,997,873 31,218,010 Less: Provision for doubtful debts 18.4 30,997,873 31,218,010 - - 1,412,187,469 1,280,586,976
2018 2017
Note Rupees Rupees
2018 2017
Note Rupees Rupees
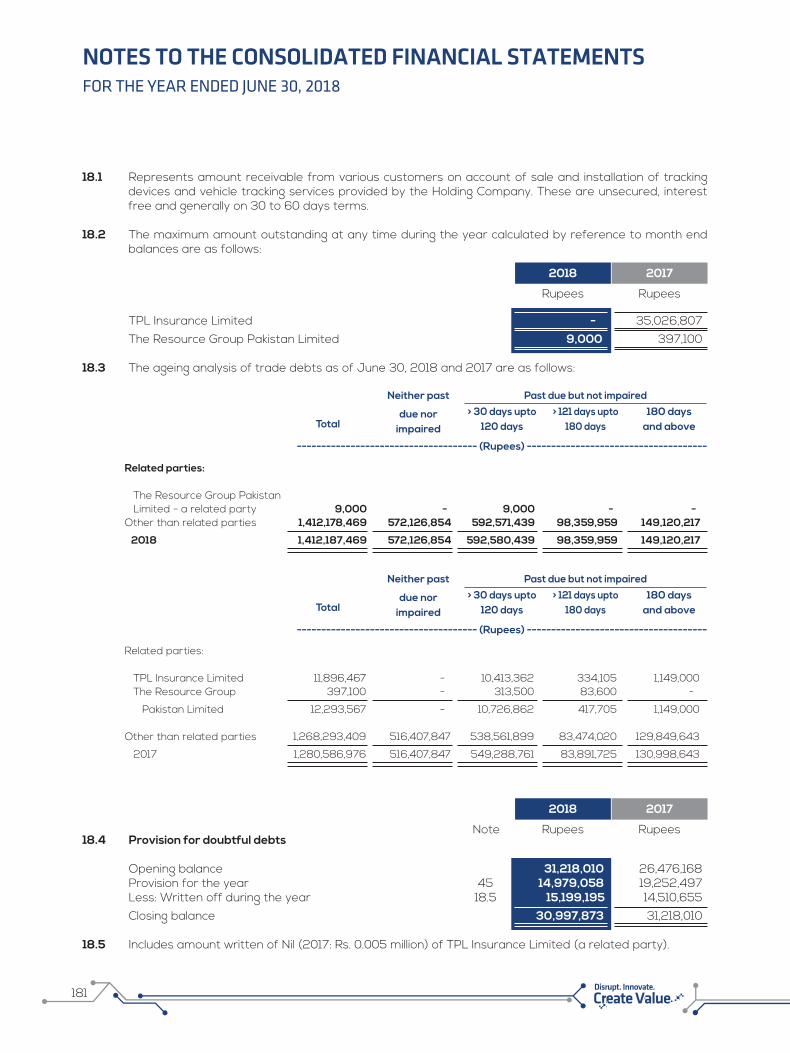
181 Disrupt. Innovate.
FOR THE YEAR ENDED JUNE 30, 2018
NOTES TO THE CONSOLIDATED FINANCIAL STATEMENTS
18.1 Represents amount receivable from various customers on account of sale and installation of tracking devices and vehicle tracking services provided by the Holding Company. These are unsecured, interest free and generally on 30 to 60 days terms.
18.2 The maximum amount outstanding at any time during the year calculated by reference to month end balances are as follows:
TPL Insurance Limited - 35,026,807 The Resource Group Pakistan Limited 9,000 397,100 18.3 The ageing analysis of trade debts as of June 30, 2018 and 2017 are as follows:
Related parties: The Resource Group Pakistan Limited - a related party 9,000 - 9,000 - - Other than related parties 1,412,178,469 572,126,854 592,571,439 98,359,959 149,120,217
2018 1,412,187,469 572,126,854 592,580,439 98,359,959 149,120,217
Related parties: TPL Insurance Limited 11,896,467 - 10,413,362 334,105 1,149,000 The Resource Group 397,100 - 313,500 83,600 -
Pakistan Limited 12,293,567 - 10,726,862 417,705 1,149,000 Other than related parties 1,268,293,409 516,407,847 538,561,899 83,474,020 129,849,643
2017 1,280,586,976 516,407,847 549,288,761 83,891,725 130,998,643
18.4 Provision for doubtful debts Opening balance 31,218,010 26,476,168 Provision for the year 45 14,979,058 19,252,497 Less: Written off during the year 18.5 15,199,195 14,510,655 Closing balance 30,997,873 31,218,010 18.5 Includes amount written of Nil (2017: Rs. 0.005 million) of TPL Insurance Limited (a related party).
2018 2017
Rupees Rupees
Total
Neither past
due norimpaired
> 30 days upto120 days
Past due but not impaired> 121 days upto
180 days180 days
and above
------------------------------------- (Rupees) -------------------------------------
Total
Neither past
due norimpaired
> 30 days upto120 days
Past due but not impaired> 121 days upto
180 days180 days
and above
------------------------------------- (Rupees) -------------------------------------
2018 2017
Note Rupees Rupees
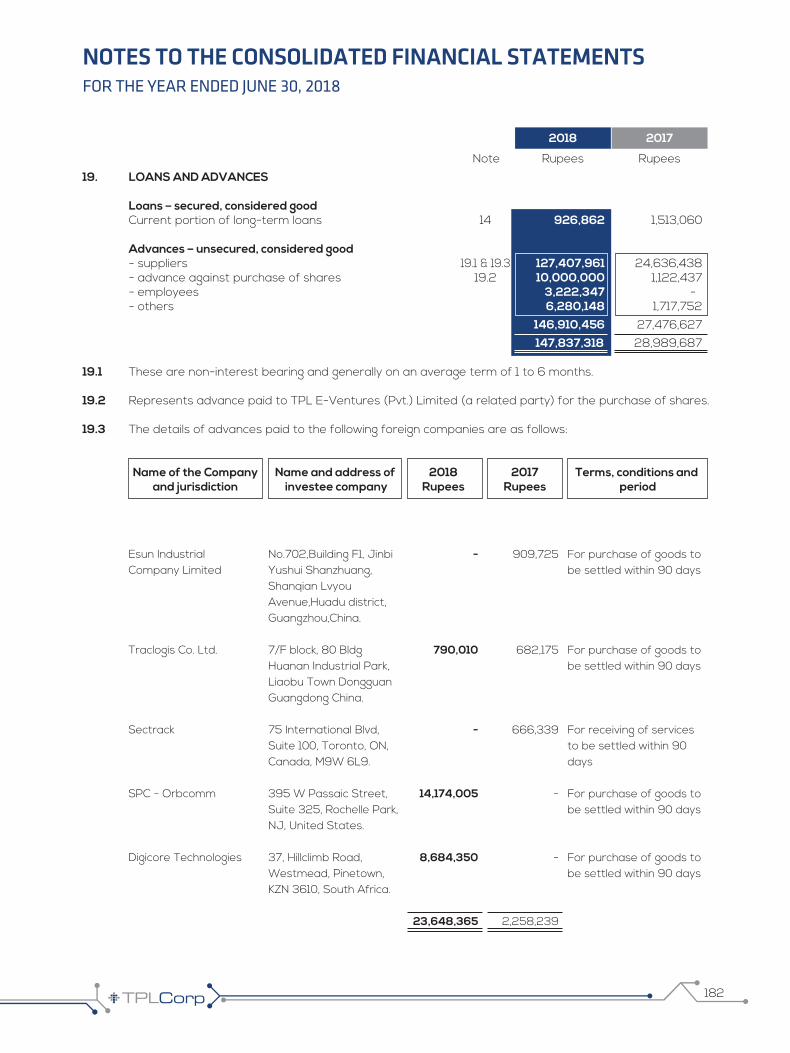
182
FOR THE YEAR ENDED JUNE 30, 2018
NOTES TO THE CONSOLIDATED FINANCIAL STATEMENTS
19. LOANS AND ADVANCES
Loans – secured, considered good Current portion of long-term loans 14 926,862 1,513,060 Advances – unsecured, considered good - suppliers 19.1 & 19.3 127,407,961 24,636,438 - advance against purchase of shares 19.2 10,000,000 1,122,437 - employees 3,222,347 - - others 6,280,148 1,717,752 146,910,456 27,476,627 147,837,318 28,989,687 19.1 These are non-interest bearing and generally on an average term of 1 to 6 months.
19.2 Represents advance paid to TPL E-Ventures (Pvt.) Limited (a related party) for the purchase of shares.
19.3 The details of advances paid to the following foreign companies are as follows:
Name of the Company Name and address of 2018 2017 Terms, conditions and and jurisdiction investee company Rupees Rupees period
2018 2017
Note Rupees Rupees
Esun Industrial Company Limited
Traclogis Co. Ltd.
Sectrack
SPC - Orbcomm
Digicore Technologies
No.702,Building F1, Jinbi Yushui Shanzhuang, Shanqian Lvyou Avenue,Huadu district, Guangzhou,China.
7/F block, 80 Bldg Huanan Industrial Park, Liaobu Town Dongguan Guangdong China.
75 International Blvd, Suite 100, Toronto, ON, Canada, M9W 6L9.
395 W Passaic Street, Suite 325, Rochelle Park, NJ, United States.
37, Hillclimb Road, Westmead, Pinetown, KZN 3610, South Africa.
For purchase of goods to be settled within 90 days
For purchase of goods to be settled within 90 days
For receiving of services to be settled within 90 days For purchase of goods to be settled within 90 days
For purchase of goods to be settled within 90 days
-
790,010
-
14,174,005
8,684,350
23,648,365
909,725
682,175
666,339
-
-
2,258,239
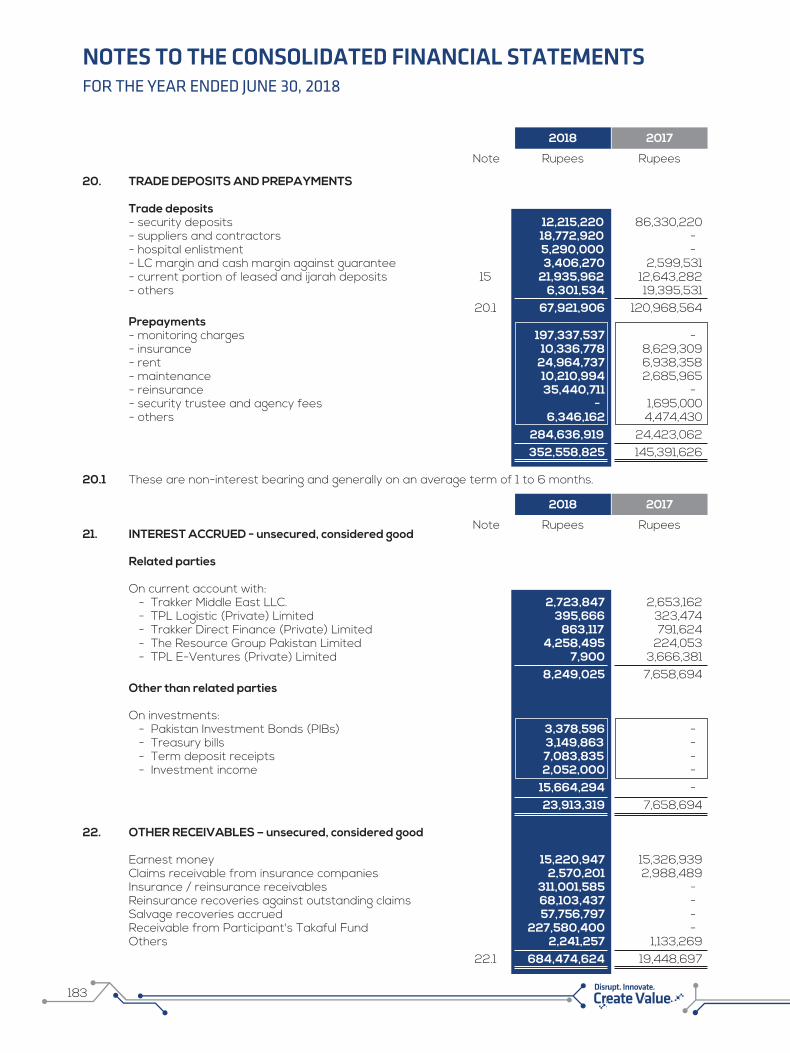
183 Disrupt. Innovate.
FOR THE YEAR ENDED JUNE 30, 2018
NOTES TO THE CONSOLIDATED FINANCIAL STATEMENTS
20. TRADE DEPOSITS AND PREPAYMENTS Trade deposits - security deposits 12,215,220 86,330,220 - suppliers and contractors 18,772,920 - - hospital enlistment 5,290,000 - - LC margin and cash margin against guarantee 3,406,270 2,599,531 - current portion of leased and ijarah deposits 15 21,935,962 12,643,282 - others 6,301,534 19,395,531 20.1 67,921,906 120,968,564 Prepayments - monitoring charges 197,337,537 - - insurance 10,336,778 8,629,309 - rent 24,964,737 6,938,358 - maintenance 10,210,994 2,685,965 - reinsurance 35,440,711 - - security trustee and agency fees - 1,695,000 - others 6,346,162 4,474,430 284,636,919 24,423,062 352,558,825 145,391,626
20.1 These are non-interest bearing and generally on an average term of 1 to 6 months.
21. INTEREST ACCRUED - unsecured, considered good
Related parties On current account with: - Trakker Middle East LLC. 2,723,847 2,653,162 - TPL Logistic (Private) Limited 395,666 323,474 - Trakker Direct Finance (Private) Limited 863,117 791,624 - The Resource Group Pakistan Limited 4,258,495 224,053 - TPL E-Ventures (Private) Limited 7,900 3,666,381 8,249,025 7,658,694 Other than related parties On investments: - Pakistan Investment Bonds (PIBs) 3,378,596 - - Treasury bills 3,149,863 - - Term deposit receipts 7,083,835 - - Investment income 2,052,000 - 15,664,294 - 23,913,319 7,658,694 22. OTHER RECEIVABLES – unsecured, considered good Earnest money 15,220,947 15,326,939 Claims receivable from insurance companies 2,570,201 2,988,489 Insurance / reinsurance receivables 311,001,585 - Reinsurance recoveries against outstanding claims 68,103,437 - Salvage recoveries accrued 57,756,797 - Receivable from Participant's Takaful Fund 227,580,400 - Others 2,241,257 1,133,269 22.1 684,474,624 19,448,697
2018 2017
Note Rupees Rupees
2018 2017
Note Rupees Rupees

184
FOR THE YEAR ENDED JUNE 30, 2018
NOTES TO THE CONSOLIDATED FINANCIAL STATEMENTS
22.1 These are non-interest bearing receivables which are neither past due nor impaired, and generally on an average term of 1 to 6 months.
23. SHORT-TERM INVESTMENTS Investment in an associated companies – equity method Trakker Middle East LLC (TME) 23.1, 23.2 111,339,232 131,666,479 & 23.3 Held-to-maturity Pakistan Investment Bonds (PIBs) 23.4 154,215,100 85,054,000 Treasury bills 23.5 73,968,126 49,751,936 Term deposit receipts (TDRs) 23.6 710,000,000 - 938,183,226 134,805,936 Held-for-trading Listed equity 23.7 1,256,725 37,370,000 Open ended mutual funds 23.8 336,902,224 10,278,000
1,387,681,407 314,120,415 23.1 The Company holds 1,644 (2017: 1,644) ordinary shares of AED 1,000 each, representing 29 percent
(2017: 29 percent) of the share capital as of the reporting date. The book value per share amounts to AED 764 (2017: AED 1,715) equivalent to Rs. 25,284 (2017: Rs. 41,167) based on the latest available un-audited financial statements for the period ended June 30, 2018.
TME is a limited liability company registered in Abu Dhabi, United Arab Emirates. The registered office of the Company is at P.O. Box 52331, Abu Dhabi, United Arab Emirates. The principal activities of TME are the selling, marketing and distribution of products and services in the field of wireless, fleet management, tracking and telemetry services.
The name of Chief Executive is Asim Syed and name/addresses of beneficial owners are as follows: Name Addresses Al Jaber Group LLC P.O. Box #: 2175, Abu Dhabi Petrolium Service Area Plot No. 1 & 1A. Jamal Mohd Matar Al Hai P.O. Box #: 2116, Dubai UAE. The auditors of the TME has expressed an unmodified opinion on the latest available financial statement.
Based on the approval of Board of Directors of the Company in their meeting held on April 23, 2015 to consider and negotiate an offer to disinvest entire shareholding in TME, the Company has conditionally accepted an offer for disposal of its entire shareholding in TME, subject to obtaining the necessary approvals, compliance of legal formalities and signing of a binding sale agreement to execute the transaction. The management expects that this offer will be materialized and the said investment in TME will be disposed of in near future. Accordingly, it has been classified as short-term investments under current assets.
Investment in associated companies have been made in accordance with the requirement of Companies Act, 2017.
2018 2017
Note Rupees Rupees

185 Disrupt. Innovate.
FOR THE YEAR ENDED JUNE 30, 2018
NOTES TO THE CONSOLIDATED FINANCIAL STATEMENTS
23.2 Movement of investment in an associated company
Balance at the beginning of the year 131,666,479 144,572,243 Share of loss for the current yaer (un-audited) (20,327,247) (12,905,764)
Balance at the end of the year 111,339,232 131,666,479 23.3 The summarised financial information of an associate based on the financial statements for the year
ended June 30, 2018 and 2017 are as follows:
Total assets 298,419,128 328,521,124
Total liabilities 155,056,955 95,778,673
Revenues 221,195,938 240,141,482
Loss after tax (73,922,555) (44,502,636) 23.4 Includes 3 and 10 years PIBs having face value of Rs. 155 million carrying mark-up ranging from 7 percent
to 12 percent per annum and will mature between September 03, 2019 to December 29, 2021. These have been deposited with the State Bank of Pakistan (SBP) as statutory deposit in accordance with the requirements of Section 29 of the Insurance Ordinance, 2000.
23.5 Represents T-Bills having face value of Rs. 73.88 million for the period of 3 months. It carries yield of 4 percent to 6.72 percent per annum.
23.6 Represents TDRs having face value of Rs. 710 million that carries mark-up at the rate ranging from 5.5 percent 6.75 percent per annum.
23.7 The Group has the following instruments in listed equities held for trading:
Number of Shares 16,000 360,000 Summit Bank Limited 34,400 36,000,000 7,731 - Bank of Punjab Limited 93,313 - 10,000 - Hub Power Company Limited 921,600 - 15,195 - Bank of Khyber 207,412 - - 200 Rafhan Maize Products Company Limited - 1,370,000
1,256,725 37,370,000
2018 2017
Rupees Rupees
2018 2017
Rupees Rupees
2018 2017

186
FOR THE YEAR ENDED JUNE 30, 2018
NOTES TO THE CONSOLIDATED FINANCIAL STATEMENTS
23.8 The Group has the following instruments in open ended mutual funds held for trading: No. of Units Cost Carrying value
2018 2017 2018 2017 2018 2017 Statutory Fund PICIC Cash Fund - 4,045 - 421,000 - 406,000 ABL Stock Fund 113,566 47,362 1,667,861 920,000 1,595,555 807,000 NAFA Stock Fund 121,024 61,840 1,905,561 1,118,000 1,769,764 1,003,000 Atlas Stock Market Fund 2,902 - 1,700,000 - 1,801,362 - AKD Islamic Income Fund 995 - 50,000 - 50,532 - AKD Islamic Stock Fund 945 - 50,000 - 44,430 - HBL Energy Fund 124,146 - 1,867,006 - 1,823,056 - MCB Pakistan Stock Market Fund 18,403 7,366 1,811,293 859,000 1,744,775 755,000 Alfalah GHP Stock Fund - 6,108 - 1,028,000 - 958,000 JS Growth Fund - 1,710 - 409,000 - 378,000 MCB Pakistan Sovereign Fund - 6,316 - 350,000 - 336,000 Lakson Income Fund - 9,047 - 948,000 - 911,000 ABL Income Fund - 70,130 - 728,000 - 704,000 Atlas Income Fund - 1,179 - 623,000 - 604,000 Alfalah GHP Income Fund 5,894 4,346 894,358 499,000 789,627 487,000 NAFA Government Securities Liquid Fund - 49,179 - 527,000 - 500,000 Meezan Islamic Fund 1,862 4,939 124,137 421,000 117,898 377,000 Meezan Islamic Income Fund 6,115 11,721 324,096 621,000 327,644 602,000 MCB DCF Income Fund - 3,773 - 418,000 - 402,000 JS Income Fund - 10,935 - 1,097,000 - 1,048,000 AKD Aggressive Income 542,644 - 28,046,960 - 29,056,767 - AKD Opportunity 996,410 - 95,312,797 - 82,558,450 - Askari High Yield Scheme 491,162 - 50,738,889 - 52,493,517 - Alfalah GHP Stock Fund 436,338 - 68,825,590 - 58,455,301 - Faysal Asset Allocation 658,903 - 44,970,103 - 35,488,495 - Faysal Money Market 244,141 - 25,000,000 - 26,027,832 - HBL Cash Fund 260,587 - 26,416,396 - 27,612,672 - UBL Stock Advantage 221,056 - 16,957,212 - 15,144,547 -
366,662,259 10,987,000 336,902,224 10,278,000
24. DUE FROM RELATED PARTIES – unsecured, considered good
Ultimate parent company - TPL Holdings (Private) Limited 24.1 74,100 - Others - Trakker Direct Finance (Private) Limited 790,100 771,300 - TPL E-Ventures (Private) Limited 166,740 - - TPL Logistic (Private) Limited 801,827 778,522 - Trakker Middle Ease (LLC) 3,038,128 - - TPL Rupiya (Private) Limited - 1,697,610 - The Resource Group Pakistan Limited 6,835,653 5,884,572 24.2 11,632,448 9,132,004 11,706,548 9,132,004 24.1 Represents loan financing facility having a limit of Rs. 400 million, carrying mark-up at the variable rate of
3 months KIBOR and is repayable on or before August 31, 2021. As of reporting date, Rs. 399.926 million remained unutilised.
2018 2017
Note Rupees Rupees
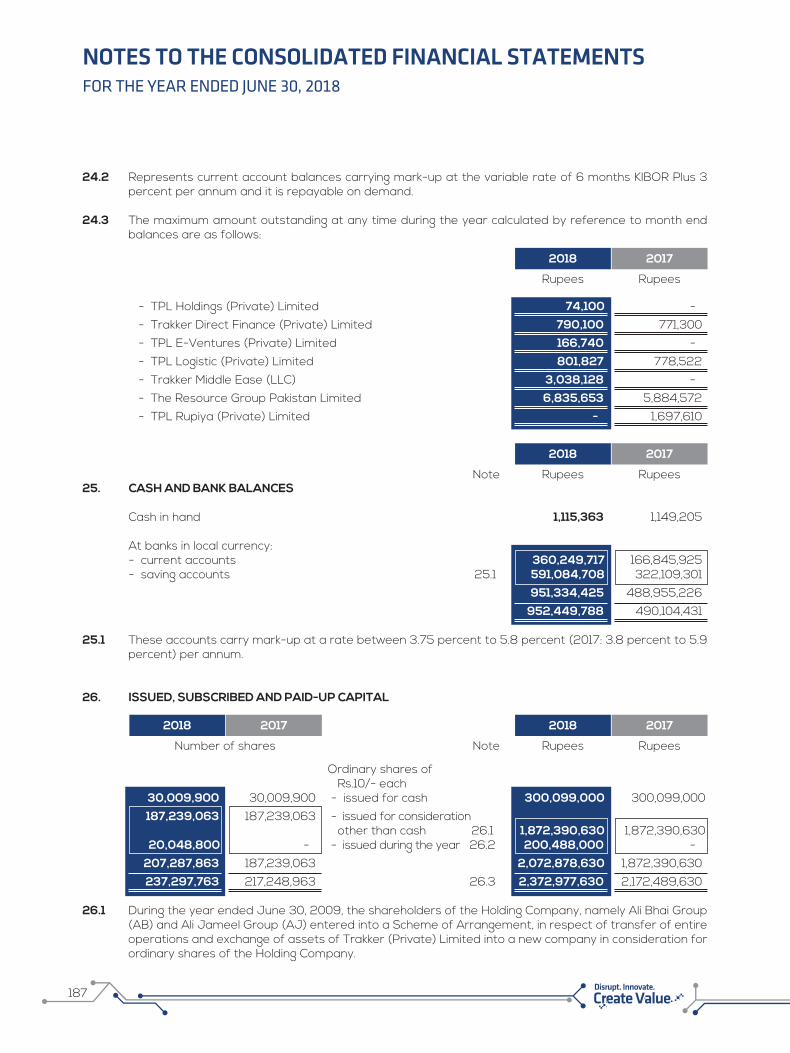
187 Disrupt. Innovate.
24.2 Represents current account balances carrying mark-up at the variable rate of 6 months KIBOR Plus 3 percent per annum and it is repayable on demand.
24.3 The maximum amount outstanding at any time during the year calculated by reference to month end balances are as follows:
- TPL Holdings (Private) Limited 74,100 - - Trakker Direct Finance (Private) Limited 790,100 771,300 - TPL E-Ventures (Private) Limited 166,740 - - TPL Logistic (Private) Limited 801,827 778,522 - Trakker Middle Ease (LLC) 3,038,128 - - The Resource Group Pakistan Limited 6,835,653 5,884,572 - TPL Rupiya (Private) Limited - 1,697,610
25. CASH AND BANK BALANCES Cash in hand 1,115,363 1,149,205 At banks in local currency: - current accounts 360,249,717 166,845,925 - saving accounts 25.1 591,084,708 322,109,301 951,334,425 488,955,226 952,449,788 490,104,431 25.1 These accounts carry mark-up at a rate between 3.75 percent to 5.8 percent (2017: 3.8 percent to 5.9
percent) per annum.
26. ISSUED, SUBSCRIBED AND PAID-UP CAPITAL
Ordinary shares of Rs.10/- each 30,009,900 30,009,900 - issued for cash 300,099,000 300,099,000 187,239,063 187,239,063 - issued for consideration other than cash 26.1 1,872,390,630 1,872,390,630 20,048,800 - - issued during the year 26.2 200,488,000 - 207,287,863 187,239,063 2,072,878,630 1,872,390,630 237,297,763 217,248,963 26.3 2,372,977,630 2,172,489,630 26.1 During the year ended June 30, 2009, the shareholders of the Holding Company, namely Ali Bhai Group
(AB) and Ali Jameel Group (AJ) entered into a Scheme of Arrangement, in respect of transfer of entire operations and exchange of assets of Trakker (Private) Limited into a new company in consideration for ordinary shares of the Holding Company.
FOR THE YEAR ENDED JUNE 30, 2018
NOTES TO THE CONSOLIDATED FINANCIAL STATEMENTS
2018 2017
Rupees Rupees
2018 2017
2018 2017
Note Rupees Rupees
2018 2017
Note Rupees RupeesNumber of shares

188
FOR THE YEAR ENDED JUNE 30, 2018
NOTES TO THE CONSOLIDATED FINANCIAL STATEMENTS
26.2 Represents ordinary shares alloted under the Scheme as disclosed in note 1.6 to these consolidated financial statements, for which legal formalities related to issuance will be completed subsequent to the reporting date.
26.3 These are ordinary shares carry one vote per share and right to dividend.
27. SURPLUS ON REVALUATION OF PROPERTY, PLANT AND EQUIPMENT Opening balance 228,790,596 - Surplus on revaluation of operating fixed assets recognized during the year, net of deferred tax: - Leasehold land 9.1 - 218,875,035 - Building on leasehold land 9.1 - 10,213,454 - 229,088,489 Transfer to unappropriated profi�t on account of incremental depreciation charged for the year, net of deferred tax 729,532 297,893 Closing balance 9.1.4 228,061,064 228,790,596
28. LONG-TERM FINANCING – secured Project finance 28.1 79,800,000 114,843,751 Term finance certificates I 28.2 1,187,703,908 - Term finance certificates II 28.3 2,145,651,829 - Diminishing musharika I 28.4 - 1,865,443,975 Diminishing musharika II 28.5 242,249,222 267,379,788 Diminishing musharika III 28.6 - 11,297,605 Sukuk financing 28.7 600,000,000 600,000,000 4,255,404,959 2,858,965,119 Less: Current portion shown under current liabilities 38 968,277,679 335,422,605 3,287,127,280 2,523,542,514 28.1 The Holding Company had obtained a project financing facility of US Dollars 3.5 million (equivalent to
Rs.367.663 million) for a period of five years from OPIC (a foreign financial institution) through an agreement dated November 27, 2013 to be read with amendment dated March 31, 2014 to the original loan agreement. As of reporting date, the Holding Company has utilised the aforementioned financing facility. The said facility amount is repayable in US Dollars in sixteen equal quarterly installments commencing from September 15, 2014 and ending no later than June 15, 2018 i.e. maturity date. It carries mark up at the rate of 5 year United States Treasury Rate plus 3.75 percent (i.e. 5.12 percent) per annum payable quarterly on 15th of each March, June, September and December after the receipt of first disbursement date i.e. December 24, 2013. The facility is secured against pledge of 35 million ordinary shares owned by TPLH in the Holding Company, guarantees of TPLH of US Dollars 2.70 million and charge on saving account. The Holding Company shall be liable to pay maintenance fee of US Dollars 7,500 per annum in arrears. Under the aforesaid agreement there are certain restrictive payments covenants.
2018 2017
Note Rupees Rupees

189 Disrupt. Innovate.
FOR THE YEAR ENDED JUNE 30, 2018
NOTES TO THE CONSOLIDATED FINANCIAL STATEMENTS
28.2 During the year, the Holding Company has issued privately placed Term Finance Certificates (TFCs) aggregating to Rs.1,200 million having face value of Rs.100,000/- each issued by the Holding Company to various parties for a period of 2 years for the acquisition of further shares of TIL. These carry markup at the rate of 3 months KIBOR plus 1.5 percent per annum and are redeemable in 3 equal installments at the end of 12, 18 and 24 month and are secured by way of pledge of 65.256 million ordinary shares of TIL held by the Holding Company. The Holding Company is liable to pay participation fee at the average rate of 0.5 percent of investment amount to the investors and annual trustee fee of Rs.1 million to trustee under the terms of the contract. The Holding Company has incurred transaction cost of Rs. 19.876 million to issue TFCs.
28.3 During the year, TPLP (the subsidiary company) entered into an agreement with a commercial bank, dated March 14, 2018, for the issuance of Term Finance Certificates (TFCs) of Rs. 3,500 million having face value of Rs. 5,000/- each. Out of the total proposed issuance, the TFCs issued, during the year, and TFCs proposed to be issued, are detailed as follows:
- sum equal to Rs. 2,200 million as a first tranche (Series A TFC Issue) comprising of 440,000 TFCs, issued during the year for the purpose of prepaying the outstanding musharaka facility in the amount of Rs. 1,796 million availed by the TPLP; and for financing construction project of HKC. The amount received against issuance of Series A TFCs is repayable in semi-annual installments for a period of 10 years at the rate of 6 months KIBOR plus 1.25 percent per annum. This facility has been fully drawn during the current year and has been secured against the following:
- First pari pasu charge on present and future fixed assets (plant, machinery, fixtures and fittings, etc.)
- First pari pasu charge charge over land and building with 25 percent margin. - Assignment over rental agreements. - sum equal to Rs. 1,300 million as a second tranche (Series B TFC Issue), proposed to be issued for
the purpose of making an equity investment upcoming new project/development.
28.4 TPLP, (the subsidiary company) entered into the musharaka facility agreement of Rs. 2,400 million with an Islamic bank through an agreement dated May 26, 2015. Out of which TPLP has utilized facility upto Rs. 2,100 million (2017: Rs. 2,100 million) as at reporting date. It carries mark-up at the rate of 6 months KIBOR plus 1.75 percent per annum (2017: 6 months KIBOR plus 1.75 percent), and is repayable semi-annually in arrears over a period of seven years including 1 year grace period. The facility is secured against hypothecation charge over hypothecated fixed and current assets of Rs. 2,800 million (2017: Rs. 2,800 million) and by way of personal and corporate guarantee of Chief Executive and a related party.
28.5 CMS, (the subsidiary company) has obtained a musharika finance facility aggregating Rs. 275 million (2017: Rs. 275 million) from a bank for a period of upto 6.3 years. The loan carries markup at the rate of 6 months KIBOR plus 2 percent (2017: 6 months KIBOR Plus 2 percent) per annum payable semi-annually in arrears and is repayable in 10 equal semi-annual installments of Rs. 27.5 million each latest by September 16, 2022. The first installment will become due after 15 months i.e. on March 16, 2018, from the date of first disbursement date i.e. December 20, 2016. This facility is secured against parri passu charge on present and future plant and machinery, assignment over maintenance agreements, corporate guarantee of TPLP (the subsidiary Company), personal guarantee of a director and equitable mortgage over and land and building of TPLP (the subsidiary Company).
28.6 The Holding Company had obtained diminishing musharaka financing facilities for electrical equipment, IT equipment and vehicles aggregating to Rs. 59.745 million (2017: Rs. 59.745 million) from a commercial bank for a period of 3 years, carrying mark-up at the rate of 6 months KIBOR plus 2 percent (2017: 6 months KIBOR plus 2 percent) per annum subject to half-yearly revision. The musharaka units are to be purchased during the period of 3 years in 36 monthly installments on various dates latest by November 2017 and are secured against first charge of Rs. 66.866 million (2017: Rs. 66.866 million) on electrical equipment, IT equipment and vehicles, ranking hypothecation charge over fixed assets of the Holding Company and personal guarantees of sponsoring directors.

190
FOR THE YEAR ENDED JUNE 30, 2018
NOTES TO THE CONSOLIDATED FINANCIAL STATEMENTS
28.7 The Holding Company had issued Sukuk certificates of Rs. 600 million divided into 600 certificates of Rs. 1 million each for a period of 5 years under an agreement dated April 08, 2016 to be read with amendment agreement for Green Shoe Option dated May 08, 2016. The said certificates are redeemable in 4 equal quarterly installments starting from 14th quarter (i.e. October 2019) and ending no later than April 2021 i.e. redemption date. The rate for rental payment is 1 year KIBOR plus 3 percent per annum payable at the end of each April, July, October and January, after the date of agreement. These certificates are secured against pledge of 55 million (2017: Rs. 55 million) ordinary shares of TPLP, charge by way of hypothecation of Rs. 750 million (2017: Rs. 750 million) (inclusive of 20% margin) over the hypothecated assets in favour of the trustee and a ranking charge ranking subordinate and subservient to the charge in favour of the existing creditors.
29. LIABILITIES AGAINST ASSETS SUBJECT TO FINANCE LEASE
Within one year 3,407,198 3,319,419 12,477,453 11,275,640 After one year but not more than five years 506,251 504,016 11,660,005 10,975,935 Total minimum lease payments 3,913,449 3,823,435 24,137,458 22,251,575 Less: Finance charges (90,014) - 1,885,883 - Present value of minimum 29.1 3,823,435 3,823,435 22,251,575 22,251,575 lease payments Less: Current portion shown under current liabilities 38 3,319,419 3,319,419 11,275,640 11,275,640 504,016 504,016 10,975,935 10,975,935 29.1 Represents obligation in respect of assets acquired under finance lease arrangements from various
financial institutions. Rentals are payable in equal monthly installments. Repairs and insurance costs are to be borne by lessee. Financing rate ranging from 10.48 percent to 12.07 percent (2017: 8.28 percent to 12.07 percent) per annum has been used as discounting factor. Overdue rental payments are subject to additional charge upto 0.1 percent (2017: 0.1 percent) per day. Purchase option can be exercised by the lessee by adjusting security deposit against residual value at the expiry of the lease period.
30. LONG-TERM LOANS Term finance I - 41,666,668 Term finance II 30.1 23,000,000 37,500,000 Term finance III 30.2 100,000,000 - Term finance IV - 9,332,886 Term finance V 30.3 30,555,555 47,222,222 Term finance VI 30.4 52,600,000 - Term finance VII 30.5 139,231,764 200,000,000 Term finance VIII 30.6 200,000,000 100,000,000 Term finance IX 30.7 17,500,000 - 562,887,319 435,721,776 Less: Current portion shown under current liabilities 38 254,753,899 145,444,446 308,133,420 290,277,330
Note
2018 2017
MinimumLease
Payments(MLP)
PresentValue
of MLP
MinimumLease
Payments(MLP)
PresentValue
of MLP
---------------------- (Rupees) ----------------------
2018 2017
Note Rupees Rupees

191 Disrupt. Innovate.
FOR THE YEAR ENDED JUNE 30, 2018
NOTES TO THE CONSOLIDATED FINANCIAL STATEMENTS
30.1 The Holding Company has obtained a term finance facility of Rs. 37.5 million for a period of three years from a commercial bank through an agreement dated January, 26 2017. The loan is repayable in 12 equal quarterly installments of Rs. 3.125 million each. The mark-up on the said facility is 3 months KIBOR plus 2.1 percent (2017: 3 months KIBOR plus 2.1 percent) per annum. The facility is secured against first pari passu charge over current assets to the tune of Rs. 120 million (2017: Rs. 120 million), first charge of an existing properties collateral to the extent of Rs. 216 million (2017: Rs. 216 million) and personal gurantee of all directors.
30.2 During the year, TTL (a related party), has obtained a term finance facility of Rs. 100 million for a period of three years from a commercial bank through an agreement dated November 27, 2017. The loan is repayable in equal quaterly installments of Rs. 8.3 million each from the date of disbursement. The mark-up on the said facility is 3 months KIBOR plus 2.1 percent per annum. The facility would be secured against fisrt pari passu charge over the TTL stock and book debts to the extent of Rs. 144 million with 25 percent margin duly insured in bank's favor covering all risk.
30.3 The Holding Company has obtained a term finance of Rs. 50 million for a period of 3 years from a commercial bank through an agreement dated March 13, 2017. The loan is repayable in 36 equal monthly installments of Rs. 1.8 million each .It carries mark-up at the rate of 1 month KIBOR plus 3 percent (2017: 1 month KIBOR plus 3 percent) per annum and is secured ranking charge by way of hypothecation charge over Holding Company's all present and future books debts and receivables to the extent of Rs. 70 million (2017 Rs. 70 million).
30.4 The Holding Company has obtained a term finance facility of Rs. 70 million for a period of three from a commercial bank through an agreement dated March 02, 2017. The loan is repayable in 36 equal installments of Rs. 1.8 million latest by February 28, 2018. It carries mark-up at the rate of 1 month KIBOR plus 3 percent per annum and is secured against first parri passu hypothecation charge over the Holding Company's book debts of Rs. 100 million, first parri passu hypothecation charge over the fixed assets of the Holding Company of Rs. 70 million and pledge of the shares of TIL and TPLP (related parties), first exclusive charge over shares of Rs. 294 million duly registered with 50 percent margin.
30.5 The Holding Company has obtained a term finance facility of Rs. 200 million for a period of three years from a commercial bank through an agreement dated May, 9 2017. The loan is repayable in 36 equal monthly installments of Rs. 5.556 million each. The mark-up on the said facility is 1 month KIBOR plus 2.5 percent (2017: 1 month KIBOR plus 2.5 percent) per annum. The facility is secured against specific charge of Rs 300 million (2017: 300 million) over tracking devices owned by the Holding Company and assignment of receivables from customers and personal guarantee of all directors of the Holding Company.
30.6 The Holding Company has obtained a term finance facility having limit of Rs. 200 million for a period of two years from a commercial bank through an agreement dated June, 29 2017. The loan is repayable in 4 equal semi-annual installments of Rs. 50 million each from July 1, 2018. The mark-up on the said facility is 3 month KIBOR plus 4 percent (2017: 3 month KIBOR plus 4 percent) per annum and secured against first pari passu charge of Rs. 267 million (2017: Rs. 267 million) over a property located at Shaheed-e-Millat Expressway and personal guarantee of Rs. 267 million (2017: Rs. 267 million) from Cheif Executive of the Holding Company and cross corporate guarantee of Rs. 267 million (2017: Rs. 267 million) from TPLP (related party).
30.7 During the year, TTL (a related party) has obtained a term finance facility of Rs. 35 million for a period of one year from a commercial bank through an agreement dated October 06, 2017 for the purpose of financing / security arrangement for a tender offer announced for acquiring shares of TIL held by the general public and to meet finance capital expenditure requirements related to container tracking. The loan is repayable in 4 equal quarterly installments of Rs. 8.75 million and carries mark-up at the rate of 3 month KIBOR plus 3 percent per annum. The facility is secured against 100 percent lien over TDRs in the name of TIL, cross corporate guarantee of Rs. 50 million from TIL and personal guarantee of Rs. 50 million from a director.
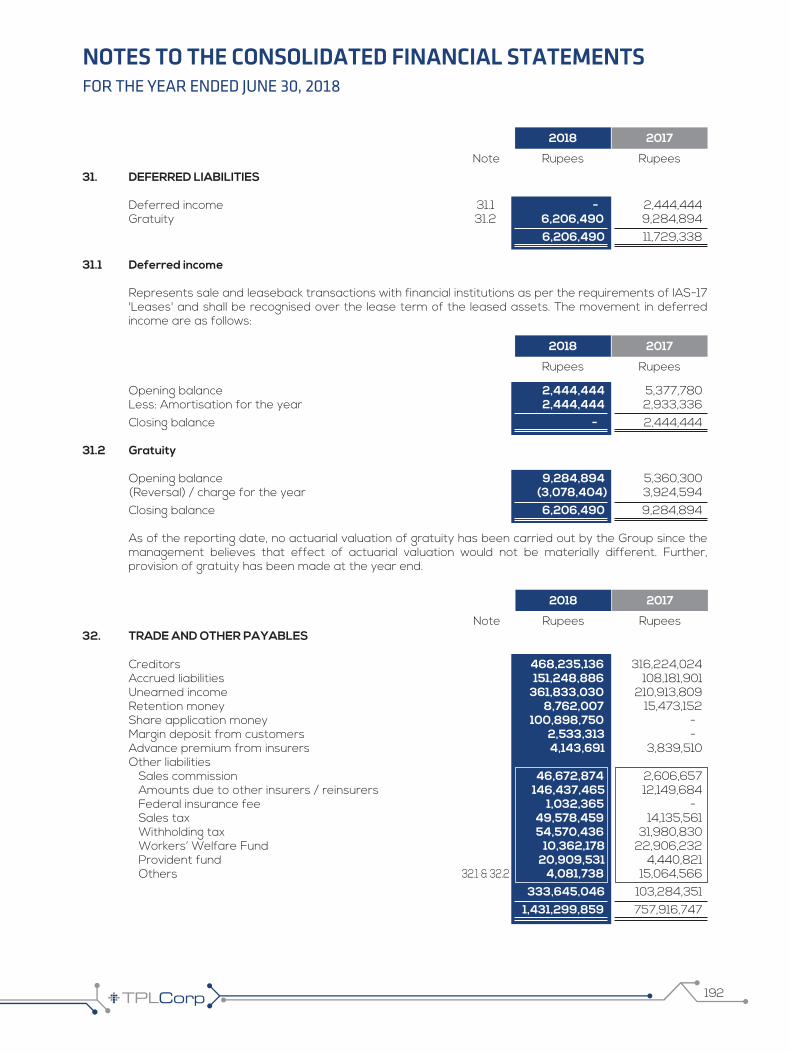
192
FOR THE YEAR ENDED JUNE 30, 2018
NOTES TO THE CONSOLIDATED FINANCIAL STATEMENTS
31. DEFERRED LIABILITIES Deferred income 31.1 - 2,444,444 Gratuity 31.2 6,206,490 9,284,894 6,206,490 11,729,338 31.1 Deferred income Represents sale and leaseback transactions with financial institutions as per the requirements of IAS-17
'Leases' and shall be recognised over the lease term of the leased assets. The movement in deferred income are as follows:
Opening balance 2,444,444 5,377,780 Less: Amortisation for the year 2,444,444 2,933,336 Closing balance - 2,444,444 31.2 Gratuity
Opening balance 9,284,894 5,360,300 (Reversal) / charge for the year (3,078,404) 3,924,594 Closing balance 6,206,490 9,284,894 As of the reporting date, no actuarial valuation of gratuity has been carried out by the Group since the
management believes that effect of actuarial valuation would not be materially different. Further, provision of gratuity has been made at the year end.
32. TRADE AND OTHER PAYABLES Creditors 468,235,136 316,224,024 Accrued liabilities 151,248,886 108,181,901 Unearned income 361,833,030 210,913,809 Retention money 8,762,007 15,473,152 Share application money 100,898,750 - Margin deposit from customers 2,533,313 - Advance premium from insurers 4,143,691 3,839,510 Other liabilities Sales commission 46,672,874 2,606,657 Amounts due to other insurers / reinsurers 146,437,465 12,149,684 Federal insurance fee 1,032,365 - Sales tax 49,578,459 14,135,561 Withholding tax 54,570,436 31,980,830 Workers’ Welfare Fund 10,362,178 22,906,232 Provident fund 20,909,531 4,440,821 Others 32.1 & 32.2 4,081,738 15,064,566 333,645,046 103,284,351 1,431,299,859 757,916,747
2018 2017
Note Rupees Rupees
2018 2017
Rupees Rupees
2018 2017
Note Rupees Rupees

193 Disrupt. Innovate.
FOR THE YEAR ENDED JUNE 30, 2018
NOTES TO THE CONSOLIDATED FINANCIAL STATEMENTS
32.1 Includes stale cheques amounting to Rs.1.647 million (2017: Rs.1.647 million). 32.2 Includes an amount of Rs. Nil (2017: Rs. 24.973 million) received from TIL (an associated company) on
account of rent and maintenance services
33. ACCRUED MARK-UP Long-term financing 28 87,837,457 70,927,589 Long-term loans 30 3,163,361 5,089,202 Due to related parties 2,801,603 9,444,222 Short-term financing 34 16,194,037 8,591,626 Running finance under mark-up arrangement 37 21,606,611 15,901,172 131,603,069 109,953,811 Less: Current portion shown under current liabilities 131,603,069 105,627,379 - 4,326,432
34. SHORT-TERM FINANCING Trust receipts (FATR) 34.1 19,181,204 62,238,722 Musharakah 34.2 400,000,000 - 419,181,204 62,238,722 34.1 Represents FATR and Sight LCs facilities obtained by the Holding Company from various commercial
banks having an aggregate limit of Rs. 210 million (2017: Rs. 310 million). It carries mark-up ranging from 3 month KIBOR plus 2.5 percent to 3.5 percent (2017: 3 month KIBOR plus 2.5 percent to 3.5 percent) per annum and is secured against first pari passu hypothecation charge of Rs. 403 million (2017: Rs. 403 million) over all present and future stocks, book debts and fixed assets excluding land and buildings of the Group with cash margins ranging from 5 percent to 15 percent. As of the reporitng date, Rs. 190 million (2017: Rs. 227 million) remains unutilized.
34.2 During the year, TPLP has entered into a musharakah agreement with an islamic bank to create joint ownership in the Centrepoint Project. Against bank's share of 6.49 percent, the Group received an amount of Rs. 400 million which is repayable through quarterly payments at the rate of 6 months KIBOR plus 1.5 percent, as consideration for use of bank's share by the TPLP. The said periodic payments are secured against equitable interest over the Centrepoint Project.
35. LIABLITIES AGAINST INSURANCE CONTRACTS Provisions against outstanding claims 217,800,693 24,950,923 Insurance liabilities 235,528,000 - 453,328,693 24,950,923
36. UNDERWRITING PROVISIONS Unearned premium reserves 677,709,564 - Unearned reinsurance commission 4,990,140 - Unearned wakala fee 142,033,128 - 824,732,832 -
2018 2017
Note Rupees Rupees
2018 2017
Note Rupees Rupees

194
FOR THE YEAR ENDED JUNE 30, 2018
NOTES TO THE CONSOLIDATED FINANCIAL STATEMENTS
37. RUNNING FINANCE UNDER MARK-UP ARRANGEMENTS
The facilities for short-term running finance are obtained from various commercial banks having aggregate limit of Rs. 912.5 million (2017: Rs. 812.5 million) out of which Rs. 43.077 million (2017: Rs. 60.0 million) was untilised as of the reporting date. These facilities carry markup ranging between 3 months KIBOR plus 1 percent to 2.5 percent (2017: 3 months KIBOR plus 1 percent to 2.5 percent) per annum. These are secured by way of registered hypothecation over stocks and book debts aggregating to Rs.1,093 million (2017: Rs. 1,042 million) and equitable first pari passu charge over property to the extent of Rs. 764 million (2017: Rs. 625 million).
38. CURRENT PORTION OF NON-CURRENT LIABILITIES Long-term financing 28 968,277,679 335,422,605 Liabilities against assets subject to finance lease 29 3,319,419 11,275,640 Long-term loans 30 254,753,899 145,444,446 1,226,350,997 492,142,691
39. DUE TO RELATED PARTIES - unsecured Holding company - TPL Holdings (Private) Limited 39.1 504,988,182 69,344,394 Associated companies - TPL Insurance Limited (TIL) - 18,275,776 - Trakker Middle East LLC. (TME) - 329,586 - 18,605,362 504,988,182 87,949,756 39.1 Represents current account balance with a related party carrying markup at fixed rate of 18 percent per
annum (2017: fixed rate of 18 percent per annum) and are repayable on demand.
40. ADVANCE MONITORING FEES Opening balance 167,561,448 105,281,670 Additions during the year 412,822,816 650,639,953 Less: Transferred to income during the year 42 542,560,159 588,360,175 Closing balance 40.1 37,824,105 167,561,448 40.1 Represents monitoring fee invoiced in advance, which is taken to income as per the appropriate
monitoring period.
41. CONTINGENCIES AND COMMITMENTS 41.1 Contingencies 41.1.1 On September 23, 2017, the TPLP has filed a petition in the High Court of Sindh (SHC) challenging
the vires of Section 5A of Income Tax Ordinance, 2001 introduced through Finance Act, 2017. SHC passed interim order that no coercive action would be taken against the petitioner under the garb of the impugned section, as has been passed in similar other petitions pending adjudication. The matter is in its initial stages and management is confident of a favourable outcome. Accordingly, no provision has been made in these consolidated financial statements.
2018 2017
Note Rupees Rupees
2018 2017
Note Rupees Rupees

195 Disrupt. Innovate.
FOR THE YEAR ENDED JUNE 30, 2018
NOTES TO THE CONSOLIDATED FINANCIAL STATEMENTS
41.1.2 On February, 2018, the Sindh Revenue Board (SRB) has filed an appeal in the Supreme Court of Pakistan (SCP) against the decision of the SHC, whereby, the SHC was pleased to hold that no sales tax is applicable on immovable property where there is no element of services. The appeal is currently pending adjudication.The management is confident of a favorable outcome in this regard, therefore no provision has been made in these consolidated financial statements.
41.1.3 In respect of matter of carry forward of minimum tax paid in the year of loss, the SHC through an order dated May 07, 2013 (now reported as 2013 PTD 420) has held that minimum tax paid in the year of loss is not eligible for adjustment in future years. In the opinion of SHC, only the ‘excess’ of minimum tax over normal tax (which must not be zero) can only be carried forward in future years. Therefore, where there is no tax payable, interalia, due to brought forward tax losses, minimum tax could not be carried forward for adjustment with future tax liability. The matter is currently pending before the SCP for final decision. TIL has adjusted minimum tax of Rs. 10.73 million against its income tax liability in prior years and based on its tax advisor's opinion, is confident that the ultimate outcome in this regard would be favourable. Hence, no provision in this respect has been made in these consolidated financial statements.
41.1.4 Federal Government, through Finance Act 2017, has imposed a tax on undistributed profits at the rate of 7.5% of profit before tax, in case the company does not distribute at least 40% of its profit after tax to its shareholders either through cash dividend or issuance of bonus shares. The legislation requires tax to be paid for tax year 2017 and onwards. In respect of tax year 2017 (financial year 2016), TIL did not make distribution to its shareholders and has filed a constitutional petition in the SHC challenging the tax on undistributed reserves. The constitutional petition is pending in the SHC and the TIL has been granted stay order by the Court. The management believes that based on the opinion of its legal counsel, that outcome of this would be in its favour and accordingly, no provision for taxation on undistributed reserve of Rs. 11.162 million has been made in these consolidated financial statements.
41.1.5 The Group is defending various suits filed against it in various courts in Pakistan for sums, aggregating to Rs. 22.890 million (2017: Rs. 22.890 million), related to its business operations. The legal counsel is confident that these suits are expected to be decided in the favor of the Group and, accordingly, no provision has been made for any liability against these law suits in these consolidated financial statements. Details of these legal cases are given below:
High Court of Sindh
District and Session Court (East)
District and Session Court (West)
Dispute arising on the reimbursement on return of tracking device and un-utilised monitoring charges. Dispute arising due to the non-functionality of tracking device Dispute arising due to the non-functionality of tracking device
April 01, 2011
April 08, 2013
October 29, 2015
Geofizyka Krakow Limited vs TPL Trakker Limited
Muhammad Aziz Khan vs TPL Trakker Limited
Ahmed Shah vs TPL Trakker Limited
Reimbursement of Rs.10.929 million being the price paid for the equipment in respect of returned units and un-utilised monitoring charges
Recovery of Rs. 1.350 million being the cost of the car and Rs.1 million as damages.
Recovery of damages & compensation of Rs.7.010 milion
Court Description Names Relief soughtDate
ofinsitution

196
FOR THE YEAR ENDED JUNE 30, 2018
NOTES TO THE CONSOLIDATED FINANCIAL STATEMENTS
41.1.6 Guarantees issued by banks on behalf of the Holding Company 15,232,250 17,303,620 41.2 Commitments 41.2.1 Letter of credit 19,181,204 20,751,715 41.2.2 Revolving letter of credit 16,854,000 16,854,000 41.2.3 Capital expenditure 41.2.4 12,328,458 10,854,372 41.2.4 Represents TPLP contractual commitments in respect of Centrepoint Project at year end.
41.2.5 Ijarah agreements The Holding Company has entered into various ijarah agreements with Standard Chartered
Modaraba in respect of purchase of vehicles for a period of three years. Ijarah payments due under these agreements are Rs. 98.463 million (2017: Rs. 54.859 million) paybale in monthly installments latest by April 26, 2020. Taxes and repairs are to be borne by the Holding Company, however, major repairs and insurance costs are to be borne by the lessor. These payments are secured against promissory notes in favour of lessor for entire amount of ijarah rentals and security deposit is Rs. 34.435 million (2017: Rs. 29.123 million). Future minimum rentals payable under ijarah agreemetns as at year end are as follows:
Not later than one year 56,218,042 37,785,926 Later than one year but not later than five years 42,244,554 17,072,096 98,462,596 54,858,022 41.2.6 TPLP (a related party), has entered into commercial property leases on its investment property
with tenants. These non-cancellable leases have terms of five years. Future minimum rentals receivable under non-cancellable operating leases as at year end are as follows:
Not later than one year 216,650,910 376,620,867 Later than one year but not later than five years 1,236,256,176 740,412,157 1,452,907,086 11,170,330,247
42. TURNOVER - net Equipment installation and sales 361,272,398 304,723,830 Monitoring fees 40 622,779,302 723,863,357 Rental income 1,108,138,218 876,978,402 Premium 1,172,818,095 121,033,000 Net wakala fee 177,851,801 - Service income: - security 122,148,911 81,081,682 - navigation 105,787,194 107,465,058 - maintenance, electricity and air conditioning 143,446,494 159,178,960 - others 91,693,531 90,729,574 463,076,130 438,455,274 3,905,935,944 2,465,053,863 Less: Sales tax 434,519,840 296,620,000 3,471,416,104 2,168,433,863
2018 2017
Note Rupees Rupees
2018 2017
Note Rupees Rupees
2018 2017
Rupees Rupees

197 Disrupt. Innovate.
FOR THE YEAR ENDED JUNE 30, 2018
NOTES TO THE CONSOLIDATED FINANCIAL STATEMENTS
43. COST OF SALES AND SERVICES Cost of equipment sold Opening stock 17 356,122,525 293,838,894 Purchases 244,877,007 465,793,279 600,999,532 759,632,173 Rental units capitalised (197,107,456) (60,002,966) Closing stock 17 (325,897,495) (356,122,525) 77,994,581 343,506,682 Direct expenses Salaries, wages and other benefits 43.1 501,975,707 338,442,880 Monitoring charges 112,307,257 - Net insurance claims / deficit 560,337,793 - Net insurance commission 129,850,082 - Landscape and plantation 3,584,100 3,227,720 Activation and connection charges 177,920,359 179,728,918 Housekeeping and cleaning 13,525,272 9,971,793 Publicity 30,484,330 - Insurance 21,629,995 18,905,246 Repairs and maintenece 27,198,571 6,446,602 Vehicle running and maintenance 26,392,967 15,706,498 Depreciation 9.1.1 126,481,893 112,512,604 Amortisation 10.3 46,165,989 50,103,602 Printing and stationery 5,928,275 - License renewal fee 4,471,428 3,194,911 Communication 10,969,430 7,145,689 Travelling and conveyance 50,398,154 59,530,802 Utilities 220,468 2,998,133 Rent, rates and taxes 16,113,776 9,686,143 Uniform and liveries 1,056,518 856,335 Computer expenses 3,868,593 5,996,915 Others 11,813,176 742,830 1,882,694,133 825,197,621 1,960,688,714 1,168,704,303 43.1 Includes Rs. 17.743 million (2017: Rs. 8.566 million) in respect of staff retirement benefits (provident fund
contribution).
44. DISTRIBUTION EXPENSES Salaries, wages and other benefits 44.1 99,226,850 85,153,610 Commission 59,798,975 53,235,922 Depreciation 9.1.1 26,045,694 25,307,603 Sales promotion and publicity 70,233,349 22,014,691 Computer expenses 1,146,792 1,923,089 Utilities 29,101 584,433 Postage and courier 6,195,107 6,750,869 Printing and stationery 2,908,630 2,257,612 Communication 2,051,758 2,291,467 Rent, rates and taxes 125,975 2,396,753 Vehicle running and maintenance 6,208,084 5,036,733 Insurance 3,624,501 3,045,545 Travelling and conveyance 4,798,363 4,132,917 Newspapers and periodicals 214,786 115,584 282,607,965 214,246,828
2018 2017
Note Rupees Rupees
2018 2017
Note Rupees Rupees

198
FOR THE YEAR ENDED JUNE 30, 2018
NOTES TO THE CONSOLIDATED FINANCIAL STATEMENTS
44.1 Includes Rs. 3.426 million (2017: Rs. 2.746 million) in respect of staff retirement benefits (provident fund contribution).
45. ADMINISTRATIVE EXPENSES Salaries, wages and other benefits 45.1 372,004,248 175,903,002 Monitoring charges 73,041,517 - Legal and professional 145,154,431 64,062,446 Depreciation 9.1.1 44,909,722 37,723,016 Amortisation 10.3 6,225,133 87,567 Provision for doubtful debts 14,979,058 19,252,497 Utilities 11,138,189 3,478,131 Rent, rates and taxes 11,258,813 13,928,997 Travelling and conveyance 22,398,359 14,230,324 Repairs and maintenance 34,050,060 23,845,452 Security 13,625,421 4,494,440 Vehicle running and maintenance 19,786,147 10,399,031 Computer expenses 11,154,475 2,771,026 Communication 8,203,573 3,555,212 Training 5,122,775 3,419,281 Auditors' remuneration 45.2 18,932,854 11,720,135 Insurance 7,535,297 4,724,062 Entertainment 47,731,751 19,151,181 Printing and stationery 13,915,611 6,094,840 Postage and courier 9,562,685 9,328,730 Donations 45.3 & 45.4 19,624,091 15,063,000 Ijarah rentals 56,103,521 45,485,200 Subscription 16,706,213 3,641,151 Fire, safety and security 1,746,700 - Others 24,229,313 9,146,477
1,009,139,957 501,505,198 45.1 These include Rs. 8.494 million (2017: Rs. 3.693 million) in respect of staff retirement benefits (provident
fund contribution).
45.2 Auditors' remuneration
Audit fees 8,998,060 6,548,800 Half yearly review fee, CCG and other assurance services 8,904,479 4,871,860 Out of pocket expenses 1,030,315 299,475
18,932,854 11,720,135 45.3 Includes Rs. 86,775/- donation given to Panah Trust, where Mr. Jameel Yusuf, a director has interest in
the capacity of Trustee.
2018 2017
Note Rupees Rupees
2018 2017
Rupees Rupees
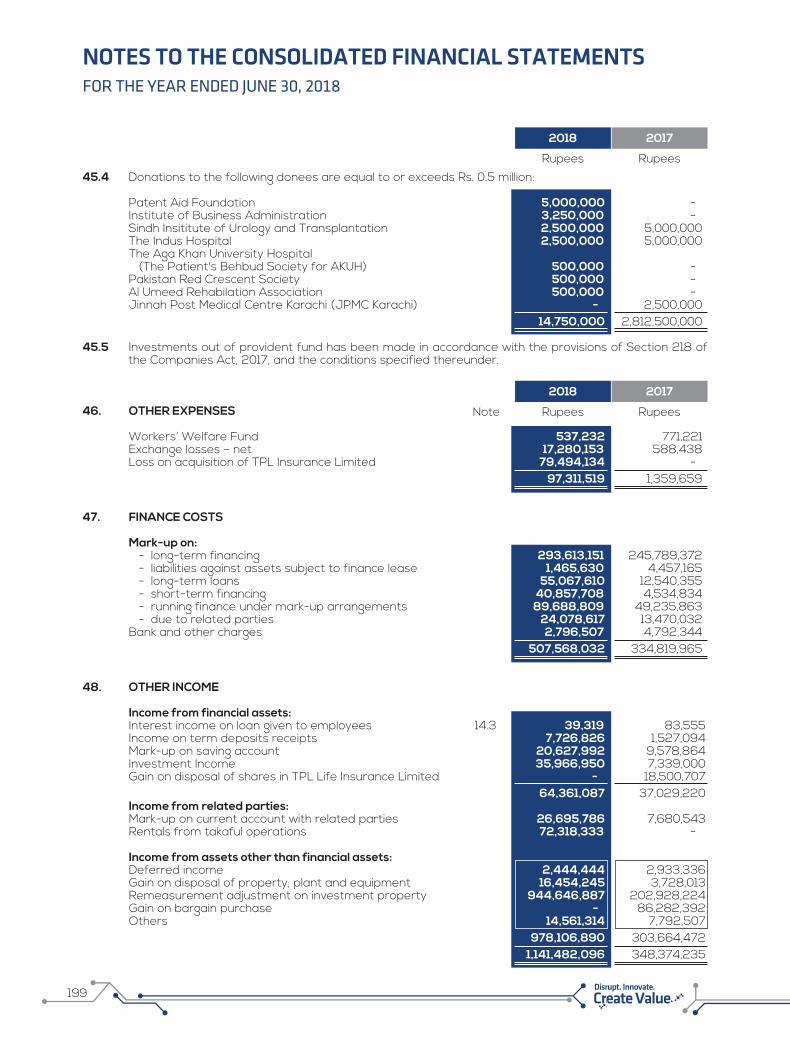
199 Disrupt. Innovate.
FOR THE YEAR ENDED JUNE 30, 2018
NOTES TO THE CONSOLIDATED FINANCIAL STATEMENTS
45.4 Donations to the following donees are equal to or exceeds Rs. 0.5 million: Patent Aid Foundation 5,000,000 - Institute of Business Administration 3,250,000 - Sindh Insititute of Urology and Transplantation 2,500,000 5,000,000 The Indus Hospital 2,500,000 5,000,000 The Aga Khan University Hospital (The Patient's Behbud Society for AKUH) 500,000 - Pakistan Red Crescent Society 500,000 - Al Umeed Rehabilation Association 500,000 - Jinnah Post Medical Centre Karachi (JPMC Karachi) - 2,500,000 14,750,000 2,812,500,000 45.5 Investments out of provident fund has been made in accordance with the provisions of Section 218 of
the Companies Act, 2017, and the conditions specified thereunder.
46. OTHER EXPENSES Workers’ Welfare Fund 537,232 771,221 Exchange losses – net 17,280,153 588,438 Loss on acquisition of TPL Insurance Limited 79,494,134 - 97,311,519 1,359,659
47. FINANCE COSTS Mark-up on: - long-term financing 293,613,151 245,789,372 - liabilities against assets subject to finance lease 1,465,630 4,457,165 - long-term loans 55,067,610 12,540,355 - short-term financing 40,857,708 4,534,834 - running finance under mark-up arrangements 89,688,809 49,235,863 - due to related parties 24,078,617 13,470,032 Bank and other charges 2,796,507 4,792,344 507,568,032 334,819,965
48. OTHER INCOME Income from financial assets: Interest income on loan given to employees 14.3 39,319 83,555 Income on term deposits receipts 7,726,826 1,527,094 Mark-up on saving account 20,627,992 9,578,864 Investment Income 35,966,950 7,339,000 Gain on disposal of shares in TPL Life Insurance Limited - 18,500,707 64,361,087 37,029,220 Income from related parties: Mark-up on current account with related parties 26,695,786 7,680,543 Rentals from takaful operations 72,318,333 - Income from assets other than financial assets: Deferred income 2,444,444 2,933,336 Gain on disposal of property, plant and equipment 16,454,245 3,728,013 Remeasurement adjustment on investment property 944,646,887 202,928,224 Gain on bargain purchase - 86,282,392 Others 14,561,314 7,792,507 978,106,890 303,664,472 1,141,482,096 348,374,235
2018 2017
Rupees Rupees
2018 2017
Note Rupees Rupees
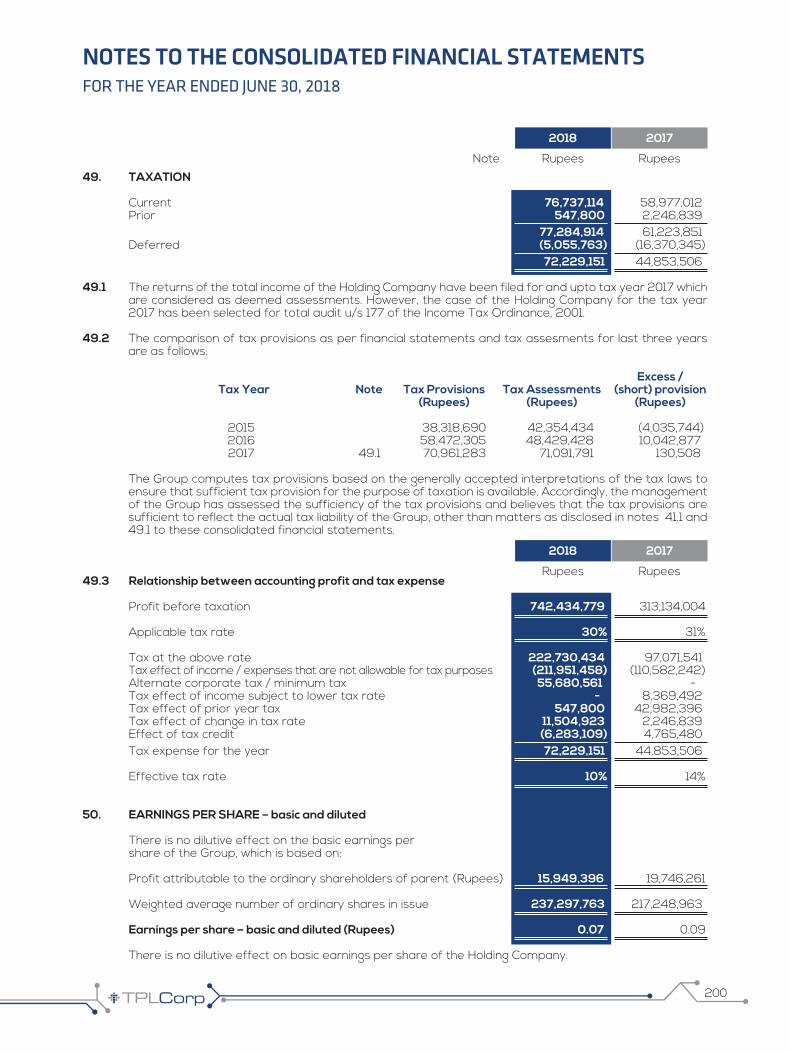
200
FOR THE YEAR ENDED JUNE 30, 2018
NOTES TO THE CONSOLIDATED FINANCIAL STATEMENTS
2018 2017
Note Rupees Rupees
2018 2017
Rupees Rupees
49. TAXATION Current 76,737,114 58,977,012 Prior 547,800 2,246,839 77,284,914 61,223,851 Deferred (5,055,763) (16,370,345) 72,229,151 44,853,506 49.1 The returns of the total income of the Holding Company have been filed for and upto tax year 2017 which
are considered as deemed assessments. However, the case of the Holding Company for the tax year 2017 has been selected for total audit u/s 177 of the Income Tax Ordinance, 2001.
49.2 The comparison of tax provisions as per financial statements and tax assesments for last three years are as follows:
Excess / Tax Year Note Tax Provisions Tax Assessments (short) provision (Rupees) (Rupees) (Rupees) 2015 38,318,690 42,354,434 (4,035,744) 2016 58,472,305 48,429,428 10,042,877 2017 49.1 70,961,283 71,091,791 130,508 The Group computes tax provisions based on the generally accepted interpretations of the tax laws to
ensure that sufficient tax provision for the purpose of taxation is available. Accordingly, the management of the Group has assessed the sufficiency of the tax provisions and believes that the tax provisions are sufficient to reflect the actual tax liability of the Group, other than matters as disclosed in notes 41.1 and 49.1 to these consolidated financial statements.
49.3 Relationship between accounting profit and tax expense Profit before taxation 742,434,779 313,134,004 Applicable tax rate 30% 31% Tax at the above rate 222,730,434 97,071,541 Tax effect of income / expenses that are not allowable for tax purposes (211,951,458) (110,582,242) Alternate corporate tax / minimum tax 55,680,561 - Tax effect of income subject to lower tax rate - 8,369,492 Tax effect of prior year tax 547,800 42,982,396 Tax effect of change in tax rate 11,504,923 2,246,839 Effect of tax credit (6,283,109) 4,765,480 Tax expense for the year 72,229,151 44,853,506 Effective tax rate 10% 14%
50. EARNINGS PER SHARE – basic and diluted There is no dilutive effect on the basic earnings per share of the Group, which is based on: Profit attributable to the ordinary shareholders of parent (Rupees) 15,949,396 19,746,261 Weighted average number of ordinary shares in issue 237,297,763 217,248,963 Earnings per share – basic and diluted (Rupees) 0.07 0.09 There is no dilutive effect on basic earnings per share of the Holding Company.

201 Disrupt. Innovate.
FOR THE YEAR ENDED JUNE 30, 2018
NOTES TO THE CONSOLIDATED FINANCIAL STATEMENTS
51. FINANCIAL RISK MANAGEMENT OBJECTIVES AND POLICIES
The Group finances its operations through equity, borrowings and management of working capital with a view to maintaining and appropriate mix between various sources of finance to minimize risks. Taken as a whole, the Group is exposed to insurance risk, market risk, credit risk, and liquidity risk.
The Board of Directors has the overall responsibility for the establishment and oversight of the Group’s risk management framework. There are Board Committees and Management Committees for developing risk management policies and its monitoring.
No changes were made in the objectives, policies or processes and assumptions during the year ended June 30, 2018. The policies for managing each of these risks are summarised below:
51.1 Market risk Market risk is the risk that the fair value of future cash flows of a financial instrument will fluctuate
because of changes in market prices. Market prices comprise three types of risk: interest rate risk, currency risk and other price risk. The sensitivity analyses in the following sections relate to the position as at June 30, 2018 and 2017.
51.1.1 Interest rate risk Interest rate risk is the risk that the fair value or future cash flows of the financial instruments will
fluctuate because of changes in market interest rates. The Group's exposure to the risk of changes in market interest rates relates primarily to the Group's long-term and short-term financing arrangement and bank balances at floating interest rates to meet its business operations and working capital requirements. The Group manages these mismatches through risk management strategies where significant changes in gap position can be adjusted.
Interest rate sensitivity
The following table demonstrates the sensitivity to a reasonably possible change in interest rates, with all other variables held constant, on the Group’s profit before tax (through impact on floating rate borrowings). There is no direct impact on Group’s equity. This analysis excludes the impact of movement in market variables on the carrying values of provisions and on non-financial assets and liabilities of the Group.
(Increase) / Effect on profit decrease in before tax basis points (Rupees)
2018 +100 (60,833,657) -100 60,833,657 2017 +100 (42,558,968) -100 42,558,968 51.1.2 Currency risk
Currency risk is the risk that the fair value or future cash flows of a financial instrument will fluctuate because of changes in foreign exchange rates. The Group’s exposure to the risk of changes in foreign currency exchange rates risk primarily relates to the Group’s operating activities and borrowings in foreign currencies. The Group manages its foreign currency risk by effective fund management and timely repayment of its foreign currency liabilities. The Group, however, has not hedged its foreign currency liabilities as the management has assessed that it will not be cost beneficial.

202
FOR THE YEAR ENDED JUNE 30, 2018
NOTES TO THE CONSOLIDATED FINANCIAL STATEMENTS
The following table demonstrates the sensitivity to a reasonably possible change in the US Dollar exchange rate. As at June 30, 2018 and 2017, if Pakistani Rupee (Pak Rupee) had weakened / strengthened by 5 percent against the US Dollar, with all other variables held constant, on the Group’s profit before tax (due to changes in the fair value of monetary assets and liabilities) are as follows:
(Increase) / Effect on profit decrease in US before tax Dollar to Pak Rupee (Rupees)
2018 5% (4,117,776) -5% 4,117,776 2017 5% (6,663,858) -5% 6,663,858 51.1.3 Other price risk Other price risk is the risk that the fair value of future cash flows of the financial instruments will
fluctuate because of changes in market prices such as equity price risk.
Equity price risk
Equity price risk is the risk arising from uncertainties about future values of investments securities. The Group manages the price risk through diversification and placing limits on individual and total equity instruments and continuous monitoring of developments in equity market. As of reporting date, the Group is exposed to equity price risk in respect of investment in quoted securities. Change of 10 percent in equity prices will result in change in price of respective equity instruments by Rs. 0.126 million (2017: Rs. 3.370 million).
51.2 Credit risk
51.2.1 Credit risk is the risk that one party to a financial instrument will cause a financial loss for the other party by failing to discharging an obligation. Out of the financial assets of Rs.4,886 million (2017: Rs.2,854 million) the financial assets which are subject to credit risk amounted to Rs.3,213 million (2017: Rs. 2,001 million). The Group’s credit risk is primarily attributable to its trade debts, other receivables, investments, insurance / reinsurance receivables and bank balances. The Group has large number of customers, including corporate and individuals, due to large number and diversity of its customer base, and effective implementation of customers credit policy, concentration of credit risk with respect to trade debts is limited. Further, the Group manages its credit risk by obtaining in advance payment for tracking devices, insurance premium, service charges, rent, and maintenance and other services.
The credit quality of financial assets that are past due but not impaired is disclosed in note 18.4 to these consolidated financial statements. As at the reporting date, there are no financial assets that would otherwise be past due or impaired whose terms have been renegotiated.
51.2.2 The Group monitors the credit policy of its financial assets with reference to historical performance of such assets and available external credit ratings. The carrying values of financial assets which are neither past due nor impaired are as under:

203 Disrupt. Innovate.
FOR THE YEAR ENDED JUNE 30, 2018
NOTES TO THE CONSOLIDATED FINANCIAL STATEMENTS
Loan to employees 14 1,363,439 2,339,598 Long-term deposits 15 69,917,932 45,518,147 Trade debts 18 572,126,854 522,537,915 Trade deposits 20 67,921,906 120,968,564 Interest accrued 21 23,913,319 7,658,694 Other receivables 22 684,474,624 19,448,697 Due from related parties 24 11,706,548 9,132,004 Bank balances 25 951,334,425 488,955,226 2,382,759,047 1,216,558,845
51.2.3 The credit quality of Group’s bank balances can be assessed with reference to external credit ratings as follows:
Bank Balances by short-term Rating Agency rating category
A-1+ PACRA / JCR-VIS 103,218,179 370,447,871 A-1 PACRA / JCR-VIS 84,064,148 243,005 A-2 JCR-VIS 18,610 105,733,138 A2 JCR-VIS 50,473,289 - A1+ PACRA / JCR-VIS 138,115,966 200,530 A1 PACRA / JCR-VIS 414,698,038 12,330,682 A PACRA 239,862 - A+ PACRA / JCR-VIS 1,503,557 - AA- PACRA / JCR-VIS 1,489,709 - A- JCR-VIS 18,775,103 - AA PACRA / JCR-VIS 1,998,312 - AA+ PACRA / JCR-VIS 83,163,743 - BBB JCR-VIS 25,000,000 - AAA PACRA/JCR-VIS 28,575,910 - 951,334,425 488,955,226 51.3 Liquidity risk Liquidity risk represents the risk that the Group will encounter difficulties in meeting obligations with the
financial liabilities. The Group's objective is to maintain a balance between continuity of funding and flexibility through the use of various financing facilities.
The table below summarises the maturity profile of the Group's financial liabilities at June 30, 2018 and 2017 based on contractual undiscounted payment dates and present market interest rates:
June 30, 2018
Long-term financing 79,800,000 99,000,000 1,753,708,280 2,322,896,679 4,255,404,959 Liabilities against assets subject to finance lease 1,938,427 612,881 1,116,511 155,616 3,823,435 Long-term loans 14,111,221 42,333,663 127,000,987 379,441,448 562,887,319 Due to related parties 504,988,182 - - - 504,988,182 Trade and other payables 20,909,539 777,814,388 517,032,502 - 1,315,756,429 Accrued markup 131,603,069 - - - 131,603,069 Running finance under markup arrangements 939,871,844 - - - 939,871,844 Short-term financing - 419,181,204 - - 419,181,204 Liabilities against insurance contracts - 235,528,000 217,800,693 - 453,328,693 Underwriting provisions - 824,732,832 - - 824,732,832
1,693,222,282 2,399,202,968 2,616,658,973 2,702,493,743 8,471,706,122
2018 2017
Note Rupees Rupees
2018 2017
Rupees Rupees
On demand Less than 3 months
3 to 12 months
1 to 5 years
Total
----------------------------------- (Rupees) -----------------------------------
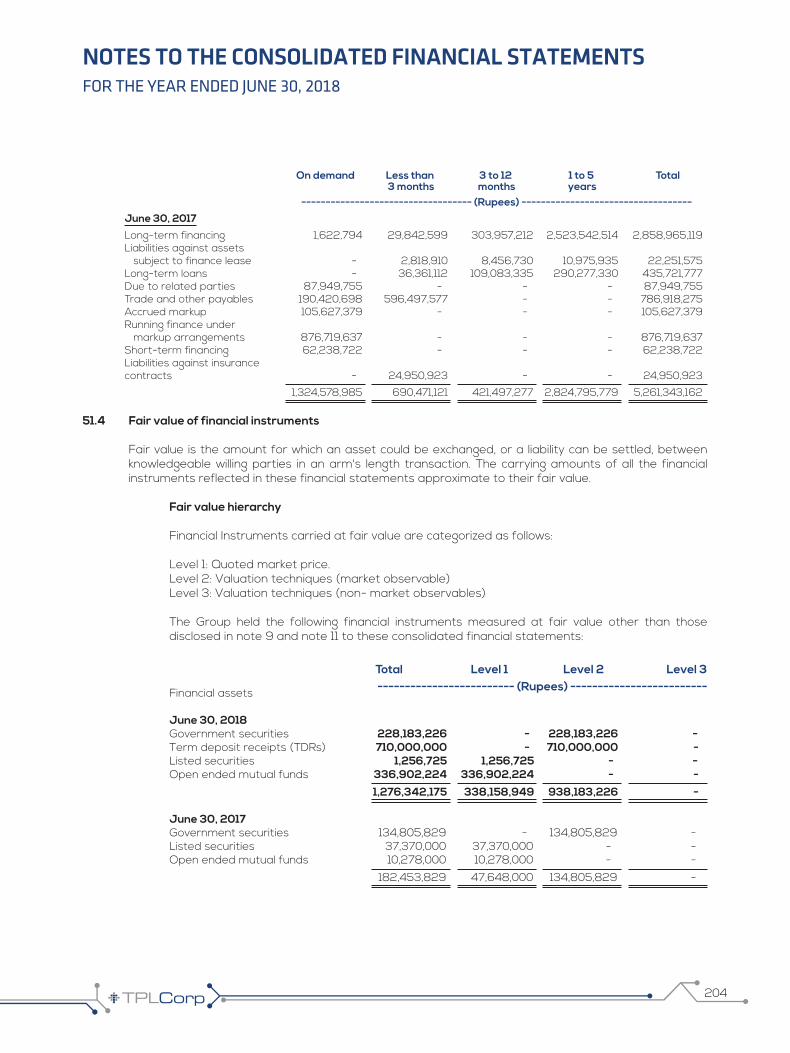
204
FOR THE YEAR ENDED JUNE 30, 2018
NOTES TO THE CONSOLIDATED FINANCIAL STATEMENTS
June 30, 2017
Long-term financing 1,622,794 29,842,599 303,957,212 2,523,542,514 2,858,965,119 Liabilities against assets subject to finance lease - 2,818,910 8,456,730 10,975,935 22,251,575 Long-term loans - 36,361,112 109,083,335 290,277,330 435,721,777 Due to related parties 87,949,755 - - - 87,949,755 Trade and other payables 190,420,698 596,497,577 - - 786,918,275 Accrued markup 105,627,379 - - - 105,627,379 Running finance under markup arrangements 876,719,637 - - - 876,719,637 Short-term financing 62,238,722 - - - 62,238,722 Liabilities against insurance contracts - 24,950,923 - - 24,950,923
1,324,578,985 690,471,121 421,497,277 2,824,795,779 5,261,343,162
51.4 Fair value of financial instruments
Fair value is the amount for which an asset could be exchanged, or a liability can be settled, between knowledgeable willing parties in an arm's length transaction. The carrying amounts of all the financial instruments reflected in these financial statements approximate to their fair value.
Fair value hierarchy Financial Instruments carried at fair value are categorized as follows: Level 1: Quoted market price. Level 2: Valuation techniques (market observable) Level 3: Valuation techniques (non- market observables) The Group held the following financial instruments measured at fair value other than those
disclosed in note 9 and note 11 to these consolidated financial statements:
Financial assets June 30, 2018 Government securities 228,183,226 - 228,183,226 - Term deposit receipts (TDRs) 710,000,000 - 710,000,000 - Listed securities 1,256,725 1,256,725 - - Open ended mutual funds 336,902,224 336,902,224 - -
1,276,342,175 338,158,949 938,183,226 - June 30, 2017 Government securities 134,805,829 - 134,805,829 - Listed securities 37,370,000 37,370,000 - - Open ended mutual funds 10,278,000 10,278,000 - -
182,453,829 47,648,000 134,805,829 -
On demand Less than 3 months
3 to 12 months
1 to 5 years
Total
----------------------------------- (Rupees) -----------------------------------
Total Level 1 Level 2 Level 3------------------------- (Rupees) -------------------------
205 Disrupt. Innovate.
FOR THE YEAR ENDED JUNE 30, 2018
NOTES TO THE CONSOLIDATED FINANCIAL STATEMENTS
51.5 Risk related to insurance business 51.5.1 Insurance risk The risk under any insurance contract is the possibility that the insured event occurs and the
uncertainty of the amount of compensation to the insured. Generally most insurance contracts carry the insurance risk for a period of one year. The Group's major insurance contracts are in respect of motor vehicles through issuance of general insurance contracts relating to motor insurance. For these contracts the most significant risks arise from theft, accidents and terrorist activities.
The Group's risk exposure is mitigated by employing a comprehensive framework to identify,
assess, manage and monitor risk. This framework includes implementation of underwriting strategies which aim to ensure that the underwritten risks are well diversified in terms of type and amount of the risk. Adequate reinsurance is arranged to mitigate the effect of the potential loss to the Group from individual to large or catastrophic insured events. Further, the Group adopts strict claim review policies including active management and prompt pursuing of the claims and regular detailed review of claim handling procedures and frequent investigation of possible false claims to reduce the insurance risk.
51.5.2 Frequency and severity of claims Risk associated with general insurance contracts includes the reasonable possibility of significant
loss as well as the frequent occurrence of the insured events. This has been managed by having in place underwriting strategy, reinsurance arrangements and proactive claim handling procedures. The reinsurance arrangements against major risk exposure include excess of loss, quota share, surplus arrangements and catastrophic coverage. The objective of having such arrangements is to mitigate adverse impacts of severe losses on Group's net retentions.
51.5.3 Uncertainty in the estimation of future claim payments
Claims on motor insurance contracts are payable on a claim occurrence basis. The Group is liable for all insured events that occur during the term of the insurance contracts respectively, including the event reported after the expiry of the insurance contract term.
An estimated amount of the claim is recorded immediately on the intimation to the Group. The estimation of the amount is based on management judgment or preliminary assessment by the independence surveyor appointed for the purpose. The initial estimates include expected settlement cost of the claims. Provision for incurred but not reported (IBNR) is based on the management's best estimate which takes into account expected future patterns of reporting of claims and the claim actually reported subsequent to the reporting date. There are several variable factors which affect the amount and timing of recognized claim liabilities. The Group takes all reasonable measures to mitigate the factors affecting the amount and timing of claim settlements. However, uncertainty prevails with estimated claim liabilities and it is likely that final settlement of these liabilities may be different from initial recognized amount. Outstanding claims are reviewed on a periodic basis.
51.5.4 Key assumptions The process used to determine the assumptions for calculating the outstanding claim reserve is
intended to result in neutral estimates of the most likely or expected income. The nature of the business makes it very difficult to predict with certainty the likely outcome of any particular claim and the ultimate cost of notified claims. Each notified claim is assessed on a separate case to case basis with due regard to the claim circumstances, information available from surveyors and historical evidence of the size of similar claims. Core estimates are reviewed regularly and are updated as and when new information is available.

206
The principal assumption underlying the liability estimation of IBNR and premium deficiency reserves is that the Group's future claim development will follow similar historical pattern for occurrence and reporting. The management uses qualitative judgment to assess the extent to which past occurrence and reporting pattern will not apply in future. The judgment includes external factors e.g. treatment of one-off occurrence claims, changes in market factors, economic conditions, etc. During the year, the Group has not changed its assumptions for the insurance contracts.
51.5.5 Sensitivity analysis
The risks associated with the insurance contracts are complex and subject to a number of variables which complicate quantitative sensitivity analysis. The Group makes various assumptions and techniques based on past claims development experience. This includes indications such as average claims cost, ultimate claims numbers and expected loss ratios. The Group considers that the liability for claims recognized in the statement of financial position is adequate. However, actual experience may differ from the expected outcome.
The claim liabilities are sensitive to the incidence of insured events and severity / size of claims. As the Group enters into short term insurance contracts, it does not assume any significant impact of changes in market conditions on unexpired risks. However, some results of sensitivity testing are set out below, showing the impact on profit before tax net of reinsurance. The impact of 10 percent increase / decrease in incidence of insured events on profit before tax and shareholder's equity is as follows:
Profit before tax Shareholder's equity
Average claim cost Fire and property damage 348,784 - 247,637 - Marine, aviation & transport 556,822 - 395,343 - Motor business 23,917,506 - 16,981,429 - Health 490,055 - 347,939 - Miscellaneous 519,713 - 368,996 -
25,832,880 - 18,341,345 -
51.6 Risk related to insurance business The Group's overall risk management seeks to minimize potential adverse effects on the Group's
financial performance of such risk. The Board of Directors has the overall responsibility for the establishment and oversight of the Group's risk management framework. There are Board Committees and Management Committees for developing risk management policies and its monitoring.
The risks involved with financial instruments and the Group’s approach to managing such risks are discussed below.
51.6.1 Insurance risk
The risk under an insurance contract is the possibility that the insured event occurs and the uncertainty of the amount of the resulting claim. By the very nature of an insurance contract, this risk is random and therefore unpredictable. The principal risk that the Group faces under such contracts is that the occurrence of the insured events and the severity of reported claims. The Group’s risk profile is improved by diversification of these risks of losses to a large portfolio of contracts as a diversified portfolio is less likely to be affected by an unexpected event in single subset.
2018 2017
Rupees Rupees
2018 2017
Rupees Rupees
FOR THE YEAR ENDED JUNE 30, 2018
NOTES TO THE CONSOLIDATED FINANCIAL STATEMENTS

207 Disrupt. Innovate.
FOR THE YEAR ENDED JUNE 30, 2018
NOTES TO THE CONSOLIDATED FINANCIAL STATEMENTS
51.6.2 Individual life unit linked The risk underwritten is mainly death and sometimes disability and/or critical illness. The risk of
death and disability will vary from region to region. The Group may get exposed to poor risks due to unexpected experience in terms of claim severity or frequency. This can be a result of anti-selection, fraudulent claims, a catastrophe or poor persistency. The Group may also face the risk of poor investment return, inflation of business expenses and liquidity issues on monies invested in the fund. The Group faces the risk of under-pricing particularly due to the fact that these contracts are long term. Additionally, the risk of poor persistency may result in the Group being unable to recover expenses incurred at policy acquisition.
The Group manages these risks through its underwriting, reinsurance, claims handling policy and other related controls. The Group has a well defined medical under-writing policy and avoids selling policies to high risk individuals. This puts a check on anti-selection. Profit testing is conducted on an annual basis to ensure reasonableness of premiums charged. Reinsurance contracts have been purchased by the Group to limit the maximum exposure on any one policyholder. To avoid poor persistency the Group applies quality controls on the standard of service provided to policyholders and has placed checks to curb mis-selling and improvement in standard of service provided to the policyholders. For this, a regular monitoring of lapsation rates is conducted. On the claims handling side, the Group has procedures in place to ensure that payment of any fraudulent claims is avoided. For this, claims committee with variable materiality limits review all claims for verification and specific and detailed investigation of all apparently doubtful claims (particularly of high amounts) is conducted. The Group maintains adequate liquidity in each unit fund to cater for potentially sudden and high cash requirement. The Group reserves the right to review the charges deductible under the contracts, thus limiting the risk of under-pricing.
a) Frequency and severity of claims
The Group charges for mortality risk on a monthly basis for all insurance contracts. It has the right to alter these charges based on its mortality experience and hence minimises its exposure to mortality risk. Delays in implementing increases in charges and market or regulatory restraints over the extent of the increases may reduce its mitigating effect. The Group manages these risks through its underwriting strategy and reinsurance arrangements.
b) Sources of uncertainty in the estimation of future benefit payments and premium receipts
Uncertainty in the estimation of future benefit payments and premium receipts for long – term unit linked insurance contracts arises from the unpredictability of long-term changes in overall levels of mortality and variability in policyholder’s behavior.
c) Process used to decide on assumptions
For long-term unit linked insurance contracts, assumptions are made in two stages. At inception of the contract, the Group determines assumptions on future mortality, persistency, administrative expenses and investment returns. At regular intervals, profit testing is conducted on main policies.
d) Changes in assumptions There has been no change in assumptions during the year.

208
FOR THE YEAR ENDED JUNE 30, 2018
NOTES TO THE CONSOLIDATED FINANCIAL STATEMENTS
51.6.3 Group life The main risk written by the Group is mortality. The Group may be exposed to the risk of
unexpected claim severity or frequency. This can be a result of writing business with higher than expected mortality (such as mining or other hazardous industries), writing high cover amounts without adequate underwriting, difficulty of verification of claims, fraudulent claims or a catastrophe. The Group also faces risk such as that of under-pricing to acquire business in a competitive environment and of non-receipt of premium in due time. There also exists a potential risk of asset liability term mismatch due to liabilities being very short term in nature.
The Group manages these risks through underwriting, reinsurance, effective claims handling and other related controls. The Group has a well defined medical under-writing policy and avoids writing business for groups with overly hazardous exposure. Pricing is done in line with the actual experience of the Group. The premium charged takes into account the actual experience of the client and the nature of mortality exposure the group faces. The rates are certified by the appointed actuary for large groups. The Group also maintains an MIS to track the adequacy of the premium charged. Reinsurance contracts have been purchased by the Group to limit the maximum exposure to any life. At the same time, due caution is applied in writing business in areas of high probability of terrorism. The Group ensures writing business with good geographical spread and tries to maintain a controlled exposure to large groups which generally have poor claim experience. Writing business of known hazardous groups is also avoided. On the claims handling side, the Group ensures that payment of any fraudulent claims is avoided. For this, a claims committee reviews all large claims for verification. Strict monitoring is in place in order to keep the outstanding balances of premium at a minimum, especially the ones that are overdue. The bulk of the assets held against liabilities of this line of business have a short duration, thus mitigating the risk of asset value deterioration.
a) Frequency and severity of claims The risk is affected by several factors e.g. age, occupation, benefit structure and life style.
The Group attempts to manage this risk through its underwriting, claims handling and reinsurance policy. Concentration of risk arising from geographical area is not a factor of concern due to spread of risks across various parts of the country.
b) Sources of uncertainty in the estimation of future benefits payments and premium receipts Other than conducting a liability adequacy for Unexpired Risk Reserves (URR), there is no
need to estimate mortality for future years because of the short duration of the contracts.
c) Process used to decide on assumptions
Statistical methods are used to adjust the rates to a best estimate of mortality. Where data is sufficient to be statistically credible, the statistics generated by the data is assigned appropriate credibility factors to account for the group’s experience.
d) Changes in assumptions
There has been no change in assumptions during the year. 51.6.4 Accident and health The main risk written by the Group is morbidity. The Group may be exposed to the risk of
unexpected claim severity or frequency. This can be a result of high exposure in a particular geographical areas, medical expense inflation, fraudulent claims and catastrophic event. The Group potentially faces the risk of lack of adequate claims control (such as for very large groups). The Group also faces a risk of under-pricing to acquire business in a competitive environment and of non-receipt of premium in due time.

209 Disrupt. Innovate.
FOR THE YEAR ENDED JUNE 30, 2018
NOTES TO THE CONSOLIDATED FINANCIAL STATEMENTS
The Group manages these risks through its underwriting, reinsurance, claims handling policy and other related controls. The Group has a well defined medical under-writing policy and avoids writing business for groups with potentially high health related risk exposure such as Government Schemes. Any pre-existing conditions are screened at this stage. Pricing is done as per actual experience of the Group’s portfolio. The premium charged takes into account the actual experience of the client and an MIS is maintained to track the adequacy of the premium charged.
a) Frequency and severity of claims
Group measures risk accumulation in terms of potentially high exposure concentration in a particular geographical area (such as micro insurance policy in northern areas).
b) Sources of uncertainty in the estimation of future benefit payments and premium receipts
Other than conducting a liability adequacy for Unexpired Risk Reserves (URR), there is no need to estimate morbidity for future years because of the short duration of the contracts.
c) Process used to decide on assumptions
An investigation into Group’s experience is performed periodically, and statistical methods are used to adjust the rates to a best estimate of morbidity. Where data is sufficient to be statistically credible, the statistics generated by the data are assigned appropriate credibility factors to account for the group’s experience.
d) Changes in assumptions
There has been no change in assumptions. Reserve risks are controlled by constantly monitoring the provisions for insurance claims that
have been submitted but not yet settled and by amending the provision, if deemed necessary. There are several variable factors that affect the amount and timing of recognized claim liabilities. However the management considers that uncertainty about the amount and timing of claim payments is generally resolved within a year. As the Group enters into short term insurance contracts, it does not assume any significant impact of changes in market conditions on unexpired risks. However, some results of sensitivity testing are set out below:
Change in Impact on claims profit before assumption taxation --------(Rupees in '000)--------
June 30, 2018 Provision for current claims +10% (6,593) -10% 6,593 June 30, 2017 Provision for current claims +10% 2,495 -10% (2,495) 51.7 Capital management The primary objective of the Group’s capital management is to ensure that it maintains healthy capital
ratios in order to support its business sustain future development of the business and maximize shareholders value. No changes were made in the objectives, policies or processes during the year ended June 30, 2018
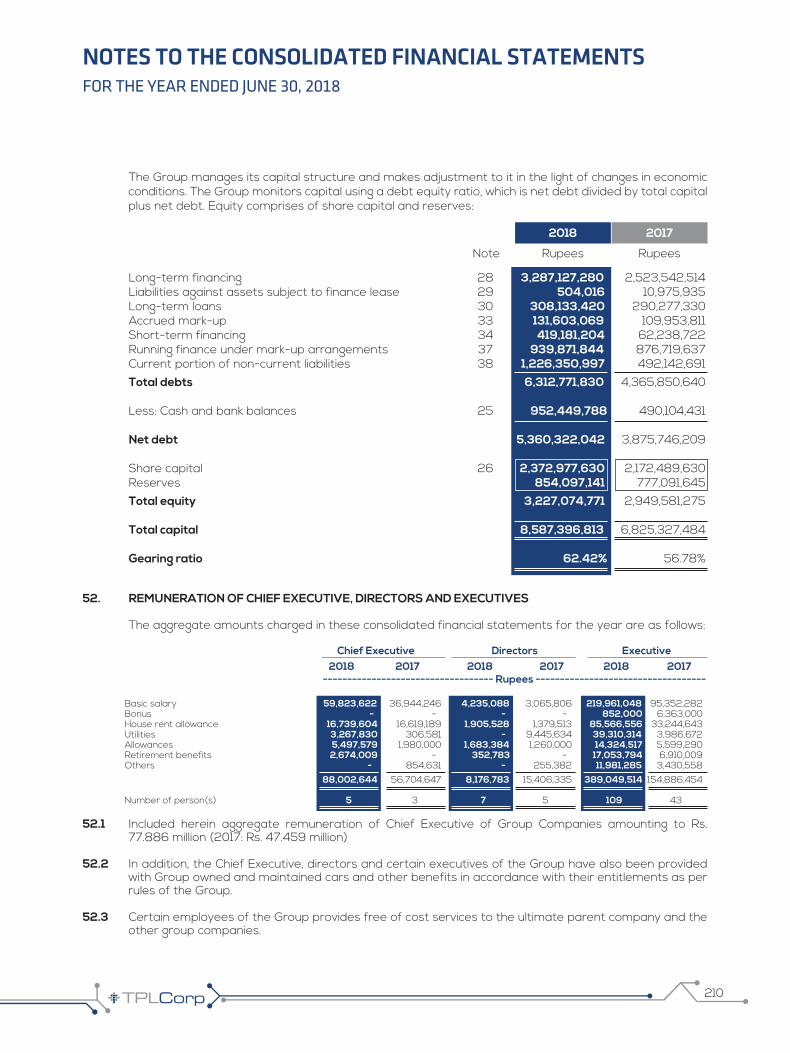
210
FOR THE YEAR ENDED JUNE 30, 2018
NOTES TO THE CONSOLIDATED FINANCIAL STATEMENTS
The Group manages its capital structure and makes adjustment to it in the light of changes in economic conditions. The Group monitors capital using a debt equity ratio, which is net debt divided by total capital plus net debt. Equity comprises of share capital and reserves:
Long-term financing 28 3,287,127,280 2,523,542,514 Liabilities against assets subject to finance lease 29 504,016 10,975,935 Long-term loans 30 308,133,420 290,277,330 Accrued mark-up 33 131,603,069 109,953,811 Short-term financing 34 419,181,204 62,238,722 Running finance under mark-up arrangements 37 939,871,844 876,719,637 Current portion of non-current liabilities 38 1,226,350,997 492,142,691 Total debts 6,312,771,830 4,365,850,640 Less: Cash and bank balances 25 952,449,788 490,104,431 Net debt 5,360,322,042 3,875,746,209 Share capital 26 2,372,977,630 2,172,489,630 Reserves 854,097,141 777,091,645 Total equity 3,227,074,771 2,949,581,275 Total capital 8,587,396,813 6,825,327,484 Gearing ratio 62.42% 56.78%
52. REMUNERATION OF CHIEF EXECUTIVE, DIRECTORS AND EXECUTIVES The aggregate amounts charged in these consolidated financial statements for the year are as follows:
Chief Executive Directors Executive 2018 2017 2018 2017 2018 2017 Basic salary 59,823,622 36,944,246 4,235,088 3,065,806 219,961,048 95,352,282 Bonus - - - - 852,000 6,363,000 House rent allowance 16,739,604 16,619,189 1,905,528 1,379,513 85,566,556 33,244,643 Utilities 3,267,830 306,581 - 9,445,634 39,310,314 3,986,672 Allowances 5,497,579 1,980,000 1,683,384 1,260,000 14,324,517 5,599,290 Retirement benefits 2,674,009 - 352,783 - 17,053,794 6,910,009 Others - 854,631 - 255,382 11,981,285 3,430,558 88,002,644 56,704,647 8,176,783 15,406,335 389,049,514 154,886,454 Number of person(s) 5 3 7 5 109 43
52.1 Included herein aggregate remuneration of Chief Executive of Group Companies amounting to Rs. 77.886 million (2017: Rs. 47.459 million)
52.2 In addition, the Chief Executive, directors and certain executives of the Group have also been provided with Group owned and maintained cars and other benefits in accordance with their entitlements as per rules of the Group.
52.3 Certain employees of the Group provides free of cost services to the ultimate parent company and the other group companies.
2018 2017
Note Rupees Rupees
----------------------------------- Rupees -----------------------------------

211 Disrupt. Innovate.
FOR THE YEAR ENDED JUNE 30, 2018
NOTES TO THE CONSOLIDATED FINANCIAL STATEMENTS
2018 2017
Rupees Rupees
52.4 During the year, the Group has paid Rs. 1.96 million (2017: Rs. 0.24 million) to the non-executive directors on account of board meeting fees.
52.5 The comparative figures have been restated to reflect the changes in the definition of executive as per Companies Act, 2017.
53. TRANSACTIONS WITH RELATED PARTIES
Related parties comprise of ultimate parent company, subsidiaries, associated companies, where directors hold common directorship, key management personnel and their close family members and staff retirement benefit funds. Transactions and balances with related parties other than those disclosed elsewhere in these consolidated financial statements are as follows:
TPL Holdings (Private) Limited – (Ultimate Parent Company) Acquisition of TPLP shares under the Scheme 261,343,762 - Amount received by the Group 58,649,675 395,748,834 Expenses incurred / paid by the Holding Company - 371,245 Expenses incurred / paid by the Group 1,175,620 - Mark-up on current account 14,618,158 4,801,527 Amount paid / repaid by the Holding Company - 190,379,944 Amount paid / repaid by the Group 78,880,831 - Loan received by the Holding Company 445,000,000 - Payment made by TPLP - 580,300,000 Mark-up on loan given to CMS - 851 Advance paid by CMS - 300,000 Mark-up received by the Group 66,558 - Payment made by Group on account of accrued mark-up 12,050,565 -
Trakker Middle East LLC. - (Associated Company) Expenses incurred / paid on behalf of the Holding Company 3,367,713 28,009 TPL Logistics (Private) Limited – (Common directorship) Expenses incurred / paid by the Company - 43,717 Markup on current account - 71,896 Trakker Direct Finance (Private) Limited - (Common directorship) Expenses incurred / paid on behalf of the Company 18,800 13,875 Mark-up on current account 76,642 69,619 The Resource Group of Pakistan Limited - (Common directorship) Expenses incurred / paid by the Holding Company 951,081 - Services rendered by TSS 1,884,000 1,439,500 Amount received by TSS 2,469,500 - Mark-up on current account 592,115 535,769 Virtual World (Private) Limited – (Common directorship) Services received during the year from TIL 8,235,655 1,529,048 Outsourcing expense paid during the year to TIL 5,511,665 83,286 Clifton Land Limited (CLL) – (Common directorship) Loan made - 430,731 Services rendered - 272,000 Payment received - 702,731
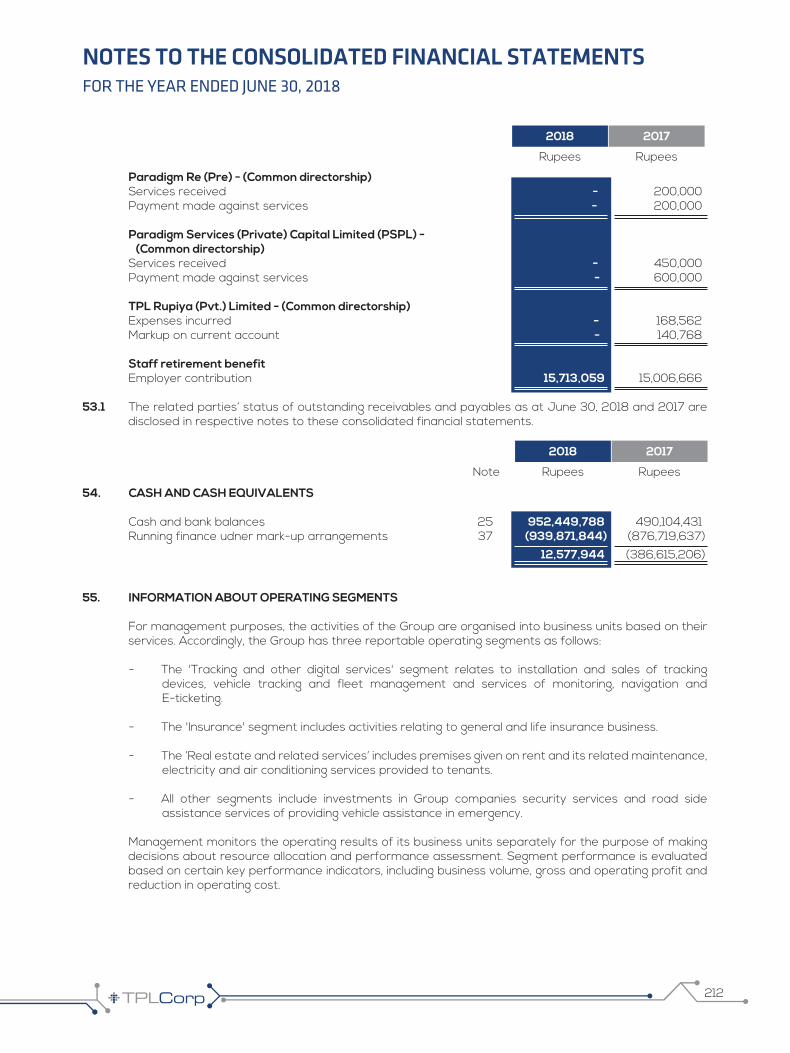
212
FOR THE YEAR ENDED JUNE 30, 2018
NOTES TO THE CONSOLIDATED FINANCIAL STATEMENTS
Paradigm Re (Pre) - (Common directorship) Services received - 200,000 Payment made against services - 200,000 Paradigm Services (Private) Capital Limited (PSPL) - (Common directorship) Services received - 450,000 Payment made against services - 600,000 TPL Rupiya (Pvt.) Limited - (Common directorship) Expenses incurred - 168,562 Markup on current account - 140,768 Staff retirement benefit Employer contribution 15,713,059 15,006,666 53.1 The related parties’ status of outstanding receivables and payables as at June 30, 2018 and 2017 are
disclosed in respective notes to these consolidated financial statements.
54. CASH AND CASH EQUIVALENTS Cash and bank balances 25 952,449,788 490,104,431 Running finance udner mark-up arrangements 37 (939,871,844) (876,719,637) 12,577,944 (386,615,206)
55. INFORMATION ABOUT OPERATING SEGMENTS For management purposes, the activities of the Group are organised into business units based on their
services. Accordingly, the Group has three reportable operating segments as follows:
- The 'Tracking and other digital services' segment relates to installation and sales of tracking devices, vehicle tracking and fleet management and services of monitoring, navigation and E-ticketing.
- The 'Insurance' segment includes activities relating to general and life insurance business.
- The ‘Real estate and related services’ includes premises given on rent and its related maintenance, electricity and air conditioning services provided to tenants.
- All other segments include investments in Group companies security services and road side assistance services of providing vehicle assistance in emergency.
Management monitors the operating results of its business units separately for the purpose of making decisions about resource allocation and performance assessment. Segment performance is evaluated based on certain key performance indicators, including business volume, gross and operating profit and reduction in operating cost.
2018 2017
Rupees Rupees
2018 2017
Note Rupees Rupees
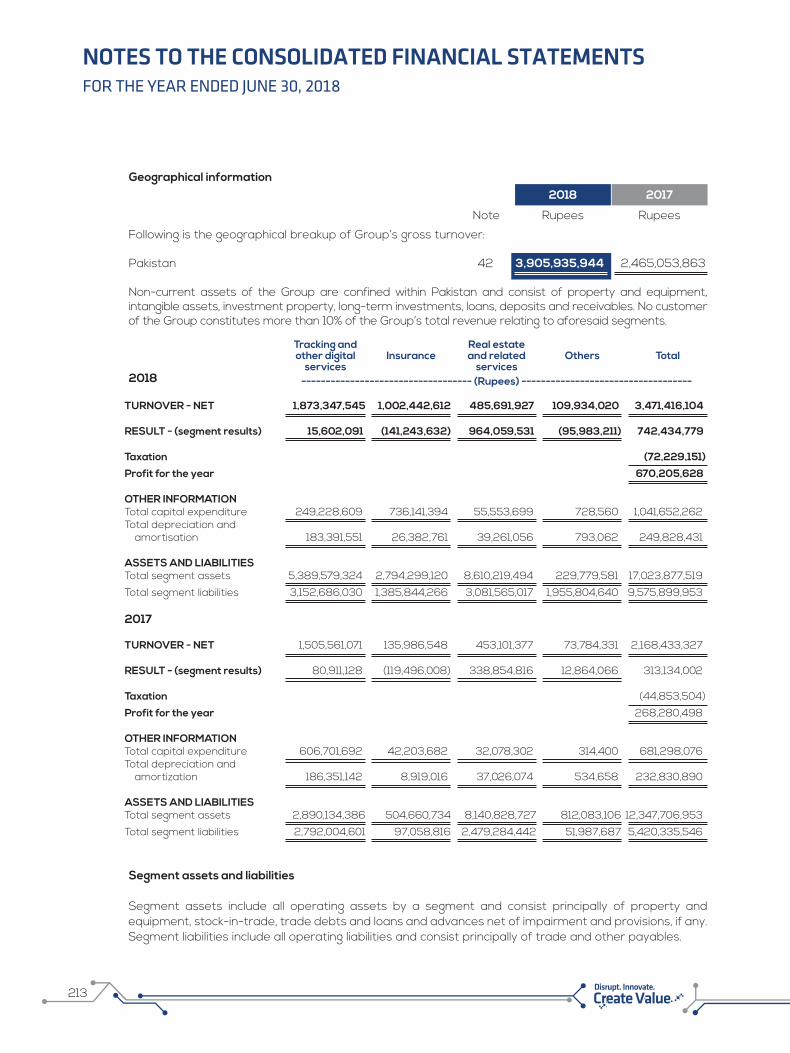
213 Disrupt. Innovate.
FOR THE YEAR ENDED JUNE 30, 2018
NOTES TO THE CONSOLIDATED FINANCIAL STATEMENTS
Geographical information
Following is the geographical breakup of Group’s gross turnover: Pakistan 42 3,905,935,944 2,465,053,863 Non-current assets of the Group are confined within Pakistan and consist of property and equipment,
intangible assets, investment property, long-term investments, loans, deposits and receivables. No customer of the Group constitutes more than 10% of the Group’s total revenue relating to aforesaid segments.
2018
TURNOVER - NET 1,873,347,545 1,002,442,612 485,691,927 109,934,020 3,471,416,104 RESULT - (segment results) 15,602,091 (141,243,632) 964,059,531 (95,983,211) 742,434,779 Taxation (72,229,151)
Profit for the year 670,205,628 OTHER INFORMATION Total capital expenditure 249,228,609 736,141,394 55,553,699 728,560 1,041,652,262 Total depreciation and
amortisation 183,391,551 26,382,761 39,261,056 793,062 249,828,431 ASSETS AND LIABILITIES Total segment assets 5,389,579,324 2,794,299,120 8,610,219,494 229,779,581 17,023,877,519
Total segment liabilities 3,152,686,030 1,385,844,266 3,081,565,017 1,955,804,640 9,575,899,953 2017
TURNOVER - NET 1,505,561,071 135,986,548 453,101,377 73,784,331 2,168,433,327 RESULT - (segment results) 80,911,128 (119,496,008) 338,854,816 12,864,066 313,134,002 Taxation (44,853,504)
Profit for the year 268,280,498 OTHER INFORMATION Total capital expenditure 606,701,692 42,203,682 32,078,302 314,400 681,298,076 Total depreciation and
amortization 186,351,142 8,919,016 37,026,074 534,658 232,830,890 ASSETS AND LIABILITIES Total segment assets 2,890,134,386 504,660,734 8,140,828,727 812,083,106 12,347,706,953
Total segment liabilities 2,792,004,601 97,058,816 2,479,284,442 51,987,687 5,420,335,546
Segment assets and liabilities Segment assets include all operating assets by a segment and consist principally of property and
equipment, stock-in-trade, trade debts and loans and advances net of impairment and provisions, if any. Segment liabilities include all operating liabilities and consist principally of trade and other payables.
2018 2017
Note Rupees Rupees
Tracking andother digital
servicesInsurance
Real estateand related
servicesOthers Total
----------------------------------- (Rupees) -----------------------------------

214
FOR THE YEAR ENDED JUNE 30, 2018
NOTES TO THE CONSOLIDATED FINANCIAL STATEMENTS
56. SUBSEQUENT EVENTS The Board of Directors of the Holding Company in their meeting held on 17th August 2018 have
recommended cash dividend @ Nil percent amounting to Rs. Nil million (2017: Rs. 54.31 million) on the existing paid-up value of the ordinary share capital for approval of the shareholders in the annual general meeting to be held on October 17, 2018.
57. DATE OF AUTHORISATION OF ISSUE These consolidated financial statements were authorised for issue on 17th August 2018 by the Board of
Directors of the Holding Company.
58. CORRESPONDING FIGURES 58.1 Corresponding figures have been rearranged and reclassified, wherever considered necessary, for the
purposes of comparison and to reflect the substance of the transactions. Following major reclassification has been made during the year:
Description Note Reclassified Amount in Rupees
From To
Development property 14.4 Current assets Non-current assets 888,738,740
Rent receivables 18 Other receivables Trade debts 26,555,792
Provisions of outstanding claims 29 Trade and other payable Liabilities against insurance contracts 24,950,923
Unclaimed dividend 29 Trade and other payable Statement of financial possition 1,078,801
Unpaid dividend 29 Trade and other payable Statement of financial possition 3,000,000
59 NUMBER OF EMPLOYEES Number of employees as at June 30, 2018 was 2,017 (2017: 1,602) and average number of employees
during the year was 1,976 (2017: 1,419).
60 GENERAL All figures have been rounded off to the nearest rupee, unless otherwise stated.
Chief Executive Chief Financial Officer Director

NOTICE OF ANNUAL GENERAL MEETING
215 Disrupt. Innovate.
Notice is hereby given that the Annual General Meeting (“AGM”) of TPL Corp Limited (“Company”) will be held on Wednesday October 17, 2018 at 11:00 a.m., at the Auditorium of the Institute of Chartered Accountants of Pakistan (ICAP) at Chartered Accountants Avenue, Clifton, Karachi, to transact following business:
ORDINARY BUSINESS
1. To approve the minutes of the Annual General Meeting held on October 10, 2017.
“RESOLVED THAT the minutes of Annual General Meeting held on October 10, 2017 at 11:00 am of the TPL Corp Limited at the ICAP Auditorium, Clifton, Karachi be and are hereby approved”
2. To receive, consider and adopt the Annual Audited Financial Statements of the Company together with the Directors’, Auditors’ and Chairman’s Review Report thereon for the year ended June 30, 2018.
“RESOLVED THAT the Annual Standalone and Consolidated Audited Financial Statements of TPL Corp Limited, the Directors’, Auditors’ and Chairman’s Review Report thereon for the year ended 30 June 2018 be and are hereby approved.”
3. To appoint Auditors for the year ending June 30, 2019 and fix their remuneration. M/s. EY Ford Rhodes., Chartered Accountants, retire and being eligible have offered themselves for re-appointment.
“RESOLVED THAT M/s EY Ford Rhodes, Chartered Accountants be and is hereby appointed as Auditors of M/s. TPL Corp Limited on the basis of consent received by them, at a fee mutually agreed for the period ending June 30, 2019.
4. To elect Directors of the Company for a three year term. The Board of Directors in the meeting held on August 17, 2018, fixed the number of Directors at (eight) 8 pursuant to the provisions of Section 159 of the Companies Act, 2017. The term of the office of the following eight (8) Directors will expire on October 31, 2018.
i. Mr. Jameel Yusuf S.St.
ii. Mr. Muhammad Ali Jameel
iii. Maj Gen (R) Syed Zafar-Ul-Hasan Naqvi
iv. Mr. Mark Roussaeu
v. Mr. Nadeem Arshad Elahi
vi. Vice Admiral (R) Mohammad Shafi, HI(M)
vii. Bilal Alibhai
viii. Mr. Saad Nissar
The appointment of Directors is subject to the regulatory approval from Securities and Exchange Commission of Pakistan.
Members who wish to contest election should notify Company Secretary of their intention at least fourteen days before the AGM.

216
RESOLVED THAT the shareholders hereby accord their approval for the appointment of Directors on the Board of TPL Corp Limited for a period of three years commencing from November 01, 2018 in accordance with the provisions of Section 159 of the Companies Act, 2017.”
FURTHER RESOLVED THAT the Company Secretary be and is hereby authorized singly to take any and all necessary steps for the appointment of the Director on the Board of TPL Corp Limited and file the requisite returns/notices in the Company Registration Office and / or to the Securities and Exchange Commission of Pakistan and Pakistan Stock Exchange Limited, as the case may be.
SPECIAL BUSINESS
5. To consider and, if thought fit, pass with or without modification, special resolution in terms of Section 199 of the Companies Act 2017, to authorize the Company for renewal of advance of up to Rs. 200 million to the holding company, TPL Holdings (Private) Limited.
RESOLVED THAT pursuant to Section 199 of the Companies Act 2017, the Company be and is hereby authorized to renew of advance up to Rs.200 million to the holding company i.e. TPL Holdings (Private) Limited.
6. To consider and, if thought fit, pass with or without modification, special resolution in terms of Section 199
of the Companies Act 2017, to authorize the Company for renewal of advance up to Rs. 100 million to the associated company, TPL Properties Limited.
RESOLVED THAT pursuant to Section 199 of the Companies Act 2017, the Company be and is hereby authorized to renew advance of up to PKR. 100 Million to TPL Properties Limited.
7. To consider and, if thought fit, pass with or without modification, special resolution in terms of Section 199 of the Companies Act 2017 to authorize the Company to provide equity investment of Rs. 100 million to the associated company, TPL Properties Limited.
RESOLVED THAT pursuant to Section 199 of the Companies Act 2017, the Company be and is hereby authorized to make equity investment up to Rs. 100 million in the associated company i.e TPL Properties Limited.
8. To consider and, if thought fit, pass with or without modification, special resolution in terms of Section 199 of the Companies Act 2017 to authorize the Company for renewal advance upto invest Rs 200 million to the subsidiary company, TPL Rupiya (Private) Limited.
RESOLVED THAT pursuant to Section 199 of the Companies Act 2017 the Company be and is hereby authorized to renew advance up to Rs. 200 million to the subsidiary company i.e. TPL Rupiya (Private) Limited.
9. To consider and, if thought fit, pass with or without modification, special resolution in terms of Section 199 of the Companies Act 2017, to authorize the Company for renewal of advance up to Rs. 150 million to an associated company in UAE.
RESOLVED THAT pursuant to Section 199 of the Companies Act 2017, the Company be and is hereby authorized to renew advance up to Rs. 150 million to an associated company in UAE.

217 Disrupt. Innovate.
10. To consider and, if thought fit, pass with or without modification, special resolution in terms of Section 199 of the Companies Act 2017, to authorize the Company for renewal of advance upto Rs. 200 million to the associated company, TPL E-Ventures (Pvt.) Limited.
RESOLVED THAT pursuant to Section 199 of the Companies Act 2017 the Company be and is hereby authorized to renew advance up to Rs. 200 million to the associated company i.e. TPL E-Ventures (Pvt.) Limited.
11. To consider and, if thought fit, pass with or without modification, special resolution in terms of Section 199 of the Companies Act 2017, to authorize the Company for renewal of upto Rs. 100 million to an associated Company TPL Mobile (Pvt.) Limited
RESOLVED THAT pursuant to Section 199 of the Companies Act 2017, the Company is authorized to renew advance up to Rs. 100 million to the associated company i.e. TPL Mobiles (Pvt.) Limited be and is hereby approved
(A Statement of Material Facts under Section 134(3) of the Companies Act 2017, relating to the aforesaid Special Business to be transacted at the said Annual General Meeting has been dispatched to the shareholders of the Company along with the Annual Report for the year ended 30 June, 2018).
ANY OTHER BUSINESS
To consider any other business with the permission of Chairman.
Danish QaziCompany Secretary Dated: September 26th, 2018
Notes:
1) The Share Transfer Books of the Company will remain closed from October 09, 2018 to October 17, 2018 (both days inclusive).
2) A Member entitled to attend and vote at the AGM is entitled to appoint another person as proxy to attend and vote instead of him. The Proxy Forms, in order to be effective, must be received at the Registrar of the Company M/s THK Associates (Pvt.) Ltd, 1st Floor, 40-C, Block-6, P.E.C.H.S, KARACHI-75400., not less than 48 hours before the Meeting.
3) For identification, CDC account holders should present the participant’s National Identity Card, and CDC Account Number and in case of proxy must enclose an attested copy of his/her CNIC. The representatives of corporate bodies should bring attested copy of Board of Directors Resolution/ Power of Attorney and/or all such documents as are required under Circular No. 1 dated 26 January 2000 issued by the Securities and Exchange Commission of Pakistan for this purpose.

218
4) Members are requested to timely notify any change in their addresses and provide copies of their CNIC /NTN (if not provided earlier) to Bank’s Registrar / Share Transfer Agent, M/s. THK Associates (Pvt.) Limited, 1st Floor, 40-C, Block-6, P.E.C.H.S, Karachi-75400.
5) Election of Directors:
The number of Directors to be elected at the AGM has been fixed by the Board of Directors, at Eight (08) at its meeting held on August 17, 2018. Any person (including a retiring director) who seeks to contest election for directorship of the Company shall file with the Company at its registered office:
i) A Notice of his/her intention to offer himself for election 14 days before the date of the above said AGM, in terms of Section 178(3) of the Companies Act, 2017;
ii) Form 28 (consent to act as Director) prescribed under the Companies Act, 2017;
iii) Detailed profile along with office / residential address
iv) Declaration in respect of the eligibility criteria as set out in the Companies Act 2017 to act as Director of the Company; and
v) Attested copy of valid CNIC and NTN.
6) Procedure for Election of Directors:
According to the Company’s Articles of Association and the Companies Act, 2017, the following procedure is to be followed for nomination and election of Directors:
i. The election of eight (8) Directors will be for a term of three year, commencing from November 01, 2018.
ii. The Directors shall be elected from persons who offer themselves for election and are eligible as per the criteria given in the Companies Act 2017.
iii. Any person wishing to participate in election (including a retiring Director) is required to file with the Company (not later than 14 days before the election date), a notice of his intention to participate in election, along with duly completed and signed Form 28 giving his consent to act as Director of the Company if elected, and certify that he is not ineligible to become a Director.
iv. A person may withdraw his candidature any time before the election is held.
v. If the number of candidates equals the number of vacancies, no voting will take place and all the candidates will be deemed to have been elected.
vi. In case of voting, a Member shall have votes equal to the number of shares held by him multiplied by eight (i.e. the number of Directors to be elected).
vii. A Member may cast vote/s in favour of a single candidate or for as many of the candidates and in such proportion as the Member may choose.

219 Disrupt. Innovate.
viii. The person receiving the highest number of votes will be declared elected, followed by the next highest, and so on, till all the vacancies are filled.
7) The Company shall provide video conference facility to its members for attending the AGM at places other than the town in which general meeting is taking place after considering the geographical dispersal of its members: provided that if members, collectively holding 10% or more shareholding residing at a geographical location, provide their consent to participate in the meeting through video conference at least 10 days prior to date of the meeting, the Company shall arrange video conference facility in that city subject to availability of such facility in that city.
The Company will intimate members regarding venue of video-link facility at least 5 days before the date of the AGM along with complete information necessary to enable them to access the facility.
In this regard, please fill the following form and submit to registered address of the Company 10 days before holding of the AGM:-
8) Members are requested to immediately notify the change, if any, in their registered address/contact numbers to the Share Registrar on the following address:
THK Associates (Pvt.) Limited1st Floor, 40-C, Block-6,P.E.C.H.S,KARACHI-75400.UAN 021-111-000-322.Direct # 021- 34168270Fax # 021- 34168271
I/We, ___________________________ of ___________________________ being a member of TPL
Corp Limited, holder of _________________________________ Ordinary shares as per Register Folio
No.________ hereby opt for video conference facility at ___________________________.
Signature of member

STATEMENT OF MATERIAL FACTS UNDER SECTION 134 (3) OFTHE COMPANIES ACT, 2017 REGARDING SPECIAL BUSINESS
220
Renewal of advance of Rs. 200 Million to TPL Holdings (Private) Limited
TPL Corp Limited (the “Company”) is desirous to renew its advance made to TPL Holdings (Private) Limited. The advance amount was initially approved by the Board of Directors and its renewal approved by the members subsequently to a maximum amount of Rs. 200 million on 10th October 2017. The outstanding balance due to TPL Holdings (Private) Limited as at 30th June 2018 amounts to Rs. 445 million. The renewal of advance has been approved by the Board of Directors of the Company in their meeting held on August 17, 2018.
The information required to be annexed to the Annual General Meeting Notice (“Notice”) by Notification No. S.R.O. 1240(I)/2017 dated December 06, 2017 is set out below::
Name of the associated company orassociated undertaking TPL Holdings (Private) Limited
Basis of relationship Subsidiary
Earnings per share for the last three years 2018: (2.26) , 2017: (12.58), 2016: 5.77of the Associated Company
Break-up value per share, based on latest PKR 339.13 per shareaudited financial statements Financial position of the associated company The extracts of the reviewed balance sheet and profit and loss account of the associated company as at and for the year ended June 30, 2018 is as follows:
Balance Sheet Rupees
Non-current assets 1,472,904,832
Other assets 1,124,702,103
Total Assets 2,597,606,935
Total Liabilities 1,317,596,371
Represented by: Paid up capital 37,744,000
Accumulated Profit 1,242,266,564
Surplus on Revaluation of Fixed Assets -
Equity 1,280,010,564
Profit and Loss
Profit/(Loss) before interest and taxation 60,551,691
Financial charges (62,806,477)
Profit/(Loss) before taxation (2,254,786)
Taxation (6,292,843)
Profit/(Loss) after taxation (8,547,629)
In case of investment in a project of an associated Not applicable.company / undertaking that has not commenced operations, in addition to the information referred to above, the following further information is also required: a) a description of the project and its history since conceptualization; b) starting date and expected date of completion; c) time by which such project shall become commercially operational; d) expected return on total capital employed in the project; and e) funds invested or to be invested by the promoters distinguishing between cash and non-cash amounts;
Maximum amount of investment to be made PKR 200 million
Purpose, benefits likely to accrue to the investing To make investment in subsidiariescompany and its members from such investmentand period of investment; Sources of funds to be utilized for investment and Own sourcewhere the investment is intended to be made usingborrowed funds,- (I) justification for investment through borrowings; (II) detail of collateral, guarantees provided and assets pledged for obtaining such funds; and (III) cost benefit analysis; Salient features of the agreement(s), if any, with Not applicableassociated company or associated undertakingwith regards to the proposed investment;
Direct or indirect, of directors, sponsors, majority Mr. Ali Jameel, Mr. Jameel Yusuf and Mr. Bilal shareholders and their relatives, if any, in the Alibhai are the directors of the Company, andassociated company/undertaking or the TPL Holdings (Pvt.) Limited.transaction under consideration
In case any investment in associated company or Noneassociated undertaking has already been made,the performance review of such investmentincluding complete information/justification for anyimpairment or write offs; and
Any other important details necessary for the Not applicablemembers to understand the transaction; Category-wise amount of investment; Loan repayable on demand
Average borrowing cost of the investing company The average estimated borrowing cost of theor in case of absence of borrowing the KIBOR Company is KIBOR + 3%.(Karachi Inter Bank Offered Rate) for the relevantperiod
Rate of interest, mark up, profit, fees or commission Markup to be charged equivalent to theetc. to be charged by investing company; borrowing cost
Particulars of collateral or security to be obtainedin relation to the proposed investment; Letter of comfort
If the investment carries conversion feature i.e. it is Noneconvertible into securities, this fact along withterms and conditions including conversion formula,circumstances in which the conversion may takeplace and the time when the conversion may beexercisable; and
Repayment schedule and terms and conditions of Noneloans or advances to be given to the associatedcompany or associated undertaking.
Sources of funds from where loans or advances Own sourcewill be given
Where loans or advances are being granted Not applicableusing borrowed funds: a) justification for granting loan or advance out of borrowed funds; b) detail of guarantees / assets pledged for obtaining such funds, if any; and c) repayment schedules of borrowing of the investing company
Particulars of collateral or security to be obtained The loan is unsecured.in relation to the proposed investment;
If the loans or advances carry conversion feature Not applicable.i.e. it is convertible into securities, this factalong with complete detail including conversionformula, circumstances in which the conversionmay take place and the time when the conversionmay be exercisable;
Repayment schedule and terms of loans oradvances to be given to the investee company Repayable on demand.

221 Disrupt. Innovate.
Renewal of advance of Rs. 200 Million to TPL Holdings (Private) Limited
TPL Corp Limited (the “Company”) is desirous to renew its advance made to TPL Holdings (Private) Limited. The advance amount was initially approved by the Board of Directors and its renewal approved by the members subsequently to a maximum amount of Rs. 200 million on 10th October 2017. The outstanding balance due to TPL Holdings (Private) Limited as at 30th June 2018 amounts to Rs. 445 million. The renewal of advance has been approved by the Board of Directors of the Company in their meeting held on August 17, 2018.
The information required to be annexed to the Annual General Meeting Notice (“Notice”) by Notification No. S.R.O. 1240(I)/2017 dated December 06, 2017 is set out below::
Name of the associated company orassociated undertaking TPL Holdings (Private) Limited
Basis of relationship Subsidiary
Earnings per share for the last three years 2018: (2.26) , 2017: (12.58), 2016: 5.77of the Associated Company
Break-up value per share, based on latest PKR 339.13 per shareaudited financial statements Financial position of the associated company The extracts of the reviewed balance sheet and profit and loss account of the associated company as at and for the year ended June 30, 2018 is as follows:
Balance Sheet Rupees
Non-current assets 1,472,904,832
Other assets 1,124,702,103
Total Assets 2,597,606,935
Total Liabilities 1,317,596,371
Represented by: Paid up capital 37,744,000
Accumulated Profit 1,242,266,564
Surplus on Revaluation of Fixed Assets -
Equity 1,280,010,564
Profit and Loss
Profit/(Loss) before interest and taxation 60,551,691
Financial charges (62,806,477)
Profit/(Loss) before taxation (2,254,786)
Taxation (6,292,843)
Profit/(Loss) after taxation (8,547,629)
In case of investment in a project of an associated Not applicable.company / undertaking that has not commenced operations, in addition to the information referred to above, the following further information is also required: a) a description of the project and its history since conceptualization; b) starting date and expected date of completion; c) time by which such project shall become commercially operational; d) expected return on total capital employed in the project; and e) funds invested or to be invested by the promoters distinguishing between cash and non-cash amounts;
Maximum amount of investment to be made PKR 200 million
Purpose, benefits likely to accrue to the investing To make investment in subsidiariescompany and its members from such investmentand period of investment; Sources of funds to be utilized for investment and Own sourcewhere the investment is intended to be made usingborrowed funds,- (I) justification for investment through borrowings; (II) detail of collateral, guarantees provided and assets pledged for obtaining such funds; and (III) cost benefit analysis; Salient features of the agreement(s), if any, with Not applicableassociated company or associated undertakingwith regards to the proposed investment;
Direct or indirect, of directors, sponsors, majority Mr. Ali Jameel, Mr. Jameel Yusuf and Mr. Bilal shareholders and their relatives, if any, in the Alibhai are the directors of the Company, andassociated company/undertaking or the TPL Holdings (Pvt.) Limited.transaction under consideration
In case any investment in associated company or Noneassociated undertaking has already been made,the performance review of such investmentincluding complete information/justification for anyimpairment or write offs; and
Any other important details necessary for the Not applicablemembers to understand the transaction; Category-wise amount of investment; Loan repayable on demand
Average borrowing cost of the investing company The average estimated borrowing cost of theor in case of absence of borrowing the KIBOR Company is KIBOR + 3%.(Karachi Inter Bank Offered Rate) for the relevantperiod
Rate of interest, mark up, profit, fees or commission Markup to be charged equivalent to theetc. to be charged by investing company; borrowing cost
Particulars of collateral or security to be obtainedin relation to the proposed investment; Letter of comfort
If the investment carries conversion feature i.e. it is Noneconvertible into securities, this fact along withterms and conditions including conversion formula,circumstances in which the conversion may takeplace and the time when the conversion may beexercisable; and
Repayment schedule and terms and conditions of Noneloans or advances to be given to the associatedcompany or associated undertaking.
Sources of funds from where loans or advances Own sourcewill be given
Where loans or advances are being granted Not applicableusing borrowed funds: a) justification for granting loan or advance out of borrowed funds; b) detail of guarantees / assets pledged for obtaining such funds, if any; and c) repayment schedules of borrowing of the investing company
Particulars of collateral or security to be obtained The loan is unsecured.in relation to the proposed investment;
If the loans or advances carry conversion feature Not applicable.i.e. it is convertible into securities, this factalong with complete detail including conversionformula, circumstances in which the conversionmay take place and the time when the conversionmay be exercisable;
Repayment schedule and terms of loans oradvances to be given to the investee company Repayable on demand.

222
Renewal of advance of Rs. 200 Million to TPL Holdings (Private) Limited
TPL Corp Limited (the “Company”) is desirous to renew its advance made to TPL Holdings (Private) Limited. The advance amount was initially approved by the Board of Directors and its renewal approved by the members subsequently to a maximum amount of Rs. 200 million on 10th October 2017. The outstanding balance due to TPL Holdings (Private) Limited as at 30th June 2018 amounts to Rs. 445 million. The renewal of advance has been approved by the Board of Directors of the Company in their meeting held on August 17, 2018.
The information required to be annexed to the Annual General Meeting Notice (“Notice”) by Notification No. S.R.O. 1240(I)/2017 dated December 06, 2017 is set out below::
Name of the associated company orassociated undertaking TPL Holdings (Private) Limited
Basis of relationship Subsidiary
Earnings per share for the last three years 2018: (2.26) , 2017: (12.58), 2016: 5.77of the Associated Company
Break-up value per share, based on latest PKR 339.13 per shareaudited financial statements Financial position of the associated company The extracts of the reviewed balance sheet and profit and loss account of the associated company as at and for the year ended June 30, 2018 is as follows:
Balance Sheet Rupees
Non-current assets 1,472,904,832
Other assets 1,124,702,103
Total Assets 2,597,606,935
Total Liabilities 1,317,596,371
Represented by: Paid up capital 37,744,000
Accumulated Profit 1,242,266,564
Surplus on Revaluation of Fixed Assets -
Equity 1,280,010,564
Profit and Loss
Profit/(Loss) before interest and taxation 60,551,691
Financial charges (62,806,477)
Profit/(Loss) before taxation (2,254,786)
Taxation (6,292,843)
Profit/(Loss) after taxation (8,547,629)
In case of investment in a project of an associated Not applicable.company / undertaking that has not commenced operations, in addition to the information referred to above, the following further information is also required: a) a description of the project and its history since conceptualization; b) starting date and expected date of completion; c) time by which such project shall become commercially operational; d) expected return on total capital employed in the project; and e) funds invested or to be invested by the promoters distinguishing between cash and non-cash amounts;
Maximum amount of investment to be made PKR 200 million
Purpose, benefits likely to accrue to the investing To make investment in subsidiariescompany and its members from such investmentand period of investment; Sources of funds to be utilized for investment and Own sourcewhere the investment is intended to be made usingborrowed funds,- (I) justification for investment through borrowings; (II) detail of collateral, guarantees provided and assets pledged for obtaining such funds; and (III) cost benefit analysis; Salient features of the agreement(s), if any, with Not applicableassociated company or associated undertakingwith regards to the proposed investment;
Direct or indirect, of directors, sponsors, majority Mr. Ali Jameel, Mr. Jameel Yusuf and Mr. Bilal shareholders and their relatives, if any, in the Alibhai are the directors of the Company, andassociated company/undertaking or the TPL Holdings (Pvt.) Limited.transaction under consideration
In case any investment in associated company or Noneassociated undertaking has already been made,the performance review of such investmentincluding complete information/justification for anyimpairment or write offs; and
Any other important details necessary for the Not applicablemembers to understand the transaction; Category-wise amount of investment; Loan repayable on demand
Average borrowing cost of the investing company The average estimated borrowing cost of theor in case of absence of borrowing the KIBOR Company is KIBOR + 3%.(Karachi Inter Bank Offered Rate) for the relevantperiod
Rate of interest, mark up, profit, fees or commission Markup to be charged equivalent to theetc. to be charged by investing company; borrowing cost
Particulars of collateral or security to be obtainedin relation to the proposed investment; Letter of comfort
If the investment carries conversion feature i.e. it is Noneconvertible into securities, this fact along withterms and conditions including conversion formula,circumstances in which the conversion may takeplace and the time when the conversion may beexercisable; and
Repayment schedule and terms and conditions of Noneloans or advances to be given to the associatedcompany or associated undertaking.
Sources of funds from where loans or advances Own sourcewill be given
Where loans or advances are being granted Not applicableusing borrowed funds: a) justification for granting loan or advance out of borrowed funds; b) detail of guarantees / assets pledged for obtaining such funds, if any; and c) repayment schedules of borrowing of the investing company
Particulars of collateral or security to be obtained The loan is unsecured.in relation to the proposed investment;
If the loans or advances carry conversion feature Not applicable.i.e. it is convertible into securities, this factalong with complete detail including conversionformula, circumstances in which the conversionmay take place and the time when the conversionmay be exercisable;
Repayment schedule and terms of loans oradvances to be given to the investee company Repayable on demand.
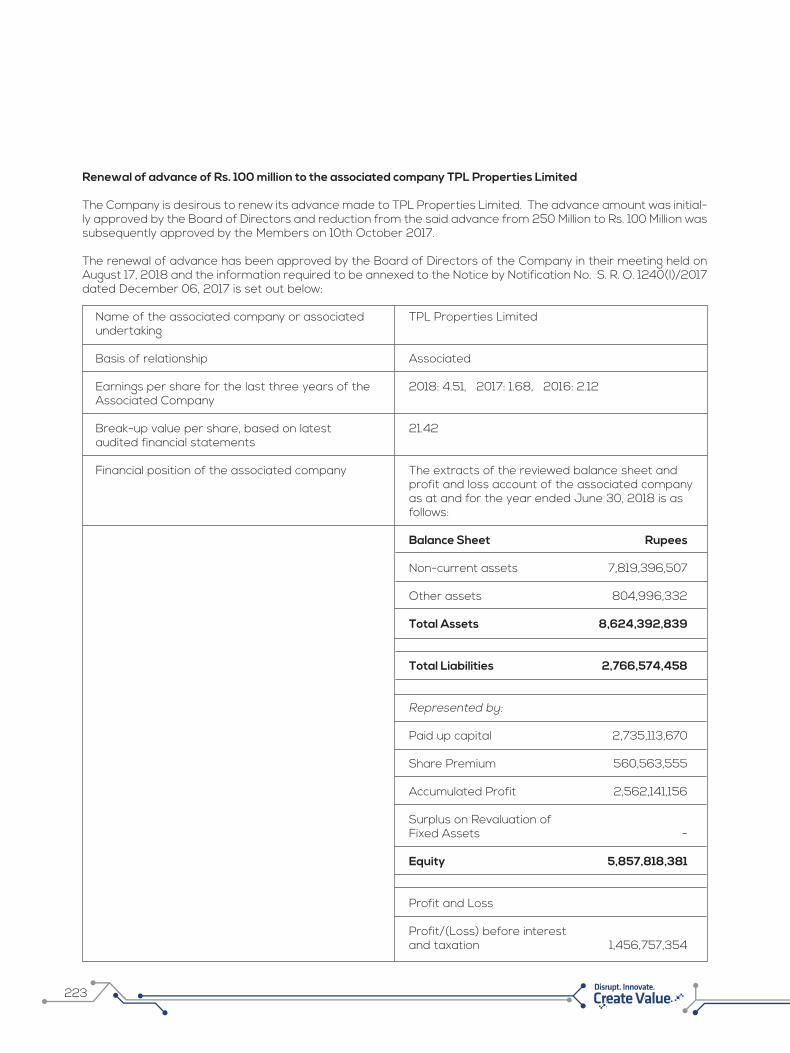
223 Disrupt. Innovate.
Renewal of advance of Rs. 100 million to the associated company TPL Properties Limited
The Company is desirous to renew its advance made to TPL Properties Limited. The advance amount was initial-ly approved by the Board of Directors and reduction from the said advance from 250 Million to Rs. 100 Million was subsequently approved by the Members on 10th October 2017.
The renewal of advance has been approved by the Board of Directors of the Company in their meeting held on August 17, 2018 and the information required to be annexed to the Notice by Notification No. S. R. O. 1240(I)/2017 dated December 06, 2017 is set out below:
Name of the associated company or associated TPL Properties Limitedundertaking
Basis of relationship Associated
Earnings per share for the last three years of the 2018: 4.51, 2017: 1.68, 2016: 2.12Associated Company Break-up value per share, based on latest 21.42audited financial statements Financial position of the associated company The extracts of the reviewed balance sheet and profit and loss account of the associated company as at and for the year ended June 30, 2018 is as follows:
Balance Sheet Rupees
Non-current assets 7,819,396,507
Other assets 804,996,332
Total Assets 8,624,392,839
Total Liabilities 2,766,574,458
Represented by: Paid up capital 2,735,113,670
Share Premium 560,563,555
Accumulated Profit 2,562,141,156
Surplus on Revaluation of Fixed Assets -
Equity 5,857,818,381
Profit and Loss Profit/(Loss) before interest and taxation 1,456,757,354
Financial charges (207,664,482)
Profit/(Loss) before taxation 1,249,092,872
Taxation (14,463,127)
Profit/(Loss) after taxation 1,234,629,745
In case of investment in a project of an associated Not applicable.company / undertaking that has not commencedoperations, in addition to the information referredto above, the following further information is alsorequired: a) a description of the project and its history since conceptualization; b) starting date and expected date of completion; c) time by which such project shall become commercially operational; d) expected return on total capital employed in the project; and e) funds invested or to be invested by the promoters distinguishing between cash and non-cash amounts;
Maximum amount of investment to be made PKR 100 million Purpose, benefits likely to accrue to the investing To make investment in subsidiariescompany and its members from such investmentand period of investment; Sources of funds to be utilized for investment and Own sourceswhere the investment is intended to be madeusing borrowed funds,- (I) justification for investment through borrowings; (II) detail of collateral, guarantees provided and assets pledged for obtaining such funds; and (III) cost benefit analysis;
Salient features of the agreement(s), if any, with Noneassociated company or associated undertaking withregards to the proposed investment;
Direct or indirect, of directors, sponsors, majority Mr. Ali Jameel, Mr. Jameel Yusuf and Mr. Bilal shareholders and their relatives, if any, in the Alibhai, Mr. Zafar Naqvi, Mr. Muhammad Shafi areassociated company/undertaking or the transaction the directors of the company, are also theunder consideration directors of TPL Properties Limited.
In case any investment in associated company or Noneassociated undertaking has already been made,the performance review of such investmentincluding complete information/justification for anyimpairment or write offs; and

224
Renewal of advance of Rs. 100 million to the associated company TPL Properties Limited
The Company is desirous to renew its advance made to TPL Properties Limited. The advance amount was initial-ly approved by the Board of Directors and reduction from the said advance from 250 Million to Rs. 100 Million was subsequently approved by the Members on 10th October 2017.
The renewal of advance has been approved by the Board of Directors of the Company in their meeting held on August 17, 2018 and the information required to be annexed to the Notice by Notification No. S. R. O. 1240(I)/2017 dated December 06, 2017 is set out below:
Name of the associated company or associated TPL Properties Limitedundertaking
Basis of relationship Associated
Earnings per share for the last three years of the 2018: 4.51, 2017: 1.68, 2016: 2.12Associated Company Break-up value per share, based on latest 21.42audited financial statements Financial position of the associated company The extracts of the reviewed balance sheet and profit and loss account of the associated company as at and for the year ended June 30, 2018 is as follows:
Balance Sheet Rupees
Non-current assets 7,819,396,507
Other assets 804,996,332
Total Assets 8,624,392,839
Total Liabilities 2,766,574,458
Represented by: Paid up capital 2,735,113,670
Share Premium 560,563,555
Accumulated Profit 2,562,141,156
Surplus on Revaluation of Fixed Assets -
Equity 5,857,818,381
Profit and Loss Profit/(Loss) before interest and taxation 1,456,757,354
Financial charges (207,664,482)
Profit/(Loss) before taxation 1,249,092,872
Taxation (14,463,127)
Profit/(Loss) after taxation 1,234,629,745
In case of investment in a project of an associated Not applicable.company / undertaking that has not commencedoperations, in addition to the information referredto above, the following further information is alsorequired: a) a description of the project and its history since conceptualization; b) starting date and expected date of completion; c) time by which such project shall become commercially operational; d) expected return on total capital employed in the project; and e) funds invested or to be invested by the promoters distinguishing between cash and non-cash amounts;
Maximum amount of investment to be made PKR 100 million Purpose, benefits likely to accrue to the investing To make investment in subsidiariescompany and its members from such investmentand period of investment; Sources of funds to be utilized for investment and Own sourceswhere the investment is intended to be madeusing borrowed funds,- (I) justification for investment through borrowings; (II) detail of collateral, guarantees provided and assets pledged for obtaining such funds; and (III) cost benefit analysis;
Salient features of the agreement(s), if any, with Noneassociated company or associated undertaking withregards to the proposed investment;
Direct or indirect, of directors, sponsors, majority Mr. Ali Jameel, Mr. Jameel Yusuf and Mr. Bilal shareholders and their relatives, if any, in the Alibhai, Mr. Zafar Naqvi, Mr. Muhammad Shafi areassociated company/undertaking or the transaction the directors of the company, are also theunder consideration directors of TPL Properties Limited.
In case any investment in associated company or Noneassociated undertaking has already been made,the performance review of such investmentincluding complete information/justification for anyimpairment or write offs; and
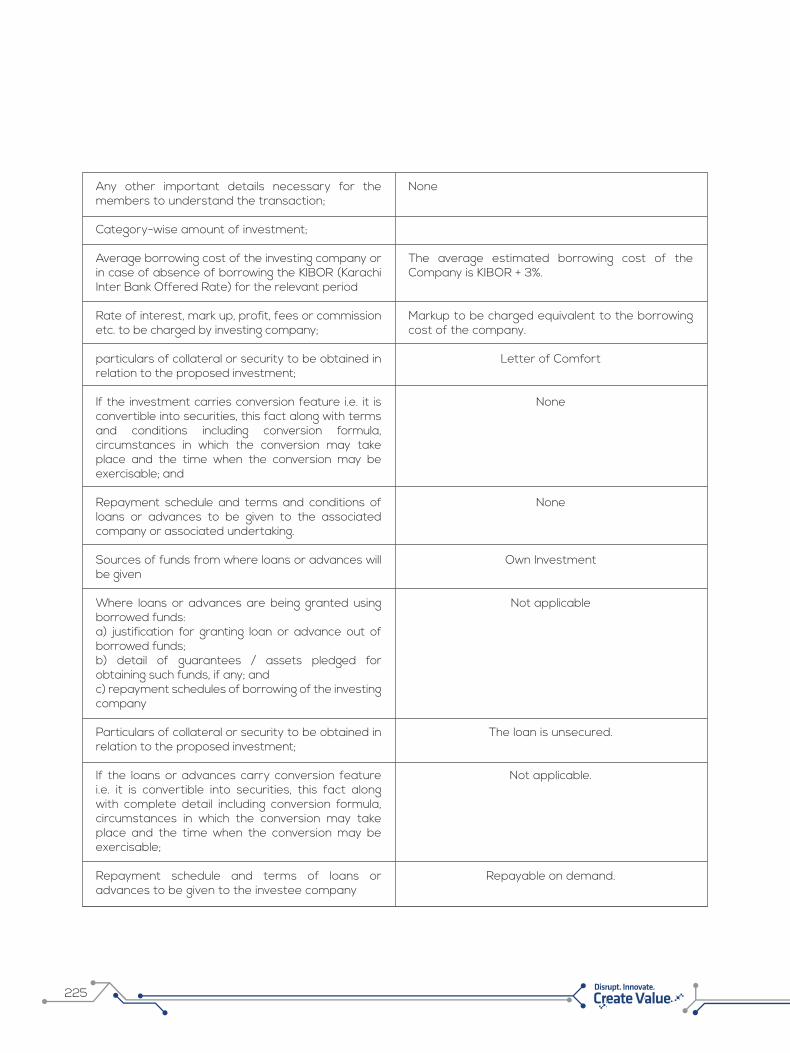
225 Disrupt. Innovate.
Any other important details necessary for the members to understand the transaction;
Category-wise amount of investment;
Average borrowing cost of the investing company or in case of absence of borrowing the KIBOR (Karachi Inter Bank Offered Rate) for the relevant period
Rate of interest, mark up, profit, fees or commission etc. to be charged by investing company;
particulars of collateral or security to be obtained in relation to the proposed investment;
If the investment carries conversion feature i.e. it is convertible into securities, this fact along with terms and conditions including conversion formula, circumstances in which the conversion may take place and the time when the conversion may be exercisable; and
Repayment schedule and terms and conditions of loans or advances to be given to the associated company or associated undertaking.
Sources of funds from where loans or advances will be given
Where loans or advances are being granted using borrowed funds: a) justification for granting loan or advance out of borrowed funds; b) detail of guarantees / assets pledged for obtaining such funds, if any; and c) repayment schedules of borrowing of the investing company
Particulars of collateral or security to be obtained in relation to the proposed investment; If the loans or advances carry conversion feature i.e. it is convertible into securities, this fact along with complete detail including conversion formula, circumstances in which the conversion may take place and the time when the conversion may be exercisable;
Repayment schedule and terms of loans or advances to be given to the investee company
None
The average estimated borrowing cost of the Company is KIBOR + 3%.
Markup to be charged equivalent to the borrowing cost of the company.
Letter of Comfort
None
None
Own Investment
Not applicable
The loan is unsecured.
Not applicable.
Repayable on demand.

226
To provide equity investment of Rs. 100 million to the associated company TPL Properties Limited.
TPL the Company is desirous make equity investment in TPL Properties Limited. The equity investment to a maximum amount of Rs. 100 Million has been approved by the Board of Directors of the Company in their meeting held on August 17, 2018.
The information required to be annexed to the Notice by Notification No. S. R. O. 1240(I)/2017 dated December 06, 2017 is set out below:
Name of the associated company or associated undertaking
Basis of relationship
Earnings per share for the last three years of the Associated Company
Break-up value per share, based on latest audited financial statements
Financial position of the associated company
TPL Properties Limited
Associated
2018: 4.51, 2017: 1.68, 2016: 2.12
21.42
The extracts of the reviewed balance sheet and profit and loss account of the associated company as at and for the year ended June 30, 2018 is as follows:
Balance Sheet Rupees
Non-current assets 7,819,396,507
Other assets 804,996,332
Total Assets 8,624,392,839
Total Liabilities 2,766,574,458
Represented by:
Paid up capital 2,735,113,670
Capital Reserve 560,563,555
Accumulated Profit 2,562,141,156
Surplus on Revaluation of Fixed Assets - Equity 5,857,818,381
Profit and Loss
Profit/(Loss) before interest and taxation 1,456,757,354

227 Disrupt. Innovate.
In case of investment in a project of an associated company / undertaking that has not commenced operations, in addition to the information referred to above, the following further information is also required: a) a description of the project and its history since conceptualization; b) starting date and expected date of completion; c) time by which such project shall become commercially operational; d) expected return on total capital employed in the project; and e) funds invested or to be invested by the promoters distinguishing between cash and non-cash amounts;
Maximum amount of investment to be made
Purpose, benefits likely to accrue to the investing company and its members from such investment and period of investment;
Sources of funds to be utilized for investment and where the investment is intended to be made using borrowed funds,- (I) justification for investment through borrowings; (II) detail of collateral, guarantees provided and assets pledged for obtaining such funds; and (III) cost benefit analysis;
Salient features of the agreement(s), if any, with associated company or associated undertaking with regards to the proposed investment;
Direct or indirect, of directors, sponsors, majority shareholders and their relatives, if any, in the associated company/undertaking or the transaction under consideration
In case any investment in associated company or associated undertaking has already been made, the performance review of such investment including complete information/justification for any impairment or write offs; and
Any other important details necessary for the members to understand the transaction;
Financial charges (207,664,482)
Profit/(Loss) before taxation 1,249,092,872
Taxation (14,463,127)
Profit/(Loss) after taxation 1,234,629,745
Not applicable.
PKR 100 million
To make investment in subsidiaries
Own Source.
None
Mr. Ali Jameel, Mr. Jameel Yusuf and Mr. Bilal Alibhai, Mr. Zafar Naqvi, Mr. Muhammad Shafi are the common directors of the company and TPL Properties Limited.
None
Investment will be made through right issue, whenever announced by the company.

228
Renewal of advance of Rs. 200 million in the subsidiary company, TPL Rupiya (Pvt.) Limited.
The Company is desirous to renew its advance made to TPL Rupiya (Pvt.) Limited. The advance amount was initially approved by the Board of Directors and its renewal approved by the members subsequently to a maximum amount of Rs. 200 million on 10th October 2017. The outstanding balance due to TPL Rupiya (Pvt.) Limited as at 30th June 2018 amounts to Rs. None. The renewal of advance has been approved by the Board of Directors of the Company in their meeting held on August 17, 2018.
The information required to be annexed to the Notice by Notification No. S. R. O. 1240(I)/2017 dated December 06, 2017 is set out below:
maximum price at which securities will be acquired;
In case the purchase price is higher than market value in case of listed securities and fair value in case of unlisted securities, justification thereof
maximum number of securities to be acquired
number of securities and percentage thereof held before and after the proposed investment
Current and preceding twelve weeks’ weighted average market price where investment is proposed to be made in listed securities;
fair value determined in terms of sub-regulation (1) of regulation 5 for investments in unlisted securities
None
None
None
None
Current PKR 8.15 per share, preceding 12 month weeks Avg PKR 9 per share.
None
Name of the associated company or associated undertaking
Basis of relationship
Earnings per share for the last three years of the Associated Company
Break-up value per share, based on latest audited financial statements
Financial position of the subsidiary company
TPL Rupiya (Pvt.) Limited
Subsidiary
2018: (4.73)
PKR 4.64/-
The extracts of the reviewed balance sheet and profit and loss account of the associated company as at and for the year ended June 30, 2018 is as follows:
Balance Sheet Rupees
Non-current assets 25,470,020
Other assets 18,368,205
Total Assets 43,838,225 Total Liabilities 28,813,156

Represented by:
Paid up capital 32,358,260
Accumulated Profit / (Loss) (17,333,191)
Surplus on Revaluation of Fixed Assets
Equity 15,025,069
Profit and Loss
Profit/(Loss) before interest and taxation (13,707,958)
Financial charges (723,347)
Profit/(Loss) before taxation (14,431,305)
Taxation (860,429)
Profit/(Loss) after taxation (15,291,734)
Not applicable.
PKR 200 million
To make investment in subsidiaries
Own Source
229 Disrupt. Innovate.
In case of investment in a project of an associated company / undertaking that has not commenced operations, in addition to the information referred to above, the following further information is also required: a) a description of the project and its history since conceptualization; b) starting date and expected date of completion; c) time by which such project shall become commercially operational; d) expected return on total capital employed in the project; and e) funds invested or to be invested by the promoters distinguishing between cash and non-cash amounts;
Maximum amount of investment to be made
Purpose, benefits likely to accrue to the investing company and its members from such investment and period of investment;
Sources of funds to be utilized for investment and where the investment is intended to be made using borrowed funds,- (I) justification for investment through borrowings; (II) detail of collateral, guarantees provided and assets pledged for obtaining such funds; and (III) cost benefit analysis;
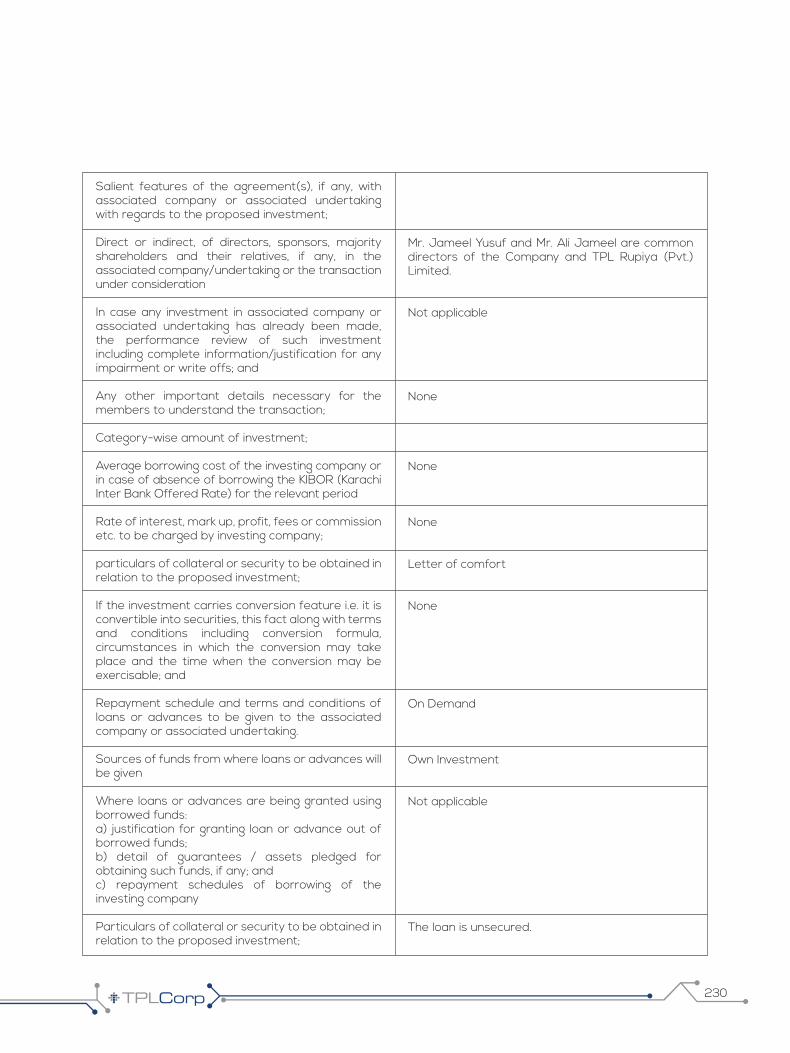
230
Salient features of the agreement(s), if any, with associated company or associated undertaking with regards to the proposed investment;
Direct or indirect, of directors, sponsors, majority shareholders and their relatives, if any, in the associated company/undertaking or the transaction under consideration
In case any investment in associated company or associated undertaking has already been made, the performance review of such investment including complete information/justification for any impairment or write offs; and
Any other important details necessary for the members to understand the transaction;
Category-wise amount of investment;
Average borrowing cost of the investing company or in case of absence of borrowing the KIBOR (Karachi Inter Bank Offered Rate) for the relevant period
Rate of interest, mark up, profit, fees or commission etc. to be charged by investing company;
particulars of collateral or security to be obtained in relation to the proposed investment;
If the investment carries conversion feature i.e. it is convertible into securities, this fact along with terms and conditions including conversion formula, circumstances in which the conversion may take place and the time when the conversion may be exercisable; and
Repayment schedule and terms and conditions of loans or advances to be given to the associated company or associated undertaking.
Sources of funds from where loans or advances will be given
Where loans or advances are being granted using borrowed funds: a) justification for granting loan or advance out of borrowed funds; b) detail of guarantees / assets pledged for obtaining such funds, if any; and c) repayment schedules of borrowing of the investing company
Particulars of collateral or security to be obtained in relation to the proposed investment;
Mr. Jameel Yusuf and Mr. Ali Jameel are common directors of the Company and TPL Rupiya (Pvt.) Limited.
Not applicable
None
None
None
Letter of comfort
None
On Demand
Own Investment
Not applicable
The loan is unsecured.

231 Disrupt. Innovate.
If the loans or advances carry conversion feature i.e. it is convertible into securities, this fact along with complete detail including conversion formula, circumstances in which the conversion may take place and the time when the conversion may be exercisable;
Repayment schedule and terms of loans or advances to be given to the investee company
Not applicable.
Repayable on demand.
Renewal of advance and / or invest Rs.150 million to an associated company in UAE (TPL International Limited)
The Company is desirous to renew its advance made to an associated company in UAE. The advance amount was initially approved by the Board of Directors and its renewal approved by the members subsequently to a maximum amount of Rs. 150 million on 10th October 2017. The outstanding balance due to the associated Com-pany in UAE as at 30th June 2018 amounts to Rs. None. The renewal of advance has been approved by the Board of Directors of the Company in their meeting held on August 17, 2018.
The information required to be annexed to the Notice by Notification No. S. R. O. 1240(I)/2017 dated December 06, 2017 is set out below:
Name of the associated company or associated undertaking
Basis of relationship
Earnings per share for the last three years of the Associated Company
Break-up value per share, based on latest audited financial statements
Financial position of the subsidiary company
TPL International Limited
Subsidiary
Not applicable
Not applicable
The extracts of the reviewed balance sheet and profit and loss account of the associated company as at and for the year ended June 30, 2018 is as follows:
Balance Sheet Rupees
Non-current assets N.A.
Other assets N.A.
Total Assets N.A.
Total Liabilities N.A. Represented by:
Paid up capital N.A.
Accumulated Profit N.A.

232
Surplus on Revaluation of Fixed Assets N.A.
Equity N.A.
Profit and Loss
Profit/(Loss) before interest and taxation N.A.
Financial charges N.A.
Profit/(Loss) before taxation N.A.
Taxation N.A.
Profit/(Loss) after taxation N.A.
Not applicable.
PKR 150 million
To make investment in subsidiaries
None
Mr. Ali Jameel is common director of the Company and TPL International Limited.
In case of investment in a project of an associated company / undertaking that has not commenced operations, in addition to the information referred to above, the following further information is also required: a) a description of the project and its history since conceptualization; b) starting date and expected date of completion; c) time by which such project shall become commercially operational; d) expected return on total capital employed in the project; and e) funds invested or to be invested by the promoters distinguishing between cash and non-cash amounts;
Maximum amount of investment to be made
Purpose, benefits likely to accrue to the investing company and its members from such investment and period of investment;
Sources of funds to be utilized for investment and where the investment is intended to be made using borrowed funds,- (I) justification for investment through borrowings; (II) detail of collateral, guarantees provided and assets pledged for obtaining such funds; and (III) cost benefit analysis;
Salient features of the agreement(s), if any, with associated company or associated undertaking with regards to the proposed investment;
Direct or indirect, of directors, sponsors, majority shareholders and their relatives, if any, in the associated company/undertaking or the transaction under consideration

233 Disrupt. Innovate.
In case any investment in associated company or associated undertaking has already been made, the performance review of such investment including complete information/justification for any impairment or write offs; and
Any other important details necessary for the members to understand the transaction;
Category-wise amount of investment;
Average borrowing cost of the investing company or in case of absence of borrowing the KIBOR (Karachi Inter Bank Offered Rate) for the relevant period
Rate of interest, mark up, profit, fees or commission etc. to be charged by investing company;
particulars of collateral or security to be obtained in relation to the proposed investment;
If the investment carries conversion feature i.e. it is convertible into securities, this fact along with terms and conditions including conversion formula, circumstances in which the conversion may take place and the time when the conversion may be exercisable; and
Repayment schedule and terms and conditions of loans or advances to be given to the associated company or associated undertaking.
Sources of funds from where loans or advances will be given
Where loans or advances are being granted using borrowed funds: a) justification for granting loan or advance out of borrowed funds; b) detail of guarantees / assets pledged for obtaining such funds, if any; and c) repayment schedules of borrowing of the investing company
Particulars of collateral or security to be obtained in relation to the proposed investment;
If the loans or advances carry conversion feature i.e. it is convertible into securities, this fact along with complete detail including conversion formula, circumstances in which the conversion may take place and the time when the conversion may be exercisable;
Repayment schedule and terms of loans or advances to be given to the investee company
None
None
None
None
None
None
None
None
Own Investment
Not applicable
The loan is unsecured.
Not applicable
Repayable on demand.

234
Renewal of advance and / or invest Rs. 200 million to an associated company TPL E-Ventures (Private) Limited.
The Company is desirous to renew its advance made to TPL E-Ventures (Private) Limited. The advance amount was initially approved by the Board of Directors and its renewal approved by the members subsequently to a maximum amount of Rs. 200 million on 10th October 2017. The outstanding balance due to TPL E-Ventures (Private) Limited as at 30th June 2018 amounts to Rs. 0.166 million. The renewal of advance has been approved by the Board of Directors of the Company in their meeting held on August 17, 2018.
The information required to be annexed to the Notice by Notification No. S. R. O. 1240(I)/2017 dated December 06, 2017 is set out below:
Name of the associated company or associated undertaking
Basis of relationship
Earnings per share for the last three years of the Associated Company
Break-up value per share, based on latest audited financial statements
Financial position of the subsidiary company
TPL E-Ventures (Private) Limited
Subsidiary
Not applicable
Not applicable
The extracts of the reviewed balance sheet and profit and loss account of the associated company as at and for the year ended June 30, 2018 is as follows:
Balance Sheet Rupees
Non-current assets N.A.
Other assets N.A.
Total Assets NA.
Total Liabilities N.A. Represented by: Paid up capital Accumulated Profit N.A.
Surplus on Revaluation of N.A. Fixed Assets
Equity N.A.
Profit and Loss Profit/(Loss) before interest N.A. and taxation
Financial charges N.A.

235 Disrupt. Innovate.
Profit/(Loss) before taxation N.A.
Taxation N.A.
Profit/(Loss) after taxation N.A.
Not applicable.
PKR 200 million
To make investment in subsidiaries
Own Fund
None
Not applicable
None
In case of investment in a project of an associated company / undertaking that has not commenced operations, in addition to the information referred to above, the following further information is also required: a) a description of the project and its history since conceptualization; b) starting date and expected date of completion; c) time by which such project shall become commercially operational; d) expected return on total capital employed in the project; and e) funds invested or to be invested by the promoters distinguishing between cash and non-cash amounts;
Maximum amount of investment to be made
Purpose, benefits likely to accrue to the investing company and its members from such investment and period of investment;
Sources of funds to be utilized for investment and where the investment is intended to be made using borrowed funds,- (I) justification for investment through borrowings; (II) detail of collateral, guarantees provided and assets pledged for obtaining such funds; and (III) cost benefit analysis;
Salient features of the agreement(s), if any, with associated company or associated undertaking with regards to the proposed investment;
Direct or indirect, of directors, sponsors, majority shareholders and their relatives, if any, in the associated company/undertaking or the transaction under consideration
In case any investment in associated company or associated undertaking has already been made, the performance review of such investment including complete information/justification for any impairment or write offs; and
Any other important details necessary for the members to understand the transaction;
Category-wise amount of investment;
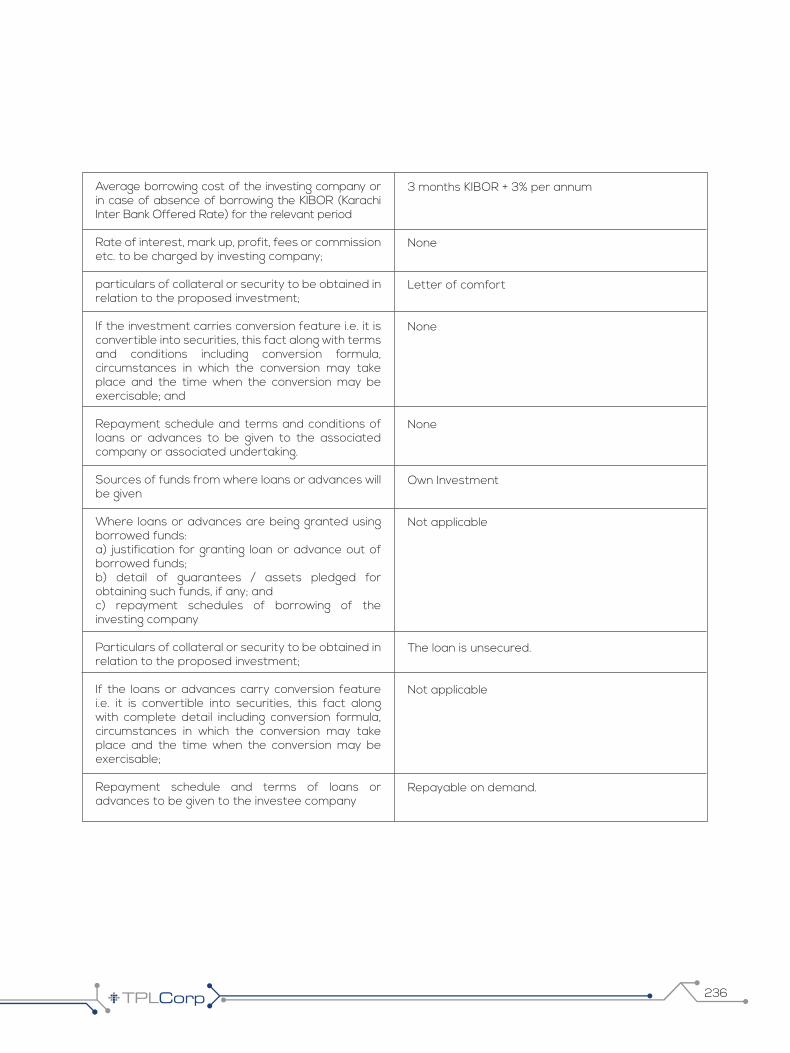
236
Average borrowing cost of the investing company or in case of absence of borrowing the KIBOR (Karachi Inter Bank Offered Rate) for the relevant period
Rate of interest, mark up, profit, fees or commission etc. to be charged by investing company;
particulars of collateral or security to be obtained in relation to the proposed investment;
If the investment carries conversion feature i.e. it is convertible into securities, this fact along with terms and conditions including conversion formula, circumstances in which the conversion may take place and the time when the conversion may be exercisable; and
Repayment schedule and terms and conditions of loans or advances to be given to the associated company or associated undertaking.
Sources of funds from where loans or advances will be given
Where loans or advances are being granted using borrowed funds: a) justification for granting loan or advance out of borrowed funds; b) detail of guarantees / assets pledged for obtaining such funds, if any; and c) repayment schedules of borrowing of the investing company
Particulars of collateral or security to be obtained in relation to the proposed investment;
If the loans or advances carry conversion feature i.e. it is convertible into securities, this fact along with complete detail including conversion formula, circumstances in which the conversion may take place and the time when the conversion may be exercisable;
Repayment schedule and terms of loans or advances to be given to the investee company
3 months KIBOR + 3% per annum
None
Letter of comfort
None
None
Own Investment
Not applicable
The loan is unsecured.
Not applicable
Repayable on demand.
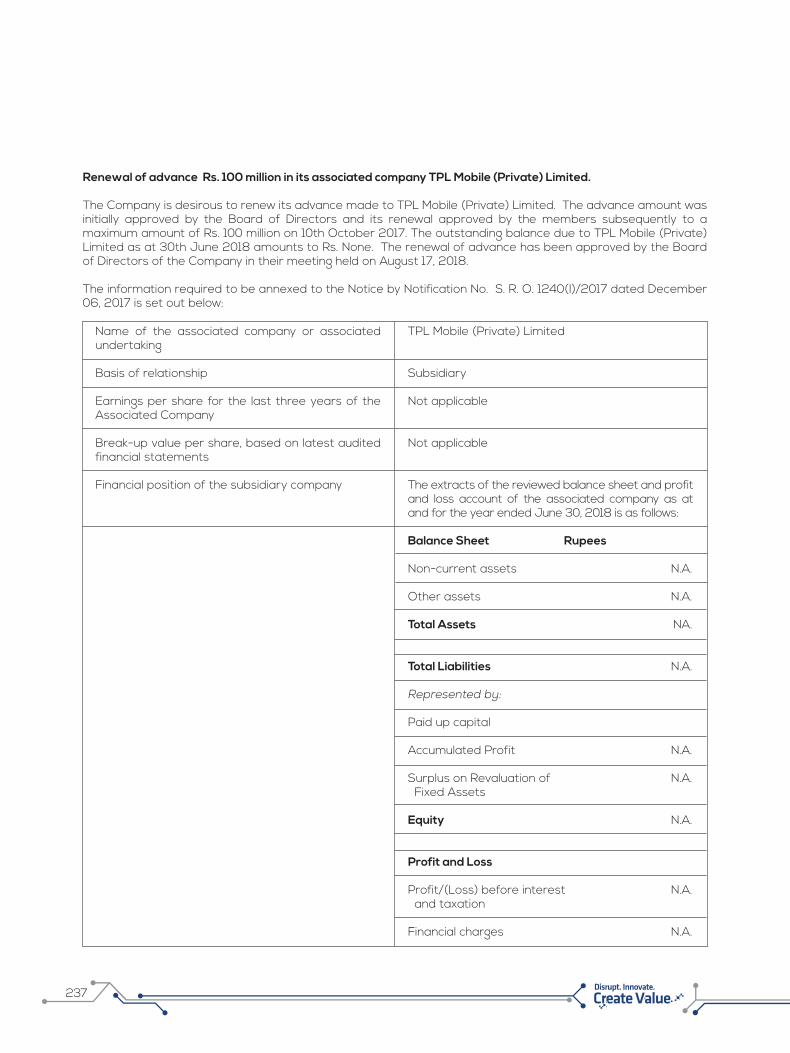
237 Disrupt. Innovate.
Renewal of advance Rs. 100 million in its associated company TPL Mobile (Private) Limited.
The Company is desirous to renew its advance made to TPL Mobile (Private) Limited. The advance amount was initially approved by the Board of Directors and its renewal approved by the members subsequently to a maximum amount of Rs. 100 million on 10th October 2017. The outstanding balance due to TPL Mobile (Private) Limited as at 30th June 2018 amounts to Rs. None. The renewal of advance has been approved by the Board of Directors of the Company in their meeting held on August 17, 2018.
The information required to be annexed to the Notice by Notification No. S. R. O. 1240(I)/2017 dated December 06, 2017 is set out below:
Name of the associated company or associated undertaking
Basis of relationship
Earnings per share for the last three years of the Associated Company
Break-up value per share, based on latest audited financial statements
Financial position of the subsidiary company
TPL Mobile (Private) Limited
Subsidiary
Not applicable
Not applicable
The extracts of the reviewed balance sheet and profit and loss account of the associated company as at and for the year ended June 30, 2018 is as follows:
Balance Sheet Rupees
Non-current assets N.A.
Other assets N.A.
Total Assets NA.
Total Liabilities N.A. Represented by: Paid up capital Accumulated Profit N.A.
Surplus on Revaluation of N.A. Fixed Assets
Equity N.A.
Profit and Loss Profit/(Loss) before interest N.A. and taxation
Financial charges N.A.

238
Profit/(Loss) before taxation N.A.
Taxation N.A.
Profit/(Loss) after taxation N.A.
Not applicable.
PKR 100 million
To make investment in subsidiaries
Own Fund
None
Mr. Ali Jameel is the common director of the Company and TPL Mobile (Pvt.) Limited
Not applicable
None
In case of investment in a project of an associated company / undertaking that has not commenced operations, in addition to the information referred to above, the following further information is also required: a) a description of the project and its history since conceptualization; b) starting date and expected date of completion; c) time by which such project shall become commercially operational; d) expected return on total capital employed in the project; and e) funds invested or to be invested by the promoters distinguishing between cash and non-cash amounts;
Maximum amount of investment to be made
Purpose, benefits likely to accrue to the investing company and its members from such investment and period of investment;
Sources of funds to be utilized for investment and where the investment is intended to be made using borrowed funds,- (I) justification for investment through borrowings; (II) detail of collateral, guarantees provided and assets pledged for obtaining such funds; and (III) cost benefit analysis;
Salient features of the agreement(s), if any, with associated company or associated undertaking with regards to the proposed investment;
Direct or indirect, of directors, sponsors, majority shareholders and their relatives, if any, in the associated company/undertaking or the transaction under consideration
In case any investment in associated company or associated undertaking has already been made, the performance review of such investment including complete information/justification for any impairment or write offs; and
Any other important details necessary for the members to understand the transaction;
Category-wise amount of investment;

Average borrowing cost of the investing company or in case of absence of borrowing the KIBOR (Karachi Inter Bank Offered Rate) for the relevant period
Rate of interest, mark up, profit, fees or commission etc. to be charged by investing company;
particulars of collateral or security to be obtained in relation to the proposed investment;
If the investment carries conversion feature i.e. it is convertible into securities, this fact along with terms and conditions including conversion formula, circumstances in which the conversion may take place and the time when the conversion may be exercisable; and
Repayment schedule and terms and conditions of loans or advances to be given to the associated company or associated undertaking.
Sources of funds from where loans or advances will be given
Where loans or advances are being granted using borrowed funds: a) justification for granting loan or advance out of borrowed funds; b) detail of guarantees / assets pledged for obtaining such funds, if any; and c) repayment schedules of borrowing of the investing company
Particulars of collateral or security to be obtained in relation to the proposed investment;
If the loans or advances carry conversion feature i.e. it is convertible into securities, this fact along with complete detail including conversion formula, circumstances in which the conversion may take place and the time when the conversion may be exercisable;
Repayment schedule and terms of loans or advances to be given to the investee company
None
None
None
None
None
Own Investment
Not applicable
The loan is unsecured.
Not applicable.
Repayable on demand.
239 Disrupt. Innovate.
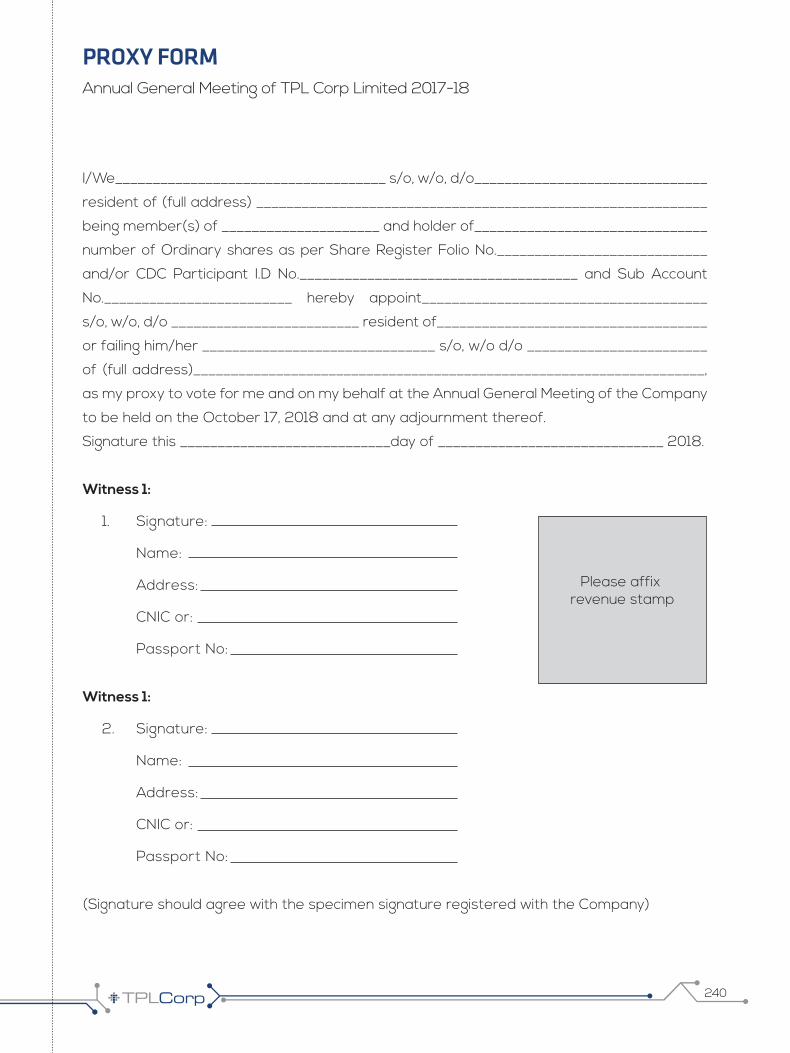
240
Annual General Meeting of TPL Corp Limited 2017-18
I/We____________________________________ s/o, w/o, d/o_______________________________
resident of (full address) ____________________________________________________________
being member(s) of _____________________ and holder of_______________________________
number of Ordinary shares as per Share Register Folio No.____________________________
and/or CDC Participant I.D No._____________________________________ and Sub Account
No._________________________ hereby appoint______________________________________
s/o, w/o, d/o _________________________ resident of____________________________________
or failing him/her _______________________________ s/o, w/o d/o ________________________
of (full address)____________________________________________________________________,
as my proxy to vote for me and on my behalf at the Annual General Meeting of the Company
to be held on the October 17, 2018 and at any adjournment thereof.
Signature this ____________________________day of ______________________________ 2018.
Witness 1:
1. Signature:
Name:
Address:
CNIC or:
Passport No:
Witness 1:
2. Signature:
Name:
Address:
CNIC or:
Passport No:
(Signature should agree with the specimen signature registered with the Company)
Please affix revenue stamp
PROXY FORM
241 Disrupt. Innovate.
Notes:
i) Proxies in order to be effective must be received by the Company not less than 48
hours before the meeting.
ii) CDC Shareholders and their proxies are each requested to attach an attested
photocopy of their Computerized National Identity Card or Passport with this proxy
before submission to the Company.
iii) The proxy shall produce his original CNIC or original passport at the time of the
meeting.
iv) In case of corporate entity, Board of Directors resolution / power of attorney with
specimen signature shall be submitted (unless it has been provided earlier) along with
proxy form to the Company.

242

172018
2018
243 Disrupt. Innovate.


12th Floor, Centrepoint, Off Shaheed-e-Millat Expressway,Adjacent KPT Interchange, Karachi - 74900
Email: [email protected], Website: www.tplcorp.com
CORPORATE OFFICE12th Floor, Centrepoint, Off Shaheed-e-Millat Expressway,
Adjacent KPT Interchange, Karachi - 74900Email: [email protected], Website: www.tplcorp.com
CORPORATE OFFICE