TPC Benchmark E Full Disclosure Report
56
TPC Benchmark TM E Full Disclosure Report for IBM® BladeCenter® HS21 XM using Microsoft® SQL Server 2005 Enterprise x64 Edition SP2 and Microsoft Windows® Server 2003 R2 Enterprise x64 Edition TPC-E Version 1.2.0 Submitted for Review August 10, 2007 IBM Corporation
Transcript of TPC Benchmark E Full Disclosure Report

TPC BenchmarkTM E Full Disclosure Report
for IBM® BladeCenter® HS21 XM
using Microsoft® SQL Server 2005 Enterprise x64 Edition SP2
and Microsoft Windows® Server 2003
R2 Enterprise x64 Edition
TPC-E Version 1.2.0
Submitted for Review August 10, 2007
IBM Corporation

©IBM Corporation TPC-E Benchmark Full Disclosure Report – August 2007 2
First Edition – August 2007
THE INFORMATION CONTAINED IN THIS DOCUMENT IS DISTRIBUTED ON AN AS IS BASIS WITHOUT ANY WARRANTY EITHER EXPRESSED OR IMPLIED. The use of this information or the implementation of any of these techniques is the customer’s responsibility and depends on the customer’s ability to evaluate and integrate them into the customer’s operational environment. While each item has been reviewed by IBM for accuracy in a specific situation, there is no guarantee that the same or similar results will be obtained elsewhere. Customers attempting to adapt these techniques to their own environment do so at their own risk.
In this document, any references made to an IBM licensed program are not intended to state or imply that only IBM’s licensed program may be used; any functionally equivalent program may be used.
This publication was produced in the United States. IBM may not offer the products, services, or features discussed in this document in other countries, and the information is subject to change without notice. Consult your local IBM representative for information on products and services available in your area.
© Copyright International Business Machines Corporation 2007. All rights reserved.
Permission is hereby granted to reproduce this document in whole or in part, provided the copyright notice as printed above is set forth in full text on the title page of each item reproduced.
U.S. Government Users - Documentation related to restricted rights: Use, duplication, or disclosure is subject to restrictions set forth in GSA ADP Schedule Contract with IBM Corp.
Trademarks
IBM, the IBM logo, System x, System Storage and BladeCenter are trademarks or registered trademarks of International Business Machines Corporation.
The following terms used in this publication are trademarks of other companies as follows: TPC Benchmark, TPC-E, tpsE, and $/tpsE trademark of Transaction Processing Performance Council; Intel and Xeon are trademarks or registered trademarks of Intel Corporation; Microsoft and Windows are trademarks or registered trademarks of Microsoft Corporation. Other company, product, or service names, which may be denoted by two asterisks (**), may be trademarks or service marks of others.
Notes 1 GHz and MHz only measures microprocessor internal clock speed, not application performance. Many factors affect application performance. 2 When referring to hard disk capacity, GB, or gigabyte, means one thousand million bytes. Total user-accessible capacity may be less.

©IBM Corporation TPC-E Benchmark Full Disclosure Report – August 2007 3
Abstract IBM Corporation conducted the TPC BenchmarkTM E on the IBM® BladeCenter® HS21 XM configured as a client/server system with attached IBM System Storage™ DS4800. This report documents the full disclosure information required by the TPC Benchmark E Standard Specification, Revision 1.2.0, including the methodology used to achieve the reported results. All testing fully complied with this revision level. The software used on the IBM BladeCenter HS21 XM system includes Microsoft® Windows® Server 2003 R2 Enterprise x64 Edition operating system and Microsoft SQL Server 2005 Enterprise x64 Edition SP2. Standard metrics, transactions per second-E (tpsE), price per tpsE ($/tpsE) and Availability Date, are reported as required by the TPC Benchmark E Standard Specification. The benchmark results are summarized in the following table.
Hardware
Software
Total System
Cost
tpsE
$ USD /tpsE Total Solution
Availability Date
IBM BladeCenter
HS21 XM
Microsoft SQL Server 2005
Enterprise x64 Edition SP2
Microsoft Windows
Server 2003 R2 Enterprise x64
Edition
$ 321,824 169.59 $ 1,897.66 August 10, 2007
The benchmark implementation and results were audited by Lorna Livingtree for InfoSizing (www.sizing.com). The auditor’s attestation letter is contained in Section 9 of this report.

©IBM Corporation TPC-E Benchmark Full Disclosure Report – August 2007 4
TPC-E Revision 1.2.0 TPC Pricing 1.2.0
®
IBM® BladeCenter® HS21 XMMicrosoft® SQL Server 2005 Report Date:
August 10, 2007
TPC-E Throughput
169.59 tpsE
Price/Performance
$ 1,897.66 USD per tpsE
Availability Date
August 10, 2007
Total System Cost
$ 321,824 USD
Database Server Configuration
Operating System
Microsoft Windows Server
2003 R2 Enterprise
x64 Edition
Database Manager
Microsoft SQL Server 2005
Enterprise x64 Edition SP2
Processors/Cores/ Threads
2/4/4
Memory
32GB
IBM System x35001 x Dual-Core Intel Xeon Processor 5160 3.0GHz (1 Processor, 2 Cores, 2 Threads)1GB of Memory2 x 73.4GB SAS Drive (RAID-1 for OS, Onboard RAID Controller, Onboard Dual-Port 1 Gigabit Ethernet Controller)
IBM BladeCenter H1 x IBM BladeCenter HS21 XM 2 x Dual-Core Intel Xeon Processor 5160 3.0GHz (2 Processors, 4 Cores, 4 Threads) 32GB of Memory 1 x QLogic 4Gb Expansion CardOnboard Dual-Port 1 Gigabit Ethernet Controller
Ethernet Cables
Fibre Cables
Fibre Loops
12 x IBM System Storage EXP810 EnclosureEach Contains: 16 x 36.4GB 15K rpm Drives(Total of 192 Drivesarrayed as: 1 x 2-Disk RAID-1 1 x 30-Disk RAID-10 10 x 16-Disk RAID-5)
D-Link Switch IBM System Storage DS4800
Ethernet Switch Module
Brocade 4Gb Switch Module
Driver
Tier A
Initial Database Size 654 GB
Redundancy Level: 1 RAID-10 Log + RAID-5 Data
Storage 192 x 36.4 GB 15K

©IBM Corporation TPC-E Benchmark Full Disclosure Report – August 2007 5
TPC-E Revision 1.2.0 TPC Pricing Spec 1.2.0 Report Date: August 10, 2007 ®
IBM BladeCenter HS21 XMMicrosoft SQL Server 2005
Availability Date: August 10, 2007
Description Part Price Unit Quantity Extended 3-Yr. Maint.Number Source Price Price Price
Server HardwareIBM BladeCenter H Chassis 8852-4XU 1 3,849 1 3,849
IBM KVM/ Advanced Management ModuleServer Connectivity Module for IBM BladeCenter 39Y9324 1 999 1 999IBM BladeCenter HS21 - 1 x Dual Core Intel Xeon 5160 7995-L6U 1 3,339 1 3,339
1GB (2x512MB) PC2-5300 DDR2 SDRAM (Chipkill)Intel Xeon Processor 5160 3.00GHz/4MB L2, 1333MHz FSB 42C0567 1 1,899 1 1,8998GB (2x4GB) PC2-5300 CL5 ECC DDR2 SDRAM (Chipkill) 39M5797 1 5,999 4 23,996QLogic 4Gb SFF Fibre Channel Expansion Card 26R0890 1 799 1 799IBM T115 15-inch TFT Display 494215U 1 259 1 259IBM Preferred Pro USB Keyboard 40K9584 1 29 1 29IBM 3-Button Optical Mouse - Black - USB 40K9201 1 19 1 19NEC Black 1.44MB 3.5" External USB Floppy Drive (2 spares) UF0002S-102 5 22 3 66ServicePac for 3-Year 24x7x4 Support (BC Chassis) 30L9185 1 750 1 750ServicePac for 3-Year 24x7x4 Support (HS21) 69P9519 1 400 1 400ServicePac for 3-Year 24x7x4 Support (Display) 30L9183 1 90 1 90
Subtotal 35,254 1,240Server StorageIBM Short Wave SFP Module (4 Pack) 22R0483 1 550 5 2,750IBM 1m LC-LC Fibre Channel Cable 39M5696 1 79 24 1,896IBM 5m LC-LC Fibre Channel Cable 39M5697 1 129 2 258Brocade 4Gb 10-port SAN Switch Module for IBM BladeCenter 32R1813 1 8,999 1 8,999IBM S2 42U Standard Rack 93074RX 1 1,489 2 2,978IBM UPS 750TLV 21301TX 1 545 1 545ServicePac for 3-Year 24x7x4 Support (Rack) 41L2760 1 300 2 600IBM System Storage DS4800 Disk Upgrade to 8GB Cache 1815-82A 2a 53,995 1 53,995IBM System Storage DS4000 EXP810 Storage Exp. Unit 1812-81H 2a 6,000 12 72,00036.4GB 15K 4Gbps FC E-DDM Hot-Swap HDD 40K6812 2a 892 192 171,264ServicePac for 3-Year 24x7x4 Support (EXP810) 10N3651 2b 960 12 11,520ServicePac for 3-Year 24x7x4 Support (DS4800) 41C5953 2b 3,200 1 3,200
Subtotal 314,685 15,320Server SoftwareMicrosoft SQL Server 2005 Enterprise x64 Edition 810-03150 3a 23,911 2 47,822Microsoft Windows Server 2003 R2 Enterprise x64 Edition P72-01684 3b 2,334 1 2,334Microsoft Problem Resolution Services 3 245.00 1 245
Subtotal 50,156 245Client Hardware x3500 with 3.0GHz/2x2MB Xeon 5160, 1GB (2x512) Memory 797792U 1 3,399 1 3,39973GB 15K Hot Swap SAS 40K1043 1 349 2 698ServicePac for 3-Year 24x7x4 Support (x3500) 21P2084 1 689 1 689
Subtotal 4,097 689Client Software Microsoft Windows Server 2003 R2 Standard Edition P73-01972 3c 719 1 719
Subtotal 719 0InfrastructureD-Link DGS 1008TLEthernet Switch (2 spares) DGS1008TL 4 206 3 618Ethernet Cable (2 spares) A3L791-10-BLK 5 4 6 24 Subtotal 642
Total 405,553 17,494IBM Large Purchase Discount 17.35% (See Note 1.) 1 -10,279Compsat Technology Large Purchase Discount 29.15% (See Note 2.) 2 -90,944Pricing: 1 - IBM - 1-888-SHOP-IBM, ext. 5821; 2 - Compsat Technology discounts 2a = 30%, $321,8242b = 12%; 3 - Microsoft discounts 3a = 4%; 3b = 42%; 3c = 28%; 4 - www.superwarehouse.com; 5 - newegg.com TPC-E Throughput: 169.59Note 1: Discount based on IBM Direct guidance applies to all line items where Pricing=1. Note 2: Discount applies to all line items where Pricing=2a, 2b and 2c. $ USD/tpsE: $1,897.66Pricing is for this system or one of similar size.Implementation and results audited by Lorna Livingtree for InfoSizing (www.sizing.com)
discounts are not permitted. Special prices based on assumptions about past or future purchases are not permitted. All discounts reflect standard
Three-Year Cost of Ownership USD:
Prices used in TPC benchmarks reflect the actual prices a customer would pay for a one-time purchase of the stated components. Individually negotiated
prices are not available according to these terms, please inform the TPC at [email protected]. Thank you.pricing policies for the listed components. For complete details, see the pricing section of the TPC benchmark specifications. If you find that stated

©IBM Corporation TPC-E Benchmark Full Disclosure Report – August 2007 6
TPC-E Revision 1.2.0 TPC Pricing Spec 1.2.0 Report Date: August 10, 2007
®
IBM BladeCenter HS21 XM Microsoft SQL Server 2005
Availability Date: August 10, 2007
Reported Throughput: 169.59 tpsE Configured Customers: 85,000
Response Time (in seconds) Minimum Average 90Th Percentile Maximum
Broker-Volume 0.01 0.04 0.07 0.24 Customer-Position 0.00 0.04 0.07 0.48 Market-Feed 0.00 0.04 0.07 0.22 Market-Watch 0.00 0.03 0.06 0.56 Security-Detail 0.00 0.02 0.04 0.47 Trade-Lookup 0.01 0.47 0.63 1.00 Trade-Order 0.00 0.13 0.17 0.53 Trade-Result 0.00 0.13 0.19 4.38 Trade-Status 0.00 0.03 0.05 0.50 Trade-Update 0.02 0.56 0.68 1.03 Data-Maintenance 0.01 0.09 N/A 0.65
Transaction Mix Transaction Count Mix % Broker-Volume 598,355 4.900 Customer-Position 1,587,365 13.000 Market-Feed 122,111 1.000 Market-Watch 2,197,965 18.001 Security-Detail 1,709,530 14.001 Trade-Lookup 976,643 7.998 Trade-Order 1,233,329 10.101 Trade-Result 1,221,093 10.000 Trade-Status 2,319,897 18.999 Trade-Update 244,162 2.000 Data-Maintenance 120 N/A
Test Duration and Timings Ramp-up Time 01:10:00 Measurement Interval 02:00:00 Business Recovery Time 03:48:08 Total Number of Transactions Completed in Measurement Interval 12,210,450

©IBM Corporation TPC-E Benchmark Full Disclosure Report – August 2007 7
Table of Contents Abstract.......................................................................................................... 3
Clause 0 – Preamble ..................................................................................... 9
Clause 1 – Introduction .............................................................................. 11 Benchmark Sponsor................................................................................................................ 11 Configuration Diagrams......................................................................................................... 11 Hardware and Software Configuration Steps ...................................................................... 12
Clause 2 –Database Design, Scaling and Population Related Items...... 20 Database Creation and Table Definitions ............................................................................. 20 Database Physical Organization ............................................................................................ 20 Horizontal/Vertical Partitioning............................................................................................ 20 Replication ............................................................................................................................... 20 Cardinality of Tables .............................................................................................................. 21 Distribution of Tables and Logs............................................................................................. 22 Database Interface and Model Implemented........................................................................ 24 Database Load Methodology.................................................................................................. 25
Clause 3 – Transaction Related Items ...................................................... 26 Vendor-Supplied Code ........................................................................................................... 26 Database Footprint of Transactions ...................................................................................... 26
Clause 4 – SUT, Driver and Network Related Items .............................. 27 EGen Instances........................................................................................................................ 27 Network Configuration........................................................................................................... 27
Clause 5 – EGen Related Items ................................................................. 28 EGen Version........................................................................................................................... 28 EGen Code and Modifications ............................................................................................... 28
Clause 6 – Performance Metrics and Response Time Related Items .... 29 Measured Throughput............................................................................................................ 29 Throughput vs. Elapsed Time for Trade-Result Transaction............................................. 29 Steady State Methodology ...................................................................................................... 29 Work Performed during Steady State................................................................................... 30 Transaction Statistics.............................................................................................................. 30

©IBM Corporation TPC-E Benchmark Full Disclosure Report – August 2007 8
Clause 7 – Transaction and System Properties Related Items............... 32 Atomicity Requirements......................................................................................................... 32 Consistency Requirements ..................................................................................................... 32 Isolation Requirements........................................................................................................... 34 Durability Requirements ........................................................................................................ 37
Clause 8 – Pricing Related Items............................................................... 40 60-Day Space ........................................................................................................................... 40 Auditor’s Attestation Letter................................................................................................... 41 Supporting Files Index Table................................................................................................. 43
Appendix A – Price Quotes ........................................................................ 49

©IBM Corporation TPC-E Benchmark Full Disclosure Report – August 2007 9
Clause 0 – Preamble Introduction TPC Benchmark™ E (TPC-E) is an On-Line Transaction Processing (OLTP) workload. It is a mixture of read-only and update intensive transactions that simulate the activities found in complex OLTP application environments. The database schema, data population, transactions, and implementation rules have been designed to be broadly representative of modern OLTP systems. The benchmark exercises a breadth of system components associated with such environments, which are characterized by:
• The simultaneous execution of multiple transaction types that span a breadth of complexity; Moderate system and application execution time;
• A balanced mixture of disk input/output and processor usage; Transaction integrity (ACID properties);
• A mixture of uniform and non-uniform data access through primary and secondary keys; • Databases consisting of many tables with a wide variety of sizes, attributes, and relationships with
realistic content; • Contention on data access and update.
The TPC-E operations are modeled as follows: The database is continuously available 24 hours a day, 7 days a week, for data processing from multiple Sessions and data modifications against all tables, except possibly during infrequent (e.g., once a month) maintenance Sessions. Due to the worldwide nature of the application modeled by the TPC-E benchmark, any of the transactions may be executed against the database at anytime, especially in relation to each other. Goal of the TPC-E Benchmark The TPC-E benchmark simulates the OLTP workload of a brokerage firm. The focus of the benchmark is the central database that executes transactions related to the firm‟s customer accounts. In keeping with the goal of measuring the performance characteristics of the database system, the benchmark does not attempt to measure the complex flow of data between multiple application systems that would exist in a real environment. The mixture and variety of transactions being executed on the benchmark system is designed to capture the characteristic components of a complex system. Different transaction types are defined to simulate the interactions of the firm with its customers as well as its business partners. Different transaction types have varying run-time requirements. The benchmark defines:
• Two types of transactions to simulate Consumer-to-Business as well as Business-to-Business activities.
• Several transactions for each transaction type. • Different execution profiles for each transaction type A specific run-time mix for all defined
transactions. For example, the database will simultaneously execute transactions generated by systems that interact with customers along with transactions that are generated by systems that interact with financial markets as well as administrative systems. The benchmark system will interact with a set of Driver systems that simulate the various sources of transactions without requiring the benchmark to implement the complex environment. The Performance Metric reported by TPC-E is a "business throughput” measure of the number of completed Trade-Result transactions processed per second (see Clause 6.7.1). Multiple Transactions are used to simulate the business activity of processing a trade, and each Transaction is subject to a Response Time constraint. The Performance Metric for the benchmark is expressed in transactions-per-second-E (tpsE). To be compliant with the TPC-E standard, all references to tpsE Results must include the tpsE rate,

©IBM Corporation TPC-E Benchmark Full Disclosure Report – August 2007 10
the associated price-per-tpsE, and the Availability Date of the Priced Configuration (See Clause 6.7.3 for more detail). Although this specification defines the implementation in terms of a relational data model, the database may be implemented using any commercially available Database Management System (DBMS), Database Server, file system, or other data repository that provides a functionally equivalent implementation. The terms "table", "row", and "column" are used in this document only as examples of logical data structures. TPC-E uses terminology and metrics that are similar to other benchmarks, originated by the TPC and others. Such similarity in terminology does not imply that TPC-E Results are comparable to other benchmarks. The only benchmark Results comparable to TPC-E are other TPC-E Results that conform to a comparable version of the TPC-E specification. Restrictions and Limitations Despite the fact that this benchmark offers a rich environment that represents many OLTP applications, this benchmark does not reflect the entire range of OLTP requirements. In addition, the extent to which a customer can achieve the Results reported by a vendor is highly dependent on how closely TPC-E approximates the customer application. The relative performance of systems derived from this benchmark does not necessarily hold for other workloads or environments. Extrapolations to any other environment are not recommended. Benchmark Results are highly dependent upon workload, specific application requirements, and systems design and implementation. Relative system performance will vary because of these and other factors. Therefore, TPC-E should not be used as a substitute for specific customer application benchmarking when critical capacity planning and/or product evaluation decisions are contemplated. Benchmark Sponsors are permitted various possible implementation designs, insofar as they adhere to the model described and pictorially illustrated in this specification. A Full Disclosure Report (FDR) of the implementation details, as specified in Clause 9.1, must be made available along with the reported Results.

©IBM Corporation TPC-E Benchmark Full Disclosure Report – August 2007 11
Clause 1 – Introduction Benchmark Sponsor A statement identifying the benchmark Sponsor(s) and other participating companies must be reported. This benchmark was sponsored by IBM Corporation.
Configuration Diagrams Diagrams of both the measured and priced configurations must be reported, accompanied by a description of the differences. A description of the steps taken to configure all of the hardware and software must be reported. The measured and priced configurations are the same. The configuration diagram for the measured and priced system is provided on the following pages. The TPC-E Driver used for these TPC Benchmark E tests is a Microsoft proprietary Driver. The Driver software needed to implement the Driving & Reporting is run on an IBM System x226 machine that is not part of the SUT. The Driver communicates with Tier A over an Ethernet network using the Driver machine’s onboard 1Gb Ethernet card. Tier A is on an IBM System x3500 with one Dual-Core Intel® Xeon® Processor 5160 (3.0GHz with 1 x 4MB L2 Cache) processor, 2GB of memory, two onboard 73.4GB SAS drives in a RAID-1 array for the operating system, which is Microsoft Windows Server 2003 Standard x86 Edition. Tier A communicates with Tier B and the Driver over an Ethernet network using the IBM System x3500's onboard 1Gb Ethernet card. Tier B is on an IBM BladeCenter HS21 XM blade inside an IBM BladeCenter H chasis. The IBM BladeCenter HS21 XM blade has two Dual-Core Intel Xeon Processor 5160 (3.0GHz with 1 x 4MB L2 Cache), 32GB of memory, no onboard drives, a QLogic 4Gb Fibre Channel expansion card. The QLogic 4Gb Fibre Channel expansion card is connected via the IBM BladeCenter backplane to a legacy Brocade switch module in the back of the IBM BladeCenter chassis. The switch module has two Fibre Channel cables connections. One cable is connected to controller A of an IBM System Storage DS4800 controller. The other cable is connected to controller B of an IBM System Storage DS4800 controller. The DS4800 is connected to 12 IBM System Storage EXP810 disk enclosures. Each EXP810 disk enclosure has sixteen 36.4GB 15Krpm drives. The 192 drives are organized as:
• One 2-disk RAID-1 array for the IBM BladeCenter HS21 XM's operating system, which is Microsoft Windows Server 2003 Enterprise x64 Edition (SP2) with Microsoft SQL Server 2005 Enterprise x64 Edition SP2.
• One 30-disk RAID-10 array for the database log • Ten 16-disk RAID-5 arrays for the database data
Each array is seen as one LUN by the operating system on the HS21 XM blade. In Windows Disk Manager each of the LUNs from the RAID-5 arrays is configured to have a RAW partition for the broker tables and another RAW partition for all the other TPC-E tables (customer, market and dimension all in one file group called customer). The rest of the space on the LUN is an NTFS partition used for DB backups or the temp DB, or is not used at all. Tier B communicates with Tier A over an Ethernet network using the HS21 XM blade's onboard 1Gb Ethernet card with TOE (TCP/IP Offload Engine) enabled. This onboard 1GB Ethernet card is connected via the HS21 XM’s backplane to a legacy Ethernet switch module in the back of the IBM BladeCenter chassis. One Ethernet cable comes out of the switch module and runs to a D-Link 8-port Ethernet switch that also has the Ethernet cables from the Tier A and Driver machines.

©IBM Corporation TPC-E Benchmark Full Disclosure Report – August 2007 12
Measured and Priced Configuration The measured and priced configurations are the same.
IBM System x35001 x Dual-Core Intel Xeon Processor 5160 3.0GHz (1 Processor, 2 Cores, 2 Threads)1GB of Memory2 x 73.4GB SAS Drive (RAID-1 for OS, Onboard RAID Controller, Onboard Dual-Port 1 Gigabit Ethernet Controller)
IBM BladeCenter H1 x IBM BladeCenter HS21 XM 2 x Dual-Core Intel Xeon Processor 5160 3.0GHz (2 Processors, 4 Cores, 4 Threads) 32GB of Memory 1 x QLogic 4Gb Expansion CardOnboard Dual-Port 1 Gigabit Ethernet Controller
Ethernet Cables
Fibre Cables
Fibre Loops
12 x IBM System Storage EXP810 EnclosureEach Contains: 16 x 36.4GB 15K rpm Drives(Total of 192 Drivesarrayed as: 1 x 2-Disk RAID-1 1 x 30-Disk RAID-10 10 x 16-Disk RAID-5)
D-Link Switch IBM System Storage DS4800
Ethernet Switch Module
Brocade 4Gb Switch Module
Driver
Tier A
Figure 1-2. Measured and Priced Configuration Hardware and Software Configuration Steps A description of the steps taken to configure all the hardware must be reported in the Report. A description of the steps taken to configure all the software must be reported in the Report. Driver The Driver is not part of the priced configuration /System Under Test. For this result an IBM System x226 machine running Microsoft Windows Server 2003 Standard x86 Edition was used. The Microsoft Benchcraft proprietary driver was installed on the machine. An Ethernet cable was run from the machine’s onboard Ethernet controller to the D-Link switch. The driver machine was configured with an IP address of 192.168.200.13. Tier A The IBM System x3500 comes with one Dual-Core Intel Xeon 5160 Processor and two 512MB DIMMs. Insert two 73.4GB SAS drives. Temporarily, attach a USB floppy driver to the IBM System x3500. Power on the IBM System x3500. During POST press Ctrl-A when prompted to drop into the IBM ServeRAID Config Utility to configure the drives. Pick “Array Configuration Utility.” Initialize both drives. Create the array using: • RAID-1 • Read caching: Y

©IBM Corporation TPC-E Benchmark Full Disclosure Report – August 2007 13
• Quick Initialization Once the RAID array has been created, escape to the main menu and select “Serial Select Utility” – “Controller Configuration,” and “Disable Array background consistency check.” Then exit the tool; the IBM System x3500 will restart. Boot from the installation CD for Microsoft Windows Server 2003 Standard x86 Edition. Press F6 when prompted to load the Driver for the SAS RAID controller from diskette. The driver can be downloaded from www.ibm.com. During the operating system install, select the per seat 9999 option. Once the operating system is installed, install the onboard Broadcom Ethernet Card’s device driver using the Broadcom-provided executable, which is run from a USB memory stick. The executable can be downloaded from www.ibm.com. When the Ethernet card’s device driver is installed, set a static IP address 192.168.200.7 for one port and 192.168.70.7 for the other port of the dual-port onboard Ethernet card. Connect a crossover cable from the 190.168.70.7 port. The other end of the crossover cable will be connected to the Ethernet port on the IBM BladeCenter H Management Module. Connect an Ethernet cable to the 192.168.200.7 port. The other end of the Ethernet cable connects to the D-Link switch. Install the Microsoft SQL Server Workstation components (client), SUT_CE_Server.exe and SUT_MEE_Server.exe. External storage subsystem Before powering on the EXP810 enclosures and the DS4800, load all 12 EXP810s with the 36.4GB 15K rpm drives. Set the speed switch on the front of the EXP810 to 4Gb. The IBM System Storage DS4800 comes with eight 4Gb IBM short wave SFP modules. The IBM System Storage EXP810 comes with two 4Gb IBM short wave SFP modules. Move the SFP modules to the appropriate places as indicated in the diagram below, and use the additional SFP modules that were purchased separately to fill all the necessary spots according to the diagram. Then cable the configuration as directed by the diagram below, which shows how to cable the DS4800 to the first three EXP810s. The cabling pattern is repeated for the remaining three sets of three EXP810s. So set two would start with a cable from channel 2, port 2 on the top contoller of the DS4800; this cable would go to port 1B on the left of the fourth EXP810.

©IBM Corporation TPC-E Benchmark Full Disclosure Report – August 2007 14
Figure 1-2. IBM System Storage DS4800 and IBM System Storage EXP810 cabling diagram Run an Ethernet cable from the top and bottom controllers in the DS4800 to the the D-Link switch. Download IBM Storage Manager 9 Client from www.ibm.com and install it on the x3500 (Tier A machine). During the installation, do not start the monitor service. The default IP addresses for the controllers on the DS4800 are 192.168.128.101/102 and 192.168.129.101/102. Perform the following steps for both controllers in the DS4800:
1. Hook up a standard serial cable to the DS4800 controller from another machine. 2. On the other machine, Hyperterminal into the DS4800 controller:
a. Speed 38400 b. Other settings: 8, none, 1, none c. Press CTRL-BRK, ESC to get the command prompt.
3. Enter the Default password = infiniti 4. Select sysWipe to clear all RAID configuration information, which can travel with drives.
a. Wait for sysWipe to complete on both sides. sysWipe runs in the background and takes some time to complete, but it tells you when it’s done. Wait for the message that sysWipe has completed.
b. After sysWipe is finished on both controllers, power cycle the controller. 5. safeSysWipe returns quickly. 6. Relog into the controller, and use:
a. netCfgShow to see the current Ethernet configuration
Ethernet to D-LinkSwitch 192.168.200.110
Controller A to Brocade 4Gb Fiber Switch
pwr on off
85 Chan 1 Chan 2
ch1ch2ch3ch4 ch1ch2ch3ch412 3 4
pwr
on
off85
Chan 4Chan 3
ch1 ch2 ch3 ch4 ch1 ch2 ch3 ch4 1 2 3 4
Ethernet to D-Link Switch 192.168.200.111
1A 1B1A 1B
1B 1A 1B 1A
1A 1B1A 1B
1B 1A 1B 1A Empty
DS4800
EXP810s
1B 1A 1B 1A
1A 1B1A 1B
Empty
pwr
pwr
pwr
pwr
pwr
pwr
* Legend: 4Gb fiber cables
Ethernet Cables
Controller B to Brocade 4Gb Fiber Switch 2B 2A 2B 2A
2B 2A 2B 2A
2B 2A 2B 2A
2A 2B2A 2B
2B 2A2B 2A
2B 2A2B 2A

©IBM Corporation TPC-E Benchmark Full Disclosure Report – August 2007 15
b. netCfgSet to change the Ethernet configuration. i. Set the hostname and IP to suit your needs. (We used IP addresss
192.168.200.110 for the top controller and 192.168.200.111 for the bottom controller.)
After completing those steps on all of the DS4800s, start the IBM Storage Manager 9 Client on the x3500 and discover all the devices. In IBM Storage Manager 9 Client, do the following:
1. Doubleclick the DS4800 icon to open a window for that DS4800. 2. In the new window, sync the date/time on all the devices – right click on the DS4800 Icon – Set
Controller Clocks. 3. In the new window, disable any premium features – right click on the DS4800 Icon – Premium
Features - Disable 4. From the Enterprise Management Window: right click Tools – Execute Script – Load –
ds4800_setup.script (provided in the supportingFiles) 5. From Tools: right click Verify and Execute the ds4800_setup.script. This script sets the no FUA
bit, and makes it so that Microsoft Windows only sees one copy of each of the LUNs. 6. From the Enterprise Management Window: right click Tools – Load Configuration – “storage
system files.cfg” (provided in the supportingFiles). This loads the RAID array configurations. 2-drive RAID-1 array for the OS, 30-drive RAID-10 array for the database log. Ten 16-drive RAID-5 arrays for the database data.
The external storage subsystem is now ready. IBM BladeCenter The BladeCenter chassis comes with a management module. Run a crossover cable from the Management Module Ethernet port to the second port of the onboard Dual-Port Ethernet controller in the IBM System x3500, which is the Tier A machine. Looking from the back of the BladeCenter chasis:
1. Put the Brocade 4Gb SAN switch module in I/O module bay 3 (after removing the blank from that I/O module bay). I/O module bay 3 is on the top right beside the Management Module.
2. Remove the blank in I/O module bay 1, which is on the top left. Insert the Server Connectivity Module for BladeCenter in I/O module bay 1. Run an Ethernet cable from the Server Connectivity Module to the D-Link 8-port switch.
3. Run two 4Gb Fibre cables from the Brocade 4Gb SAN switch module to the DS4800. One Fibre cable plugs into the input for controller A (top controller) on the DS4800. The other Fibre cable plugs into the input for controller B (bottom controller) on the DS4800. Since we are only using one Brocade 4Gb SAN switch module in the BladeCenter, we are only using the first port on the QLogic 4Gb SFF Fibre Channel Expansion Card in the BladeCenter HS21 XM blade. Note: To use the second port on the QLogic 4Gb SFF Fibre Channel Expansion Card, another Brocade 4Gb SAN switch module would have to be inserted into I/O module bay 4; then the Fibre cable that goes from the top Brocade switch module to the input to controller B of the DS4800 could be moved to the bottom Brocade switch module. This would give added redundancy but at the cost of a second Brocade switch module.
On the x3500 (Tier A machine), which is connected via a crossover cable to the BladeCenter H Management Module, open a browser to http://192.168.70.125. This is the default IP address of the BladeCenter H Management Module. Log on to the Management Module using the default user ID of USERID and the default password of PASSW0RD. The “o” in password is a zero. Under I/O Module Tasks – Admin/Power/Restart – I/O Module Advance Setup – ensure that external ports are enabled for I/O Module 1 and I/O Module 3. This means that the BladeCenter HS21 XM that is connected to the Ethernet Switch and Fibre switch in I/O mModules 1 and 3 can communicate through the switches to devices outside the BladeCenter chasis.

©IBM Corporation TPC-E Benchmark Full Disclosure Report – August 2007 16
IBM BladeCenter HS21 XM The IBM BladeCenter HS21 XM comes with one Dual-Core Intel Xeon 5160 processor, two 512MB DIMMs, a SAS disk and a USB disk and an onboard dual-port Broadcom Ethernet card. Open the IBM BladeCenter HS21 XM, and perform these steps:
1. Install the second Dual-Core Intel Xeon 5160 Processor 2. Remove the two 512MB DIMMs and install eight 4GB DIMMs. 3. Remove the SAS disk. 4. Remove the USB disk. 5. Close the HS21 XM, and insert it in the first blade bay in the BladeCenter chassis. 6. At the top of the blade, press the switch to select the blade as the active blade, and press the switch
beside it to set this blade as the blade talking to the media tray. 7. Press the power switch on the HS21 XM blade to start it.
The latest firmware for the Broadcom Ethernet card that is onboard the HS21 XM and the x3500 can be downloaded from www.ibm.com. A bootable diskette containing the firmware can be made. Attach a USB floppy drive to the IBM BladeCenter’s media tray. Insert the bootable diskette containing the Broadcom firmware in the diskette drive. Boot the HS21 XM from the diskette. At the DOS prompt, run UPDATE 7995. Remove the diskette, and reboot the HS21 XM. Press F1 while the IBM BladeCenter HS21 XM is going through POST. This causes the server to drop into BIOS Setup. In BIOS Setup change the following from their default values:
1. Set the correct date and time 2. Use flat memory model 3. Disable Power Executive Power Capping 4. Enable Adjacent Sector Prefetch 5. Disable Hardware Prefetch 6. Disable CP1 Power State 7. Enable HPET timer 8. Disable planar SAS 9. Change PCI Device Boot Priority from Planar SAS to Daughter Card Slot 1 10. Disable USB Disk
Save the BIOS changes and restart the HS21 XM. During POST on the HS21 XM, when the QLogic banner is displayed, press Cctrl-Q. Change the following settings in Fast!UTIL:
1. Loop Reset Delay from 5 to 8 2. Connection Options from 2 to 1 (point-to-point) 3. Disable Fibre Channel Tape Support 4. Selectable boot enabled on first port and Operating System LUN selected 5. Selectable boot disabled on second port, BIOS disabled for second port 6. Execution Throttle set to 255 7. LUNs per Target from 128 to 0 8. Enable Target Reset from Yes to No 9. Login Retry Count from 8 to 30 10. Port Down Retry Count from 30 to 70 11. Link Down Timeout from 30 to 60 12. Interrupt Delay Timer from 0 to 10

©IBM Corporation TPC-E Benchmark Full Disclosure Report – August 2007 17
13. Operation Mode from 0 to 5 Save the settings and restart the HS21 XM. Put the Microsoft Windows Server 2003 Enterprise x64 Edition with SP1 CD in the DVD/CDROM drive in the BladeCenter’s media tray. Boot the HS21 XM from the CD. Press F6 when prompted by the Windows installation program to load the QLogic driver from diskette. The driver can be downloaded from www.ibm.com. During the operating system installation, select the per seat 9999 option. Install Service Pack 2 for Microsoft Windows Server 2003 Enterprise x64 Edition. After installing the operating system, install the onboard Broadcom Ethernet card’s device driver using the Broadcom-provided executable, which is run from a USB memory stick inserted into the BladeCenter’s media tray. The executable can be downloaded from www.ibm.com. After installing the Ethernet card’s device driver, set a static IP address (192.168.200.101) for the HS21 XM. Now customize the operating system as follows:. 1) Control Panel Settings:
a) System i) Advanced
(1) Performance (a) Visual effects: Adjust for best performance (b) Advanced
(i) Set for Background services & system cache (ii) Check page file settings
(2) Startup & Recovery (a) No administrative alert (b) No auto restart (c) No debugging information (d) If desired, lower the default 30 second boot.ini selection timeout
(3) Error Reporting (a) Disable, but notify when errors occur
ii) Auto Updates (1) Disable
iii) Remote (1) Disable Remote Assistance (2) Enable Remote Desktop (if you plan to use it)
b) Display
i) Ensure video performance troubleshooting slider all the way to the right ii) Turn screen saver off iii) Select “Always On” for power management. (If desired, set the monitor to be turned off after
30 minutes or so.) c) Sounds
i) “no sounds” sound scheme d) Internet Settings
i) Use blank homepage e) Folder options:
i) Don’t automatically search for network folder and printers ii) Show all files iii) Don’t hide file extensions iv) Don’t hide protected OS files v) Ensure that offline files are disabled
f) Date and Time

©IBM Corporation TPC-E Benchmark Full Disclosure Report – August 2007 18
i) Disable syncing time with Internet time server Regedit 1) HKLM\System\CurrentControlSet\Control\Session Manager\I/O System\
a) CountOperations (DWORD=0) [turns off some perf monitoring] 2) HKLM\System\CurrentControlSet\Control\Session Manager\Memory Management\
a) DontVerifyRandomDrivers (DWORD=1) b) LargeSystemCache (DWORD=0) c) DisablePagingExecutive (DWORD = 1)
i) 0 = kernel can be paged out ii) 1 = kernel can not be paged out
3) HKLM\System\CurrentControlSet\Services\TCPIP\Parameters\ a) MaxUserPort (DWORD = 40,000 Decimal, or higher)
4) HKLM\System\CurrentControlSet\Services\lanmanserver\parameters\Size (DWORD = 3)
Stop unneeded services and make them manual startup rather than automatic startup: 1. Automatic Updates 2. Computer Browser 3. Crytographic Services 4. DHCP Client 5. DNS Client 6. Error Reporting Service 7. Help and Support 8. IPSEC Services 9. Print Spooler 10. Remote Registry Service 11. Wireless Configuration
Disable Windows 2003 Shutdown Event Tracker and Autoplay:
1. Go into Group Policy Object Editor (Start -> Run -> gpedit.msc) 2. Browse to Computer Configuration -> Administrative Templates -> System 3. In the right window pane, double click on "Display Shutdown Event Tracker" 4. You'll see the disable choice- select it and you are DONE! 5. Now in the right window pane, double click on "Turn off Autoplay" 6. Enable for “All Drives” (which disables Autoplay)
SQL Server Installation Install Microsoft SQL Server 2005 Enterprise x64 Edition, apply Service Packs 1 and 2 for SQL Server. Select the binary sort order. Mount Points and Disk Partitions
1. In a command window, create mount points: • c: • cd \ • md mp • cd mp • md b1 • md b2 • md b3 • md b4 • md b5 • md b6 • md b7 • md b8

©IBM Corporation TPC-E Benchmark Full Disclosure Report – August 2007 19
• md b9 • md b10 • md c1 • md c2 • md c3 • md c4 • md c5 • md c6 • md c7 • md c8 • md c9 • md c10
2. Open Windows Disk Manager.
3. If the Wizard prompts you to initialize disks do so, don't upgrade the disks.
4. Create an extended partition on disks 1 through 11. 5. On disk 1:
• Create a logical partition with size 400000MB, assign drive letter E:, do not format the partition.
• Create a logical partition using up the rest of the disk space, assign drive letter F: and this partition should be NTFS formatted.
6. On disks 2 through 11:
• Create a logical partition with size 75000MB, assign mount point c:\mp\b* to the partition. Where * is 1 for disk 2, 2 for disk 3 and so on. The partition should not be formatted.
• Create a logical partition with size 25000MB, assign mount point c:\mp\c* to the partition. Where * is 1 for disk 2, 2 for disk 3 and so on. The partition should not be formatted.
• Create a logical partition using up the rest of the disk space, assign drive letter G: through P: as you go from disk 2 to disk 11, this partition should be NTFS formatted.
7. Close Windows Disk Manager: the disk partitions for the database have been created.
SQL Server configuration Start Microsoft SQL Server from the command line using StartSQLMorgan.bat (the file is included in the supporting files). Run runconfig.sql to set the SQL Server sp_configure settings (the file is included in the supporting files). Run growTempDB.sql to increase the size of the temporary database which is used during database load (the file is included in the supporting files).

©IBM Corporation TPC-E Benchmark Full Disclosure Report – August 2007 20
Clause 2 –Database Design, Scaling and Population Related Items Database Creation and Table Definitions A description of the steps taken to create the database for the Reported Throughput must be reported in the Report. Create a folder 85000.cust\database. In the folder create a create_database.sql script to create a TPCE database with two filegroups. One filegroup called broker_fg for the Broker related TPC-E tables and the other filegroup called customer_fg for all the other TPC-E tables. broker_fg uses all the c:\mp\b* disk partitions. customer_fg uses all the c:\mp\c* disk partitions. The database log is on E:. Modify the Microsoft provided files:
• Create_Tables_Fixed.sql • Create_Tables_Scaling.sql • Create_Clustered_Indexes_Fixed.sql • Create_Clustered_Indexes_Scaling.sql • Create_NC_Indexes_Fixed.sql • Create_NC_Indexes_Scaling.sql
by replacing misc_fg and market_fg with customer_fg. Run the Microsoft provided file TPCE_Setup.cmd to start the database load (the file is included in the supporting files). Fill in 85000 for the number of customers to be loaded when prompted. TPCE_Setup.cmd calls files that are included in the supporting files to create and load the TPC-E database. Database Physical Organization The physical organization of tables and indexes within the database must be reported in the Report. Physical space was allocated to Microsoft SQL Server 2005 on the server disks as detailed in Table 2-2. Horizontal/Vertical Partitioning While there are few restrictions placed upon horizontal or vertical partitioning of tables and rows in the TPC-E benchmark, any such partitioning must be reported. Partitioning was not used in this benchmark. However the TPC-E tables were distributed over multiple disk arrays by SQL Server because the file groups were spread over ten disk arrays. Replication Replication of tables, if used, must be reported in the Report. Replication was not used in this benchmark.

©IBM Corporation TPC-E Benchmark Full Disclosure Report – August 2007 21
Table Attributes Additional and/or duplicated attributes in any table must be reported in the Report along with a statement on the impact on performance (see Clause Error! Reference source not found.). No additional attributes were used in this benchmark.
Cardinality of Tables The cardinality (e.g., the number of rows) of each table, as it existed after the database load (see Clause 2.6), must be reported in the Report. The database was built with 85,000 customers.

©IBM Corporation TPC-E Benchmark Full Disclosure Report – August 2007 22
Table 2-1. Initial Cardinality of Tables
Table Name Rows ACCOUNT_PERMISSION 603,413
ADDRESS 127,504 BROKER 850 CASH_TRANSACTION 1,351,304,762
CHARGE 15
COMMISSION_RATE 240 COMPANY 42,500 COMPANY_COMPETITOR 127,500
CUSTOMER 85,00 CUSTOMER_ACCOUNT 425,000 CUSTOMER_TAXRATE 170,000 DAILY_MARKET 75,983,625 EXCHANGE 4 FINANCIAL 850,000
HOLDING 75,285,552 HOLDING_HISTORY 1,968,360,153 HOLDING_SUMMARY 4,229,765 INDUSTRY 102 LAST_TRADE 58,225 NEWS_ITEM 85,000
NEWS_XREF 85,000 SECTOR 12 SECURITY 58,225 SETTLEMENT 1,468,800,000 STATUS_TYPE 5 TAXRATE 320
TRADE 1,468,800,000 TRADE_HISTORY 3,525,148,661 TRADE_REQUEST 0 TRADE_TYPE 5 WATCH_ITEM 8,471,094 WATCH_LIST 85,000
ZIP_CODE 14,741 Distribution of Tables and Logs The distribution of tables, partitions and logs across all media must be explicitly depicted for the measured and priced configurations.

©IBM Corporation TPC-E Benchmark Full Disclosure Report – August 2007 23
The IBM BladeCenter HS21 XM only has slots for one QLogic 4Gb SFF Fibre Channel Expansion card. That card has two ports. We are only using one of the ports. That port is connected to a single IBM System Storage DS4800, which has two controllers - the top controller A and the bottom controller B. All the drives are 36.4GB 15K rpm 4Gb Fibre Channel drives. Figure 2-2 depicts the database configuration of the measured and priced systems to meet the 8-hour steady state requirement. Table 2-2. Data Distribution for the Benchmarked and Priced Configuration
Disk # Controller #
Slot # Drives Enclosure model
RAID level
Partition/file system
Size Use
0 A N/A 2 X 36.4GB EXP810 Enclosure
RAID 1
C: (NTFS) 33.39GB OS Drive
1 A N/A 30 X 36.4GB EXP810 Enclosure
RAID 10
E: (RAW) F: (NTFS)
400,000MB 110.38GB
DB Log Not used
2 A N/A 16 X 36.4GB EXP810 Enclosure
RAID 5
c:\mp\b5 (RAW) c:\mp\c5 (RAW)
K: (NTFS)
75,000MB
25,000MB
403.34GB
Broker 5
Customer 5
Not used
3 A N/A 16 X 36.4GB EXP810 Enclosure
RAID 5
c:\mp\b1 (RAW) c:\mp\c1 (RAW)
G: (NTFS)
75,000MB
25,000MB
403.34GB
Broker 1
Customer 1
MDF File and extra Temp DB
file
4 A N/A 16 X 36.4GB EXP810 Enclosure
RAID 5
c:\mp\b2 (RAW) c:\mp\c2 (RAW)
H: (NTFS)
75,000MB
25,000MB
403.34GB
Broker 2
Customer 2
Backup 1
5 A N/A 16 X 36.4GB EXP810 Enclosure
RAID 5
c:\mp\b3 (RAW) c:\mp\c3 (RAW)
I: (NTFS)
75,000MB
25,000MB
403.34GB
Broker 3
Customer 3
Backup 2
6 A N/A 16 X 36.4GB EXP810 Enclosure
c:\mp\b4 (RAW)
75,000MB
Broker 4

©IBM Corporation TPC-E Benchmark Full Disclosure Report – August 2007 24
RAID 5 c:\mp\c4 (RAW)
J: (NTFS)
25,000MB
403.34GB
Customer 4
Backup 3
7 B N/A 16 X 36.4GB EXP810 Enclosure
RAID 5
c:\mp\b6 (RAW) c:\mp\c6 (RAW)
L: (NTFS)
75,000MB
25,000MB
403.34GB
Broker 6
Customer 6
Not used
8 B N/A 16 X 36.4GB EXP810 Enclosure
RAID 5
c:\mp\b7 (RAW) c:\mp\c7 (RAW)
M: (NTFS)
75,000MB
25,000MB
403.34GB
Broker 7
Customer 7
Not Used
9 B N/A 16 X 36.4GB EXP810 Enclosure
RAID 5
c:\mp\b8 (RAW) c:\mp\c8 (RAW)
N: (NTFS)
75,000MB
25,000MB
403.34GB
Broker 8
Customer 8
Backup 8
10 B N/A 16 X 36.4GB EXP810 Enclosure
RAID 5
c:\mp\b9 (RAW) c:\mp\c9 (RAW)
O: (NTFS)
75,000MB
25,000MB
403.34GB
Broker 9
Customer 9
Backup 5
11 B N/A 16 X 36.4GB EXP810 Enclosure
RAID 5
c:\mp\b10 (RAW)
c:\mp\c10 (RAW)
P: (NTFS)
75,000MB
25,000MB
403.34GB
Broker 10
Customer 10
Backup 6
Database Interface and Model Implemented
A statement must be provided in the Report that describes:
• The Database Interface (e.g., embedded, call level) and access language (e.g., SQL, COBOL read/write) used to implement the TPC-E Transactions. If more than one interface / access language is used to implement TPC-E, each interface / access language must be described and a list of which interface /access language is used with which Transaction type must be reported.
• The data model implemented by the DBMS (e.g., relational, network, hierarchical).
Microsoft SQL Server 2005 Enterprise Edition is a relational database. The interface used was Microsoft SQL Server stored procedures accessed with Remote Procedure Calls embedded in C++ code using the Microsoft ODBC interface.

©IBM Corporation TPC-E Benchmark Full Disclosure Report – August 2007 25
Database Load Methodology The methodology used to load the database must be reported in the Report. The database was loaded using the –l ODBC option on the EGenLoader command line. This direct loads into a Microsoft SQL Server Database. A further description is provided in the SupportingFiles in the file MSTPCE Database Setup Reference.pdf.

©IBM Corporation TPC-E Benchmark Full Disclosure Report – August 2007 26
Clause 3 – Transaction Related Items Vendor-Supplied Code A statement that vendor-supplied code is functionally equivalent to Pseudo-code in the specification (see Clause 3.2.1.5) must be reported. The SQL in the stored procedures for the transactions is functionally equivalent to the pseudo-code. Database Footprint of Transactions A statement that the database footprint requirements (as described in Clause 3.3) were met must be reported. . The database footprint requirements are met by the stored procedure code for the transactions.

©IBM Corporation TPC-E Benchmark Full Disclosure Report – August 2007 27
Clause 4 – SUT, Driver and Network Related Items EGen Instances The number of EGenDriverMEE and EGenDriverCE instances used in the benchmark must be reported (see Clause 4.1.3). One EGenDriverCE with 150 threads was used in the benchmark. One EGenDriverMEE with a dynamic number of threads that reaches a steady number of threads during the benchmark was used. Network Configuration The Network configurations of both the measured and priced configurations must be described and reported. This includes the mandatory Network between the Driver and Tier A (see Clause 4.2.2) and any optional Database Server interface networks (see Clause 4.1.3.12). The Network configurations of both the measured and priced configurations were the same. The Driver machine used one of the ports on the onboard dual-port Gigabit Ethernet card. The port’s IP address was 192.168.200.13. The port was connected to a D-Link switch via an Ethernet cable. Another Ethernet cable ran from the D-Link Switch to a port on the onboard dual-port Gigabit Ethernet card in the IBM System x3500 machine that was used as the Tier A machine. That port was configured with the IP address 192.168.200.7. The network connection between the port with IP address 192.168.200.13 on the Driver and the port with IP address 192.168.200.7 on the Tier A machine was the mandatory network. There was also a network connection between the Tier A machine and the Tier B machine. The Tier B machine was the IBM BladeCenter HS21 XM. One of the ports on the HS21 XM’s onboard dual-port Ethernet card was configured with IP address 192.168.200.101 and was connected via the BladeCenter backplane to the Ethernet switch module in the back of the BladeCenter. This switch module had an Ethernet cable that ran to the D-Link switch. Tier A used ODBC calls to Tier B.

©IBM Corporation TPC-E Benchmark Full Disclosure Report – August 2007 28
Clause 5 – EGen Related Items EGen Version The version of EGen used in the benchmark must be reported (see Clause 5.3.1). EGen v1.2.0 was used in the benchmark. EGen Code and Modifications A statement that all required TPC-provided EGen code was used in the benchmark must be reported. If the Test Sponsor modified EGen, a statement EGen has been modified must be reported in the Report. All formal waivers from the TPC documenting the allowed changes to EGen must also be reported. If any of the changes to EGen do not have a formal waiver, that must also be reported. If the Test Sponsor extended EGenLoader, the use of the extended EGenLoader and the audit of the extension code by an Auditor must be reported (see Clause 5.7.3). All required TPC-provided EGen code was used in the benchmark. EGen was not modified for use in this benchmark. EGenLoader was not extended for this benchmark.

©IBM Corporation TPC-E Benchmark Full Disclosure Report – August 2007 29
Clause 6 – Performance Metrics and Response Time Related Items Measured Throughput The Measured Throughput must be reported (see Clause 6.7.1.2). Measured tpsE: 169.59 tpsE Price per tpsE: $ 1,897.66 USD per tpsE Throughput vs. Elapsed Time for Trade-Result Transaction A Test Run Graph of throughput versus elapsed wall clock time must be reported for the Trade-Result Transaction (see Clause 6.7.2).
Test Run Graph
0
20
40
60
80
100
120
140
160
180
200
0 20 40 60 80 100 120 140 160 180 200 220 240
Elapsed Time in Minutes
tpsE
MI Start MI End
Ramp-up Ramp-downSteady State
Figure 6-1. Test Run Graph Steady State Methodology The method used to determine that the SUT had reached a Steady State prior to commencing the Measurement Interval must be reported. During the run, observation of the tpsE as the benchmark ran was used to determine steady state. After the run steady state was confirmed by looking at the Test Run Graph and verifying that tpsE was steady prior to commencing the Measurement Interval.

©IBM Corporation TPC-E Benchmark Full Disclosure Report – August 2007 30
Work Performed during Steady State A description of how the work normally performed during a Test Run, actually occurred during the Measurement Interval must be reported (e.g., checkpointing, writing Undo/Redo Log records). Checkpoints were run once every seven and a half minutes. Transaction Statistics The recorded averages over the Measurement Interval for each of the Transaction input parameters specified by clause 6.4.1 must be reported.

©IBM Corporation TPC-E Benchmark Full Disclosure Report – August 2007 31
Table 6-1. Transaction Statistics
Input Parameter Value Actul Pct Required Range
Customer-Position
by_tax_id 1 50.03% 48% to 52%
get_history 1 50.00% 48% to 52%
Market-Watch
Watch list 59.99% 57% to 63%
Account ID 34.98% 33% to 37% Securities chosen by
Industry 5.02% 4.5% to 5.5%
Security-Detail
access_lob 1 1.02% 0.9% to 1.1%
Trade-Lookup
1 29.99% 28.5% to 31.5%
2 29.98% 28.5% to 31.5%
3 30.01% 28% to 31.5% frame_to_execute
4 10.02% 9.5% to 10.5%
Trade-Order
Transactions requested by a third party 9.96% 9.5% to 10.5%
Security chosen by company name and issue 39.97% 38% to 42%
type_is_margin 1 7.97% 7.5% to 8.5%
roll_it_back 1 0.99% 0.94% to 1.04% (*)
is_lifo 1 35.02% 33% to 37%
100 25.08% 24% to 26%
200 25.01% 24% to 26%
400 24.94% 24% to 26% trade_qty
800 24.97% 24% to 26%
TMB 29.98% 29.7% to 30.3%
TMS 30.05% 29.7% to 30.3%
TLB 19.99% 19.8% to 20.2%
TLS 9.97% 9.9% to 10.1%
trade_type
TSL 10.01% 9.9% to 10.1%
Trade-Update
1 33.14% 31% to 35%
2 33.09% 31% to 35% frame_to_execute
3 33.77% 32% to 36%

©IBM Corporation TPC-E Benchmark Full Disclosure Report – August 2007 32
Clause 7 – Transaction and System Properties Related Items The ACID (Atomicity, Consistency, Isolation, and Durability) properties of transaction processing systems must be supported by the System Under Test during the running of this benchmark. It is the intent of this section to define the ACID properties informally and to specify a series of tests that must be performed to demonstrate that these properties are met. Atomicity Requirements The system under test must guarantee that database transactions are atomic; the system will either perform all individual operations on the data, or will assure that no partially completed operations leave any effects on the data. All ACID tests were conducted according to specification. The following steps were performed to verify the Atomicity of the Trade-Order transactions. Perform a market Trade-Order Transaction with the roll_it_back flag set to false. Verify that the appropriate rows have been inserted in the TRADE and TRADE_HISTORY tables. Perform a market Trade-Order Transaction with the roll_it_back flag set to true. Verify that no rows associated with the rolled back Trade-Order have been added to the TRADE and TRADE_HISTORY tables. Execution of Atomicity Tests
1. Open a command prompt. 2. Change to mstpce.1.2.0\ACID\Atomicity directory. 3. Run Atomicity.cmd 4. The output will be in Atomicity_C.out and Atomicity_RB.out
Atomicity.cmd runs a Trade-Order with a commit and notes the new T_ID. Then it does a select on TRADE and TRADE_HISTORY to return the rows in those tables with the new T_ID. Atomicity.cmd runs a Trade-Order with a roll back and notes the new T_ID. Then it does a select on TRADE and TRADE_HISTORY to return the rows in those tables with the new T_ID. No rows should be returned. Consistency Requirements Consistency is the property of the application that requires any execution of a database transaction to take the database from one consistent state to another. A TPC-E database when first populated by EGenLoader must meet these consistency conditions. The three consistency conditions must be tested after initial database population and after any Business Recovery tests. Consistency conditions one through three were tested using a batch file to issue queries to the database after the database was loaded and after the Business Recovery Test. The results of the queries demonstrated that the database was consistent for all three tests. The specific procedure was:
1. Open a command prompt. 2. Change to the MSTPCE.1.2.0\ACID\Consistency directory.

©IBM Corporation TPC-E Benchmark Full Disclosure Report – August 2007 33
3. Run Consistency.cmd 4. The output will be in Consistency.out
Entries in the BROKER and TRADE tables must satisfy the relationship: B_NUM_TRADES = count(*) For each broker defined by: (B_ID = CA_B_ID) and (CA_ID = T_CA_ID) and (T_ST_ID = ‘CMPT’) Entries in the BROKER and TRADE tables must satisfy the relationship: B_COMM_TOTAL = SUM(T_COMM) For each broker defined by: (B_ID = CA_B_ID) and (CA_ID = T_CA_ID) and (T_ST_ID = ‘CMPT’) Entries in the HOLDING_SUMMARY and HOLDING tables must satisfy the relationship: HS_QTY = sum(H_QTY) For each holding summary defined by: (HS_CA_ID = H_CA_ID) and (HS_S_SYMB = H_S_SYMB)

©IBM Corporation TPC-E Benchmark Full Disclosure Report – August 2007 34
Isolation Requirements Systems that implement Transaction isolation using a locking and/or versioning scheme must demonstrate compliance with the isolation requirements by executing the tests described in Clause 7.4.2.
Execution of Isolation Test #1 (P3 Test in Read-Write) The isolation tests require that you use the SQL Server Management Studio. You are required to copy values from one session to another and the Management Studio facilitates this. The instructions below assume that you are using the Management Studio.
1. Open the SQL Server Management Studio. 2. Open MSTPCE.100\ACID\Isolation\Scripts\Isolation1_S1.sql in the Management Studio. When
prompted, connect to you database server. 3. Click on Query/Results To/Results to Text in the menu bar. 4. Open MSTPCE.100\ACID\Isolation\Scripts\Isolation1_S2.sql in the Management Studio. When
prompted, connect to you database server. 5. Click on Query/Results To/Results to Text in the menu bar. 6. Open MSTPCE.100\ACID\Isolation\Scripts\Isolation1_S3.sql in the Management Studio. When
prompted, connect to you database server. 7. Click on Query/Results To/Results to Text in the menu bar. 8. Open MSTPCE.100\ACID\Isolation\Scripts\Isolation1_S4.sql in the Management Studio. When
prompted, connect to you database server. 9. Click on Query/Results To/Results to Text in the menu bar. 10. Execute Isolation1_S1. 11. Scroll to the bottom of the Results window and record the “Trade ID Returned.” 12. Copy the Customer Account Used to the @acct_id variable near the top of Isolation1_S2. 13. Copy the Symbol Used to the @symbol variable near the top of Isolation1_S2. 14. Execute Isolation1_S2. 15. Scroll to the bottom of the Results window and record the “Trade ID Returned.” 16. Copy the Trade ID Used in the Isolation1_S1 results window to the @trade_id variable near the
top of Isolation1_S3. 17. Copy the Trade ID Used in the Isolation1_S2 results window to the @trade_id variable near the
top of Isolation1_S4. 18. Execute Isolation1_S3 and then immediately execute Isolation1_S4. Note, the SQL code and the
instrumented stored procedure will do the appropriate pausing as required in the specification.
Verification of Isolation Test #1 (P3 Test in Read-Write) 1. Record the “Holding Summary After First Execution of Trade Result Frame 1”: value of HS_QTY.
This is found near the top of the results window of Isolation1_S3. Verify that this is set to 0. 2. Record the “Holding Summary After Second Execution of Trade Result Frame 1”: value of
HS_QTY. This is found near the top of the results window of Isolation1_S3. Verify that this is set to 0.
3. Record the “Holding Summary After Trade Result Frame 1”: value of HS_QTY. This is found near the top of the results window of Isolation1_S4. Verify that this is set to 0.
4. The Trade-Result in S4 completed and the Trade-Result in S3 was selected as a deadlock victim.
Execution of Isolation Test #2 (P2 Test in Read-Write) The isolation tests require that you use the SQL Server Management Studio. You are required to copy values from one session to another and the Management Studio facilitates this. The instructions below assume that you are using the Management Studio.
1. Open the SQL Server Management Studio.

©IBM Corporation TPC-E Benchmark Full Disclosure Report – August 2007 35
2. Open MSTPCE.100\ACID\Isolation\Scripts\Isolation2_S1.sql in the Management Studio. When prompted, connect to you database server.
3. Click on Query/Results To/Results to Text in the menu bar. 4. Open MSTPCE.100\ACID\Isolation\Scripts\Isolation2_S2.sql in the Management Studio. When
prompted, connect to you database server. 5. Click on Query/Results To/Results to Text in the menu bar. 6. Open MSTPCE.100\ACID\Isolation\Scripts\Isolation2_S3.sql in the Management Studio. When
prompted, connect to you database server. 7. Click on Query/Results To/Results to Text in the menu bar. 8. Open MSTPCE.100\ACID\Isolation\Scripts\Isolation2_S4.sql in the Management Studio. When
prompted, connect to you database server. 9. Click on Query/Results To/Results to Text in the menu bar. 10. Execute Isolation2_S1. 11. Scroll to the bottom of the Results window of Isolation2_S1 and record the “Holding Summary
Quantity” and the “Trade ID Returned”. 12. Copy the Customer Account Used from the Results window of Isolation2_S1 to the @acct_id
variable near the top of Isolation2_S2. 13. Copy the Symbol Used from the Results window of Isolation2_S1 to the @symbol variable near
the top of Isolation2_S2. 14. Execute Isolation2_S2. 15. Scroll to the bottom of the Results window of Isolation2_S2 and record the Trade ID Returned. 16. Copy the Trade ID Used in the Isolation2_S1 results window to the @trade_id variable near the
top of Isolation2_S3. 17. Copy the Trade ID Used in the Isolation2_S2 results window to the @trade_id variable near the
top of Isolation2_S4. 18. Execute Isolation2_S3 and then immediately execute Isolation2_S4. Note, the SQL code and the
instrumented stored procedure will do the appropriate pausing as required in the specification
Verification of Isolation Test #2 (P2 Test in Read-Write) 1. Record the “Holding Summary After First Execution of Trade Result Frame 1”: value of HS_QTY.
This is found near the top of the results window of Isolation2_S3. 2. Record the “Holding Summary After Second Execution of Trade Result Frame 1”: value of
HS_QTY. This is found near the top of the results window of Isolation2_S3. This value should match the value returned in number 1 above.
3. Record the “Holding Summary After Trade Result Frame 1”: value of HS_QTY. This is found near the top of the results window of Isolation2_S4. This value should match the value returned in number 1 above.
4. The Trade-Result in S3 should run to completion. The Trade-Result in S4 may be selected as a deadlock victim.
Execution of Isolation Test #3 (P1 Test in Read-Write) The isolation tests require that you use the SQL Server Management Studio. You are required to copy values from one session to another and the Management Studio facilitates this. The instructions below assume that you are using the Management Studio.
1. Open the SQL Server Management Studio. 2. Open MSTPCE.100\ACID\Isolation\Scripts\Isolation3_S1.sql in the Management Studio. When
prompted, connect to you database server. 3. Click on Query/Results To/Results to Text in the menu bar. 4. Open MSTPCE.100\ACID\Isolation\Scripts\Isolation3_S2.sql in the Management Studio. When
prompted, connect to you database server. 5. Click on Query/Results To/Results to Text in the menu bar. 6. Open MSTPCE.100\ACID\Isolation\Scripts\Isolation3_S3.sql in the Management Studio. When
prompted, connect to you database server. 7. Click on Query/Results To/Results to Text in the menu bar.

©IBM Corporation TPC-E Benchmark Full Disclosure Report – August 2007 36
8. Execute Isolation3_S1. This script will initiate the Customer Position and execute two Trade Orders for the remainder of this isolation test to access.
9. Scroll to the bottom of the Results window of Isolation3_S1 and record the “Customer ID Used” and the “Customer Account Balance.”
10. Copy the first Trade ID Returned from Isolation3_S1 to the top of Isoaltion3_S2.sql. 11. Copy the Customer Account Used from Isolation3_S1 to the top of Isoaltion3_S2.sql. 12. Copy the second Trade ID Returned from Isolation3_S1 to the top of Isoaltion3_S3.sql. 13. Copy the Customer Account Used from Isolation3_S1 to the top of Isoaltion3_S3.sql. 14. Execute Isolation3_S2, then immediately execute Isolation3_S3. Note, the SQL code and the
instrumented stored procedure will do the appropriate pausing as required in the specification. 15. Scroll to the bottom of the Results window of Isolation3_S2 and record the Customer Account
Balance and the Settlement Amount. 16. Scroll to the bottom of the Results window of Isolation3_S3 and record the Customer Account
Balance and the Settlement Amount.
Verification of Isolation Test #3 (P1 Test in Read-Write) 1. Record the Customer Account Balance from the bottom of the Results window of Isolation3_S1. 2. Record the Customer Account Balance and the Settlement Amount from the bottom of the Results
window of Isolation3_S2. 3. Record the Customer Account Balance and the Settlement Amount from the bottom of the Results
window of Isolation3_S3. 4. Since the Trade Result in Isolation3_S3 blocks until Isolation3_S2 completes, you may verify the
results as follows: a. CA_BAL (from Isolation3_S1) + Settlement Amount (from Isolation3_S2 ) + Settlement
Amount (from Isolation3_S3) = Customer Account Balance (from Isoaltion3_S3) 5. Note, this verification deviates from the specification since the current specification does not take
into account that the Trade Result in S3 WILL block waiting on the Trade Result in S2.
Execution of Isolation Test #4 (P1 Test in Read-Only) The isolation tests require that you use the SQL Server Management Studio. You are required to copy values from one session to another and the Management Studio facilitates this. The instructions below assume that you are using the Management Studio.
1. Open the SQL Server Management Studio. 2. Open MSTPCE.100\ACID\Isolation\Scripts\Isolation4_S1.sql in the Management Studio. When
prompted, connect to you database server. 3. Click on Query/Results To/Results to Text in the menu bar. 4. Open MSTPCE.100\ACID\Isolation\Scripts\Isolation4_S2.sql in the Management Studio. When
prompted, connect to you database server. 5. Click on Query/Results To/Results to Text in the menu bar. 6. Open MSTPCE.100\ACID\Isolation\Scripts\Isolation4_S3.sql in the Management Studio. When
prompted, connect to you database server. 7. Click on Query/Results To/Results to Text in the menu bar. 8. Execute Isolation4_S1. This script will initiate the Customer Position and execute a Trade Order
for the remainder of this isolation test to access. 9. Scroll to the bottom of the Results window of Isolation4_S1 and record the “Customer ID Used,”
“Customer Account Used,” “Customer Account Balance,” and the “Trade ID Returned.” 10. Copy the “Customer Account Used” from the Results window of Isolation4_S1 to the @acct_id
variable near the top of Isolation4_S2. 11. Copy the “Trade ID Returned” from the Results window of Isolation4_S1 to the @trade_id
variable near the top of Isolation4_S2. 12. Copy the “Customer ID” from the Results window of Isolation4_S1 to the @cust_id variable near
the top of Isolation4_S3.
13. Copy the “Customer Account Used” from the Results window of Isolation4_S1 to the @acct_id variable near the top of Isolation4_S3.

©IBM Corporation TPC-E Benchmark Full Disclosure Report – August 2007 37
14. Execut Isolation4_S2 and after a few seconds to make sure Isolation4_S2 has started execute Isolation4_S3.
Verification of Isolation Test #4 (P1 Test in Read-Only) 1. Record the Customer Account Balance from the bottom of the Results window of Isolation4_S1. 2. Record the Customer Account Balance and the Settlement Amount from the bottom of the Results
window of Isolation4_S2. 3. Record the Customer Account Balance from the bottom of the Results window of Isolation4_S3. 4. Since the Customer Position in Isolation4_S3 blocks until Isolation4_S2 completes, you may
verify the results as follows: a. CA_BAL (from Isolation4_S1) + Settlement Amount (from Isolation4_S2 ) = Customer
Account Balance (from Isoaltion4_S3) 5. Note, this verification deviates from the specification since the current specification does not take
into account that the Customer Position in S3 WILL block waiting on the Trade Result in S2. Durability Requirements The tested system must guarantee durability: the ability to preserve the effects of committed transactions and ensure database consistency after recovery from any one of the failures listed in Clauses 7.5.2.2, 7.5.2.3 and 7.5.2.4. v Permanent irrecoverable failure of any single durable medium v Instantaneous interruption (system crash/system hang) in processing that requires system reboot to
recover v Failure of all or part of memory (loss of contents) v Loss of all external power to the SUT for an indefinite time period (power failure). This must include at
least all portions of the SUT that participate in the database portions of Transactions.
Durability Test for Data Accessibility This benchmark result used Redundancy Level 1. To prove Redundancy Level 1, the following steps were successfully performed.The test for Redundancy Level 1 is the test for Permanent Irrecoverable Failure of any single Durable Medium.
1. Determine the current number of completed trades in the database by running: select count(*) as count1 from SETTLEMENT
2. Start submitting Transactions and ramp up to the Durability Throughput Requirements (as defined in Clause 7.5.3) and satisfy those requirements for at least 5 minutes.
3. Induce the failure described for the redundancy level being demonstrated. In this case fail a disk in a database data array, and fail a disk in the database log array. Transactions should continue processing since the database log array has mirrored drives and the database data array uses RAID-5.
4. Begin the necessary recovery process, by replacing the failed drives in the database log array and the database data array. A rebuild on each replaced drive should start automatically.
5. Continue running the Driver for 20 minutes. 6. Terminate the run gracefully from the Driver. 7. Retrieve the new number of completed trades in the database by running: select count(*) as
count2 from SETTLEMENT 8. Compare the number of executed Trade-Result Transactions on the Driver to (count2 – count1).
Verify that (count2 - count1) is equal to the number of successful Trade-Result Transaction records in the Driver log file.
9. Allow recovery process to complete as needed.

©IBM Corporation TPC-E Benchmark Full Disclosure Report – August 2007 38
Following is a graph of the measured throughput versus elapsed time that must be reported for the run portions of the Data Accessibility tests:
Data Accessibility Graph
0
20
40
60
80
100
120
140
160
180
200
0 10 20 30 40 50 60 70
Elapsed Time in Minutes
tpsE
20 minutes
95% of reported tpsE
Start Steady StatePull data disk Replace disks
Pull log disk
Figure 7-1. Data Accessibility Graph
Durability Test Procedure for Catastrophic Failures The tests for “Instantaneous interrupt,” “Failure of all or part of memory,” and “Loss of external power to the SUT” were combined. Note: A UPS has been priced for the SUT. The following steps were successfully performed to meet the Durability Throughput Requirements of Clause 7.5.3:
1. Determine the current number of completed trades in the database by running: select count(*) as count1 from SETTLEMENT
2. Start submitting Transactions and ramp up to the Durability Throughput Requirements (as defined in Clause 7.5.3) and satisfy those requirements for at least 20 minutes.
3. Induce all of the Catastrophic failures, in Clause 7.5.2.2, 7.5.2.3 and 7.5.2.4, by pulling out the IBM BladeCenter HS21 XM from the IBM BladeCenter. At the same time remove the power cord from the back of the x3500 to fail the Tier A machine at the same time as the Tier B machine.
4. Stop the Driver. 5. Re-insert and restart the IBM BladeCenter HS21 XM. Re-power and restart the x3500. 6. On the HS21 when Windows has started run StartSQLMorgan.bat to start SQL Server and
database recovery. SQL Server writes timestamps out to the errorlog when it is started. This timestamp can be used as the time when Business Recovery starts (see Clause 7.5.6.4).
7. Once the SUT will accept Transactions, start submitting Transactions and ramp up to a Durability Throughput Requirements (as defined in Clause 7.5.3) and satisfy those requirements for at least 20 minutes.
8. Note this time as the end of Business Recovery (see Clause 7.5.6.6).

©IBM Corporation TPC-E Benchmark Full Disclosure Report – August 2007 39
9. Terminate the Driver gracefully. 10. Verify that no errors were reported by the Driver during steps 7 through 9. 11. Retrieve the new number of completed trades in the database by running: select count(*) as count2
from SETTLEMENT 12. Compare the number of completed Trade-Result Transactions on the Driver to (count2 – count1).
Verify that (count2 - count1) is greater or equal to the aggregate number of successful Trade-Result Transaction records in the Driver log file for the runs performed in step 2 and step 7. If there is an inequality, the SETTLEMENT table must contain additional records and the difference must be less than or equal to the maximum number of Transactions which can be simultaneously in-flight from the Driver to the SUT. This number is specific to the implementation of the Driver and configuration settings at the time of the crash.
13. Verify consistency conditions as specified in Clause 7.3.1.1. The Business Recovery Time was 03:48:08 Following is a graph of the measured throughput versus elapsed time that must be reported for the run portions of the Business Recover Time test:
Business Recovery Time Graph
0
20
40
60
80
100
120
140
160
180
1 7 13 19 25 31 37 43 49 55 61 67 73 79 85 91 97 103 109 115 121 127 133 139 145 151 157 163 169 175 181 187 193 199 205 211 217 223 229 235 241 247 253 259
Elapsed Time in Minutes
tpsE
Pre-Failure RunPost-Failure95% of Reported tpsE
Figure 7-2. Business Recovery Time Graph
©IBM Corporation TPC-E Benchmark Full Disclosure Report – August 2007 40
TPC-E Disk Space Requirements
Customers Used 85,000 Performance 169.59 TpsEBroker File Group Initial Rows Data (KB) Index size (KB) Extra 5% (KB) Total + 5% (KB) After run (KB) Growth (KB)
BROKER 850 48 112 8 168 216 56
CASH_TRANSACTION 1,351,304,762 132,500,512 280,160 6,639,034 139,419,706 136,674,008 3,893,336
CHARGE 15 8 8 1 17 16 -
COMMISSION_RATE 240 16 16 2 34 32 -
SETTLEMENT 1,468,800,000 72,080,368 152,592 3,611,648 75,844,608 75,823,616 3,590,656
TRADE 1,468,800,000 161,646,024 86,507,720 12,407,687 260,561,431 254,555,184 6,401,440
TRADE_HISTORY 3,525,148,661 101,079,552 263,592 5,067,157 106,410,301 101,763,408 420,264
TRADE_REQUEST - - - - - 3,728 3,728
TRADE_TYPE 5 8 1,032 52 1,092 1,040 -
Customer File GroupACCOUNT_PERMISSION 603,413 60,352 384 3,037 63,773 60,736 -
CUSTOMER 85,000 14,400 3,808 910 19,118 18,224 16
CUSTOMER_ACCOUNT 425,000 39,464 47,024 4,324 90,812 86,512 24
CUSTOMER_TAXRATE 170,000 3,552 112 183 3,847 3,840 176
HOLDING 75,285,552 3,972,528 2,934,184 345,336 7,252,048 9,972,584 3,065,872
HOLDING_HISTORY 1,968,360,153 71,576,752 37,302,328 5,443,954 114,323,034 109,335,208 456,128
HOLDING_SUMMARY 4,229,765 141,560 584 7,107 149,251 284,688 142,544
WATCH_ITEM 8,471,094 228,336 888 11,461 240,685 229,528 304
WATCH_LIST 85,000 2,112 1,792 195 4,099 3,904 -
Market File GroupCOMPANY 42,500 9,192 2,568 588 12,348 11,776 16
COMPANY_COMPETITOR 127,500 3,424 2,880 315 6,619 6,304 -
DAILY_MARKET 75,983,625 3,865,240 1,614,920 274,008 5,754,168 5,481,760 1,600
EXCHANGE 4 8 8 1 17 16 -
FINANCIAL 850,000 100,016 360 5,019 105,395 100,704 328
INDUSTRY 102 8 40 2 50 48 -
LAST_TRADE 58,225 2,688 96 139 2,923 5,528 2,744
NEWS_ITEM 85,000 9,361,848 192 468,102 9,830,142 9,362,064 24
NEWS_XREF 85,000 2,112 96 110 2,318 2,208 -
SECTOR 12 8 24 2 34 32 -
SECURITY 58,225 9,072 4,024 655 13,751 13,112 16
STATUS_TYPE 5 8 8 1 17 16 -
Misc File GroupADDRESS 127,504 7,360 120 374 7,854 7,496 16
TAXRATE 320 24 16 2 42 56 16
ZIP_CODE 14,741 488 88 29 605 576 -
TOTALS (KB) 556,707,088 129,121,776 34,291,443 720,120,307
669,755 654 GB
Db/Filegroups LUN Count Partition Size(KB) MB allocated MB Loaded MB Loaded+5% Ending size 8 Hours
misc_fg 0 - - - - - -
broker_fg 10 69,632,000 680,000 541,515 568,591 555,490 571,852
market_fg 0 - - - - - -
customer_fg 10 20,480,000 200,000 128,239 134,651 131,823 136,019
Settlements 2,249,867
Initial Growing Space (MB) 654,725
Final Growing Space (MB) 672,278 Data LUNS 10 Initial Log size (MB) 1,616 Log LUNS 1
Delta (MB) 17,553 Disks per LUN 16 Final Log size (MB) 26,267 Log Disks 30
Data Space per Trade (MB) 0.007801663 Disk Capacity (MB) 34,714 Log Growth (MB) 24,650 Disk Capacity (MB) 34,714
1 Day Data Growth (MB) 38,105 RAID5 overhead 86% Log Growth/trade (MB) 0.010956401725 RAID10 overhead 50%
60 Day Space (MB) 2,956,044 Total Space (MB) 4,778,109 1 Day log space (MB) 53,513 Log Space (MB) 520,706
Initial Database Size (MB)
Clause 8 – Pricing Related Items 60-Day Space Details of the 60-Day Space computations (see Clause 8.2.2) along with proof that the database is configured to sustain a Business Day of growth (see Clause 6.6.6.1) must be reported.

©IBM Corporation TPC-E Benchmark Full Disclosure Report – August 2007 41
Auditor’s Attestation Letter The Auditor’s Attestation Letter, which indicates compliance, must be included in the Report. The auditor’s Attestation Letter is on the next two pages.
Ms. Celia Schreiber, Manager IBM Modular and Blade Performance Analysis & Benchmarking IBM 3039 Cornwallis Rd. RTP, NC 27709
August 10, 2007
I verified the TPC Benchmark™ E performance of the following configuration:
Platform: IBM BladeCenter HS21 XM Operating system: Microsoft Windows Server 2003 R2 Enterprise x64 Edition Database Manager: Microsoft SQL Server 2005
The results were:
CPU's Speed
Memory Disks Trade-Result 90% Response Time tpsE
Tier B, Server: IBM BladeCenter HS21 XM 2 x Dual Core
Intel Xeon 5160
(3.0GHz)
32 GB (4 MB L2)
192 x 36.4 GB 15K 4Gbps 0.19 Seconds 169.59
Tier A, One Client: IBM x3500
1 x Xeon 5160 (3.0 GHz)
1 GB (2x2 MB cache)
2x 73 GB 15K Hot Swap SAS n/a n/a
In my opinion, these performance results were produced in compliance with the TPC requirements for the benchmark.
The following 12 verification items were given special attention:
• All EGen components were verified to be v1.2.0 (see note 1 below.)
• The transactions were correctly implemented.
• The database was properly scaled and populated for 85,000 customers.
• The mandatory network between the driver and the SUT was configured.
• The ACID properties were met (see notes 2 and 3 below.)

• Input data was generated according to the specified percentages.
• The reported response times were correctly measured.
• All 90% response times were under the specified maximums.
• The measurement interval was representative of steady state conditions.
• The reported measurement interval was 120 minutes.
• The 60 day storage requirement was correctly computed.
• The system pricing was verified for major components and maintenance.
Additional Audit Notes:
1. EGen/flat_in/exchange.txt on the driver system was from an older version of EGen. The older file had an extra column. This had no impact on runtime behavior or performance since the driver only uses this file to get a row count and the number of rows was identical for both versions of the file.
2. During Isolation Test 1 Step 7, Session 3 was the deadlock victim. Therefore not all Frames completed successfully. This did not compromise the demonstration of the required isolation properties.
3. When inducing the required failures during the Business Recovery test, there was a 16 second delay between the failure of the Tier B database server and the failure of the Tier A client machine. This did not compromise the demonstration of the durability properties since the client machine did not participate in the database portion of the transactions.
Respectfully Yours,
Lorna Livingtree, Auditor François Raab, President

Supporting Files Index Table The Supporting Files Index file can be found in the SupportingFiles directory (SupportingFiles.doc).
Clause Description Pathname
Disk Configuration
SupportingFiles/Introduction/Hardware/Diskpart.txt SupportingFiles/Introduction/Hardware/DS4800_EXP810diagram.ppt SupportingFiles/Introduction/Hardware/DS4800_setup.script SupportingFiles/Introduction/Hardware/storage system files.cfg SupportingFiles/Introduction/Hardware/StorageSetup.doc
Tier B/HS21 Configuration
SupportingFiles/Introduction/Hardware/BladeCenter_Setup.txt SupportingFiles/Introduction/Hardware/HS21_bios_settings.txt SupportingFiles/Introduction/Hardware/HS21_QLogicExpansion_setting.txt SupportingFiles/Introduction/Hardware/HS21_setup.txt
TierA/x3500 setup
SupportingFiles/Introduction/Hardware/TierA_setup.txt
Database Tunable Parameters
SupportingFiles/Introduction/software/runconfig.sql SupportingFiles/Introduction/software/startsqlmorgan.bat
Checkpoint scripts
SupportingFiles/Introduction/software/runregularcheckpoints.bat SupportingFiles/Introduction/software/checkpoint.bat SupportingFiles/Introduction/software/checkpoint.sql
Introduction
OS Tunable Parameters
SupportingFiles/Introduction/software/OStune.doc SupportingFiles/Introduction/software/HS21_registry.reg SupportingFiles/Introduction/software/HS21_sysinfo.nfo SupportingFiles/Introduction/software/x3500_registry.reg SupportingFiles/Introduction/software/x3500_sysinfo.nfo
Table creation scripts
SupportingFiles/Clause2/DDL/Create_Check_Constraints_Fixed.sql SupportingFiles/Clause2/DDL/Create_Check_Constraints_Growing.sql SupportingFiles/Clause2/DDL/Create_Check_Constraints_Scaling.sql SupportingFiles/Clause2/DDL/Create_FK_Constraints.sql SupportingFiles/Clause2/DDL/Create_Tables_Fixed.sql SupportingFiles/Clause2/DDL/Create_Tables _Growing.sql SupportingFiles/Clause2/DDL/Create_Tables _Scaling.sql SupportingFiles/Clause2/DDL/Create_TPCE_Types.sql SupportingFiles/Clause2/DDL/Drop_FK_Constraints.sql SupportingFiles/Clause2/DDL/Drop_Tables_and_Constraints_Fixed.sql SupportingFiles/Clause2/DDL/Drop_Tables_and_Constraints_Growing.sql SupportingFiles/Clause2/DDL/Drop_Tables_and_Constraints_Scaling.sql
Index creation scripts
SupportingFiles/Clause2/DDL/Create_Clustered_Indexes_Fixed.sql SupportingFiles/Clause2/DDL/Create_Clustered_Indexes_Growing.sql SupportingFiles/Clause2/DDL/Create_Clustered_Indexes_Scaling.sql SupportingFiles/Clause2/DDL/Create_NC_Indexes_Growing.sql SupportingFiles/Clause2/DDL/Create_NC_Indexes_Fixed.sql SupportingFiles/Clause2/DDL/Create_NC_Indexes_Scaling.sql
Clause 2
SupportingFiles/Clause2/DML/BrokerVolume.sql SupportingFiles/Clause2/DML/CustomerPosition.sql SupportingFiles/Clause2/DML/DataMaintenance.sql

©IBM Corporation TPC-E Benchmark Full Disclosure Report – August 2007 44
Load Transaction Frames
SupportingFiles/Clause2/DML/Get_Next_T_ID.sql SupportingFiles/Clause2/DML/MarketFeed.sql SupportingFiles/Clause2/DML/MarketWatch.sql SupportingFiles/Clause2/DML/SecurityDetail.sql SupportingFiles/Clause2/DML/Trade_Cleanup.sql SupportingFiles/Clause2/DML/TradeLookup.sql SupportingFiles/Clause2/DML/TradeOrder.sql SupportingFiles/Clause2/DML/TradeResult.sql SupportingFiles/Clause2/DML/TradeStatus.sql SupportingFiles/Clause2/DML/TradeUpdate.sql
Create Database
SupportingFiles/Clause2/backup.sql SupportingFiles/Clause2/backupdev.sql SupportingFiles/Clause2/Count_Customers.sql SupportingFiles/Clause2/create_database.sql SupportingFiles/Clause2/Create_TID_Ranges_Tables.sql SupportingFiles/Clause2/CreateTimerTable.sql SupportingFiles/Clause2/Database_Options_1.sql SupportingFiles/Clause2/Database_Options_2.sql SupportingFiles/Clause2/Drop_and_Create_TPCE_INFO.sql SupportingFiles/Clause2/EndLoadTimer.sql SupportingFiles/Clause2/growTempDB.sql SupportingFiles/Clause2/InstallLoadTimerProc.sql SupportingFiles/Clause2/MSTPCE Database Setup Reference.pdf SupportingFiles/Clause2/remove_database.sql SupportingFiles/Clause2/restore.sql SupportingFiles/Clause2/Set_Statistics.sql SupportingFiles/Clause2/setup_tpce.vbs SupportingFiles/Clause2/SQL_Server_Configuration.sql SupportingFiles/Clause2/SQL_Server_sp_Configure.sql SupportingFiles/Clause2/StartLoadTimber.sql SupportingFiles/Clause2/TPCE_Setup.cmd SupportingFiles/Clause2/VerifyTPCELoad.sql SupportingFiles/Clause2/Version.sql
Database Space Scripts
SupportingFiles/Clause2/audit_scripts/Space/SPfiles.sql SupportingFiles/Clause2/audit_scripts/Space/SPlog.sql SupportingFiles/Clause2/audit_scripts/Space/SPUsed.sql
Database Audit Scripts
SupportingFiles/Clause2/audit_scripts/database/DB_Check.sql SupportingFiles/Clause2/audit_scripts/database/DB_Tables.sql SupportingFiles/Clause2/audit_scripts/database/Duplicate_Tests.sql SupportingFiles/Clause2/Audit_Scripts/Database/RI_Tests.sql
Clause 3
Transaction Frames
SupportingFiles/Clause3/BrokerVolume.sql SupportingFiles/Clause3/CustomerPosition.sql SupportingFiles/Clause3/DataMaintenance.sql SupportingFiles/Clause3/Get_Next_T_ID.sql SupportingFiles/Clause3/MarketFeed.sql SupportingFiles/Clause3/MarketWatch.sql SupportingFiles/Clause3/SecurityDetail.sql SupportingFiles/Clause3/Trade_Cleanup.sql

©IBM Corporation TPC-E Benchmark Full Disclosure Report – August 2007 45
SupportingFiles/Clause3/TradeLookup.sql SupportingFiles/Clause3/TradeOrder.sql SupportingFiles/Clause3/TradeResult.sql SupportingFiles/Clause3/TradeStatus.sql SupportingFiles/Clause3/TradeUpdate.sql
BaseServer
SupportingFiles/Clause3/BaseServer/BaseServer.cpp SupportingFiles/Clause3/BaseServer/BaseServer.h SupportingFiles/Clause3/BaseServer/BaseServer.vcproj SupportingFiles/Clause3/BaseServer/stdafx.cpp SupportingFiles/Clause3/BaseServer/stdafx.h SupportingFiles/Clause3/BaseServer/SUTServersLocals.h
SUT_CE_Server
SupportingFiles/Clause3/SUT_CE_Server/CEServer.cpp SupportingFiles/Clause3/SUT_CE_Server/CEServer.h SupportingFiles/Clause3/SUT_CE_Server/CEServerMain.cpp SupportingFiles/Clause3/SUT_CE_Server/PortDefinitions.h SupportingFiles/Clause3/SUT_CE_Server/stdafx.cpp SupportingFiles/Clause3/SUT_CE_Server/stdafx.h SupportingFiles/Clause3/SUT_CE_Server/SUT_CE_Server.vcproj SupportingFiles/Clause3/SUT_CE_Server/SUTServer.ncb SupportingFiles/Clause3/SUT_CE_Server/SUTServer.sln SupportingFiles/Clause3/SUT_CE_Server/SUTServer.suo SupportingFiles/Clause3/SUT_CE_Server/SUTStructs.h SupportingFiles/Clause3/SUT_CE_Server/Visual Studio DLL.ism
SUT_MEE_Server
SupportingFiles/Clause3/SUT_MEE_Server/MEEServer.cpp SupportingFiles/Clause3/SUT_MEE_Server/MEEServer.h SupportingFiles/Clause3/SUT_MEE_Server/MEEServerMain.cpp SupportingFiles/Clause3/SUT_MEE_Server/stdafx.cpp SupportingFiles/Clause3/SUT_MEE_Server/stdafx.h SupportingFiles/Clause3/SUT_MEE_Server/SUT_MEE_Server.vcproj
TransactionsSP
SupportingFiles/Clause3/TransactionsSP/BrokerVolumeDB_SP.cpp SupportingFiles/Clause3/TransactionsSP/BrokerVolumeDB_SP.h SupportingFiles/Clause3/TransactionsSP/CheckpointDB_SP.cpp SupportingFiles/Clause3/TransactionsSP/CheckpointDB_SP.h SupportingFiles/Clause3/TransactionsSP/CustomerPositionDB_SP.cpp SupportingFiles/Clause3/TransactionsSP/CustomerPositionDB_SP.h SupportingFiles/Clause3/TransactionsSP/DataMaintenanceDB_SP.cpp SupportingFiles/Clause3/TransactionsSP/DataMaintenanceDB_SP.h SupportingFiles/Clause3/TransactionsSP/MarketFeedDB_SP.cpp SupportingFiles/Clause3/TransactionsSP/MarketFeedDB_SP.h SupportingFiles/Clause3/TransactionsSP/MarketWatchDB_SP.cpp SupportingFiles/Clause3/TransactionsSP/MarketWatchDB_SP.h SupportingFiles/Clause3/TransactionsSP/SecurityDetailDB_SP.cpp SupportingFiles/Clause3/TransactionsSP/SecurityDetailDB_SP.h SupportingFiles/Clause3/TransactionsSP/stdafx.cpp SupportingFiles/Clause3/TransactionsSP/stdafx.h SupportingFiles/Clause3/TransactionsSP/TradeLookupDB_SP.cpp SupportingFiles/Clause3/TransactionsSP/TradeLookupDB_SP.h SupportingFiles/Clause3/TransactionsSP/TradeOrderDB_SP.cpp
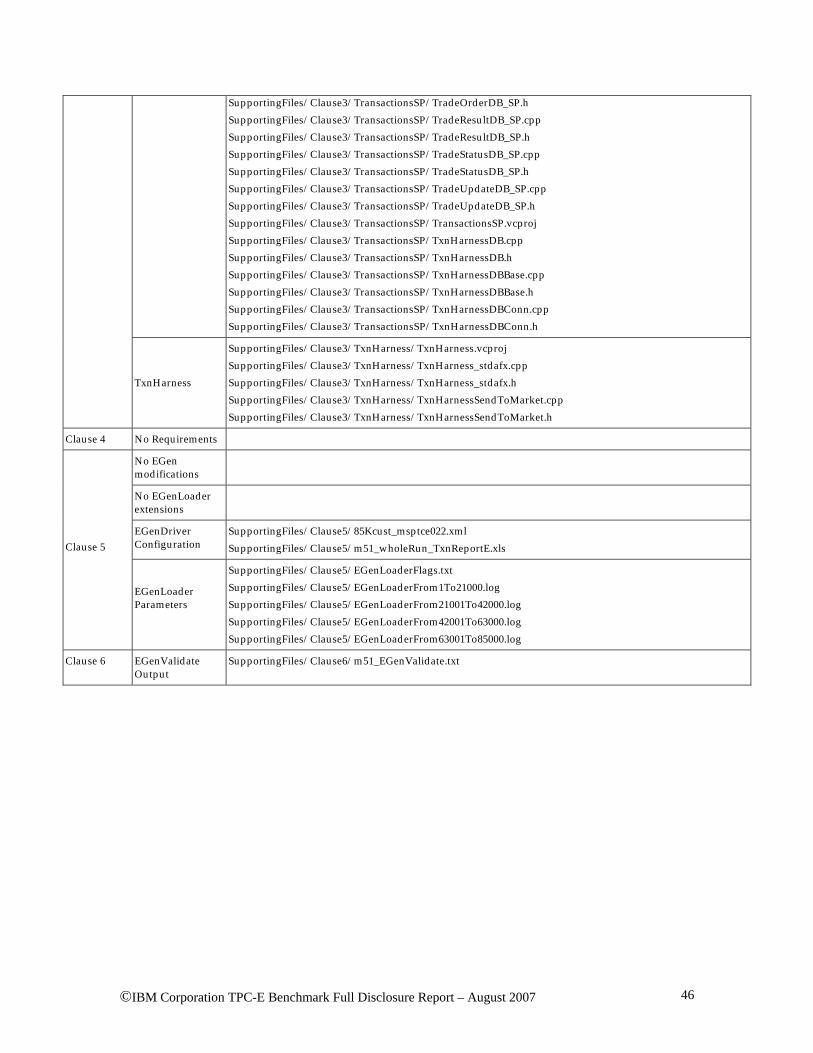
©IBM Corporation TPC-E Benchmark Full Disclosure Report – August 2007 46
SupportingFiles/Clause3/TransactionsSP/TradeOrderDB_SP.h SupportingFiles/Clause3/TransactionsSP/TradeResultDB_SP.cpp SupportingFiles/Clause3/TransactionsSP/TradeResultDB_SP.h SupportingFiles/Clause3/TransactionsSP/TradeStatusDB_SP.cpp SupportingFiles/Clause3/TransactionsSP/TradeStatusDB_SP.h SupportingFiles/Clause3/TransactionsSP/TradeUpdateDB_SP.cpp SupportingFiles/Clause3/TransactionsSP/TradeUpdateDB_SP.h SupportingFiles/Clause3/TransactionsSP/TransactionsSP.vcproj SupportingFiles/Clause3/TransactionsSP/TxnHarnessDB.cpp SupportingFiles/Clause3/TransactionsSP/TxnHarnessDB.h SupportingFiles/Clause3/TransactionsSP/TxnHarnessDBBase.cpp SupportingFiles/Clause3/TransactionsSP/TxnHarnessDBBase.h SupportingFiles/Clause3/TransactionsSP/TxnHarnessDBConn.cpp SupportingFiles/Clause3/TransactionsSP/TxnHarnessDBConn.h
TxnHarness
SupportingFiles/Clause3/TxnHarness/TxnHarness.vcproj SupportingFiles/Clause3/TxnHarness/TxnHarness_stdafx.cpp SupportingFiles/Clause3/TxnHarness/TxnHarness_stdafx.h SupportingFiles/Clause3/TxnHarness/TxnHarnessSendToMarket.cpp SupportingFiles/Clause3/TxnHarness/TxnHarnessSendToMarket.h
Clause 4 No Requirements
No EGen modifications
No EGenLoader extensions
EGenDriver Configuration
SupportingFiles/Clause5/85Kcust_msptce022.xml SupportingFiles/Clause5/m51_wholeRun_TxnReportE.xls
Clause 5
EGenLoader Parameters
SupportingFiles/Clause5/EGenLoaderFlags.txt SupportingFiles/Clause5/EGenLoaderFrom1To21000.log SupportingFiles/Clause5/EGenLoaderFrom21001To42000.log SupportingFiles/Clause5/EGenLoaderFrom42001To63000.log SupportingFiles/Clause5/EGenLoaderFrom63001To85000.log
Clause 6 EGenValidate Output
SupportingFiles/Clause6/m51_EGenValidate.txt
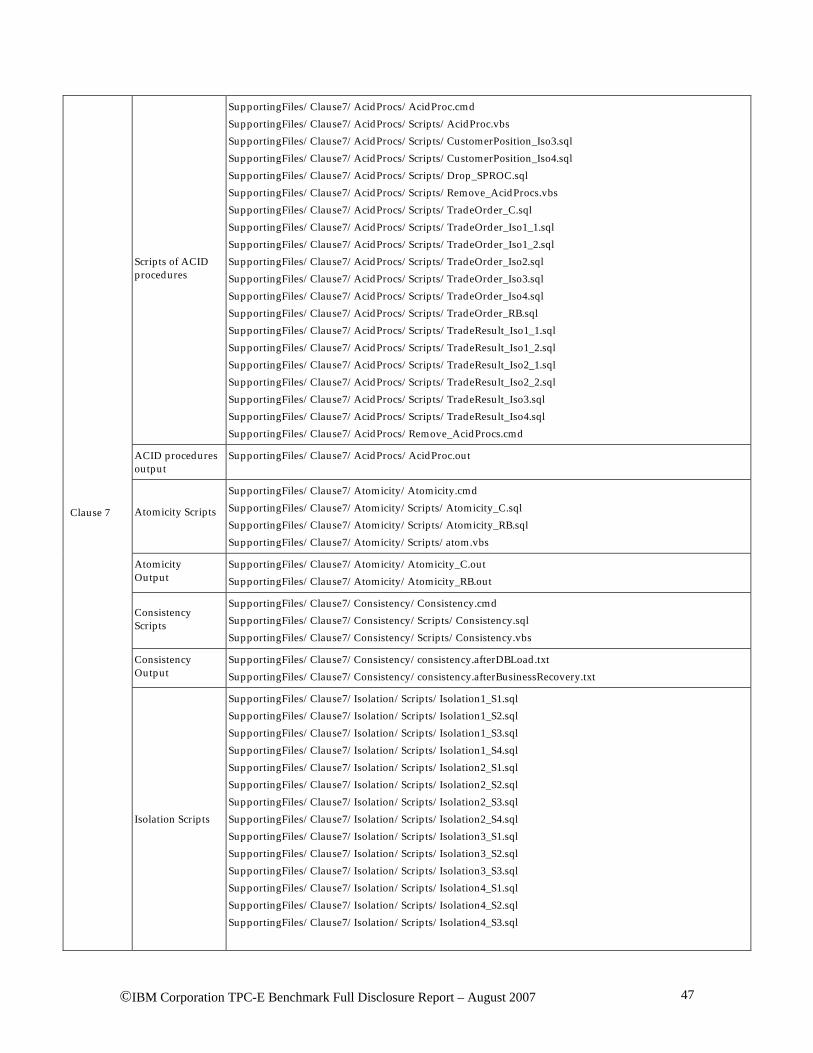
©IBM Corporation TPC-E Benchmark Full Disclosure Report – August 2007 47
Scripts of ACID procedures
SupportingFiles/Clause7/AcidProcs/AcidProc.cmd SupportingFiles/Clause7/AcidProcs/Scripts/AcidProc.vbs SupportingFiles/Clause7/AcidProcs/Scripts/CustomerPosition_Iso3.sql SupportingFiles/Clause7/AcidProcs/Scripts/CustomerPosition_Iso4.sql SupportingFiles/Clause7/AcidProcs/Scripts/Drop_SPROC.sql SupportingFiles/Clause7/AcidProcs/Scripts/Remove_AcidProcs.vbs SupportingFiles/Clause7/AcidProcs/Scripts/TradeOrder_C.sql SupportingFiles/Clause7/AcidProcs/Scripts/TradeOrder_Iso1_1.sql SupportingFiles/Clause7/AcidProcs/Scripts/TradeOrder_Iso1_2.sql SupportingFiles/Clause7/AcidProcs/Scripts/TradeOrder_Iso2.sql SupportingFiles/Clause7/AcidProcs/Scripts/TradeOrder_Iso3.sql SupportingFiles/Clause7/AcidProcs/Scripts/TradeOrder_Iso4.sql SupportingFiles/Clause7/AcidProcs/Scripts/TradeOrder_RB.sql SupportingFiles/Clause7/AcidProcs/Scripts/TradeResult_Iso1_1.sql SupportingFiles/Clause7/AcidProcs/Scripts/TradeResult_Iso1_2.sql SupportingFiles/Clause7/AcidProcs/Scripts/TradeResult_Iso2_1.sql SupportingFiles/Clause7/AcidProcs/Scripts/TradeResult_Iso2_2.sql SupportingFiles/Clause7/AcidProcs/Scripts/TradeResult_Iso3.sql SupportingFiles/Clause7/AcidProcs/Scripts/TradeResult_Iso4.sql SupportingFiles/Clause7/AcidProcs/Remove_AcidProcs.cmd
ACID procedures output
SupportingFiles/Clause7/AcidProcs/AcidProc.out
Atomicity Scripts
SupportingFiles/Clause7/Atomicity/Atomicity.cmd SupportingFiles/Clause7/Atomicity/Scripts/Atomicity_C.sql SupportingFiles/Clause7/Atomicity/Scripts/Atomicity_RB.sql SupportingFiles/Clause7/Atomicity/Scripts/atom.vbs
Atomicity Output
SupportingFiles/Clause7/Atomicity/Atomicity_C.out SupportingFiles/Clause7/Atomicity/Atomicity_RB.out
Consistency Scripts
SupportingFiles/Clause7/Consistency/Consistency.cmd SupportingFiles/Clause7/Consistency/Scripts/Consistency.sql SupportingFiles/Clause7/Consistency/Scripts/Consistency.vbs
Consistency Output
SupportingFiles/Clause7/Consistency/consistency.afterDBLoad.txt SupportingFiles/Clause7/Consistency/consistency.afterBusinessRecovery.txt
Clause 7
Isolation Scripts
SupportingFiles/Clause7/Isolation/Scripts/Isolation1_S1.sql SupportingFiles/Clause7/Isolation/Scripts/Isolation1_S2.sql SupportingFiles/Clause7/Isolation/Scripts/Isolation1_S3.sql SupportingFiles/Clause7/Isolation/Scripts/Isolation1_S4.sql SupportingFiles/Clause7/Isolation/Scripts/Isolation2_S1.sql SupportingFiles/Clause7/Isolation/Scripts/Isolation2_S2.sql SupportingFiles/Clause7/Isolation/Scripts/Isolation2_S3.sql SupportingFiles/Clause7/Isolation/Scripts/Isolation2_S4.sql SupportingFiles/Clause7/Isolation/Scripts/Isolation3_S1.sql SupportingFiles/Clause7/Isolation/Scripts/Isolation3_S2.sql SupportingFiles/Clause7/Isolation/Scripts/Isolation3_S3.sql SupportingFiles/Clause7/Isolation/Scripts/Isolation4_S1.sql SupportingFiles/Clause7/Isolation/Scripts/Isolation4_S2.sql SupportingFiles/Clause7/Isolation/Scripts/Isolation4_S3.sql

©IBM Corporation TPC-E Benchmark Full Disclosure Report – August 2007 48
Isolation Output
SupportingFiles/Clause7/Isolation/Isolation1_S1.rpt SupportingFiles/Clause7/Isolation/Isolation1_S2.rpt SupportingFiles/Clause7/Isolation/Isolation1_S3.rpt SupportingFiles/Clause7/Isolation/Isolation1_S4.rpt SupportingFiles/Clause7/Isolation/Isolation2_S1.rpt SupportingFiles/Clause7/Isolation/Isolation2_S2.rpt SupportingFiles/Clause7/Isolation/Isolation2_S3.rpt SupportingFiles/Clause7/Isolation/Isolation2_S4.rpt SupportingFiles/Clause7/Isolation/Isolation3_S1.rpt SupportingFiles/Clause7/Isolation/Isolation3_S2.rpt SupportingFiles/Clause7/Isolation/Isolation3_S3.rpt SupportingFiles/Clause7/Isolation/Isolation4_S1.rpt SupportingFiles/Clause7/Isolation/Isolation4_S2.rpt SupportingFiles/Clause7/Isolation/Isolation4_S3.rpt
Durability Business Recovery
SupportingFiles/Clause7/Durability/BusinessRecovery/BusinessRecoveryTime.txt SupportingFiles/Clause7/Durability/BusinessRecovery/Consistency.afterBusinessRecovery.txt SupportingFiles/Clause7/Durability/BusinessRecovery/CountAfter.sql SupportingFiles/Clause7/Durability/BusinessRecovery/CountAfterBusinessRecovery.txt SupportingFiles/Clause7/Durability/BusinessRecovery/CountBefore.sql SupportingFiles/Clause7/Durability/BusinessRecovery/CountBeforeBusinessRecovery.txt SupportingFiles/Clause7/Durability/BusinessRecovery/m53_BusRecoveryPart1_20min_BI_TxnReportE.xls SupportingFiles/Clause7/Durability/BusinessRecovery/m53_BusRecoveryPart1_TxnStepReport.xlt SupportingFiles/Clause7/Durability/BusinessRecovery/m_53BusRecoveryPart1_wholeRun_TxnReportE.xls SupportingFiles/Clause7/Durability/BusinessRecovery/m54_BusRecoveryPart2_20min_BI_TxnReportE.xls SupportingFiles/Clause7/Durability/BusinessRecovery/m54_BusRecoveryPart2_TxnStepReport.xlt SupportingFiles/Clause7/Durability/BusinessRecovery/m54_BusRecoveryPart2_wholeRun_TxnReportE.xls SupportingFiles/Clause7/Durability/BusinessRecovery/m54_BusinessRecoveryTimeGraph.xls SupportingFiles/Clause7/Durability/BusinessRecovery/SQLConsoleLog.BusinessRecoveryPart1.txt SupportingFiles/Clause7/Durability/BusinessRecovery/SQLConsoleLog.BusinessRecoveryPart2.txt SupportingFiles/Clause7/Durability/BusinessRecovery/TierASystemEventLog.Sprucewood1.csv SupportingFiles/Clause7/Durability/BusinessRecovery/TierBSystemEventLog.ibmservM.csv
Durability Data Accessibility
SupportingFiles/Clause7/Durability/DataAccessbility/CountAfter.DataAccessibility.txt SupportingFiles/Clause7/Durability/DataAccessbility/CountAfter.sql SupportingFiles/Clause7/Durability/DataAccessbility/CountBefore.DataAccessibility.txt SupportingFiles/Clause7/Durability/DataAccessbility/CountBefore.sql SupportingFiles/Clause7/Durability/DataAccessbility/m52_DataAccessibility_wholeRun_TxnReportE.xls SupportingFiles/Clause7/Durability/DataAccessbility/m52_DataAccessibilityGraph.xls SupportingFiles/Clause7/Durability/DataAccessbility/pulledDrives.bmp SupportingFiles/Clause7/Durability/DataAccessbility/rebuildingDrives.bmp SupportingFiles/Clause7/Durability/DataAccessbility/rebuiltDrives.bmp SupportingFiles/Clause7/Durability/DataAccessbility/SQLConsoleLog.DataAccessibility.txt
ACID Procedures Document
SupportingFiles/Clause7/MSTPCE ACID Procedures.doc
Clause 8 60-Day Space Calculations
SupportingFiles/Clause8/tpce_space.xls

©IBM Corporation TPC-E Benchmark Full Disclosure Report – August 2007 49
Appendix A – Price Quotes

Microsoft Corporation One Microsoft Way Redmond, WA 98052-6399
Tel 425 882 8080 Fax 425 936 7329 http://www.microsoft.com/ Microsoft
August 8, 2007
IBM Corporation Chris King 3079 Cornwallis Road Durham, NC 27709
Here is the information you requested regarding pricing for several Microsoft products to be used in conjunction with your TPC-E benchmark testing.
All pricing shown is in US Dollars ($).
Part Number Description Unit Price Quantity Price
810-03150
SQL Server 2005 Enterprise Edition Per Processor License Discount Schedule: Open Program - No Level Unit Price reflects a 4% discount from the retail unit price of $24,999.
$23,911 2 $47,822
P73-01972
Windows Server 2003 R2 Standard Edition Server License Only - No CALs Discount Schedule: Open Program - No Level Unit Price reflects a 28% discount from the retail unit price of $999.
$719 1 $719
P72-01684
Windows Server 2003 R2 Enterprise x64 Edition Server License Only - No CALs Discount Schedule: Open Program - No Level Unit Price reflects a 42% discount from the retail unit price of $3,999.
$2,334 1 $2,334
N/A Microsoft Problem Resolution Services Professional Support (1 Incident)
$245 1 $245
All products are currently orderable through Microsoft's normal distribution channels. A list of Microsoft's resellers can be found at http://www.microsoft.com/products/info/render.aspx?view=22&type=mnp&content=22/licensing
Defect support is included in the purchase price. Additional support is available from Microsoft PSS on an incident by incident basis at $245 per call.
This quote is valid for the next 90 days.
If we can be of any further assistance, please contact Jamie Reding at (425) 703-0510 or [email protected].

Reference ID: PEchki0708080000009630. Please include this Reference ID in any correspondence regarding this price quote.
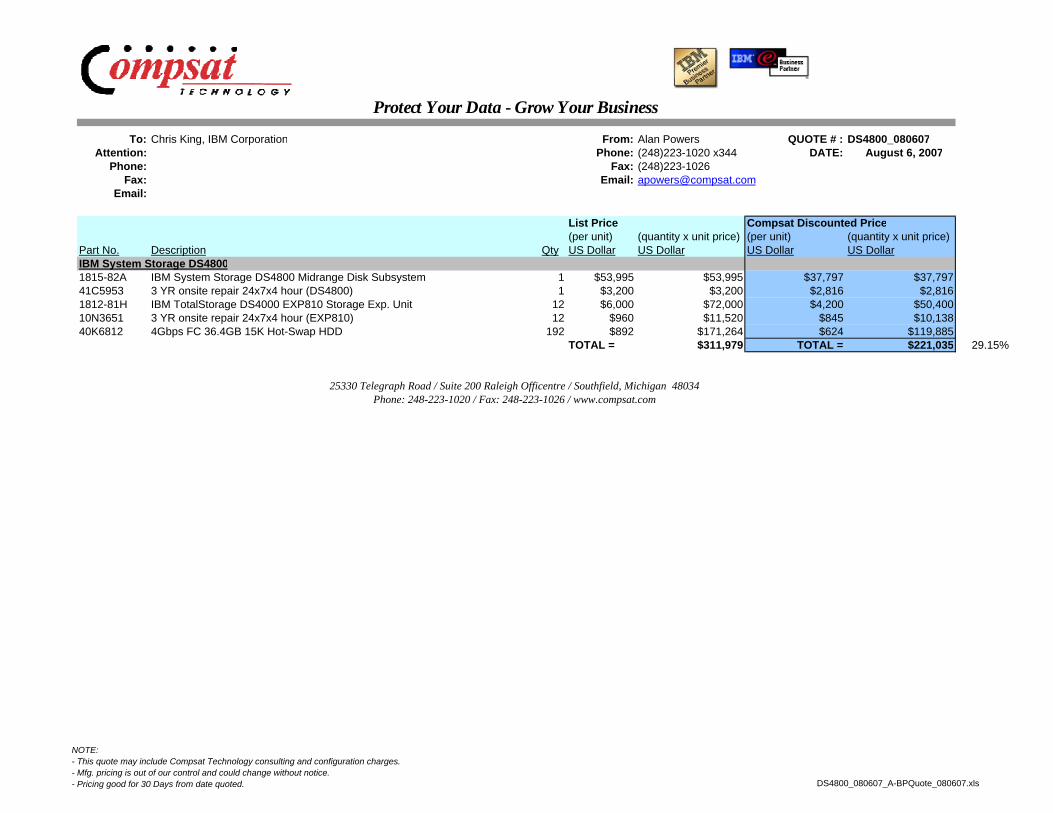
Protect Your Data - Grow Your Business
To: Chris King, IBM Corporation From: Alan Powers QUOTE # : DS4800_080607Attention: Phone: (248)223-1020 x344 DATE: August 6, 2007
Phone: Fax: (248)223-1026Fax: Email: [email protected]
Email:
List Price Compsat Discounted Price(per unit) (quantity x unit price) (per unit) (quantity x unit price)
Part No. Description Qty US Dollar US Dollar US Dollar US DollarIBM System Storage DS48001815-82A IBM System Storage DS4800 Midrange Disk Subsystem 1 $53,995 $53,995 $37,797 $37,79741C5953 3 YR onsite repair 24x7x4 hour (DS4800) 1 $3,200 $3,200 $2,816 $2,8161812-81H IBM TotalStorage DS4000 EXP810 Storage Exp. Unit 12 $6,000 $72,000 $4,200 $50,40010N3651 3 YR onsite repair 24x7x4 hour (EXP810) 12 $960 $11,520 $845 $10,13840K6812 4Gbps FC 36.4GB 15K Hot-Swap HDD 192 $892 $171,264 $624 $119,885
TOTAL = $311,979 TOTAL = $221,035 29.15%
25330 Telegraph Road / Suite 200 Raleigh Officentre / Southfield, Michigan 48034Phone: 248-223-1020 / Fax: 248-223-1026 / www.compsat.com
NOTE:- This quote may include Compsat Technology consulting and configuration charges. - Mfg. pricing is out of our control and could change without notice.- Pricing good for 30 Days from date quoted. DS4800_080607_A-BPQuote_080607.xls

Policy & Agreement | Privacy Policy | © 2000-2007 ewegg Inc. All rights reserved.
Home > Categories > Backup Devices & Media > Floppy Drives > NEC > Item#:N82E16821152003
Home > Categories > Backup Devices & Media > Floppy Drives > NEC > Item#:N82E16821152003
NEC Black 1.44MB 3.5" External USB Floppy Drive Model UF0002S-102 - OEM
$21.99
3 Business Day Shipping $4.99 (Not available in HI, AK and PR)
Out of Stock
Special Offers No Payments for 6 Months on purchases of $500 or more with your Newegg.com Preferred Account! Click here for important disclosures
No Payments for 90 Days On purchases over $250with Bill Me Later®! Click here for important disclosures
Manufacturer Contact Info
Manufacturer Product Page Website: http://www.necdisplay.com Support Phone Number: 1-800-366-5213 Support Website View other products from NEC
Image Viewer
Model
Brand NEC
Model UF0002S-102
Spec
Panel Color Black
Capacity 1.44MB
Track to Track Access Time 3ms
Rotational Speed 300 rpm
Interface External USB
Media Type 3.5" Micro Floppy Dis
Features Completely detached USB
Packaging
Package Contents UF0002S-102 User Manual
Physical Spec
Form Factor 3.5"
Dimensions 5.60" x 4.10" x 0.67"
Page 1 of 1Newegg.com - NEC Black 1.44MB 3.5" External USB Floppy Drive Model UF0002S-102 - OEM
8/10/2007http://www.newegg.com/Product/Product.aspx?Item=N82E16821152003&Tpk=UF0002S-102

Printer Supplies
Home Networking: Switches: Gigabit Ethernet Switches: D-Link August 7, 2007 Items: 0 Total:$0.00
Product Selection Printers Monitors Storage Hard Drives Laptops Networking Systems Scanners Digital Cameras Refurbished Projectors Cables Speakers PDA's CD & DVD Drives Software Warranty and Service Options Shop by Brand Belkin Brother Canon Compaq DYMO Epson Fujitsu HP IBM Infocus Iomega Kodak Konica Minolta Lexmark Maxtor Minolta QMS NEC Okidata Panasonic Ricoh Samsung Sony Toshiba Visioneer Xerox more...
Search:
Shop by Specials Rebate Center New Arrivals
Learning Center Windows Vista Windows Vista Products
D-Link 8 Port Rackmountable Gigabit Switch Part #: DGS-1008TL
Email this page
Purchase Information
Your Price: $205.99 Status: Please Call
Summary Get the blazing speed of Gigabit Ethernet with the D-Link DGS-1008TL, an 8-port 10/100/1000Mbps Switcthat delivers power, performance, and reliability in one cost-effective, space-saving design. Increase the speed of your network server and backbone connections, or make Gigabit to the desktop a reality. Power users in the home, office, workgroup, or creative production environment can now move large, bandwidth-intensive files faster. Transfer graphics, CGI, CAD, or multimedia files across the network instantly. The versatile and compact 1U height design of the DGS-1008TL enables the device to rack-mounted in a standard 19 inch rack, while conserving valuable rack space.
Features Data Link Protocol: Ethernet, Fast
Ethernet, Gigabit Ethernet Port Quantity: 8
Switching Protocol: Store and Forward MAC Address Table: 8k entries
Options Specs Features Includes Warranty
Key Specifications D-Link 8-Port Gigabit SwitManufacturer D-Link
Manufacturer Part # DGS-1008TL
Device Type Switch
Enclosure Type External
Memory RAM 256 KB
Networking
ConnectivityTechnology Wired
Data Link Protocol Ethernet, Fast Ethernet, Gigabit Ethernet
Switching Protocol Store and Forward
Communication Mode Half-duplex, full-duplex
Data Transfer Rate 1000Mbps
MAC Address Table Size 8k entries
Status Indicators Port status, link activity, power
Features Flow control, full duplex capability, scalable clustering, layer 2 switching, auto-sensing per device, auto-negotiation, packet filtering
Compliant Standards IEEE 802.3, IEEE 802.3U, IEEE 802.3ab, IEEE 802.3x
Interfaces 8 x network - Ethernet 10Base-T/100Base-TX
Expansion Slots Total (Free) n/a
Power Power supply - internal
Dimensions (W X D X H)
Unit 17.4 in x 15.3 in x 2.6 in
Weight 6.2 lbs
Page 1 of 2D-Link DGS-1008TL Specifications
8/7/2007http://www.superwarehouse.com/D-Link_8_Port_Rackmountable_Gigabit_Switch/DGS-1008TL/ps/318797

Policy & Agreement | Privacy Policy | © 2000-2007 ewegg Inc. All rights reserved.
Home > Categories > Wired Networking > Network Cables > Belkin > Item#:N82E16812106332
Home > Categories > Wired Networking > Network Cables > Belkin > Item#:N82E16812106332
BELKIN A3L791-10-BLK 10 ft. Cat 5E Black RJ45 CAT5e Patch Cable - Retail
$3.99
3 Business Day Shipping $4.99 (Not available in HI, AK and PR)
In Stock
Special Offers No Payments for 6 Months on purchases of $500 or more with your Newegg.com Preferred Account! Click here for important disclosures
No Payments for 90 Days On purchases over $250with Bill Me Later®! Click here for important disclosures
Manufacturer Warranty Beyond any applicable Newegg return policy, this item is warranted independently by the product's Manufacturer. Below is a summary provided for convenience only and may not be accurate or current. Click here for full details.
Manufacturer Contact Info
Manufacturer Product Page Website: http://www.belkin.com/index.asp Support Phone Number: 800-223-5546 X 2263 Support Email: http://www.belkin.com/support/emailsupport.asp?pge=con Support Website View other products from Belkin
Image Viewer
Model
Brand BELKIN
Model A3L791-10-BLK
Spec
Cat 5E
Length 10 ft.
Color Black
Features
Features
Exceeds the performaCategory 5e. Perfect in conjunctionnetworks. 50-micron gold platedclean and clear transThis product is guaraPowerSum tested
Page 1 of 1Newegg.com - BELKIN A3L791-10-BLK 10 ft. Cat 5E Black RJ45 CAT5e Patch Cable - Retail
8/7/2007http://www.newegg.com/Product/Product.aspx?Item=N82E16812106332&Tpk=A3L791-10-BLK