Toyota Motor Corporation - CorporateInformation.com · Toyota Motor Corporation Provided By...
46
Company FundamentalsCompany Fundamentals\Company Profile COMPANY PROFILE Figures in Japanese Yen A Wright Investors' Service Research Report: Toyota Motor Corporation 440 Wheelers Farms Road Milford, CT 06461 U.S.A. Wright Quality Rating :ABC7 TOYOTA MOTOR CORPORATION is a Japan-based company mainly engaged in the automobile business and financial business.The Company operates through three business segments. The Automobile segment is engaged in the design, manufacture and sale of car products including passenger cars, minivans and trucks, as well as the related parts and accessories. The Finance segment is involved in the provision of financial services related to the sale of the Company's products, as well as the leasing of vehicles and equipment. The Others segment is involved in the design, manufacture and sale of housings, as well as information and communication business. Stock Price (12/3/2010): 3,275.00 Stock Chart Recent stock performance 1 Week - 0.5% 4 Weeks 10.5% 13 Weeks 12.6% 52 Weeks - 12.2% Chairman Fujio Cho (Rep) Vice Chairman Kazuo Okamoto (Rep) Vice Chairman Katsuaki Watanabe (Rep) President Akio Toyoda (Rep) Vice President Yukitoshi Funo (Rep) Officers Earnings / Dividends (as of 9/30/2010) Earnings Dividends Most Recent Qtr 31.47 20.00 Last 12 Months 176.9 45.00 Ratio Analysis Price / Earnings Ratio 18.52 Dividend Yield 1.37% Price / Sales Ratio 0.54 Payout Ratio 25.45% Price / Book Ratio 0.97 % Held by Insiders 33.10% Key Data Ticker: 7203 2010 Sales: 18,950,973,000,000 Major Industry: Automotive Sub Industry: Diversified Automotive Mfrs. Country: Japan Currency: Japanese Yen Fiscal Year Ends: March Employees 320,590 Exchanges: NAS OSA TYO Share Type: Common Market Capitalization: 10,270,345,074,975 Total Shares Outstanding: 3,135,983,229 Closely Held Shares: 1,038,109,000
Transcript of Toyota Motor Corporation - CorporateInformation.com · Toyota Motor Corporation Provided By...
Company FundamentalsCompany Fundamentals\Company Profile
COMPANY PROFILE Figures in Japanese Yen
A Wright Investors' Service Research Report: Toyota Motor Corporation
440 Wheelers Farms Road Milford, CT 06461 U.S.A.
Wright Quality Rating:ABC7
TOYOTA MOTOR CORPORATION is a Japan-based company mainly engaged in the automobile business and financial business.The Company operates through three business segments. The Automobile segment is engaged in the design, manufacture and sale of car products including passenger cars, minivans and trucks, as well as the related parts and accessories. The Finance segment is involved in the provision of financial services related to the sale of the Company's products, as well as the leasing of vehicles and equipment. The Others segment is involved in the design, manufacture and sale of housings, as well as information and communication business.
Stock Price (12/3/2010): 3,275.00
Stock Chart
Recent stock performance1 Week -0.5%4 Weeks 10.5%13 Weeks 12.6%52 Weeks -12.2%
Chairman Fujio Cho (Rep)
Vice Chairman Kazuo Okamoto (Rep)
Vice Chairman Katsuaki Watanabe (Rep)
President Akio Toyoda (Rep)
Vice President Yukitoshi Funo (Rep)
Officers
Earnings / Dividends (as of 9/30/2010) Earnings Dividends
Most Recent Qtr 31.47 20.00 Last 12 Months 176.9 45.00
Ratio AnalysisPrice / Earnings Ratio 18.52 Dividend Yield 1.37% Price / Sales Ratio 0.54 Payout Ratio 25.45% Price / Book Ratio 0.97 % Held by Insiders 33.10%
Key Data
Ticker: 7203
2010 Sales: 18,950,973,000,000
Major Industry: Automotive
Sub Industry: Diversified Automotive Mfrs.
Country: Japan
Currency: Japanese Yen
Fiscal Year Ends: March
Employees 320,590
Exchanges: NAS OSA TYO
Share Type: Common
Market Capitalization: 10,270,345,074,975
Total Shares Outstanding: 3,135,983,229
Closely Held Shares: 1,038,109,000
Address1 Toyotacho Toyota 471-8571 Aichi JAPAN
Phone +81 565 28 2121 Home Page http://toyota.jp
Copyright ©2000-2010 Distributed by Wright Investors' Service, Inc. All Rights Reserved. Except for quotations by established news media, no pages on this site may be reproduced, stored in a retrieval system, or transmitted for commercial purposes, in any form or by any means, electronic, mechanical, photocopying, recording, or otherwise without prior written permission. Information is believed reliable, but accuracy, completeness and opinions are not guaranteed.
Company Fundamentals\Comparative Business Analysis
A Wright Investors' Service Research Report: Toyota Motor Corporation Provided By CorporateInformation.com
440 Wheelers Farms Road Milford, CT 06461 U.S.A.
Wright Comparative Business Analysis Report
Report Date: 12/3/2010
Company Description TOYOTA MOTOR CORPORATION is a Japan-based company mainly engaged in the automobile business and financial business.The Company operates through three business segments. The Automobile segment is engaged in the design, manufacture and sale of car products including passenger cars, minivans and trucks, as well as the related parts and accessories. The Finance segment is involved in the provision of financial services related to the sale of the Company's products, as well as the leasing of vehicles and equipment. The Others segment is involved in the design, manufacture and sale of housings, as well as information and communication business.
Competitor Analysis
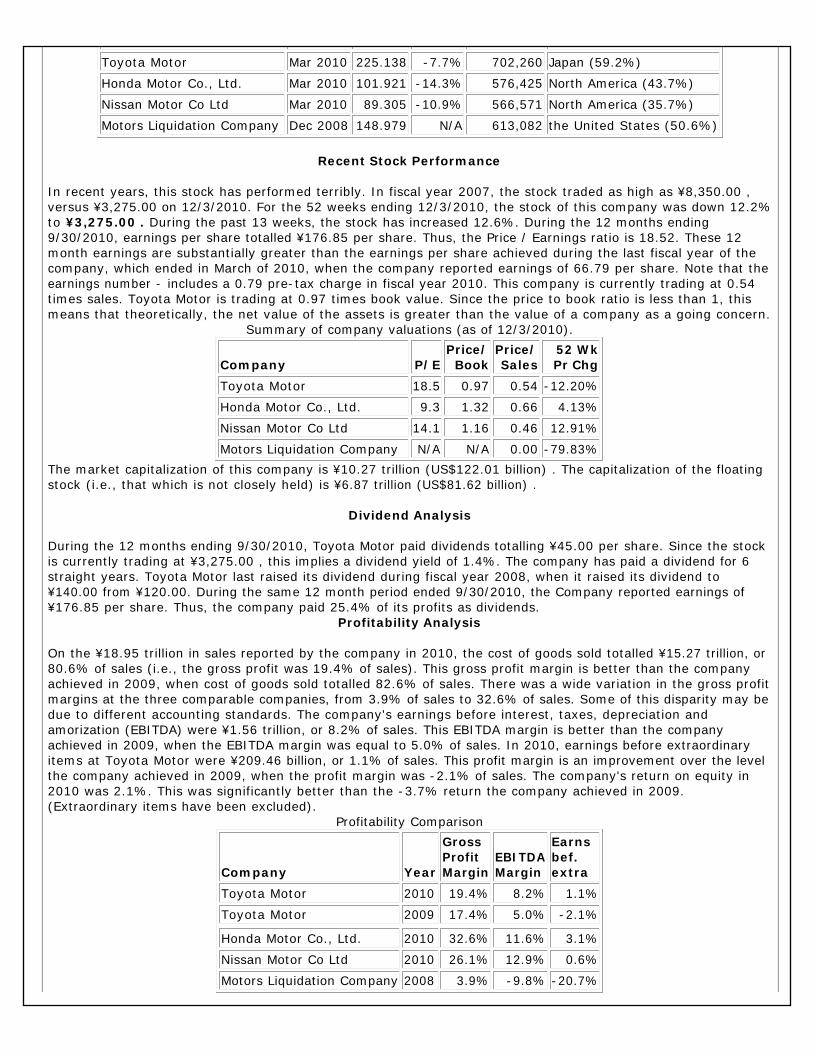
Toyota Motor Corporation operates within the Motor vehicles and car bodies sector. This analysis compares Toyota Motor with three other companies: Honda Motor Co., Ltd. (2010 sales of 8.58 trillion Japanese Yen [US$101.92 billion] of which 76% was Automobile Business), Nissan Motor Co Ltd (2010 sales: 7.52 trillion Japanese Yen [US$89.31 billion] of which 93% was Automobiles), and Motors Liquidation Company which is based in the United States (2008 sales of $148.98 billion of which 99% was Automotive Products). Note: not all of these companies have the same fiscal year: the most recent data for each company are being used.
Sales Analysis
During the year ended March of 2010, sales at Toyota Motor were ¥18.95 trillion (US$225.14 billion). This is a decrease of 7.7% versus 2009, when the company's sales were ¥20.53 trillion. The sales level in 2010 was fairly close to the level five years ago: in 2005, Toyota Motor had sales of ¥18.55 trillion. Contributing to the drop in overall sales was the 13.8% decline in Other, from ¥623.22 billion to ¥537.42 billion. There were also decreases in sales in Automotive (down 7.3% to ¥17.19 trillion) and Financial Services (down 9.6% to ¥1.23 trillion) .
Recent Sales at Toyota Motor
(Figures in Trillions of Japanese Yen) The company derives most of its revenues in its home market of Japan: in 2010, this region's sales were ¥11.22 trillion, which is equivalent to 59.2% of total sales. On a geographical basis, contributing to the decline in the company's sales in 2010 were the declines in Europe, where sales dropped 25.7% to ¥2.15 trillion. Sales in North America were also lower, falling 7.0% (to ¥5.67 trillion) . However, not all regions experienced a decline in sales. Sales in Japan increased 50.2% (to ¥11.22 trillion). Sales also increased in Asia/Far East (up 8.4% to ¥2.66 trillion) and in Rest of the World (up 3.3% to ¥1.67 trillion) . The company currently employs 320,590. With sales of ¥18.95 trillion (US$225.14 billion) , this equates to sales of US$702,260 per employee. This is higher than the three comparable companies, which had sales between US$566,571 and US$613,082 per employee.
Sales Comparisons (Most Recent Fiscal Year)
19
21
24
26
21
19
2005 2006 2007 2008 2009 2010
CompanyYear Ended
Sales (US$blns)
Sales Growth
Sales/ Emp (US$) Largest Region
Recent Stock Performance
In recent years, this stock has performed terribly. In fiscal year 2007, the stock traded as high as ¥8,350.00 , versus ¥3,275.00 on 12/3/2010. For the 52 weeks ending 12/3/2010, the stock of this company was down 12.2% to ¥3,275.00 . During the past 13 weeks, the stock has increased 12.6%. During the 12 months ending 9/30/2010, earnings per share totalled ¥176.85 per share. Thus, the Price / Earnings ratio is 18.52. These 12 month earnings are substantially greater than the earnings per share achieved during the last fiscal year of the company, which ended in March of 2010, when the company reported earnings of 66.79 per share. Note that the earnings number - includes a 0.79 pre-tax charge in fiscal year 2010. This company is currently trading at 0.54 times sales. Toyota Motor is trading at 0.97 times book value. Since the price to book ratio is less than 1, this means that theoretically, the net value of the assets is greater than the value of a company as a going concern.
Summary of company valuations (as of 12/3/2010).
The market capitalization of this company is ¥10.27 trillion (US$122.01 billion) . The capitalization of the floating stock (i.e., that which is not closely held) is ¥6.87 trillion (US$81.62 billion) .
Dividend Analysis
During the 12 months ending 9/30/2010, Toyota Motor paid dividends totalling ¥45.00 per share. Since the stock is currently trading at ¥3,275.00 , this implies a dividend yield of 1.4%. The company has paid a dividend for 6 straight years. Toyota Motor last raised its dividend during fiscal year 2008, when it raised its dividend to ¥140.00 from ¥120.00. During the same 12 month period ended 9/30/2010, the Company reported earnings of ¥176.85 per share. Thus, the company paid 25.4% of its profits as dividends.
Profitability Analysis On the ¥18.95 trillion in sales reported by the company in 2010, the cost of goods sold totalled ¥15.27 trillion, or 80.6% of sales (i.e., the gross profit was 19.4% of sales). This gross profit margin is better than the company achieved in 2009, when cost of goods sold totalled 82.6% of sales. There was a wide variation in the gross profit margins at the three comparable companies, from 3.9% of sales to 32.6% of sales. Some of this disparity may be due to different accounting standards. The company's earnings before interest, taxes, depreciation and amorization (EBITDA) were ¥1.56 trillion, or 8.2% of sales. This EBITDA margin is better than the company achieved in 2009, when the EBITDA margin was equal to 5.0% of sales. In 2010, earnings before extraordinary items at Toyota Motor were ¥209.46 billion, or 1.1% of sales. This profit margin is an improvement over the level the company achieved in 2009, when the profit margin was -2.1% of sales. The company's return on equity in 2010 was 2.1%. This was significantly better than the -3.7% return the company achieved in 2009. (Extraordinary items have been excluded).
Profitability Comparison
Toyota Motor Mar 2010 225.138 -7.7% 702,260 Japan (59.2%)
Honda Motor Co., Ltd. Mar 2010 101.921 -14.3% 576,425 North America (43.7%)
Nissan Motor Co Ltd Mar 2010 89.305 -10.9% 566,571 North America (35.7%)
Motors Liquidation Company Dec 2008 148.979 N/A 613,082 the United States (50.6%)
Company P/EPrice/
BookPrice/ Sales
52 Wk Pr Chg
Toyota Motor 18.5 0.97 0.54 -12.20%
Honda Motor Co., Ltd. 9.3 1.32 0.66 4.13%
Nissan Motor Co Ltd 14.1 1.16 0.46 12.91%
Motors Liquidation Company N/A N/A 0.00 -79.83%
Company Year
Gross Profit Margin
EBITDA Margin
Earns bef. extra
Toyota Motor 2010 19.4% 8.2% 1.1%
Toyota Motor 2009 17.4% 5.0% -2.1%
Honda Motor Co., Ltd. 2010 32.6% 11.6% 3.1%
Nissan Motor Co Ltd 2010 26.1% 12.9% 0.6%
Motors Liquidation Company 2008 3.9% -9.8% -20.7%
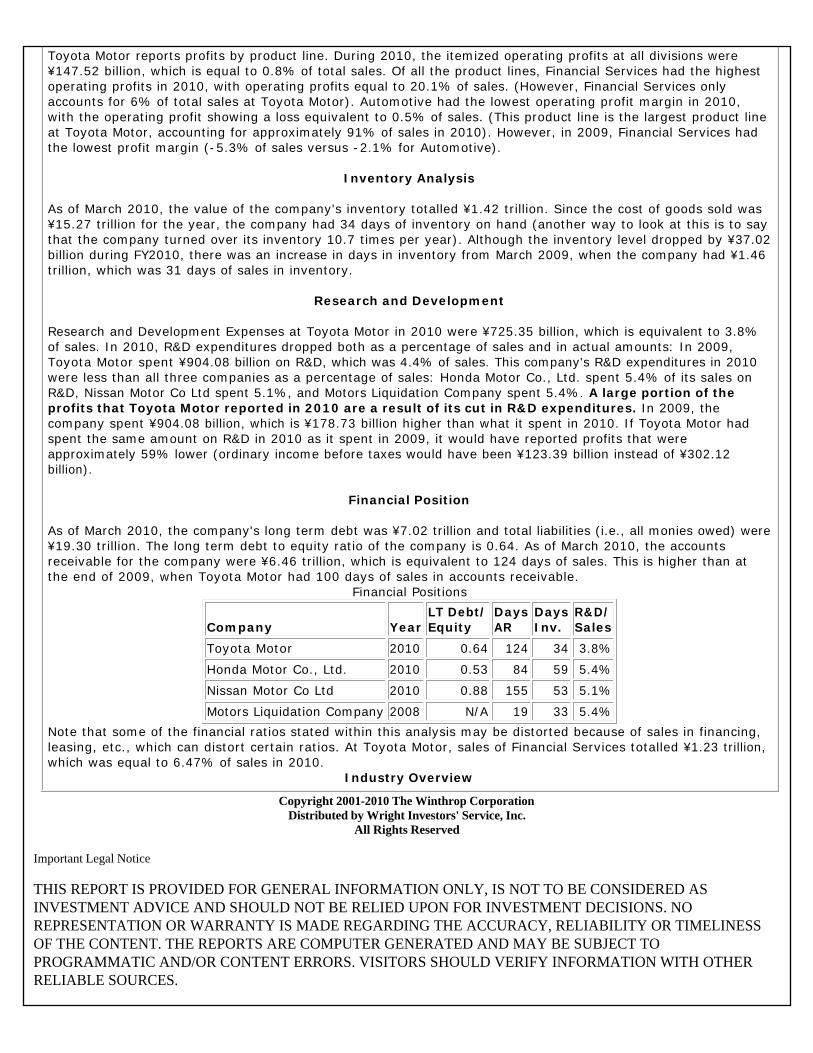
Toyota Motor reports profits by product line. During 2010, the itemized operating profits at all divisions were ¥147.52 billion, which is equal to 0.8% of total sales. Of all the product lines, Financial Services had the highest operating profits in 2010, with operating profits equal to 20.1% of sales. (However, Financial Services only accounts for 6% of total sales at Toyota Motor). Automotive had the lowest operating profit margin in 2010, with the operating profit showing a loss equivalent to 0.5% of sales. (This product line is the largest product line at Toyota Motor, accounting for approximately 91% of sales in 2010). However, in 2009, Financial Services had the lowest profit margin (-5.3% of sales versus -2.1% for Automotive).
Inventory Analysis
As of March 2010, the value of the company's inventory totalled ¥1.42 trillion. Since the cost of goods sold was ¥15.27 trillion for the year, the company had 34 days of inventory on hand (another way to look at this is to say that the company turned over its inventory 10.7 times per year). Although the inventory level dropped by ¥37.02 billion during FY2010, there was an increase in days in inventory from March 2009, when the company had ¥1.46 trillion, which was 31 days of sales in inventory.
Research and Development
Research and Development Expenses at Toyota Motor in 2010 were ¥725.35 billion, which is equivalent to 3.8% of sales. In 2010, R&D expenditures dropped both as a percentage of sales and in actual amounts: In 2009, Toyota Motor spent ¥904.08 billion on R&D, which was 4.4% of sales. This company's R&D expenditures in 2010 were less than all three companies as a percentage of sales: Honda Motor Co., Ltd. spent 5.4% of its sales on R&D, Nissan Motor Co Ltd spent 5.1%, and Motors Liquidation Company spent 5.4%. A large portion of the profits that Toyota Motor reported in 2010 are a result of its cut in R&D expenditures. In 2009, the company spent ¥904.08 billion, which is ¥178.73 billion higher than what it spent in 2010. If Toyota Motor had spent the same amount on R&D in 2010 as it spent in 2009, it would have reported profits that were approximately 59% lower (ordinary income before taxes would have been ¥123.39 billion instead of ¥302.12 billion).
Financial Position
As of March 2010, the company's long term debt was ¥7.02 trillion and total liabilities (i.e., all monies owed) were ¥19.30 trillion. The long term debt to equity ratio of the company is 0.64. As of March 2010, the accounts receivable for the company were ¥6.46 trillion, which is equivalent to 124 days of sales. This is higher than at the end of 2009, when Toyota Motor had 100 days of sales in accounts receivable.
Financial Positions
Note that some of the financial ratios stated within this analysis may be distorted because of sales in financing, leasing, etc., which can distort certain ratios. At Toyota Motor, sales of Financial Services totalled ¥1.23 trillion, which was equal to 6.47% of sales in 2010.
Industry Overview
Company YearLT Debt/ Equity
Days AR
Days Inv.
R&D/ Sales
Toyota Motor 2010 0.64 124 34 3.8%
Honda Motor Co., Ltd. 2010 0.53 84 59 5.4%
Nissan Motor Co Ltd 2010 0.88 155 53 5.1%
Motors Liquidation Company 2008 N/A 19 33 5.4%
Copyright 2001-2010 The Winthrop Corporation Distributed by Wright Investors' Service, Inc.
All Rights Reserved
Important Legal Notice THIS REPORT IS PROVIDED FOR GENERAL INFORMATION ONLY, IS NOT TO BE CONSIDERED AS INVESTMENT ADVICE AND SHOULD NOT BE RELIED UPON FOR INVESTMENT DECISIONS. NO REPRESENTATION OR WARRANTY IS MADE REGARDING THE ACCURACY, RELIABILITY OR TIMELINESS OF THE CONTENT. THE REPORTS ARE COMPUTER GENERATED AND MAY BE SUBJECT TO PROGRAMMATIC AND/OR CONTENT ERRORS. VISITORS SHOULD VERIFY INFORMATION WITH OTHER RELIABLE SOURCES.
THIS REPORT IS PROVIDED AS IS, WITHOUT WARRANTY OF ANY KIND, EXPRESS OR IMPLIED, INCLUDING BUT NOT LIMITED TO WARRANTIES OF MERCHANTABILITY, FITNESS FOR A PARTICULAR PURPOSE OR NON-INFRINGEMENT. IN NO EVENT WILL THE WINTHROP CORPORATION, WRIGHT INVESTORS' SERVICE, INC. OR ANY OF THEIR DATA PROVIDERS BE LIABLE FOR ANY DIRECT, INDIRECT, SPECIAL OR CONSEQUENTIAL DAMAGES, NO MATTER WHAT THE CAUSE. THE CONTENT OF THIS REPORT IS PROTECTED BY APPLICABLE COPYRIGHT LAWS. CONTENT MAY NOT BE REPRODUCED, DISTRIBUTED, MODIFIED OR FRAMED WITHOUT PRIOR WRITTEN PERMISSION.
Company Fundamentals\Summary Analysis
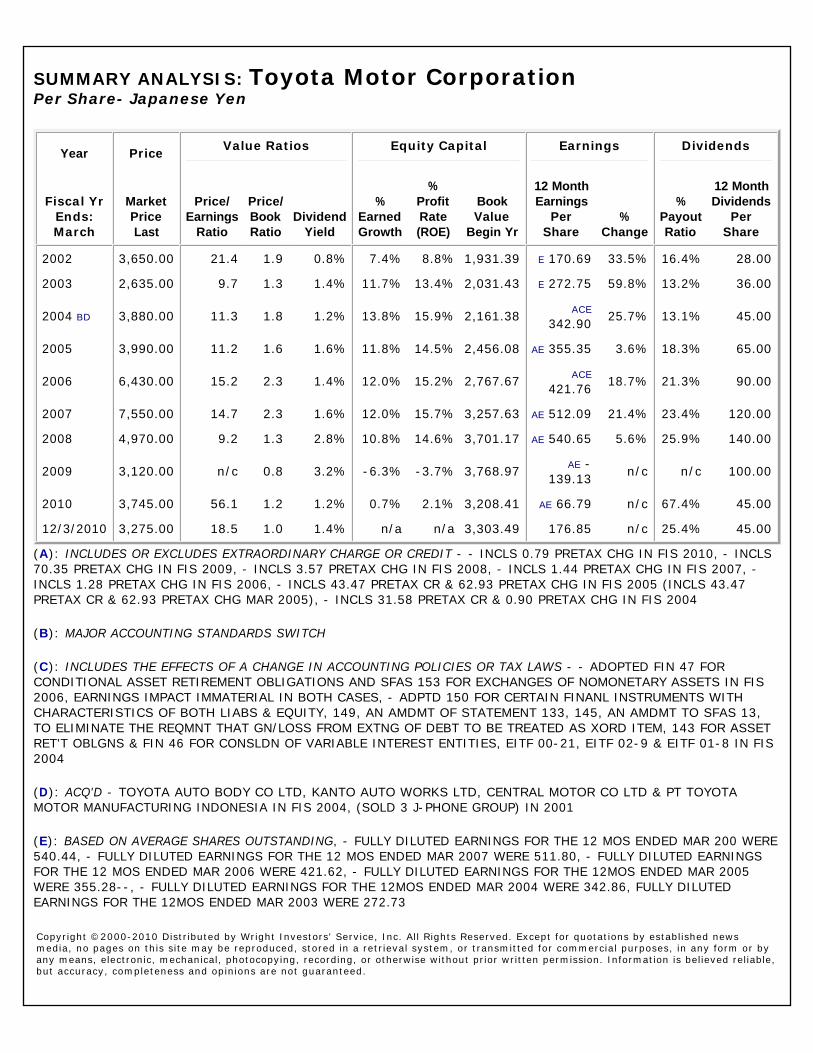
SUMMARY ANALYSIS: Toyota Motor Corporation Per Share- Japanese Yen
Year Price Value Ratios Equity Capital Earnings Dividends
Fiscal Yr Ends: March
Market Price Last
Price/ Earnings
Ratio
Price/ Book Ratio
Dividend Yield
% Earned Growth
% Profit Rate (ROE)
Book Value
Begin Yr
12 Month Earnings
Per Share
% Change
% Payout Ratio
12 Month Dividends
Per Share
2002 3,650.00 21.4 1.9 0.8% 7.4% 8.8% 1,931.39 E 170.69 33.5% 16.4% 28.00
2003 2,635.00 9.7 1.3 1.4% 11.7% 13.4% 2,031.43 E 272.75 59.8% 13.2% 36.00
2004 BD 3,880.00 11.3 1.8 1.2% 13.8% 15.9% 2,161.38 ACE 342.90 25.7% 13.1% 45.00
2005 3,990.00 11.2 1.6 1.6% 11.8% 14.5% 2,456.08 AE 355.35 3.6% 18.3% 65.00
2006 6,430.00 15.2 2.3 1.4% 12.0% 15.2% 2,767.67 ACE 421.76 18.7% 21.3% 90.00
2007 7,550.00 14.7 2.3 1.6% 12.0% 15.7% 3,257.63 AE 512.09 21.4% 23.4% 120.00
2008 4,970.00 9.2 1.3 2.8% 10.8% 14.6% 3,701.17 AE 540.65 5.6% 25.9% 140.00
2009 3,120.00 n/c 0.8 3.2% -6.3% -3.7% 3,768.97 AE -139.13 n/c n/c 100.00
2010 3,745.00 56.1 1.2 1.2% 0.7% 2.1% 3,208.41 AE 66.79 n/c 67.4% 45.00
12/3/2010 3,275.00 18.5 1.0 1.4% n/a n/a 3,303.49 176.85 n/c 25.4% 45.00
(A): INCLUDES OR EXCLUDES EXTRAORDINARY CHARGE OR CREDIT - - INCLS 0.79 PRETAX CHG IN FIS 2010, - INCLS 70.35 PRETAX CHG IN FIS 2009, - INCLS 3.57 PRETAX CHG IN FIS 2008, - INCLS 1.44 PRETAX CHG IN FIS 2007, - INCLS 1.28 PRETAX CHG IN FIS 2006, - INCLS 43.47 PRETAX CR & 62.93 PRETAX CHG IN FIS 2005 (INCLS 43.47 PRETAX CR & 62.93 PRETAX CHG MAR 2005), - INCLS 31.58 PRETAX CR & 0.90 PRETAX CHG IN FIS 2004
(B): MAJOR ACCOUNTING STANDARDS SWITCH
(C): INCLUDES THE EFFECTS OF A CHANGE IN ACCOUNTING POLICIES OR TAX LAWS - - ADOPTED FIN 47 FOR CONDITIONAL ASSET RETIREMENT OBLIGATIONS AND SFAS 153 FOR EXCHANGES OF NOMONETARY ASSETS IN FIS 2006, EARNINGS IMPACT IMMATERIAL IN BOTH CASES, - ADPTD 150 FOR CERTAIN FINANL INSTRUMENTS WITH CHARACTERISTICS OF BOTH LIABS & EQUITY, 149, AN AMDMT OF STATEMENT 133, 145, AN AMDMT TO SFAS 13, TO ELIMINATE THE REQMNT THAT GN/LOSS FROM EXTNG OF DEBT TO BE TREATED AS XORD ITEM, 143 FOR ASSET RET'T OBLGNS & FIN 46 FOR CONSLDN OF VARIABLE INTEREST ENTITIES, EITF 00-21, EITF 02-9 & EITF 01-8 IN FIS 2004
(D): ACQ'D - TOYOTA AUTO BODY CO LTD, KANTO AUTO WORKS LTD, CENTRAL MOTOR CO LTD & PT TOYOTA MOTOR MANUFACTURING INDONESIA IN FIS 2004, (SOLD 3 J-PHONE GROUP) IN 2001
(E): BASED ON AVERAGE SHARES OUTSTANDING, - FULLY DILUTED EARNINGS FOR THE 12 MOS ENDED MAR 200 WERE 540.44, - FULLY DILUTED EARNINGS FOR THE 12 MOS ENDED MAR 2007 WERE 511.80, - FULLY DILUTED EARNINGS FOR THE 12 MOS ENDED MAR 2006 WERE 421.62, - FULLY DILUTED EARNINGS FOR THE 12MOS ENDED MAR 2005 WERE 355.28--, - FULLY DILUTED EARNINGS FOR THE 12MOS ENDED MAR 2004 WERE 342.86, FULLY DILUTED EARNINGS FOR THE 12MOS ENDED MAR 2003 WERE 272.73
Copyright ©2000-2010 Distributed by Wright Investors' Service, Inc. All Rights Reserved. Except for quotations by established news media, no pages on this site may be reproduced, stored in a retrieval system, or transmitted for commercial purposes, in any form or by any means, electronic, mechanical, photocopying, recording, or otherwise without prior written permission. Information is believed reliable, but accuracy, completeness and opinions are not guaranteed.

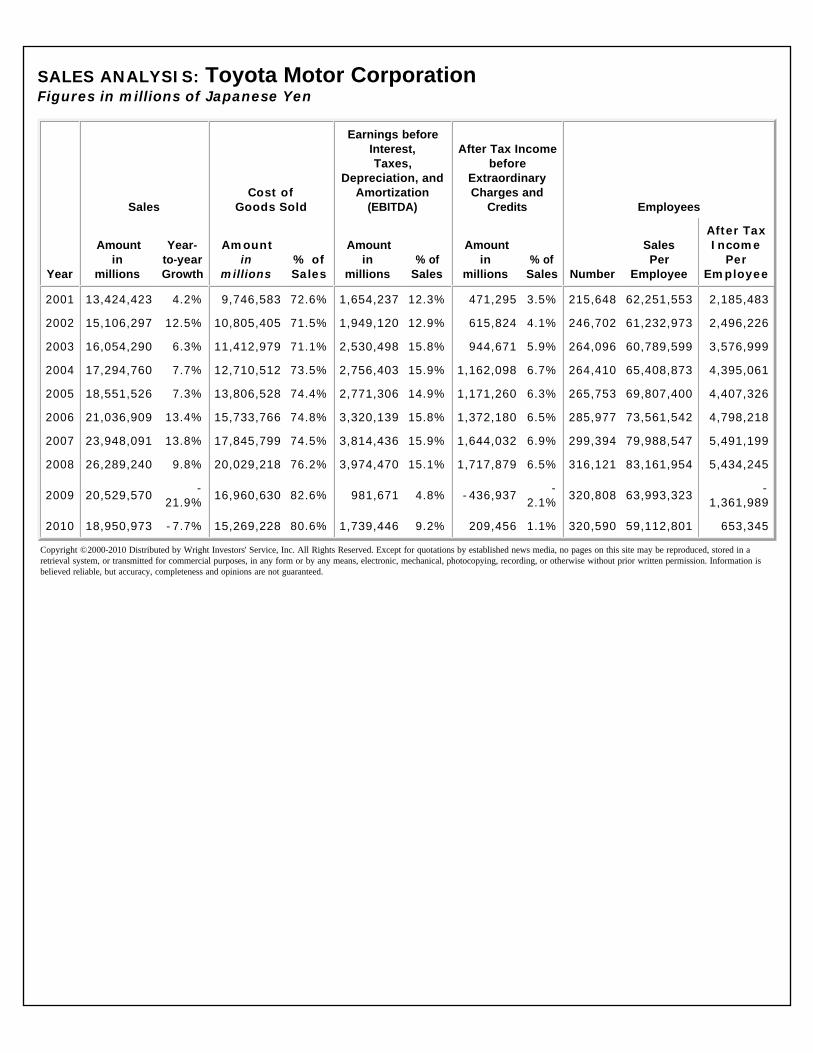
Company Fundamentals\Sales Analysis
SALES ANALYSIS: Toyota Motor Corporation Figures in millions of Japanese Yen
Year
SalesCost of
Goods Sold
Earnings before Interest, Taxes,
Depreciation, and Amortization
(EBITDA)
After Tax Income before
Extraordinary Charges and
Credits Employees
Amount in
millions
Year-to-year Growth
Amount in
millions% of Sales
Amount in
millions% of
Sales
Amount in
millions% of
Sales Number
Sales Per
Employee
After Tax Income
Per Employee
2001 13,424,423 4.2% 9,746,583 72.6% 1,654,237 12.3% 471,295 3.5% 215,648 62,251,553 2,185,483
2002 15,106,297 12.5% 10,805,405 71.5% 1,949,120 12.9% 615,824 4.1% 246,702 61,232,973 2,496,226
2003 16,054,290 6.3% 11,412,979 71.1% 2,530,498 15.8% 944,671 5.9% 264,096 60,789,599 3,576,999
2004 17,294,760 7.7% 12,710,512 73.5% 2,756,403 15.9% 1,162,098 6.7% 264,410 65,408,873 4,395,061
2005 18,551,526 7.3% 13,806,528 74.4% 2,771,306 14.9% 1,171,260 6.3% 265,753 69,807,400 4,407,326
2006 21,036,909 13.4% 15,733,766 74.8% 3,320,139 15.8% 1,372,180 6.5% 285,977 73,561,542 4,798,218
2007 23,948,091 13.8% 17,845,799 74.5% 3,814,436 15.9% 1,644,032 6.9% 299,394 79,988,547 5,491,199
2008 26,289,240 9.8% 20,029,218 76.2% 3,974,470 15.1% 1,717,879 6.5% 316,121 83,161,954 5,434,245
2009 20,529,570 -21.9% 16,960,630 82.6% 981,671 4.8% -436,937 -
2.1% 320,808 63,993,323 -1,361,989
2010 18,950,973 -7.7% 15,269,228 80.6% 1,739,446 9.2% 209,456 1.1% 320,590 59,112,801 653,345
Copyright ©2000-2010 Distributed by Wright Investors' Service, Inc. All Rights Reserved. Except for quotations by established news media, no pages on this site may be reproduced, stored in a retrieval system, or transmitted for commercial purposes, in any form or by any means, electronic, mechanical, photocopying, recording, or otherwise without prior written permission. Information is believed reliable, but accuracy, completeness and opinions are not guaranteed.

Company Fundamentals\Price Analysis
PRICE ANALYSIS: Toyota Motor Corporation Per Share- Japanese Yen
QuarterHigh Price
Low Price
Closing Price
Quarterly %Change
12 months
%Change
2002 Jan - Mar 3,920.000 3,210.000 3,650.000 n/a n/a
Apr - Jun 3,790.000 2,995.000 3,180.000 -12.9% n/a
Jul - Sep 3,450.000 2,690.000 3,130.000 -1.6% n/a
Oct - Dec 3,300.000 2,755.000 3,190.000 1.9% n/a
2003 Jan - Mar 3,300.000 2,625.000 2,635.000 -17.4% -27.8%
Apr - Jun 3,180.000 2,455.000 3,110.000 18.0% -2.2%
Jul - Sep 3,920.000 2,975.000 3,280.000 5.5% 4.8%
Oct - Dec 3,720.000 3,130.000 3,620.000 10.4% 13.5%
2004 Jan - Mar 3,990.000 3,390.000 3,880.000 7.2% 47.2%
Apr - Jun 4,440.000 3,730.000 4,420.000 13.9% 42.1%
Jul - Sep 4,520.000 4,030.000 4,220.000 -4.5% 28.7%
Oct - Dec 4,320.000 3,780.000 4,170.000 -1.2% 15.2%
2005 Jan - Mar 4,220.000 3,940.000 3,990.000 -4.3% 2.8%
Apr - Jun 4,150.000 3,790.000 3,970.000 -0.5% -10.2%
Jul - Sep 5,330.000 3,970.000 5,200.000 31.0% 23.2%
Oct - Dec 6,180.000 4,950.000 6,120.000 17.7% 46.8%
2006 Jan - Mar 6,560.000 5,600.000 6,430.000 5.1% 61.2%
Apr - Jun 6,950.000 5,430.000 5,990.000 -6.8% 50.9%
Jul - Sep 6,520.000 5,570.000 6,420.000 7.2% 23.5%
Oct - Dec 8,000.000 6,430.000 7,960.000 24.0% 30.1%
2007 Jan - Mar 8,350.000 7,440.000 7,550.000 -5.2% 17.4%
Apr - Jun 7,820.000 7,010.000 7,800.000 3.3% 30.2%
Jul - Sep 7,880.000 6,130.000 6,780.000 -13.1% 5.6%
Oct - Dec 6,910.000 5,780.000 6,040.000 -10.9% -24.1%
2008 Jan - Mar 6,400.000 4,810.000 4,970.000 -17.7% -34.2%
Apr - Jun 5,710.000 4,800.000 5,010.000 0.8% -35.8%
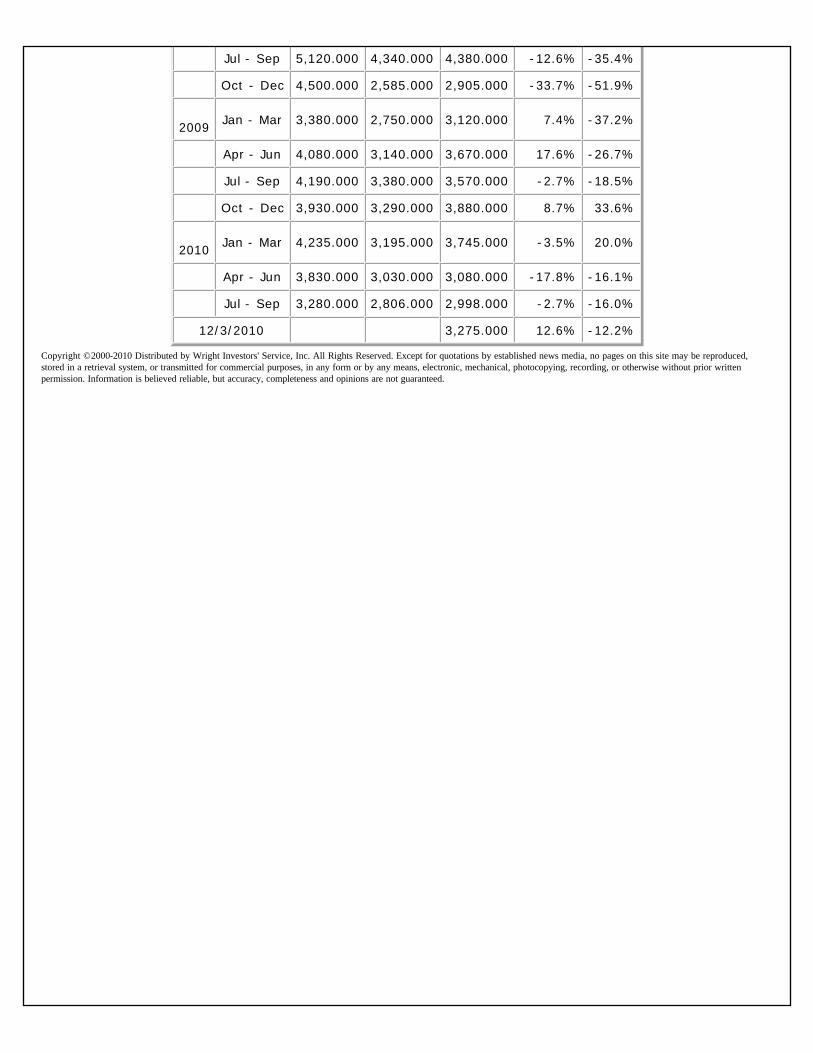
Jul - Sep 5,120.000 4,340.000 4,380.000 -12.6% -35.4%
Oct - Dec 4,500.000 2,585.000 2,905.000 -33.7% -51.9%
2009 Jan - Mar 3,380.000 2,750.000 3,120.000 7.4% -37.2%
Apr - Jun 4,080.000 3,140.000 3,670.000 17.6% -26.7%
Jul - Sep 4,190.000 3,380.000 3,570.000 -2.7% -18.5%
Oct - Dec 3,930.000 3,290.000 3,880.000 8.7% 33.6%
2010 Jan - Mar 4,235.000 3,195.000 3,745.000 -3.5% 20.0%
Apr - Jun 3,830.000 3,030.000 3,080.000 -17.8% -16.1%
Jul - Sep 3,280.000 2,806.000 2,998.000 -2.7% -16.0%
12/3/2010 3,275.000 12.6% -12.2%
Copyright ©2000-2010 Distributed by Wright Investors' Service, Inc. All Rights Reserved. Except for quotations by established news media, no pages on this site may be reproduced, stored in a retrieval system, or transmitted for commercial purposes, in any form or by any means, electronic, mechanical, photocopying, recording, or otherwise without prior written permission. Information is believed reliable, but accuracy, completeness and opinions are not guaranteed.
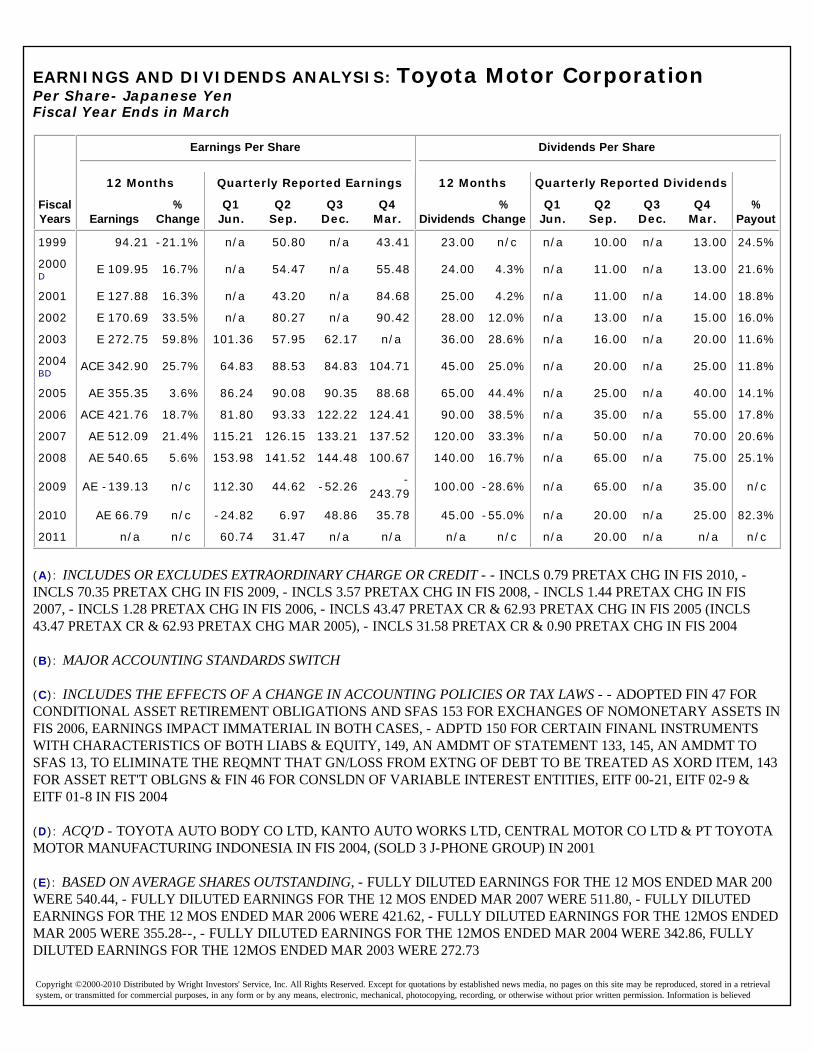
Company Fundamentals\Earnings & Dividends Analysis
EARNINGS AND DIVIDENDS ANALYSIS: Toyota Motor Corporation Per Share- Japanese Yen Fiscal Year Ends in March
(A): INCLUDES OR EXCLUDES EXTRAORDINARY CHARGE OR CREDIT - - INCLS 0.79 PRETAX CHG IN FIS 2010, - INCLS 70.35 PRETAX CHG IN FIS 2009, - INCLS 3.57 PRETAX CHG IN FIS 2008, - INCLS 1.44 PRETAX CHG IN FIS 2007, - INCLS 1.28 PRETAX CHG IN FIS 2006, - INCLS 43.47 PRETAX CR & 62.93 PRETAX CHG IN FIS 2005 (INCLS 43.47 PRETAX CR & 62.93 PRETAX CHG MAR 2005), - INCLS 31.58 PRETAX CR & 0.90 PRETAX CHG IN FIS 2004
(B): MAJOR ACCOUNTING STANDARDS SWITCH
(C): INCLUDES THE EFFECTS OF A CHANGE IN ACCOUNTING POLICIES OR TAX LAWS - - ADOPTED FIN 47 FOR CONDITIONAL ASSET RETIREMENT OBLIGATIONS AND SFAS 153 FOR EXCHANGES OF NOMONETARY ASSETS IN FIS 2006, EARNINGS IMPACT IMMATERIAL IN BOTH CASES, - ADPTD 150 FOR CERTAIN FINANL INSTRUMENTS WITH CHARACTERISTICS OF BOTH LIABS & EQUITY, 149, AN AMDMT OF STATEMENT 133, 145, AN AMDMT TO SFAS 13, TO ELIMINATE THE REQMNT THAT GN/LOSS FROM EXTNG OF DEBT TO BE TREATED AS XORD ITEM, 143 FOR ASSET RET'T OBLGNS & FIN 46 FOR CONSLDN OF VARIABLE INTEREST ENTITIES, EITF 00-21, EITF 02-9 & EITF 01-8 IN FIS 2004
(D): ACQ'D - TOYOTA AUTO BODY CO LTD, KANTO AUTO WORKS LTD, CENTRAL MOTOR CO LTD & PT TOYOTA MOTOR MANUFACTURING INDONESIA IN FIS 2004, (SOLD 3 J-PHONE GROUP) IN 2001
(E): BASED ON AVERAGE SHARES OUTSTANDING, - FULLY DILUTED EARNINGS FOR THE 12 MOS ENDED MAR 200 WERE 540.44, - FULLY DILUTED EARNINGS FOR THE 12 MOS ENDED MAR 2007 WERE 511.80, - FULLY DILUTED EARNINGS FOR THE 12 MOS ENDED MAR 2006 WERE 421.62, - FULLY DILUTED EARNINGS FOR THE 12MOS ENDED MAR 2005 WERE 355.28--, - FULLY DILUTED EARNINGS FOR THE 12MOS ENDED MAR 2004 WERE 342.86, FULLY DILUTED EARNINGS FOR THE 12MOS ENDED MAR 2003 WERE 272.73
Fiscal Years
Earnings Per Share Dividends Per Share
12 Months Quarterly Reported Earnings 12 Months Quarterly Reported Dividends
Earnings%
ChangeQ1
Jun.Q2
Sep.Q3
Dec.Q4
Mar. Dividends%
ChangeQ1
Jun.Q2
Sep.Q3
Dec.Q4
Mar.%
Payout
1999 94.21 -21.1% n/a 50.80 n/a 43.41 23.00 n/c n/a 10.00 n/a 13.00 24.5%
2000 D
E 109.95 16.7% n/a 54.47 n/a 55.48 24.00 4.3% n/a 11.00 n/a 13.00 21.6%
2001 E 127.88 16.3% n/a 43.20 n/a 84.68 25.00 4.2% n/a 11.00 n/a 14.00 18.8%
2002 E 170.69 33.5% n/a 80.27 n/a 90.42 28.00 12.0% n/a 13.00 n/a 15.00 16.0%
2003 E 272.75 59.8% 101.36 57.95 62.17 n/a 36.00 28.6% n/a 16.00 n/a 20.00 11.6%
2004 BD
ACE 342.90 25.7% 64.83 88.53 84.83 104.71 45.00 25.0% n/a 20.00 n/a 25.00 11.8%
2005 AE 355.35 3.6% 86.24 90.08 90.35 88.68 65.00 44.4% n/a 25.00 n/a 40.00 14.1%
2006 ACE 421.76 18.7% 81.80 93.33 122.22 124.41 90.00 38.5% n/a 35.00 n/a 55.00 17.8%
2007 AE 512.09 21.4% 115.21 126.15 133.21 137.52 120.00 33.3% n/a 50.00 n/a 70.00 20.6%
2008 AE 540.65 5.6% 153.98 141.52 144.48 100.67 140.00 16.7% n/a 65.00 n/a 75.00 25.1%
2009 AE -139.13 n/c 112.30 44.62 -52.26 -243.79 100.00 -28.6% n/a 65.00 n/a 35.00 n/c
2010 AE 66.79 n/c -24.82 6.97 48.86 35.78 45.00 -55.0% n/a 20.00 n/a 25.00 82.3%
2011 n/a n/c 60.74 31.47 n/a n/a n/a n/c n/a 20.00 n/a n/a n/c
Copyright ©2000-2010 Distributed by Wright Investors' Service, Inc. All Rights Reserved. Except for quotations by established news media, no pages on this site may be reproduced, stored in a retrieval system, or transmitted for commercial purposes, in any form or by any means, electronic, mechanical, photocopying, recording, or otherwise without prior written permission. Information is believed
reliable, but accuracy, completeness and opinions are not guaranteed.
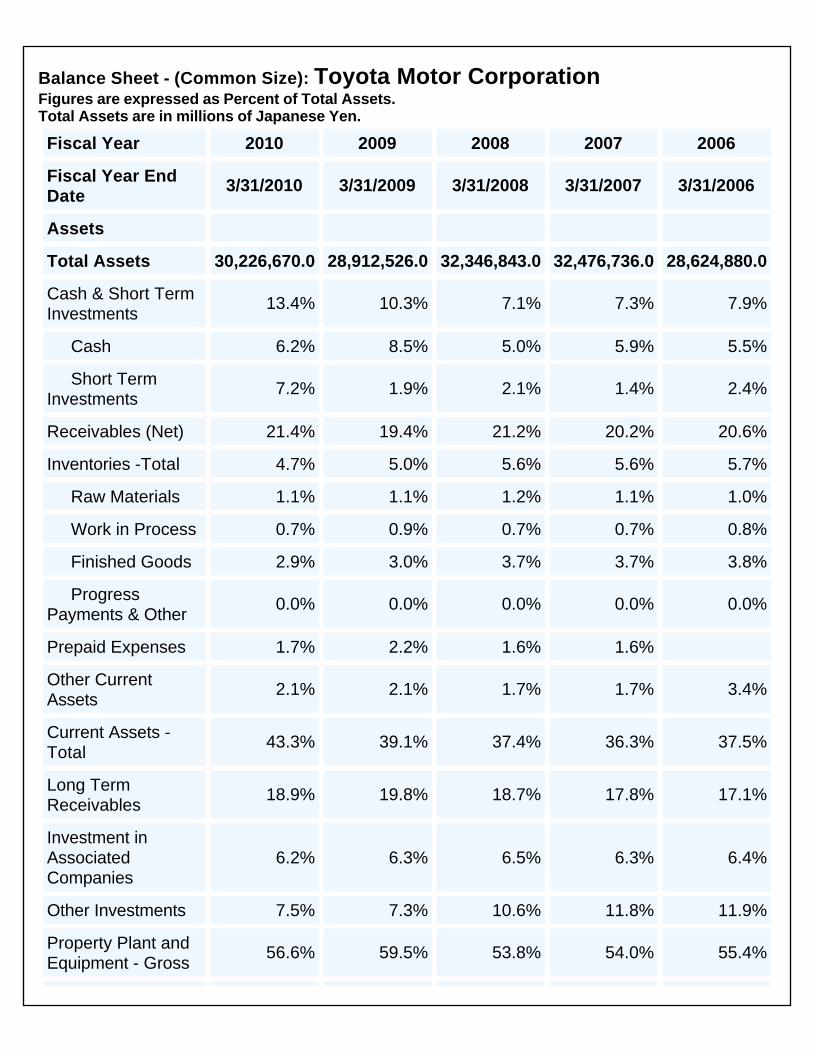
Financial Statement AnalysesFinancial Statement Analyses\Balance Sheet - Common Size
Balance Sheet - (Common Size): Toyota Motor Corporation Figures are expressed as Percent of Total Assets. Total Assets are in millions of Japanese Yen.
Fiscal Year 2010 2009 2008 2007 2006
Fiscal Year End Date
3/31/2010 3/31/2009 3/31/2008 3/31/2007 3/31/2006
Assets
Total Assets 30,226,670.0 28,912,526.0 32,346,843.0 32,476,736.0 28,624,880.0
Cash & Short Term Investments
13.4% 10.3% 7.1% 7.3% 7.9%
Cash 6.2% 8.5% 5.0% 5.9% 5.5%
Short Term Investments
7.2% 1.9% 2.1% 1.4% 2.4%
Receivables (Net) 21.4% 19.4% 21.2% 20.2% 20.6%
Inventories -Total 4.7% 5.0% 5.6% 5.6% 5.7%
Raw Materials 1.1% 1.1% 1.2% 1.1% 1.0%
Work in Process 0.7% 0.9% 0.7% 0.7% 0.8%
Finished Goods 2.9% 3.0% 3.7% 3.7% 3.8%
Progress Payments & Other
0.0% 0.0% 0.0% 0.0% 0.0%
Prepaid Expenses 1.7% 2.2% 1.6% 1.6%
Other Current Assets
2.1% 2.1% 1.7% 1.7% 3.4%
Current Assets - Total
43.3% 39.1% 37.4% 36.3% 37.5%
Long Term Receivables
18.9% 19.8% 18.7% 17.8% 17.1%
Investment in Associated Companies
6.2% 6.3% 6.5% 6.3% 6.4%
Other Investments 7.5% 7.3% 10.6% 11.8% 11.9%
Property Plant and Equipment - Gross
56.6% 59.5% 53.8% 54.0% 55.4%
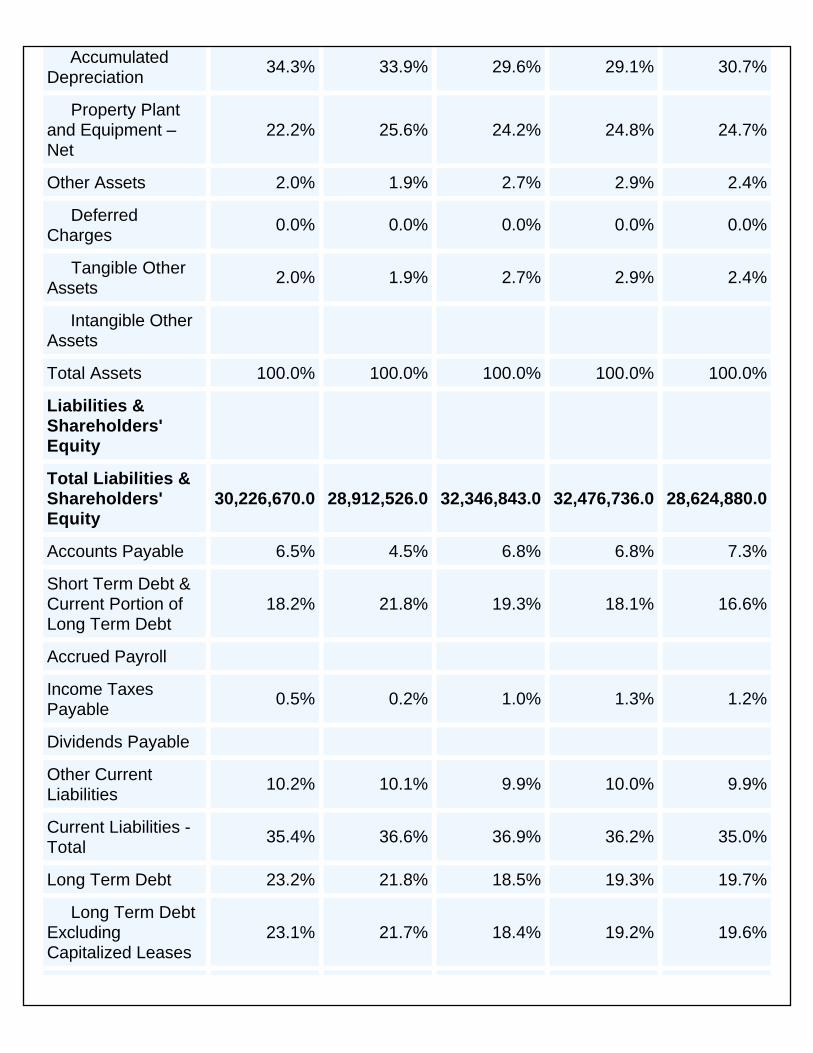
Accumulated Depreciation
34.3% 33.9% 29.6% 29.1% 30.7%
Property Plant and Equipment – Net
22.2% 25.6% 24.2% 24.8% 24.7%
Other Assets 2.0% 1.9% 2.7% 2.9% 2.4%
Deferred Charges
0.0% 0.0% 0.0% 0.0% 0.0%
Tangible Other Assets
2.0% 1.9% 2.7% 2.9% 2.4%
Intangible Other Assets
Total Assets 100.0% 100.0% 100.0% 100.0% 100.0%
Liabilities & Shareholders' Equity
Total Liabilities & Shareholders' Equity
30,226,670.0 28,912,526.0 32,346,843.0 32,476,736.0 28,624,880.0
Accounts Payable 6.5% 4.5% 6.8% 6.8% 7.3%
Short Term Debt & Current Portion of Long Term Debt
18.2% 21.8% 19.3% 18.1% 16.6%
Accrued Payroll
Income Taxes Payable
0.5% 0.2% 1.0% 1.3% 1.2%
Dividends Payable
Other Current Liabilities
10.2% 10.1% 9.9% 10.0% 9.9%
Current Liabilities - Total
35.4% 36.6% 36.9% 36.2% 35.0%
Long Term Debt 23.2% 21.8% 18.5% 19.3% 19.7%
Long Term Debt Excluding Capitalized Leases
23.1% 21.7% 18.4% 19.2% 19.6%
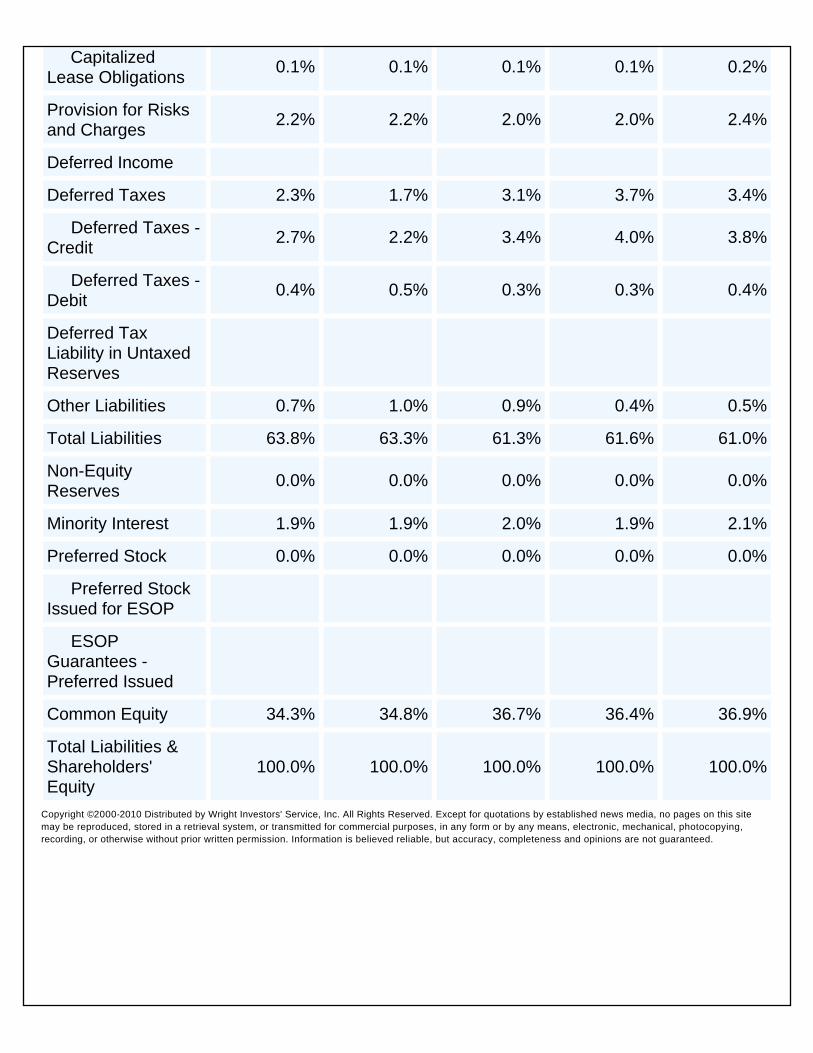
Capitalized Lease Obligations
0.1% 0.1% 0.1% 0.1% 0.2%
Provision for Risks and Charges
2.2% 2.2% 2.0% 2.0% 2.4%
Deferred Income
Deferred Taxes 2.3% 1.7% 3.1% 3.7% 3.4%
Deferred Taxes - Credit
2.7% 2.2% 3.4% 4.0% 3.8%
Deferred Taxes - Debit
0.4% 0.5% 0.3% 0.3% 0.4%
Deferred Tax Liability in Untaxed Reserves
Other Liabilities 0.7% 1.0% 0.9% 0.4% 0.5%
Total Liabilities 63.8% 63.3% 61.3% 61.6% 61.0%
Non-Equity Reserves
0.0% 0.0% 0.0% 0.0% 0.0%
Minority Interest 1.9% 1.9% 2.0% 1.9% 2.1%
Preferred Stock 0.0% 0.0% 0.0% 0.0% 0.0%
Preferred Stock Issued for ESOP
ESOP Guarantees - Preferred Issued
Common Equity 34.3% 34.8% 36.7% 36.4% 36.9%
Total Liabilities & Shareholders' Equity
100.0% 100.0% 100.0% 100.0% 100.0%
Copyright ©2000-2010 Distributed by Wright Investors' Service, Inc. All Rights Reserved. Except for quotations by established news media, no pages on this site may be reproduced, stored in a retrieval system, or transmitted for commercial purposes, in any form or by any means, electronic, mechanical, photocopying, recording, or otherwise without prior written permission. Information is believed reliable, but accuracy, completeness and opinions are not guaranteed.
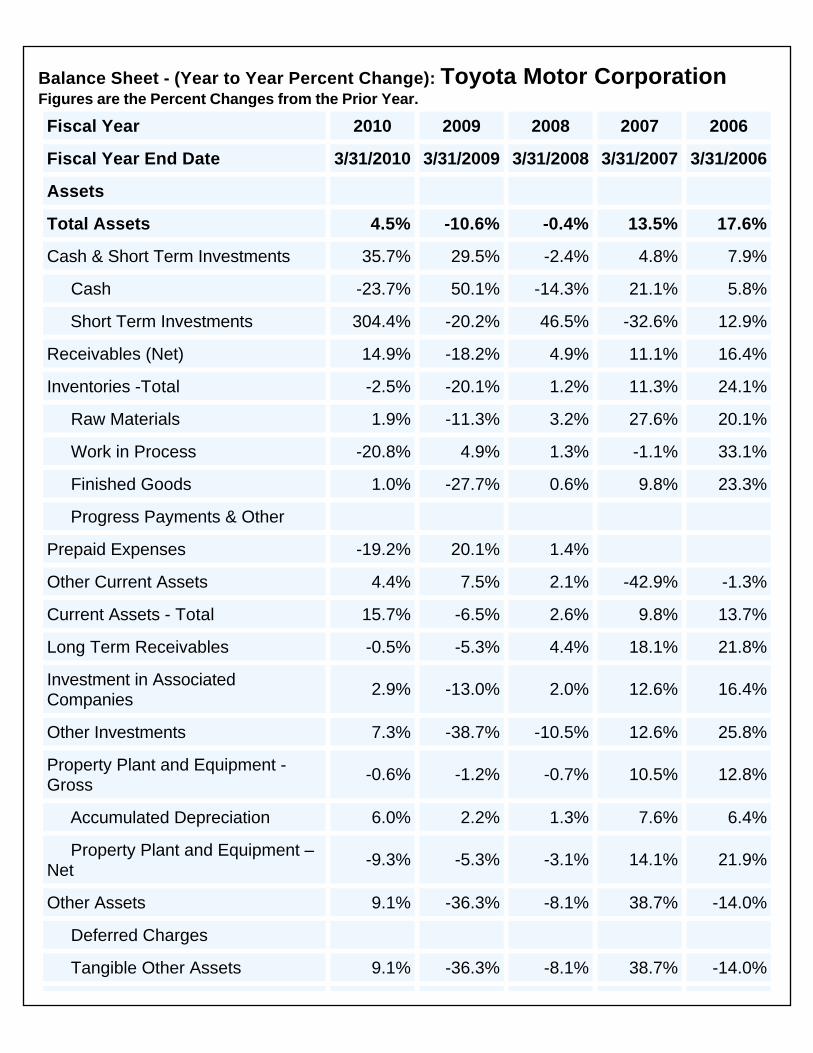
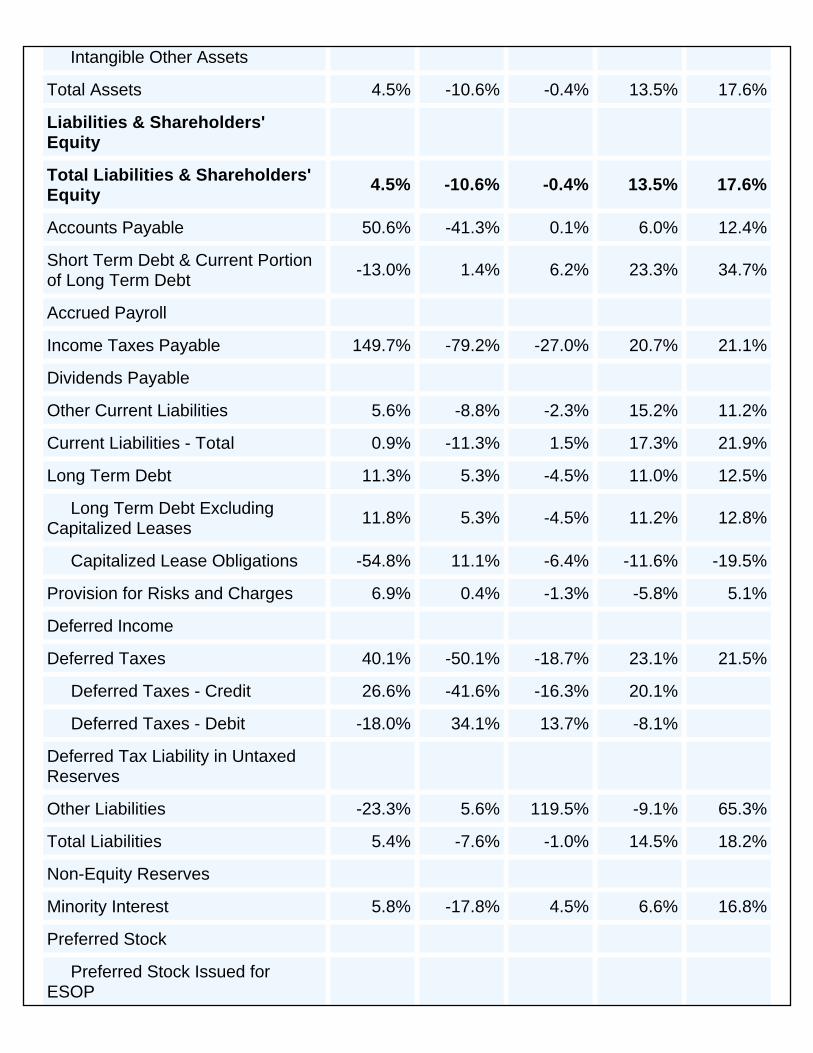
Financial Statement Analyses\Balance Sheet - Year-Year % Change
Balance Sheet - (Year to Year Percent Change): Toyota Motor Corporation Figures are the Percent Changes from the Prior Year.
Fiscal Year 2010 2009 2008 2007 2006
Fiscal Year End Date 3/31/2010 3/31/2009 3/31/2008 3/31/2007 3/31/2006
Assets
Total Assets 4.5% -10.6% -0.4% 13.5% 17.6%
Cash & Short Term Investments 35.7% 29.5% -2.4% 4.8% 7.9%
Cash -23.7% 50.1% -14.3% 21.1% 5.8%
Short Term Investments 304.4% -20.2% 46.5% -32.6% 12.9%
Receivables (Net) 14.9% -18.2% 4.9% 11.1% 16.4%
Inventories -Total -2.5% -20.1% 1.2% 11.3% 24.1%
Raw Materials 1.9% -11.3% 3.2% 27.6% 20.1%
Work in Process -20.8% 4.9% 1.3% -1.1% 33.1%
Finished Goods 1.0% -27.7% 0.6% 9.8% 23.3%
Progress Payments & Other
Prepaid Expenses -19.2% 20.1% 1.4%
Other Current Assets 4.4% 7.5% 2.1% -42.9% -1.3%
Current Assets - Total 15.7% -6.5% 2.6% 9.8% 13.7%
Long Term Receivables -0.5% -5.3% 4.4% 18.1% 21.8%
Investment in Associated Companies
2.9% -13.0% 2.0% 12.6% 16.4%
Other Investments 7.3% -38.7% -10.5% 12.6% 25.8%
Property Plant and Equipment - Gross
-0.6% -1.2% -0.7% 10.5% 12.8%
Accumulated Depreciation 6.0% 2.2% 1.3% 7.6% 6.4%
Property Plant and Equipment – Net
-9.3% -5.3% -3.1% 14.1% 21.9%
Other Assets 9.1% -36.3% -8.1% 38.7% -14.0%
Deferred Charges
Tangible Other Assets 9.1% -36.3% -8.1% 38.7% -14.0%
Intangible Other Assets
Total Assets 4.5% -10.6% -0.4% 13.5% 17.6%
Liabilities & Shareholders' Equity
Total Liabilities & Shareholders' Equity
4.5% -10.6% -0.4% 13.5% 17.6%
Accounts Payable 50.6% -41.3% 0.1% 6.0% 12.4%
Short Term Debt & Current Portion of Long Term Debt
-13.0% 1.4% 6.2% 23.3% 34.7%
Accrued Payroll
Income Taxes Payable 149.7% -79.2% -27.0% 20.7% 21.1%
Dividends Payable
Other Current Liabilities 5.6% -8.8% -2.3% 15.2% 11.2%
Current Liabilities - Total 0.9% -11.3% 1.5% 17.3% 21.9%
Long Term Debt 11.3% 5.3% -4.5% 11.0% 12.5%
Long Term Debt Excluding Capitalized Leases
11.8% 5.3% -4.5% 11.2% 12.8%
Capitalized Lease Obligations -54.8% 11.1% -6.4% -11.6% -19.5%
Provision for Risks and Charges 6.9% 0.4% -1.3% -5.8% 5.1%
Deferred Income
Deferred Taxes 40.1% -50.1% -18.7% 23.1% 21.5%
Deferred Taxes - Credit 26.6% -41.6% -16.3% 20.1%
Deferred Taxes - Debit -18.0% 34.1% 13.7% -8.1%
Deferred Tax Liability in Untaxed Reserves
Other Liabilities -23.3% 5.6% 119.5% -9.1% 65.3%
Total Liabilities 5.4% -7.6% -1.0% 14.5% 18.2%
Non-Equity Reserves
Minority Interest 5.8% -17.8% 4.5% 6.6% 16.8%
Preferred Stock
Preferred Stock Issued for ESOP
ESOP Guarantees - Preferred Issued
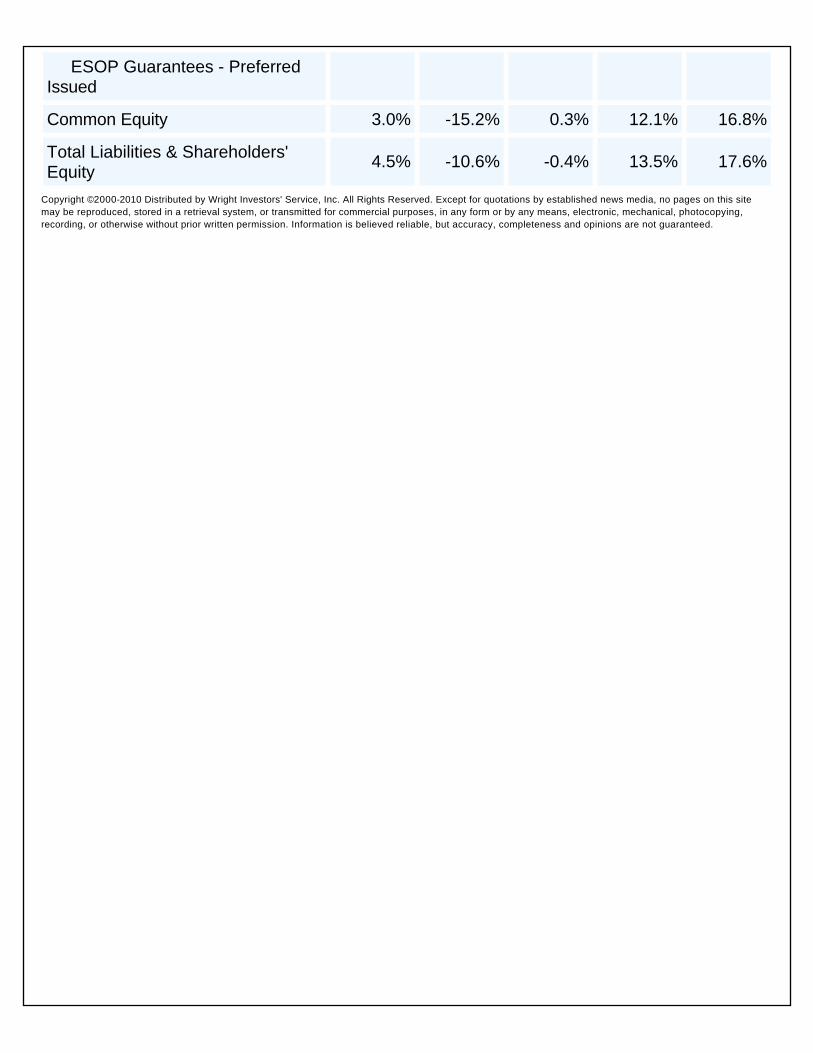
Common Equity 3.0% -15.2% 0.3% 12.1% 16.8%
Total Liabilities & Shareholders' Equity
4.5% -10.6% -0.4% 13.5% 17.6%
Copyright ©2000-2010 Distributed by Wright Investors' Service, Inc. All Rights Reserved. Except for quotations by established news media, no pages on this site may be reproduced, stored in a retrieval system, or transmitted for commercial purposes, in any form or by any means, electronic, mechanical, photocopying, recording, or otherwise without prior written permission. Information is believed reliable, but accuracy, completeness and opinions are not guaranteed.
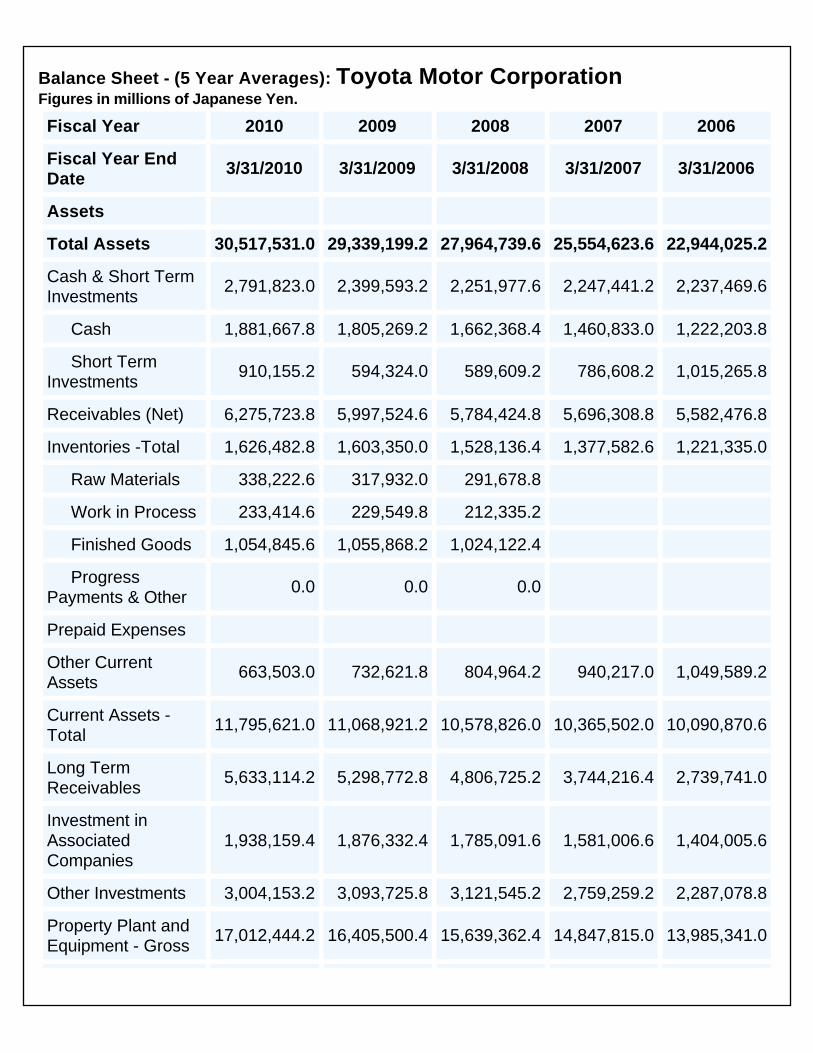
Financial Statement Analyses\Balance Sheet - Five-Year Averages
Balance Sheet - (5 Year Averages): Toyota Motor Corporation Figures in millions of Japanese Yen.
Fiscal Year 2010 2009 2008 2007 2006
Fiscal Year End Date
3/31/2010 3/31/2009 3/31/2008 3/31/2007 3/31/2006
Assets
Total Assets 30,517,531.0 29,339,199.2 27,964,739.6 25,554,623.6 22,944,025.2
Cash & Short Term Investments
2,791,823.0 2,399,593.2 2,251,977.6 2,247,441.2 2,237,469.6
Cash 1,881,667.8 1,805,269.2 1,662,368.4 1,460,833.0 1,222,203.8
Short Term Investments
910,155.2 594,324.0 589,609.2 786,608.2 1,015,265.8
Receivables (Net) 6,275,723.8 5,997,524.6 5,784,424.8 5,696,308.8 5,582,476.8
Inventories -Total 1,626,482.8 1,603,350.0 1,528,136.4 1,377,582.6 1,221,335.0
Raw Materials 338,222.6 317,932.0 291,678.8
Work in Process 233,414.6 229,549.8 212,335.2
Finished Goods 1,054,845.6 1,055,868.2 1,024,122.4
Progress Payments & Other
0.0 0.0 0.0
Prepaid Expenses
Other Current Assets
663,503.0 732,621.8 804,964.2 940,217.0 1,049,589.2
Current Assets - Total
11,795,621.0 11,068,921.2 10,578,826.0 10,365,502.0 10,090,870.6
Long Term Receivables
5,633,114.2 5,298,772.8 4,806,725.2 3,744,216.4 2,739,741.0
Investment in Associated Companies
1,938,159.4 1,876,332.4 1,785,091.6 1,581,006.6 1,404,005.6
Other Investments 3,004,153.2 3,093,725.8 3,121,545.2 2,759,259.2 2,287,078.8
Property Plant and Equipment - Gross
17,012,444.2 16,405,500.4 15,639,362.4 14,847,815.0 13,985,341.0
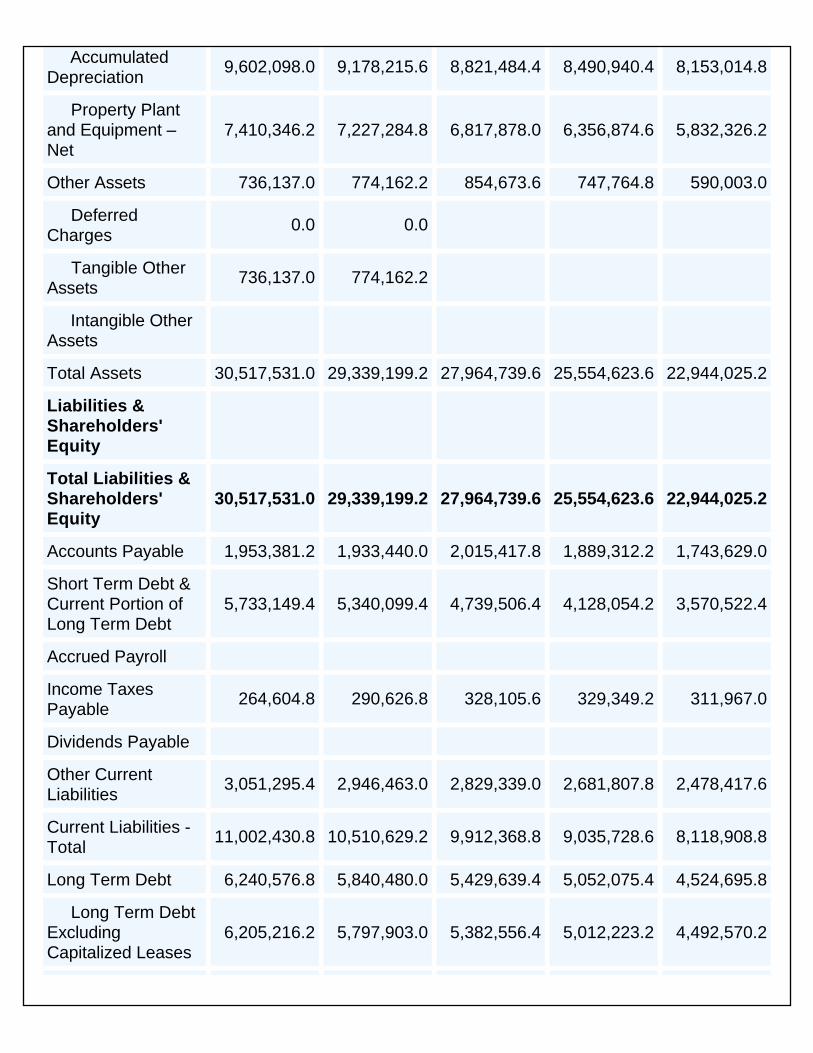
Accumulated Depreciation
9,602,098.0 9,178,215.6 8,821,484.4 8,490,940.4 8,153,014.8
Property Plant and Equipment – Net
7,410,346.2 7,227,284.8 6,817,878.0 6,356,874.6 5,832,326.2
Other Assets 736,137.0 774,162.2 854,673.6 747,764.8 590,003.0
Deferred Charges
0.0 0.0
Tangible Other Assets
736,137.0 774,162.2
Intangible Other Assets
Total Assets 30,517,531.0 29,339,199.2 27,964,739.6 25,554,623.6 22,944,025.2
Liabilities & Shareholders' Equity
Total Liabilities & Shareholders' Equity
30,517,531.0 29,339,199.2 27,964,739.6 25,554,623.6 22,944,025.2
Accounts Payable 1,953,381.2 1,933,440.0 2,015,417.8 1,889,312.2 1,743,629.0
Short Term Debt & Current Portion of Long Term Debt
5,733,149.4 5,340,099.4 4,739,506.4 4,128,054.2 3,570,522.4
Accrued Payroll
Income Taxes Payable
264,604.8 290,626.8 328,105.6 329,349.2 311,967.0
Dividends Payable
Other Current Liabilities
3,051,295.4 2,946,463.0 2,829,339.0 2,681,807.8 2,478,417.6
Current Liabilities - Total
11,002,430.8 10,510,629.2 9,912,368.8 9,035,728.6 8,118,908.8
Long Term Debt 6,240,576.8 5,840,480.0 5,429,639.4 5,052,075.4 4,524,695.8
Long Term Debt Excluding Capitalized Leases
6,205,216.2 5,797,903.0 5,382,556.4 5,012,223.2 4,492,570.2
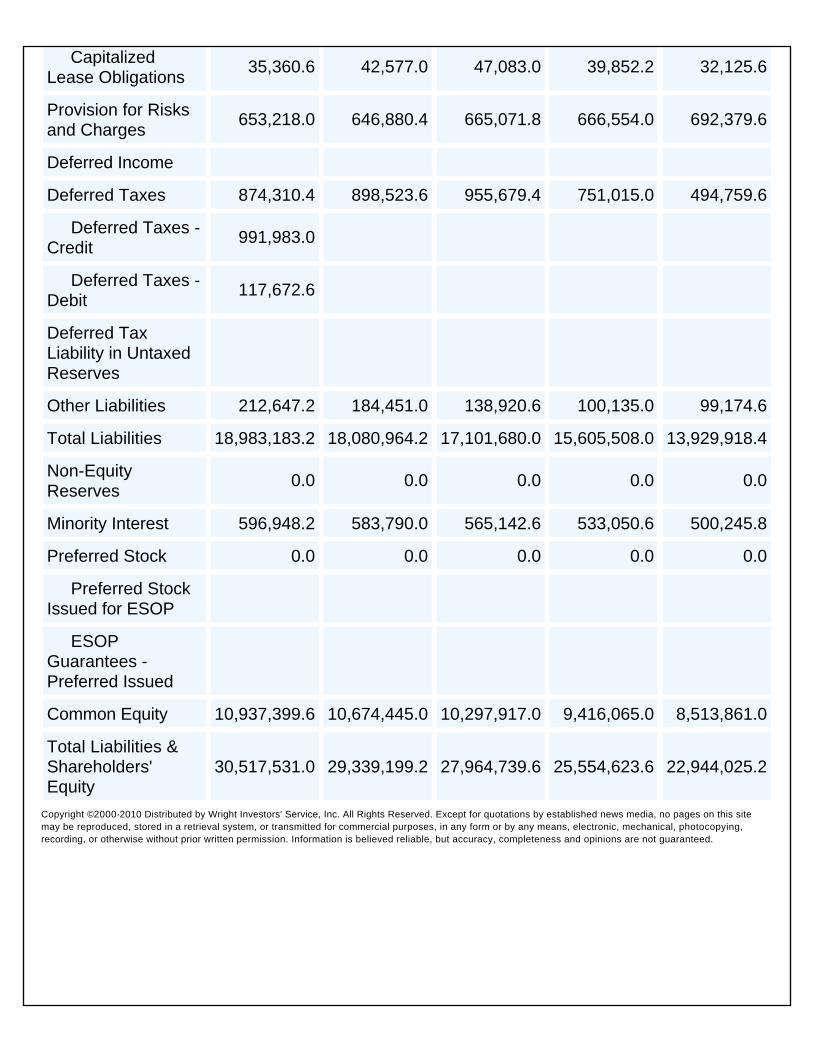
Capitalized Lease Obligations
35,360.6 42,577.0 47,083.0 39,852.2 32,125.6
Provision for Risks and Charges
653,218.0 646,880.4 665,071.8 666,554.0 692,379.6
Deferred Income
Deferred Taxes 874,310.4 898,523.6 955,679.4 751,015.0 494,759.6
Deferred Taxes - Credit
991,983.0
Deferred Taxes - Debit
117,672.6
Deferred Tax Liability in Untaxed Reserves
Other Liabilities 212,647.2 184,451.0 138,920.6 100,135.0 99,174.6
Total Liabilities 18,983,183.2 18,080,964.2 17,101,680.0 15,605,508.0 13,929,918.4
Non-Equity Reserves
0.0 0.0 0.0 0.0 0.0
Minority Interest 596,948.2 583,790.0 565,142.6 533,050.6 500,245.8
Preferred Stock 0.0 0.0 0.0 0.0 0.0
Preferred Stock Issued for ESOP
ESOP Guarantees - Preferred Issued
Common Equity 10,937,399.6 10,674,445.0 10,297,917.0 9,416,065.0 8,513,861.0
Total Liabilities & Shareholders' Equity
30,517,531.0 29,339,199.2 27,964,739.6 25,554,623.6 22,944,025.2
Copyright ©2000-2010 Distributed by Wright Investors' Service, Inc. All Rights Reserved. Except for quotations by established news media, no pages on this site may be reproduced, stored in a retrieval system, or transmitted for commercial purposes, in any form or by any means, electronic, mechanical, photocopying, recording, or otherwise without prior written permission. Information is believed reliable, but accuracy, completeness and opinions are not guaranteed.
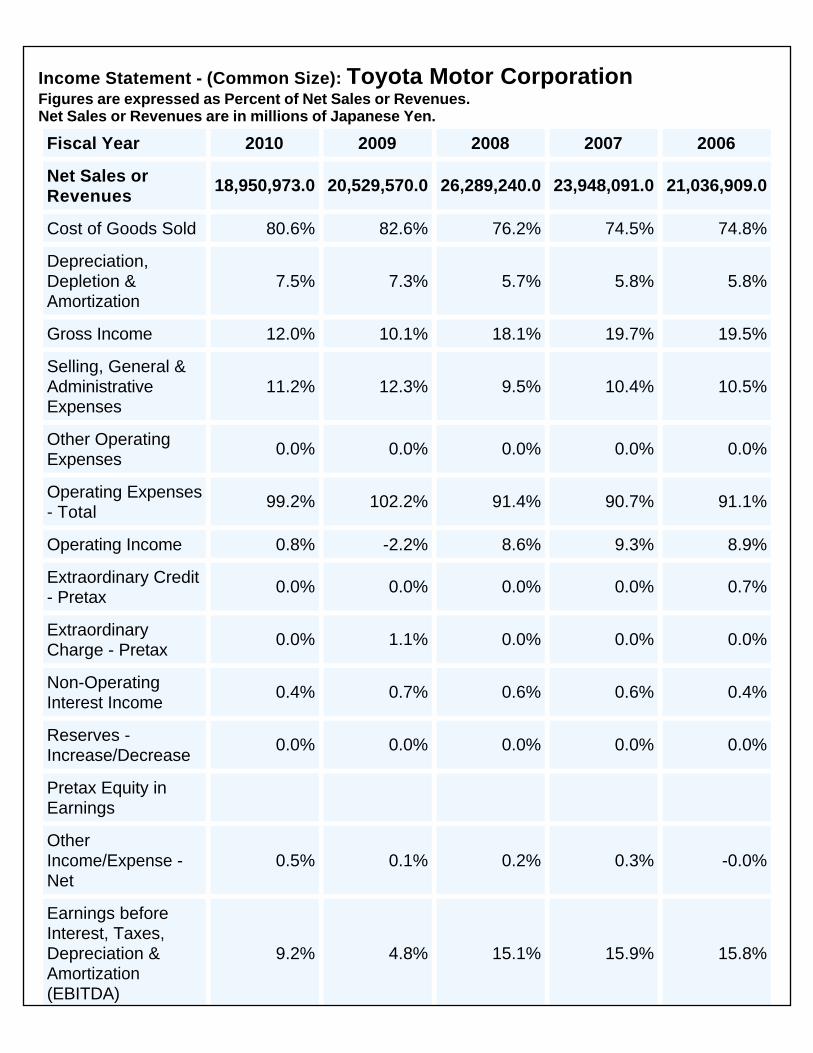
Financial Statement Analyses\Income Statement - Common Size
Income Statement - (Common Size): Toyota Motor Corporation Figures are expressed as Percent of Net Sales or Revenues. Net Sales or Revenues are in millions of Japanese Yen.
Fiscal Year 2010 2009 2008 2007 2006
Net Sales or Revenues
18,950,973.0 20,529,570.0 26,289,240.0 23,948,091.0 21,036,909.0
Cost of Goods Sold 80.6% 82.6% 76.2% 74.5% 74.8%
Depreciation, Depletion & Amortization
7.5% 7.3% 5.7% 5.8% 5.8%
Gross Income 12.0% 10.1% 18.1% 19.7% 19.5%
Selling, General & Administrative Expenses
11.2% 12.3% 9.5% 10.4% 10.5%
Other Operating Expenses
0.0% 0.0% 0.0% 0.0% 0.0%
Operating Expenses - Total
99.2% 102.2% 91.4% 90.7% 91.1%
Operating Income 0.8% -2.2% 8.6% 9.3% 8.9%
Extraordinary Credit - Pretax
0.0% 0.0% 0.0% 0.0% 0.7%
Extraordinary Charge - Pretax
0.0% 1.1% 0.0% 0.0% 0.0%
Non-Operating Interest Income
0.4% 0.7% 0.6% 0.6% 0.4%
Reserves - Increase/Decrease
0.0% 0.0% 0.0% 0.0% 0.0%
Pretax Equity in Earnings
Other Income/Expense - Net
0.5% 0.1% 0.2% 0.3% -0.0%
Earnings before Interest, Taxes, Depreciation & Amortization (EBITDA)
9.2% 4.8% 15.1% 15.9% 15.8%
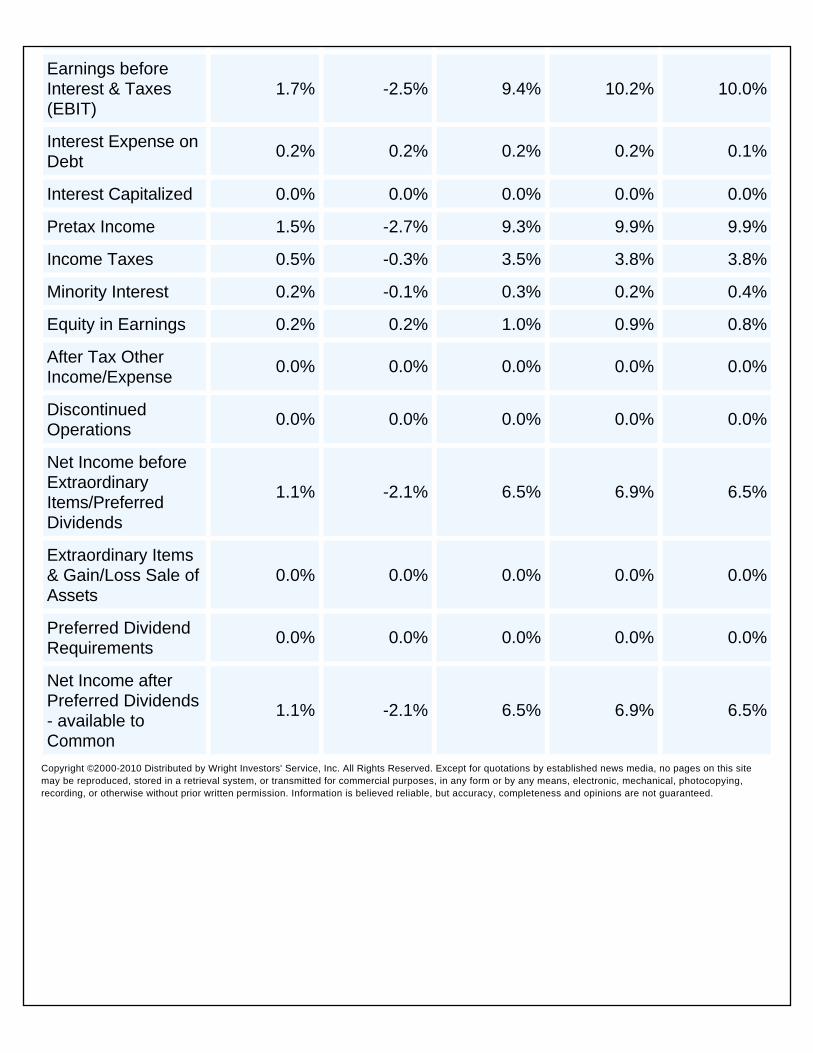
Earnings before Interest & Taxes(EBIT)
1.7% -2.5% 9.4% 10.2% 10.0%
Interest Expense on Debt
0.2% 0.2% 0.2% 0.2% 0.1%
Interest Capitalized 0.0% 0.0% 0.0% 0.0% 0.0%
Pretax Income 1.5% -2.7% 9.3% 9.9% 9.9%
Income Taxes 0.5% -0.3% 3.5% 3.8% 3.8%
Minority Interest 0.2% -0.1% 0.3% 0.2% 0.4%
Equity in Earnings 0.2% 0.2% 1.0% 0.9% 0.8%
After Tax Other Income/Expense
0.0% 0.0% 0.0% 0.0% 0.0%
Discontinued Operations
0.0% 0.0% 0.0% 0.0% 0.0%
Net Income before Extraordinary Items/Preferred Dividends
1.1% -2.1% 6.5% 6.9% 6.5%
Extraordinary Items & Gain/Loss Sale of Assets
0.0% 0.0% 0.0% 0.0% 0.0%
Preferred Dividend Requirements
0.0% 0.0% 0.0% 0.0% 0.0%
Net Income after Preferred Dividends - available to Common
1.1% -2.1% 6.5% 6.9% 6.5%
Copyright ©2000-2010 Distributed by Wright Investors' Service, Inc. All Rights Reserved. Except for quotations by established news media, no pages on this site may be reproduced, stored in a retrieval system, or transmitted for commercial purposes, in any form or by any means, electronic, mechanical, photocopying, recording, or otherwise without prior written permission. Information is believed reliable, but accuracy, completeness and opinions are not guaranteed.
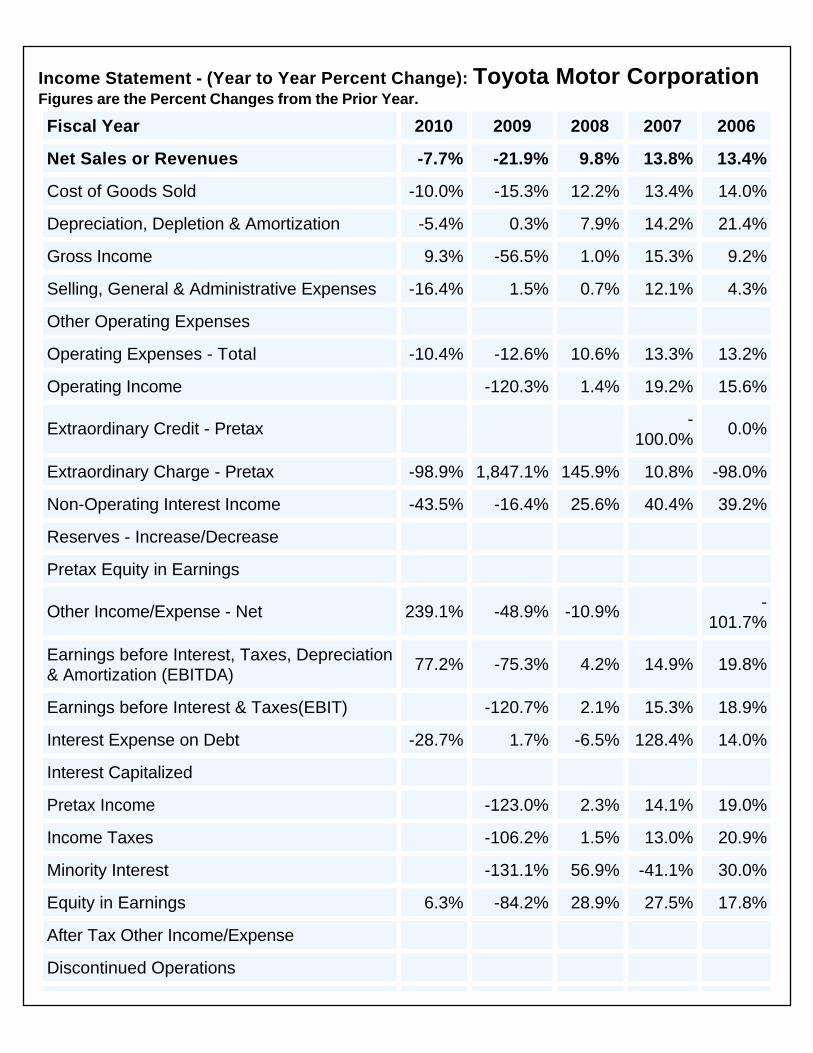
Financial Statement Analyses\Income Statement - Year-Year % Change
Income Statement - (Year to Year Percent Change): Toyota Motor Corporation Figures are the Percent Changes from the Prior Year.
Fiscal Year 2010 2009 2008 2007 2006
Net Sales or Revenues -7.7% -21.9% 9.8% 13.8% 13.4%
Cost of Goods Sold -10.0% -15.3% 12.2% 13.4% 14.0%
Depreciation, Depletion & Amortization -5.4% 0.3% 7.9% 14.2% 21.4%
Gross Income 9.3% -56.5% 1.0% 15.3% 9.2%
Selling, General & Administrative Expenses -16.4% 1.5% 0.7% 12.1% 4.3%
Other Operating Expenses
Operating Expenses - Total -10.4% -12.6% 10.6% 13.3% 13.2%
Operating Income -120.3% 1.4% 19.2% 15.6%
Extraordinary Credit - Pretax -100.0%
0.0%
Extraordinary Charge - Pretax -98.9% 1,847.1% 145.9% 10.8% -98.0%
Non-Operating Interest Income -43.5% -16.4% 25.6% 40.4% 39.2%
Reserves - Increase/Decrease
Pretax Equity in Earnings
Other Income/Expense - Net 239.1% -48.9% -10.9% -101.7%
Earnings before Interest, Taxes, Depreciation & Amortization (EBITDA)
77.2% -75.3% 4.2% 14.9% 19.8%
Earnings before Interest & Taxes(EBIT) -120.7% 2.1% 15.3% 18.9%
Interest Expense on Debt -28.7% 1.7% -6.5% 128.4% 14.0%
Interest Capitalized
Pretax Income -123.0% 2.3% 14.1% 19.0%
Income Taxes -106.2% 1.5% 13.0% 20.9%
Minority Interest -131.1% 56.9% -41.1% 30.0%
Equity in Earnings 6.3% -84.2% 28.9% 27.5% 17.8%
After Tax Other Income/Expense
Discontinued Operations
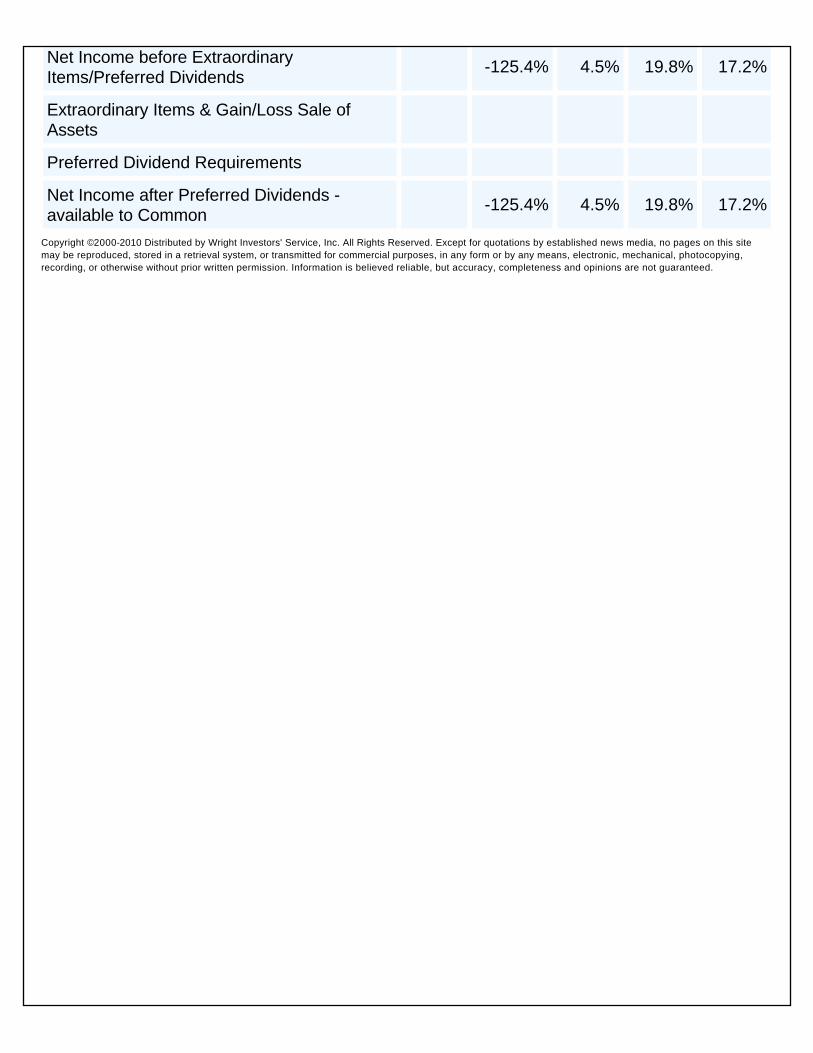
Net Income before Extraordinary Items/Preferred Dividends
-125.4% 4.5% 19.8% 17.2%
Extraordinary Items & Gain/Loss Sale of Assets
Preferred Dividend Requirements
Net Income after Preferred Dividends - available to Common
-125.4% 4.5% 19.8% 17.2%
Copyright ©2000-2010 Distributed by Wright Investors' Service, Inc. All Rights Reserved. Except for quotations by established news media, no pages on this site may be reproduced, stored in a retrieval system, or transmitted for commercial purposes, in any form or by any means, electronic, mechanical, photocopying, recording, or otherwise without prior written permission. Information is believed reliable, but accuracy, completeness and opinions are not guaranteed.
Financial Statement Analyses\Income Statement - Five-Year Averages
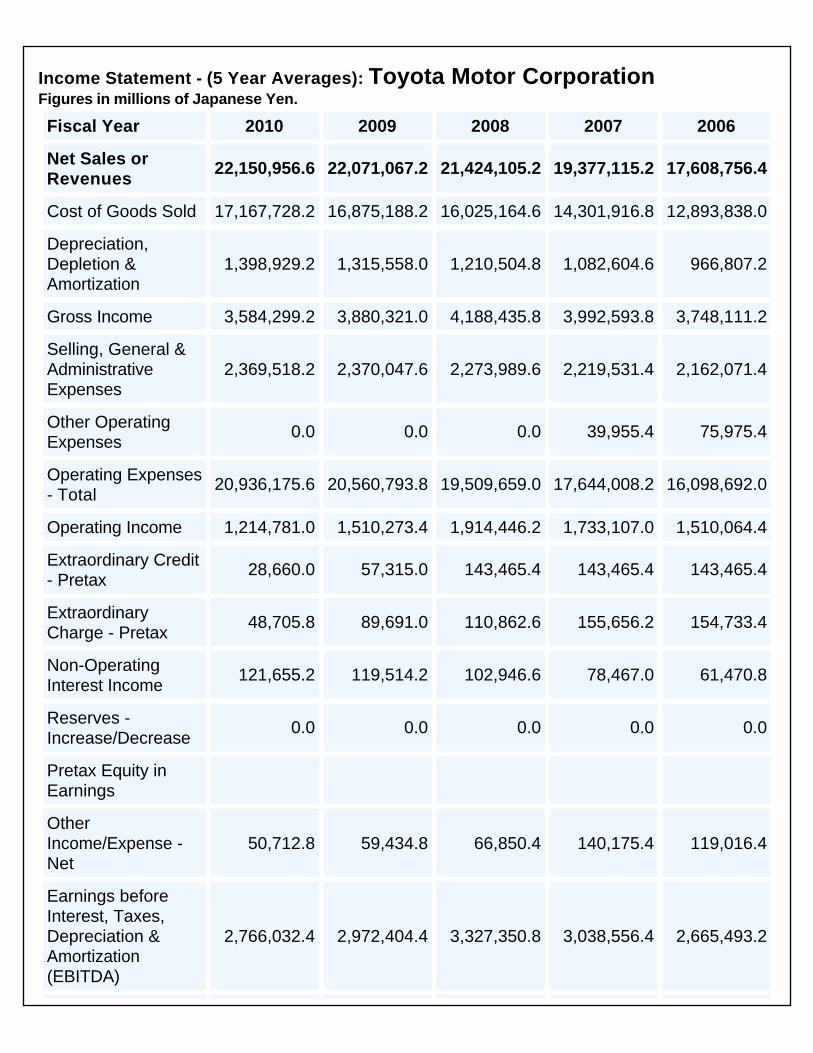
Income Statement - (5 Year Averages): Toyota Motor Corporation Figures in millions of Japanese Yen.
Fiscal Year 2010 2009 2008 2007 2006
Net Sales or Revenues
22,150,956.6 22,071,067.2 21,424,105.2 19,377,115.2 17,608,756.4
Cost of Goods Sold 17,167,728.2 16,875,188.2 16,025,164.6 14,301,916.8 12,893,838.0
Depreciation, Depletion & Amortization
1,398,929.2 1,315,558.0 1,210,504.8 1,082,604.6 966,807.2
Gross Income 3,584,299.2 3,880,321.0 4,188,435.8 3,992,593.8 3,748,111.2
Selling, General & Administrative Expenses
2,369,518.2 2,370,047.6 2,273,989.6 2,219,531.4 2,162,071.4
Other Operating Expenses
0.0 0.0 0.0 39,955.4 75,975.4
Operating Expenses - Total
20,936,175.6 20,560,793.8 19,509,659.0 17,644,008.2 16,098,692.0
Operating Income 1,214,781.0 1,510,273.4 1,914,446.2 1,733,107.0 1,510,064.4
Extraordinary Credit - Pretax
28,660.0 57,315.0 143,465.4 143,465.4 143,465.4
Extraordinary Charge - Pretax
48,705.8 89,691.0 110,862.6 155,656.2 154,733.4
Non-Operating Interest Income
121,655.2 119,514.2 102,946.6 78,467.0 61,470.8
Reserves - Increase/Decrease
0.0 0.0 0.0 0.0 0.0
Pretax Equity in Earnings
Other Income/Expense - Net
50,712.8 59,434.8 66,850.4 140,175.4 119,016.4
Earnings before Interest, Taxes, Depreciation & Amortization (EBITDA)
2,766,032.4 2,972,404.4 3,327,350.8 3,038,556.4 2,665,493.2
Earnings before Interest & Taxes(EBIT)
1,367,103.2 1,656,846.4 2,116,846.0 1,955,951.8 1,698,686.0
Interest Expense on Debt
39,466.2 36,575.6 31,340.4 28,027.0 24,559.6
Interest Capitalized 0.0 0.0 0.0 0.0 0.0
Pretax Income 1,327,637.0 1,620,270.8 2,085,505.6 1,927,924.8 1,674,126.4
Income Taxes 528,236.4 641,285.6 788,834.8 736,694.8 653,064.2
Minority Interest 44,504.0 50,540.4 63,933.2 59,111.2 52,682.0
Equity in Earnings 146,425.4 165,238.0 180,752.2 126,729.4 84,826.4
After Tax Other Income/Expense
0.0 0.0 0.0 0.0 0.0
Discontinued Operations
0.0 0.0 0.0 0.0 0.0
Net Income before Extraordinary Items/Preferred Dividends
901,322.0 1,093,682.8 1,413,489.8 1,258,848.2 1,053,206.6
Extraordinary Items & Gain/Loss Sale of Assets
0.0 0.0 0.0 0.0 0.0
Preferred Dividend Requirements
0.0 0.0 0.0 0.0 0.0
Net Income after Preferred Dividends - available to Common
901,322.0 1,093,682.8 1,413,489.8 1,258,848.2 1,053,206.6
Copyright ©2000-2010 Distributed by Wright Investors' Service, Inc. All Rights Reserved. Except for quotations by established news media, no pages on this site may be reproduced, stored in a retrieval system, or transmitted for commercial purposes, in any form or by any means, electronic, mechanical, photocopying, recording, or otherwise without prior written permission. Information is believed reliable, but accuracy, completeness and opinions are not guaranteed.
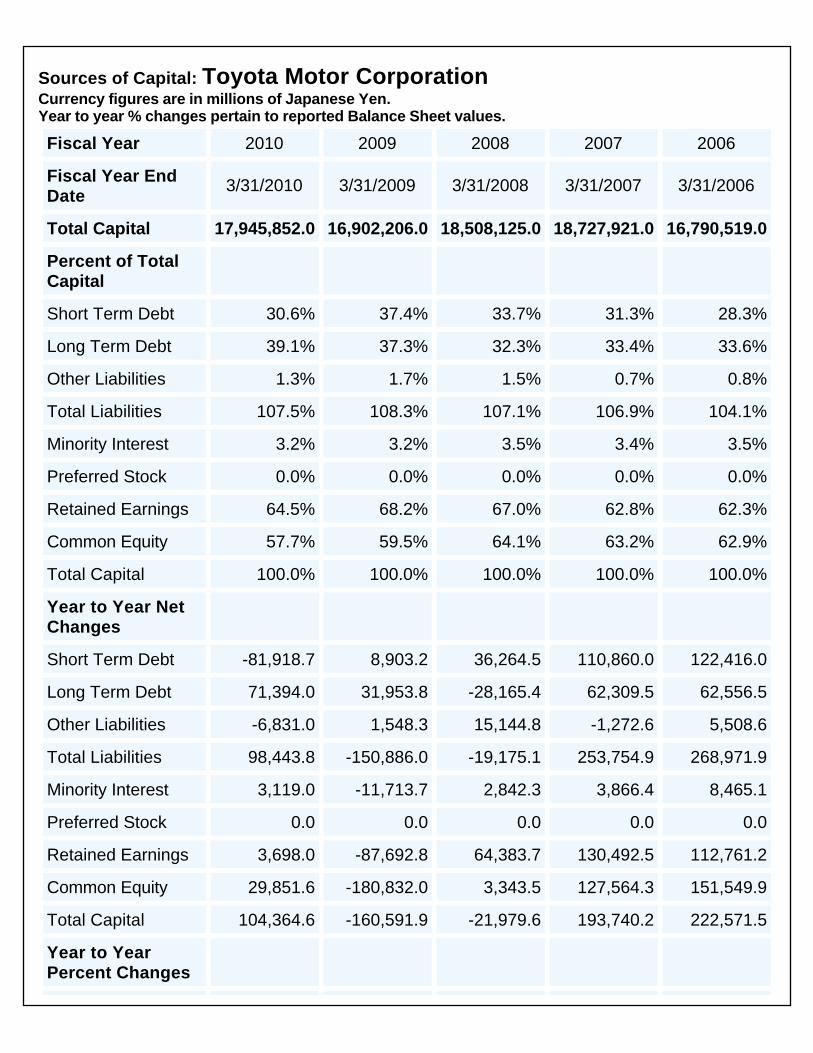
Financial Statement Analyses\Sources of Capital - Net Change
Sources of Capital: Toyota Motor Corporation Currency figures are in millions of Japanese Yen. Year to year % changes pertain to reported Balance Sheet values.
Fiscal Year 2010 2009 2008 2007 2006
Fiscal Year End Date
3/31/2010 3/31/2009 3/31/2008 3/31/2007 3/31/2006
Total Capital 17,945,852.0 16,902,206.0 18,508,125.0 18,727,921.0 16,790,519.0
Percent of Total Capital
Short Term Debt 30.6% 37.4% 33.7% 31.3% 28.3%
Long Term Debt 39.1% 37.3% 32.3% 33.4% 33.6%
Other Liabilities 1.3% 1.7% 1.5% 0.7% 0.8%
Total Liabilities 107.5% 108.3% 107.1% 106.9% 104.1%
Minority Interest 3.2% 3.2% 3.5% 3.4% 3.5%
Preferred Stock 0.0% 0.0% 0.0% 0.0% 0.0%
Retained Earnings 64.5% 68.2% 67.0% 62.8% 62.3%
Common Equity 57.7% 59.5% 64.1% 63.2% 62.9%
Total Capital 100.0% 100.0% 100.0% 100.0% 100.0%
Year to Year Net Changes
Short Term Debt -81,918.7 8,903.2 36,264.5 110,860.0 122,416.0
Long Term Debt 71,394.0 31,953.8 -28,165.4 62,309.5 62,556.5
Other Liabilities -6,831.0 1,548.3 15,144.8 -1,272.6 5,508.6
Total Liabilities 98,443.8 -150,886.0 -19,175.1 253,754.9 268,971.9
Minority Interest 3,119.0 -11,713.7 2,842.3 3,866.4 8,465.1
Preferred Stock 0.0 0.0 0.0 0.0 0.0
Retained Earnings 3,698.0 -87,692.8 64,383.7 130,492.5 112,761.2
Common Equity 29,851.6 -180,832.0 3,343.5 127,564.3 151,549.9
Total Capital 104,364.6 -160,591.9 -21,979.6 193,740.2 222,571.5
Year to Year Percent Changes
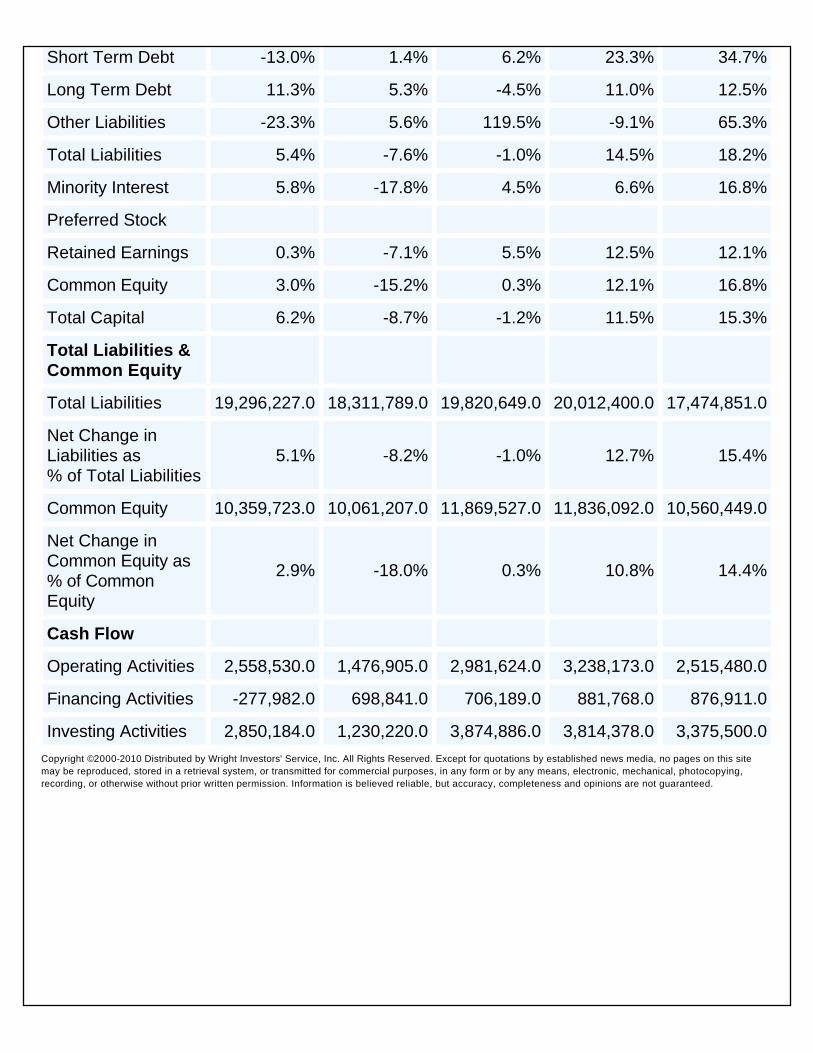
Short Term Debt -13.0% 1.4% 6.2% 23.3% 34.7%
Long Term Debt 11.3% 5.3% -4.5% 11.0% 12.5%
Other Liabilities -23.3% 5.6% 119.5% -9.1% 65.3%
Total Liabilities 5.4% -7.6% -1.0% 14.5% 18.2%
Minority Interest 5.8% -17.8% 4.5% 6.6% 16.8%
Preferred Stock
Retained Earnings 0.3% -7.1% 5.5% 12.5% 12.1%
Common Equity 3.0% -15.2% 0.3% 12.1% 16.8%
Total Capital 6.2% -8.7% -1.2% 11.5% 15.3%
Total Liabilities & Common Equity
Total Liabilities 19,296,227.0 18,311,789.0 19,820,649.0 20,012,400.0 17,474,851.0
Net Change in Liabilities as % of Total Liabilities
5.1% -8.2% -1.0% 12.7% 15.4%
Common Equity 10,359,723.0 10,061,207.0 11,869,527.0 11,836,092.0 10,560,449.0
Net Change in Common Equity as % of Common Equity
2.9% -18.0% 0.3% 10.8% 14.4%
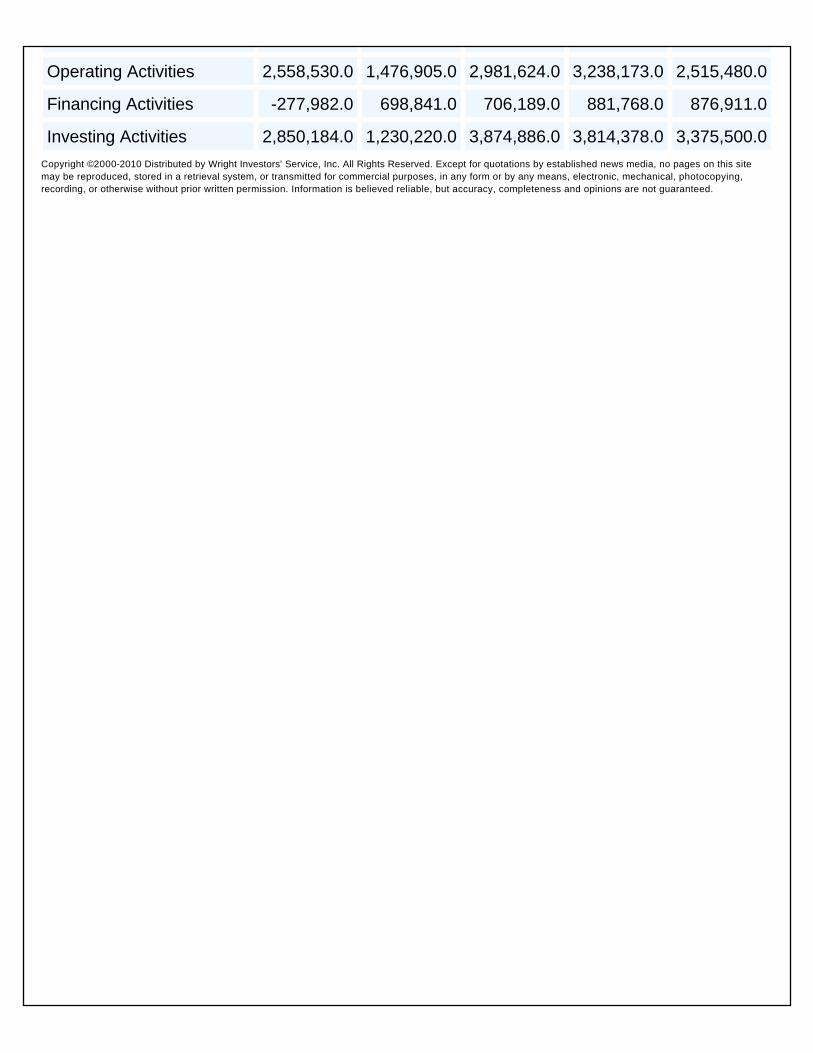
Cash Flow
Operating Activities 2,558,530.0 1,476,905.0 2,981,624.0 3,238,173.0 2,515,480.0
Financing Activities -277,982.0 698,841.0 706,189.0 881,768.0 876,911.0
Investing Activities 2,850,184.0 1,230,220.0 3,874,886.0 3,814,378.0 3,375,500.0Copyright ©2000-2010 Distributed by Wright Investors' Service, Inc. All Rights Reserved. Except for quotations by established news media, no pages on this site may be reproduced, stored in a retrieval system, or transmitted for commercial purposes, in any form or by any means, electronic, mechanical, photocopying, recording, or otherwise without prior written permission. Information is believed reliable, but accuracy, completeness and opinions are not guaranteed.
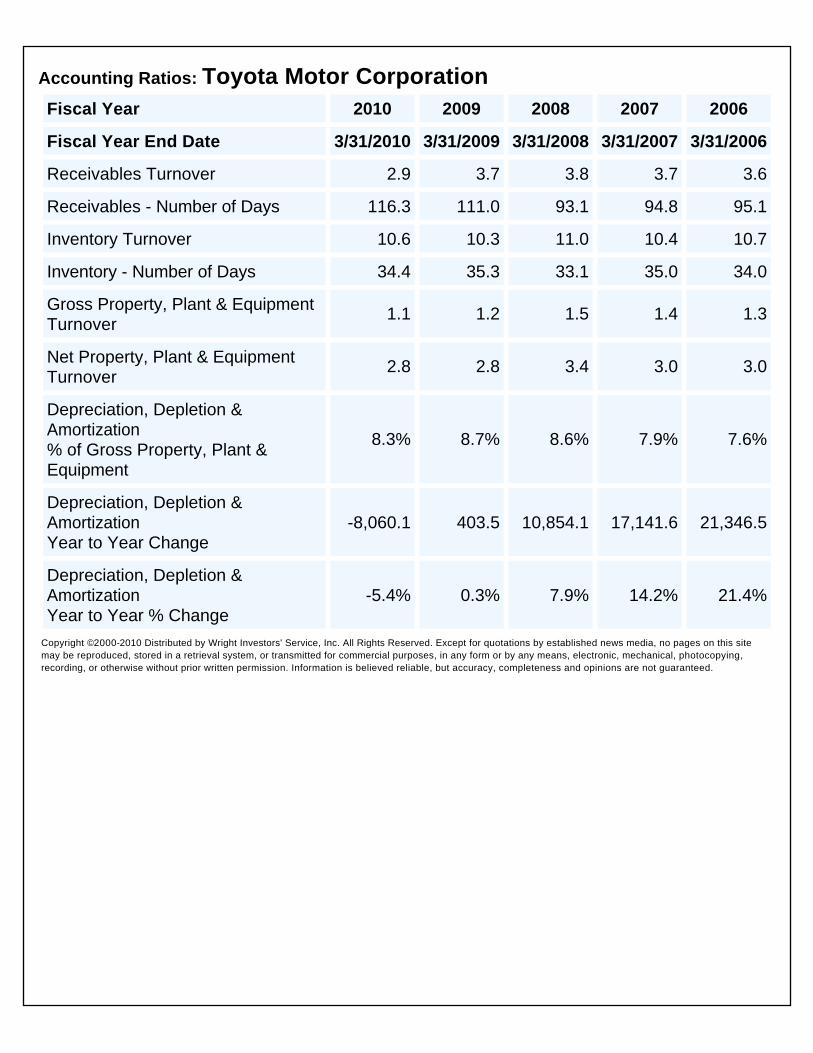
Financial Ratio AnalysesFinancial Ratio Analyses\Accounting Ratios
Accounting Ratios: Toyota Motor Corporation
Fiscal Year 2010 2009 2008 2007 2006
Fiscal Year End Date 3/31/2010 3/31/2009 3/31/2008 3/31/2007 3/31/2006
Receivables Turnover 2.9 3.7 3.8 3.7 3.6
Receivables - Number of Days 116.3 111.0 93.1 94.8 95.1
Inventory Turnover 10.6 10.3 11.0 10.4 10.7
Inventory - Number of Days 34.4 35.3 33.1 35.0 34.0
Gross Property, Plant & Equipment Turnover
1.1 1.2 1.5 1.4 1.3
Net Property, Plant & Equipment Turnover
2.8 2.8 3.4 3.0 3.0
Depreciation, Depletion & Amortization % of Gross Property, Plant & Equipment
8.3% 8.7% 8.6% 7.9% 7.6%
Depreciation, Depletion & Amortization Year to Year Change
-8,060.1 403.5 10,854.1 17,141.6 21,346.5
Depreciation, Depletion & Amortization Year to Year % Change
-5.4% 0.3% 7.9% 14.2% 21.4%
Copyright ©2000-2010 Distributed by Wright Investors' Service, Inc. All Rights Reserved. Except for quotations by established news media, no pages on this site may be reproduced, stored in a retrieval system, or transmitted for commercial purposes, in any form or by any means, electronic, mechanical, photocopying, recording, or otherwise without prior written permission. Information is believed reliable, but accuracy, completeness and opinions are not guaranteed.

Financial Ratio Analyses\Asset Utilization
Asset Utilization: Toyota Motor Corporation Figures are expressed as the ratio of Net Sales. Net Sales are in millions of Japanese Yen.
Fiscal Year 2010 2009 2008 2007 2006
Fiscal Year End Date
3/31/2010 3/31/2009 3/31/2008 3/31/2007 3/31/2006
Net Sales 18,950,973.0 20,529,570.0 26,289,240.0 23,948,091.0 21,036,909.0
Cash & Cash Equivalents
21.4% 14.5% 8.8% 9.9% 10.7%
Short-Term Investments
11.5% 2.6% 2.6% 1.9% 3.3%
Accounts Receivable
34.1% 27.4% 26.1% 27.3% 28.0%
Inventories 7.5% 7.1% 6.9% 7.5% 7.7%
Other Current Assets
3.3% 2.9% 2.1% 2.3% 4.6%
Total Current Assets
69.0% 55.0% 46.0% 49.2% 51.0%
Total Long Term Receivables & Investments
51.9% 47.0% 44.0% 48.8% 48.2%
Long Term Receivables
30.1% 27.9% 23.0% 24.2% 23.3%
Investments in Associated Companies
9.9% 8.9% 8.0% 8.6% 8.7%
Other Investments
11.9% 10.2% 13.0% 16.0% 16.2%
Property, Plant & Equipment - Gross
90.2% 83.7% 66.2% 73.2% 75.4%
Accumulated Depreciation
54.8% 47.7% 36.5% 39.5% 41.8%
Property Plant & Equipment - Net
35.4% 36.1% 29.7% 33.7% 33.6%
Other Assets 3.2% 2.7% 3.3% 4.0% 3.3%
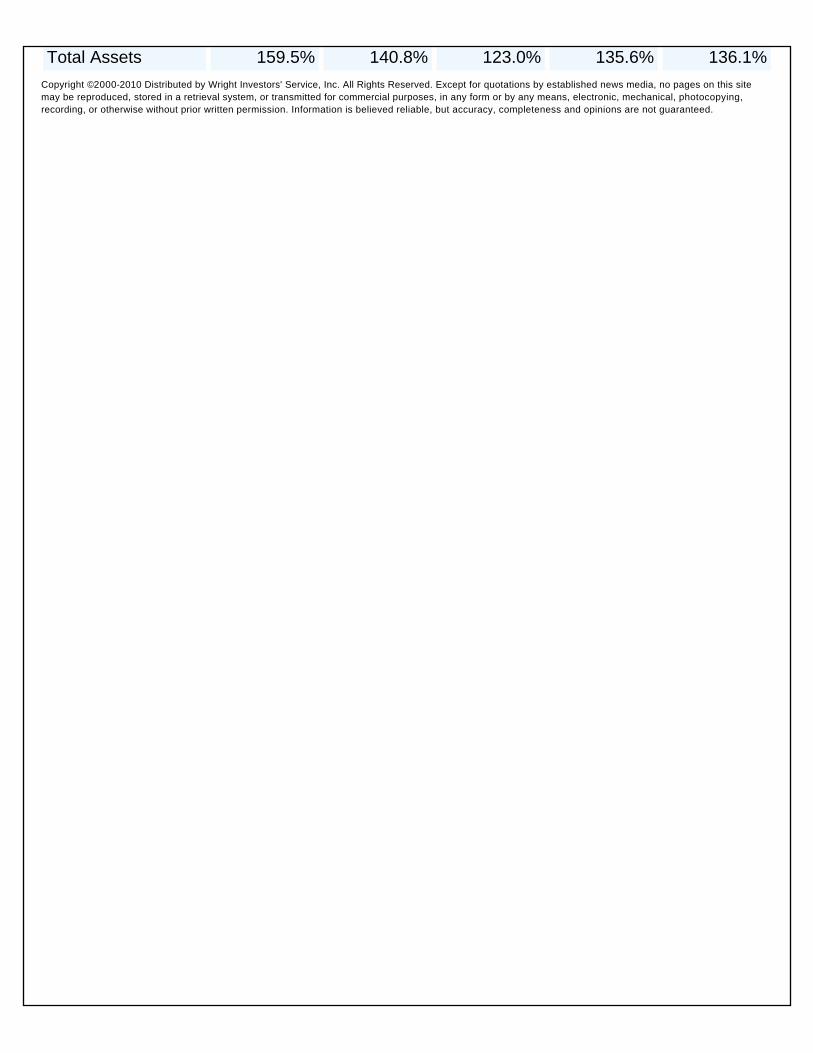
Total Assets 159.5% 140.8% 123.0% 135.6% 136.1%Copyright ©2000-2010 Distributed by Wright Investors' Service, Inc. All Rights Reserved. Except for quotations by established news media, no pages on this site may be reproduced, stored in a retrieval system, or transmitted for commercial purposes, in any form or by any means, electronic, mechanical, photocopying, recording, or otherwise without prior written permission. Information is believed reliable, but accuracy, completeness and opinions are not guaranteed.
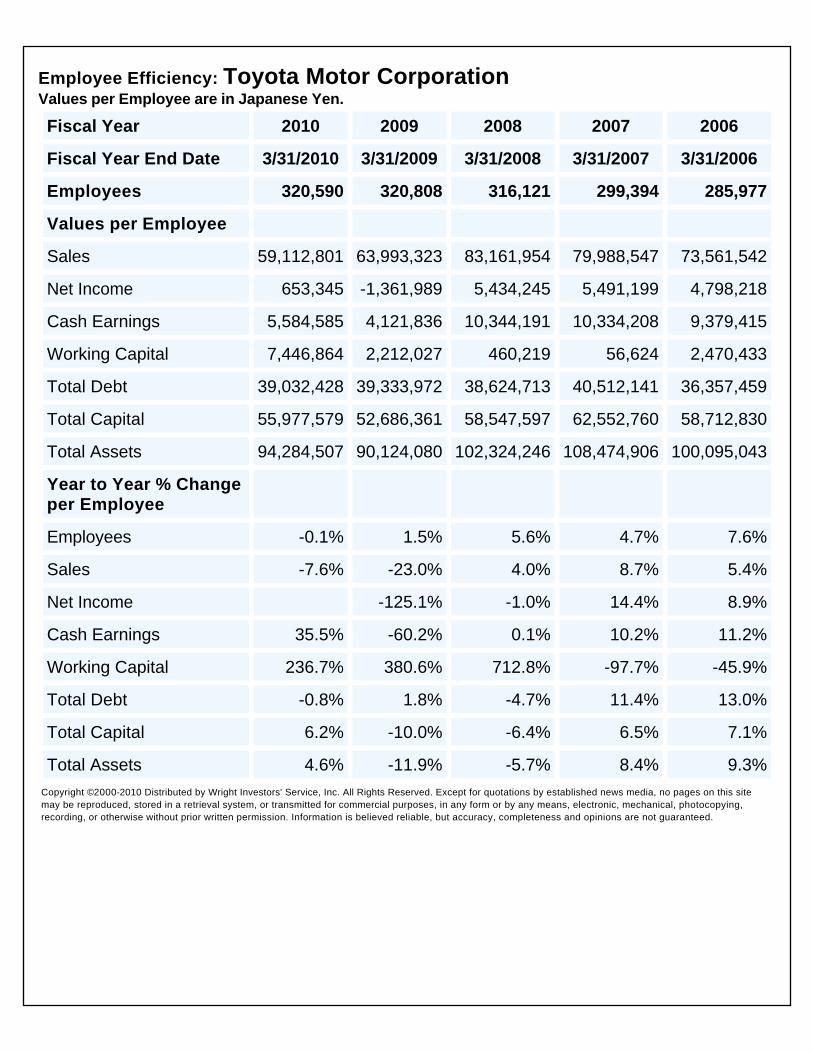
Financial Ratio Analyses\Employee Efficiency
Employee Efficiency: Toyota Motor Corporation Values per Employee are in Japanese Yen.
Fiscal Year 2010 2009 2008 2007 2006
Fiscal Year End Date 3/31/2010 3/31/2009 3/31/2008 3/31/2007 3/31/2006
Employees 320,590 320,808 316,121 299,394 285,977
Values per Employee
Sales 59,112,801 63,993,323 83,161,954 79,988,547 73,561,542
Net Income 653,345 -1,361,989 5,434,245 5,491,199 4,798,218
Cash Earnings 5,584,585 4,121,836 10,344,191 10,334,208 9,379,415
Working Capital 7,446,864 2,212,027 460,219 56,624 2,470,433
Total Debt 39,032,428 39,333,972 38,624,713 40,512,141 36,357,459
Total Capital 55,977,579 52,686,361 58,547,597 62,552,760 58,712,830
Total Assets 94,284,507 90,124,080 102,324,246 108,474,906 100,095,043
Year to Year % Change per Employee
Employees -0.1% 1.5% 5.6% 4.7% 7.6%
Sales -7.6% -23.0% 4.0% 8.7% 5.4%
Net Income -125.1% -1.0% 14.4% 8.9%
Cash Earnings 35.5% -60.2% 0.1% 10.2% 11.2%
Working Capital 236.7% 380.6% 712.8% -97.7% -45.9%
Total Debt -0.8% 1.8% -4.7% 11.4% 13.0%
Total Capital 6.2% -10.0% -6.4% 6.5% 7.1%
Total Assets 4.6% -11.9% -5.7% 8.4% 9.3%Copyright ©2000-2010 Distributed by Wright Investors' Service, Inc. All Rights Reserved. Except for quotations by established news media, no pages on this site may be reproduced, stored in a retrieval system, or transmitted for commercial purposes, in any form or by any means, electronic, mechanical, photocopying, recording, or otherwise without prior written permission. Information is believed reliable, but accuracy, completeness and opinions are not guaranteed.
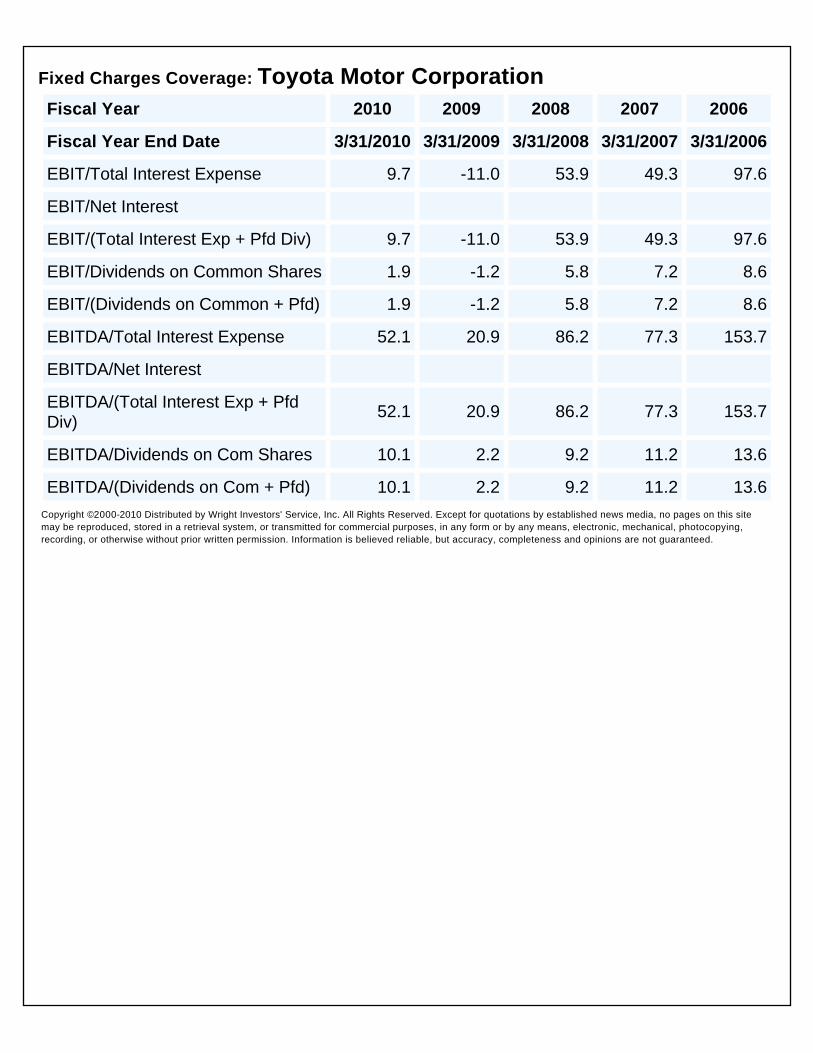
Financial Ratio Analyses\Fixed Charges Coverage
Fixed Charges Coverage: Toyota Motor Corporation
Fiscal Year 2010 2009 2008 2007 2006
Fiscal Year End Date 3/31/2010 3/31/2009 3/31/2008 3/31/2007 3/31/2006
EBIT/Total Interest Expense 9.7 -11.0 53.9 49.3 97.6
EBIT/Net Interest
EBIT/(Total Interest Exp + Pfd Div) 9.7 -11.0 53.9 49.3 97.6
EBIT/Dividends on Common Shares 1.9 -1.2 5.8 7.2 8.6
EBIT/(Dividends on Common + Pfd) 1.9 -1.2 5.8 7.2 8.6
EBITDA/Total Interest Expense 52.1 20.9 86.2 77.3 153.7
EBITDA/Net Interest
EBITDA/(Total Interest Exp + Pfd Div)
52.1 20.9 86.2 77.3 153.7
EBITDA/Dividends on Com Shares 10.1 2.2 9.2 11.2 13.6
EBITDA/(Dividends on Com + Pfd) 10.1 2.2 9.2 11.2 13.6Copyright ©2000-2010 Distributed by Wright Investors' Service, Inc. All Rights Reserved. Except for quotations by established news media, no pages on this site may be reproduced, stored in a retrieval system, or transmitted for commercial purposes, in any form or by any means, electronic, mechanical, photocopying, recording, or otherwise without prior written permission. Information is believed reliable, but accuracy, completeness and opinions are not guaranteed.

Financial Ratio Analyses\Leverage Analysis
Leverage Analysis: Toyota Motor Corporation
Fiscal Year 2010 2009 2008 2007 2006
Fiscal Year End Date 3/31/2010 3/31/2009 3/31/2008 3/31/2007 3/31/2006
Long Term Debt % of EBIT 2,159.4% 240.9% 257.6% 267.5%
Long Term Debt % of EBITDA 403.3% 641.9% 150.5% 164.2% 169.9%
Long Term Debt % of Total Assets 23.2% 21.8% 18.5% 19.3% 19.7%
Long Term Debt % of Total Capital 39.1% 37.3% 32.3% 33.4% 33.6%
Long Term Debt % of Com Equity 67.7% 62.6% 50.4% 52.9% 53.4%
Total Debt % of EBIT 3,851.7% 491.7% 498.8% 493.0%
Total Debt % of EBITDA 719.4% 1,285.4% 307.2% 318.0% 313.2%
Total Debt % of Total Assets 41.4% 43.6% 37.7% 37.3% 36.3%
Total Debt % of Total Capital 69.7% 74.7% 66.0% 64.8% 61.9%
Total Debt % of Total Capital & Short Term Debt
53.4% 54.3% 49.4% 49.3% 48.3%
Total Debt % of Common Equity 120.8% 125.4% 102.9% 102.5% 98.5%
Minority Interest % of EBIT 175.7% 26.4% 25.8% 28.0%
Minority Interest % of EBITDA 32.8% 55.0% 16.5% 16.5% 17.8%
Minority Interest % of Total Assets 1.9% 1.9% 2.0% 1.9% 2.1%
Minority Interest % of Total Capital 3.2% 3.2% 3.5% 3.4% 3.5%
Minority Interest % of Com Equity 5.5% 5.4% 5.5% 5.3% 5.6%
Preferred Stock % of EBIT 0.0% 0.0% 0.0% 0.0%
Preferred Stock % of EDITDA 0.0% 0.0% 0.0% 0.0% 0.0%
Preferred Stock % of Total Assets 0.0% 0.0% 0.0% 0.0% 0.0%
Preferred Stock % of Total Capital 0.0% 0.0% 0.0% 0.0% 0.0%
Preferred Stock % of Total Equity 0.0% 0.0% 0.0% 0.0% 0.0%
Common Equity % of Total Assets 34.3% 34.8% 36.7% 36.4% 36.9%
Common Equity % of Total Capital 57.7% 59.5% 64.1% 63.2% 62.9%
Total Capital % of Total Assets 59.4% 58.5% 57.2% 57.7% 58.7%
Capital Expenditure % of Sales 7.6% 11.3% 10.5% 11.8% 13.2%
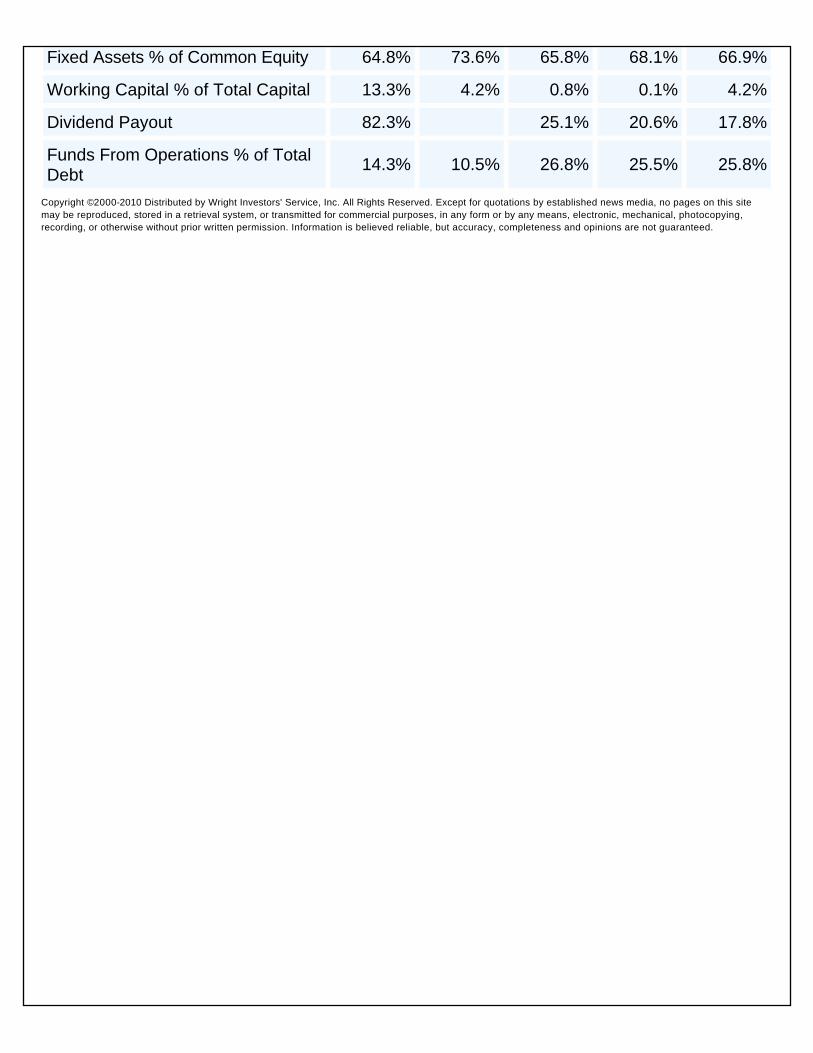
Fixed Assets % of Common Equity 64.8% 73.6% 65.8% 68.1% 66.9%
Working Capital % of Total Capital 13.3% 4.2% 0.8% 0.1% 4.2%
Dividend Payout 82.3% 25.1% 20.6% 17.8%
Funds From Operations % of Total Debt
14.3% 10.5% 26.8% 25.5% 25.8%
Copyright ©2000-2010 Distributed by Wright Investors' Service, Inc. All Rights Reserved. Except for quotations by established news media, no pages on this site may be reproduced, stored in a retrieval system, or transmitted for commercial purposes, in any form or by any means, electronic, mechanical, photocopying, recording, or otherwise without prior written permission. Information is believed reliable, but accuracy, completeness and opinions are not guaranteed.
Financial Ratio Analyses\Liquidity Analysis
Liquidity Analysis: Toyota Motor Corporation
Fiscal Year 2010 2009 2008 2007 2006
Fiscal Year End Date 3/31/2010 3/31/2009 3/31/2008 3/31/2007 3/31/2006
Total Current Assets % Net Sales
69.0% 55.0% 46.0% 49.2% 51.0%
Cash % of Current Assets 14.3% 21.6% 13.5% 16.1% 14.6%
Cash & Equivalents % of Current Assets
31.0% 26.4% 19.1% 20.0% 21.0%
Quick Ratio 1.0 0.8 0.8 0.8 0.8
Receivables % of Current Assets
49.4% 49.7% 56.8% 55.6% 54.9%
Receivable Turnover - number of days
116.3 111.0 93.1 94.8 95.1
Inventories % of Current Assets
10.9% 12.9% 15.1% 15.3% 15.1%
Inventory Turnover - number of days
34.4 35.3 33.1 35.0 34.0
Inventory to Cash & Equivalents - number of days
1,025.5 736.3 454.6 471.5 500.7
Receivables % of Total Assets
21.4% 19.4% 21.2% 20.2% 20.6%
Current Ratio 1.2 1.1 1.0 1.0 1.1
Total Debt % of Total Capital
53.4% 54.3% 49.4% 49.3% 48.3%
Funds from Operations % of Current Liabilities
16.8% 12.5% 27.4% 26.3% 26.7%
Funds from Operations % of Long Term Debt
25.5% 21.0% 54.7% 49.4% 47.6%
Funds from Operations % of Total Debt
14.3% 10.5% 26.8% 25.5% 25.8%
Funds from Operations % of Total Capital
10.0% 7.8% 17.7% 16.5% 16.0%
Cash Flow (in milllions of Japanese Yen)
Operating Activities 2,558,530.0 1,476,905.0 2,981,624.0 3,238,173.0 2,515,480.0
Financing Activities -277,982.0 698,841.0 706,189.0 881,768.0 876,911.0
Investing Activities 2,850,184.0 1,230,220.0 3,874,886.0 3,814,378.0 3,375,500.0Copyright ©2000-2010 Distributed by Wright Investors' Service, Inc. All Rights Reserved. Except for quotations by established news media, no pages on this site may be reproduced, stored in a retrieval system, or transmitted for commercial purposes, in any form or by any means, electronic, mechanical, photocopying, recording, or otherwise without prior written permission. Information is believed reliable, but accuracy, completeness and opinions are not guaranteed.
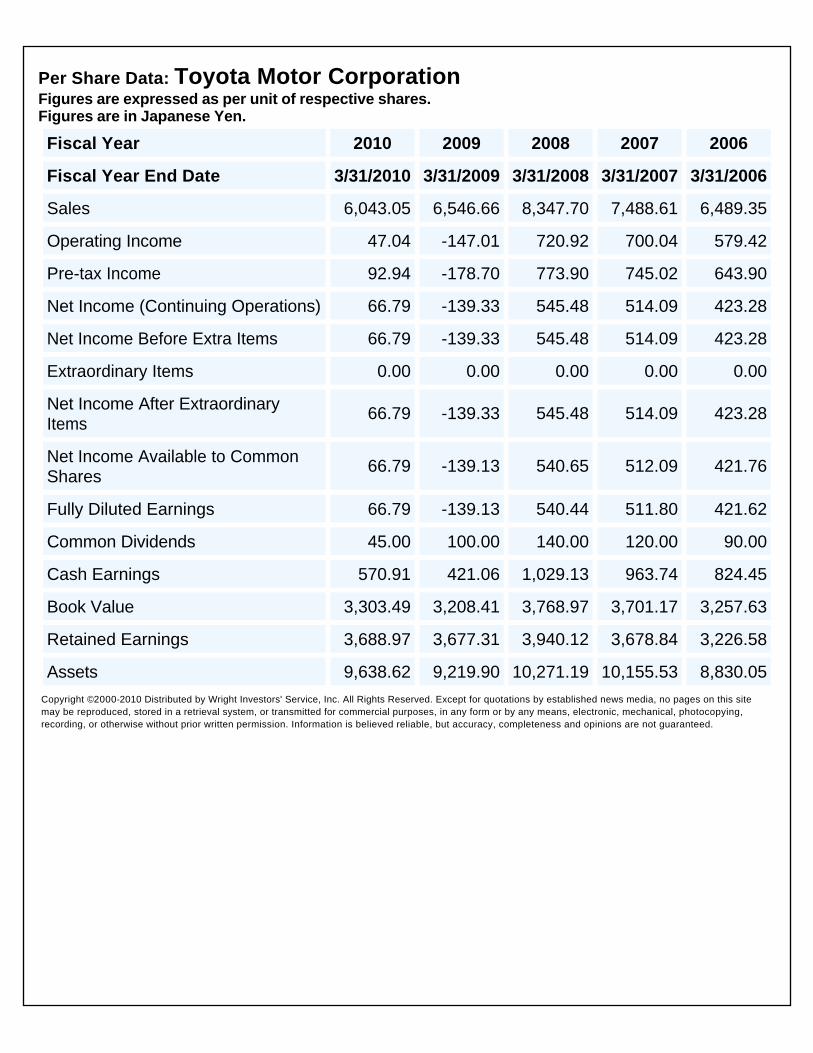
Financial Ratio Analyses\Per-Share Ratios
Per Share Data: Toyota Motor Corporation Figures are expressed as per unit of respective shares. Figures are in Japanese Yen.
Fiscal Year 2010 2009 2008 2007 2006
Fiscal Year End Date 3/31/2010 3/31/2009 3/31/2008 3/31/2007 3/31/2006
Sales 6,043.05 6,546.66 8,347.70 7,488.61 6,489.35
Operating Income 47.04 -147.01 720.92 700.04 579.42
Pre-tax Income 92.94 -178.70 773.90 745.02 643.90
Net Income (Continuing Operations) 66.79 -139.33 545.48 514.09 423.28
Net Income Before Extra Items 66.79 -139.33 545.48 514.09 423.28
Extraordinary Items 0.00 0.00 0.00 0.00 0.00
Net Income After Extraordinary Items
66.79 -139.33 545.48 514.09 423.28
Net Income Available to Common Shares
66.79 -139.13 540.65 512.09 421.76
Fully Diluted Earnings 66.79 -139.13 540.44 511.80 421.62
Common Dividends 45.00 100.00 140.00 120.00 90.00
Cash Earnings 570.91 421.06 1,029.13 963.74 824.45
Book Value 3,303.49 3,208.41 3,768.97 3,701.17 3,257.63
Retained Earnings 3,688.97 3,677.31 3,940.12 3,678.84 3,226.58
Assets 9,638.62 9,219.90 10,271.19 10,155.53 8,830.05Copyright ©2000-2010 Distributed by Wright Investors' Service, Inc. All Rights Reserved. Except for quotations by established news media, no pages on this site may be reproduced, stored in a retrieval system, or transmitted for commercial purposes, in any form or by any means, electronic, mechanical, photocopying, recording, or otherwise without prior written permission. Information is believed reliable, but accuracy, completeness and opinions are not guaranteed.
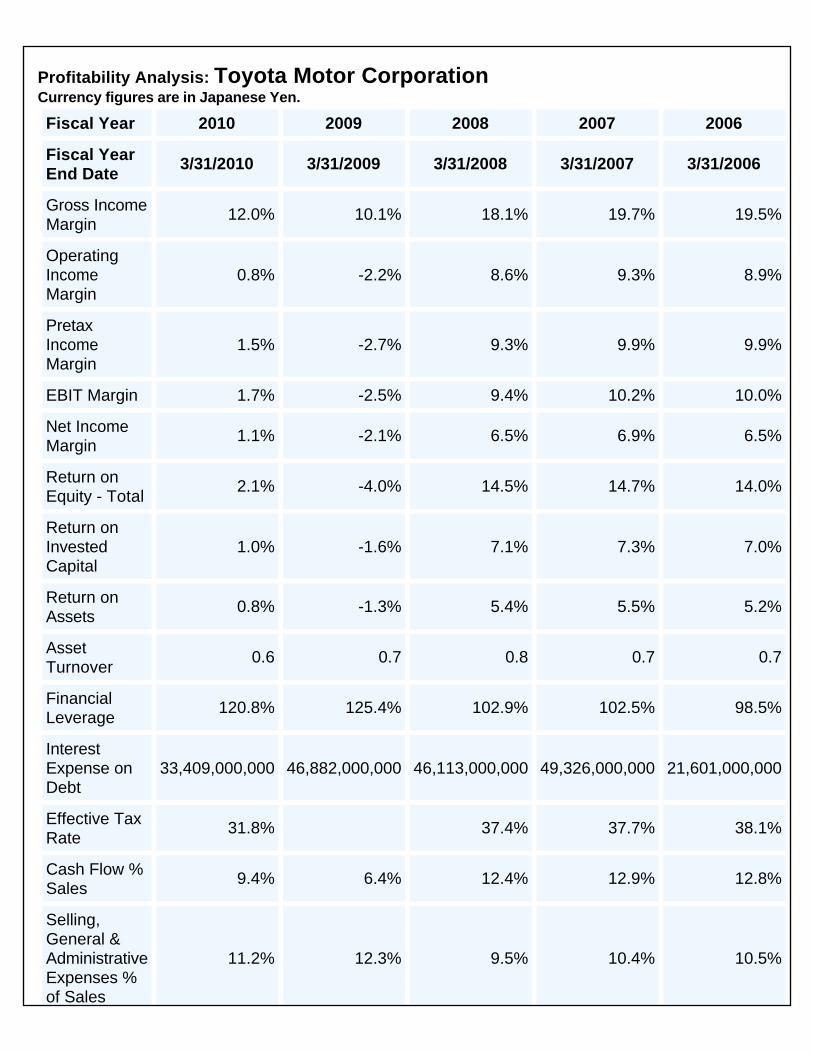
Financial Ratio Analyses\Profitability Growth
Profitability Analysis: Toyota Motor Corporation Currency figures are in Japanese Yen.
Fiscal Year 2010 2009 2008 2007 2006
Fiscal Year End Date
3/31/2010 3/31/2009 3/31/2008 3/31/2007 3/31/2006
Gross Income Margin
12.0% 10.1% 18.1% 19.7% 19.5%
Operating Income Margin
0.8% -2.2% 8.6% 9.3% 8.9%
Pretax Income Margin
1.5% -2.7% 9.3% 9.9% 9.9%
EBIT Margin 1.7% -2.5% 9.4% 10.2% 10.0%
Net Income Margin
1.1% -2.1% 6.5% 6.9% 6.5%
Return on Equity - Total
2.1% -4.0% 14.5% 14.7% 14.0%
Return on Invested Capital
1.0% -1.6% 7.1% 7.3% 7.0%
Return on Assets
0.8% -1.3% 5.4% 5.5% 5.2%
Asset Turnover
0.6 0.7 0.8 0.7 0.7
Financial Leverage
120.8% 125.4% 102.9% 102.5% 98.5%
Interest Expense on Debt
33,409,000,000 46,882,000,000 46,113,000,000 49,326,000,000 21,601,000,000
Effective Tax Rate
31.8% 37.4% 37.7% 38.1%
Cash Flow % Sales
9.4% 6.4% 12.4% 12.9% 12.8%
Selling, General & Administrative Expenses % of Sales
11.2% 12.3% 9.5% 10.4% 10.5%
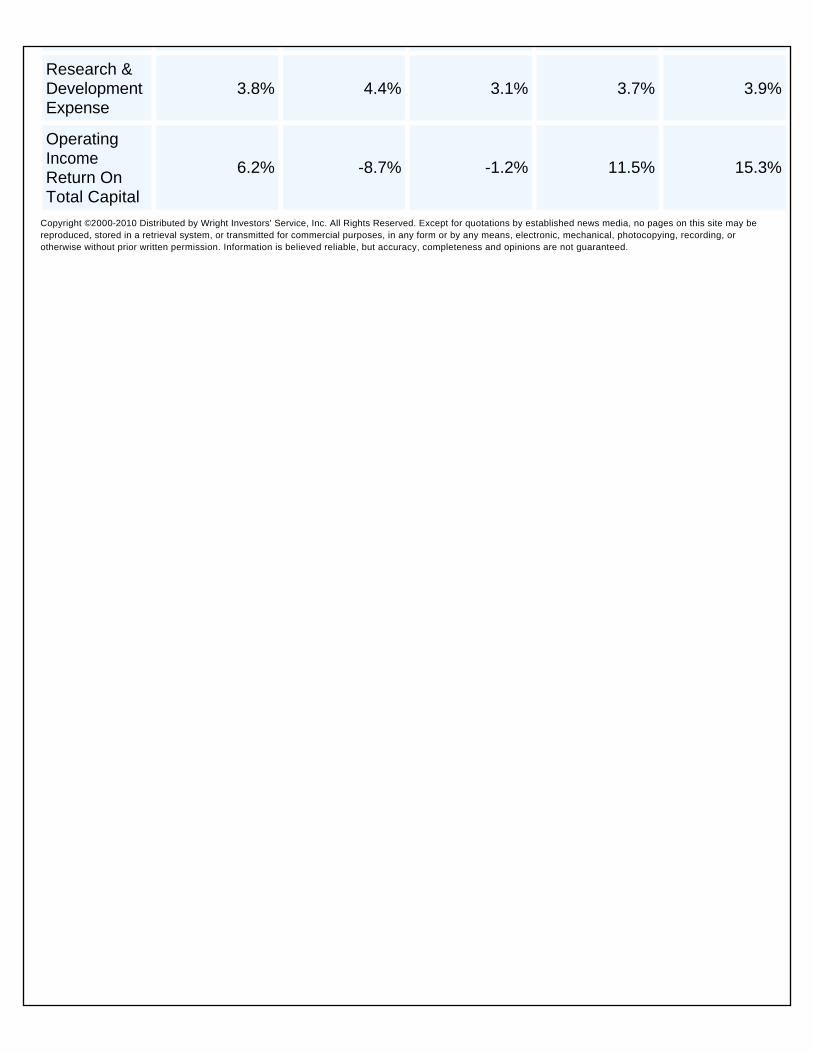
Research & Development Expense
3.8% 4.4% 3.1% 3.7% 3.9%
Operating Income Return On Total Capital
6.2% -8.7% -1.2% 11.5% 15.3%
Copyright ©2000-2010 Distributed by Wright Investors' Service, Inc. All Rights Reserved. Except for quotations by established news media, no pages on this site may be reproduced, stored in a retrieval system, or transmitted for commercial purposes, in any form or by any means, electronic, mechanical, photocopying, recording, or otherwise without prior written permission. Information is believed reliable, but accuracy, completeness and opinions are not guaranteed.

Wright Quality Rating AnalysesWright Quality Rating Analyses\Investment Acceptance
Wright Quality Rating - Investment Acceptance: Toyota Motor Corporation Currency figures are in millions of U.S. Dollars.
Wright Quality Rating ABC7
Investment Acceptance Rating ABC7
Total Market Value of Shares Outstanding - Three Year Average 167,950
- Current Year 122,765
Public Market Value (Excludes Closely Held) - Three Year Average 112,353
- Current Year 82,126
Trading Volume - Three Year Average 0
- Current Year 0
Turnover Rate - Three Year Average 0.0%
- Current Year 0.0%
Stock Exchange Listings NAS OSA TYO
Number of Institutional Investors 500
Number of Shareholders 625,540
Closely Held Shares as % of Total Shares Outstanding 33.1%Copyright ©2000-2010 Distributed by Wright Investors' Service, Inc. All Rights Reserved. Except for quotations by established news media, no pages on this site may be reproduced, stored in a retrieval system, or transmitted for commercial purposes, in any form or by any means, electronic, mechanical, photocopying, recording, or otherwise without prior written permission. Information is believed reliable, but accuracy, completeness and opinions are not guaranteed.
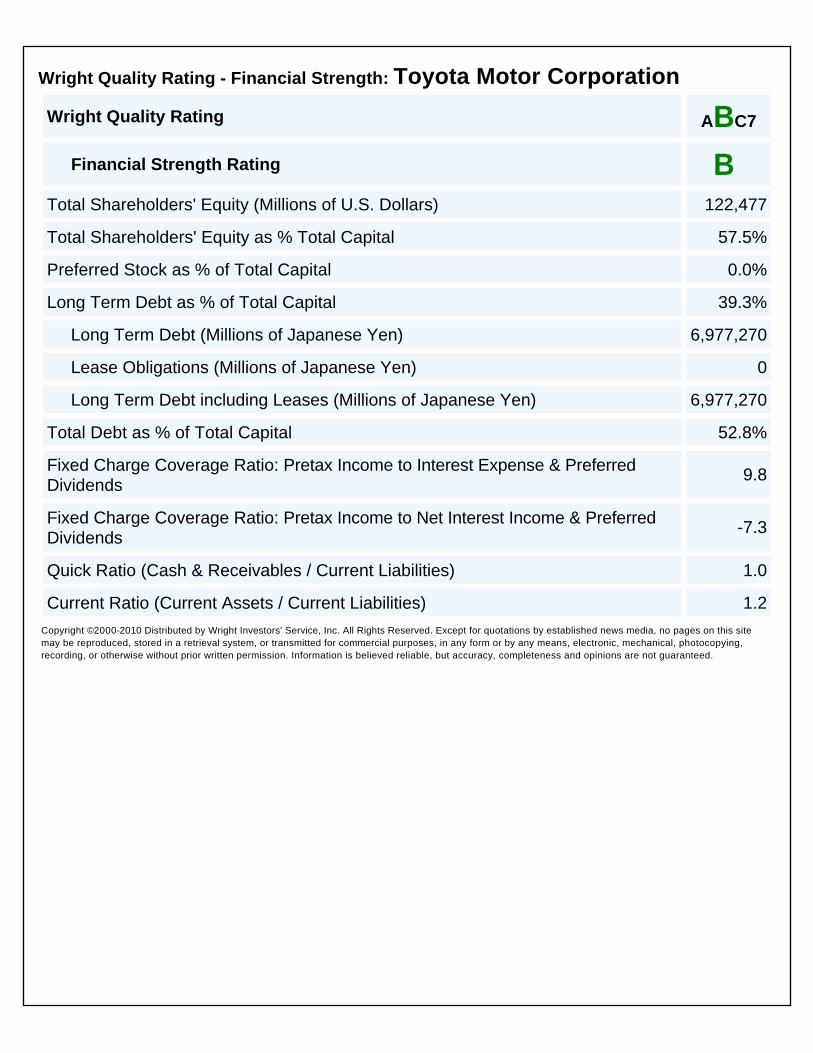
Wright Quality Rating Analyses\Financial Strength
Wright Quality Rating - Financial Strength: Toyota Motor Corporation
Wright Quality Rating ABC7
Financial Strength Rating ABC7
Total Shareholders' Equity (Millions of U.S. Dollars) 122,477
Total Shareholders' Equity as % Total Capital 57.5%
Preferred Stock as % of Total Capital 0.0%
Long Term Debt as % of Total Capital 39.3%
Long Term Debt (Millions of Japanese Yen) 6,977,270
Lease Obligations (Millions of Japanese Yen) 0
Long Term Debt including Leases (Millions of Japanese Yen) 6,977,270
Total Debt as % of Total Capital 52.8%
Fixed Charge Coverage Ratio: Pretax Income to Interest Expense & Preferred Dividends
9.8
Fixed Charge Coverage Ratio: Pretax Income to Net Interest Income & Preferred Dividends
-7.3
Quick Ratio (Cash & Receivables / Current Liabilities) 1.0
Current Ratio (Current Assets / Current Liabilities) 1.2Copyright ©2000-2010 Distributed by Wright Investors' Service, Inc. All Rights Reserved. Except for quotations by established news media, no pages on this site may be reproduced, stored in a retrieval system, or transmitted for commercial purposes, in any form or by any means, electronic, mechanical, photocopying, recording, or otherwise without prior written permission. Information is believed reliable, but accuracy, completeness and opinions are not guaranteed.
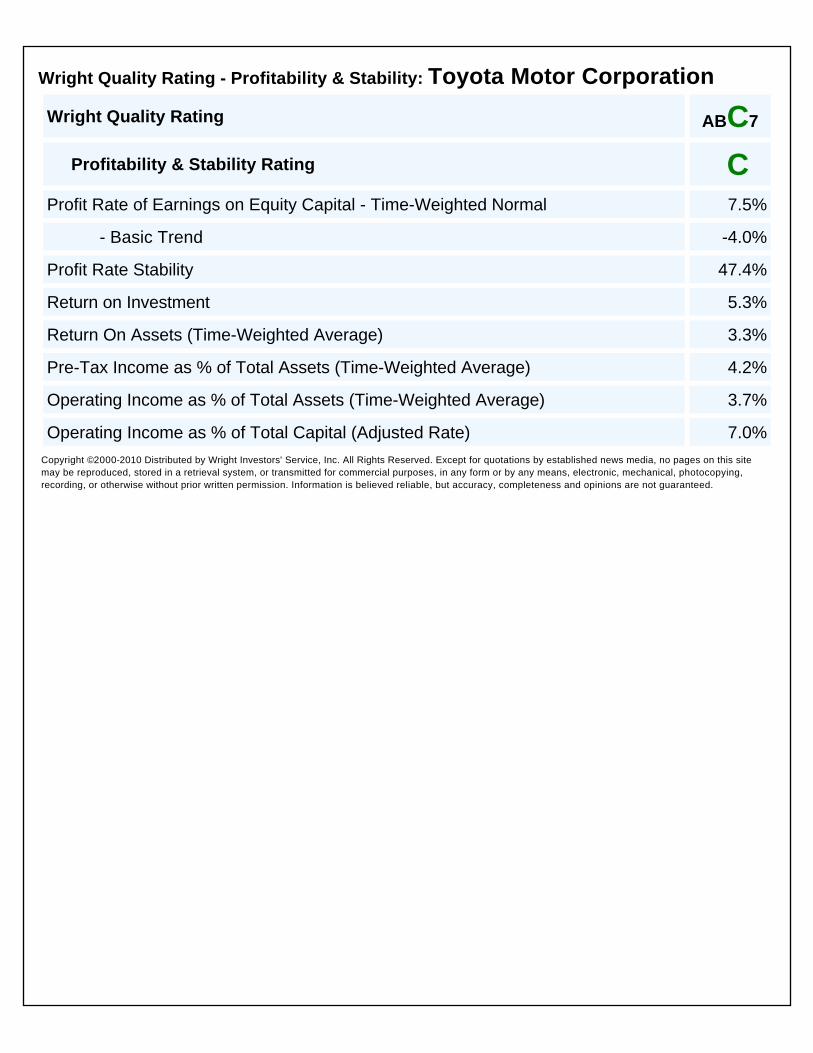
Wright Quality Rating Analyses\Profitability & Stability
Wright Quality Rating - Profitability & Stability: Toyota Motor Corporation
Wright Quality Rating ABC7
Profitability & Stability Rating ABC7
Profit Rate of Earnings on Equity Capital - Time-Weighted Normal 7.5%
- Basic Trend -4.0%
Profit Rate Stability 47.4%
Return on Investment 5.3%
Return On Assets (Time-Weighted Average) 3.3%
Pre-Tax Income as % of Total Assets (Time-Weighted Average) 4.2%
Operating Income as % of Total Assets (Time-Weighted Average) 3.7%
Operating Income as % of Total Capital (Adjusted Rate) 7.0%Copyright ©2000-2010 Distributed by Wright Investors' Service, Inc. All Rights Reserved. Except for quotations by established news media, no pages on this site may be reproduced, stored in a retrieval system, or transmitted for commercial purposes, in any form or by any means, electronic, mechanical, photocopying, recording, or otherwise without prior written permission. Information is believed reliable, but accuracy, completeness and opinions are not guaranteed.
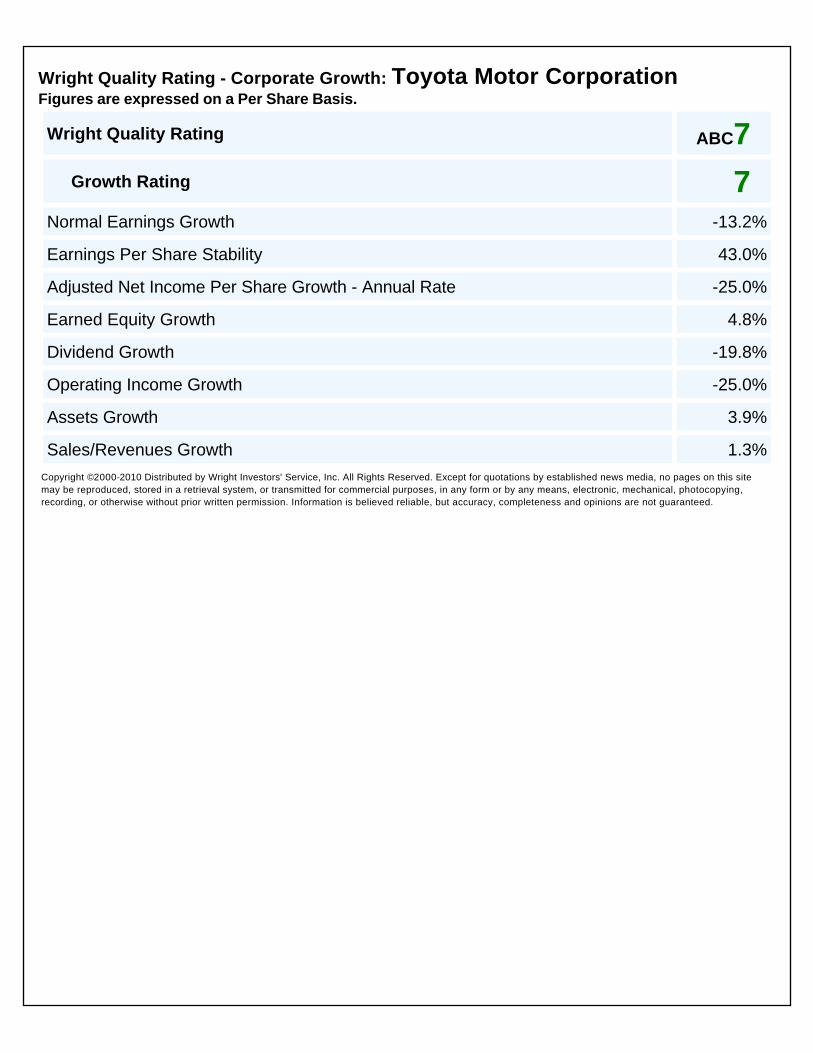
Wright Quality Rating Analyses\Corporate Growth
Wright Quality Rating - Corporate Growth: Toyota Motor Corporation Figures are expressed on a Per Share Basis.
Wright Quality Rating ABC7 Growth Rating ABC7Normal Earnings Growth -13.2%
Earnings Per Share Stability 43.0%
Adjusted Net Income Per Share Growth - Annual Rate -25.0%
Earned Equity Growth 4.8%
Dividend Growth -19.8%
Operating Income Growth -25.0%
Assets Growth 3.9%
Sales/Revenues Growth 1.3%Copyright ©2000-2010 Distributed by Wright Investors' Service, Inc. All Rights Reserved. Except for quotations by established news media, no pages on this site may be reproduced, stored in a retrieval system, or transmitted for commercial purposes, in any form or by any means, electronic, mechanical, photocopying, recording, or otherwise without prior written permission. Information is believed reliable, but accuracy, completeness and opinions are not guaranteed.