Toxic Shell Game - environmentalintegrity.org EPA’s Newest Loophole: Higher Emissions of Lead,...
22
Toxic Shell Game EPA Reversal Opens Door to More Hazardous Air Pollution MARCH 26, 2018
Transcript of Toxic Shell Game - environmentalintegrity.org EPA’s Newest Loophole: Higher Emissions of Lead,...

Toxic Shell Game EPA Reversal Opens Door to More Hazardous Air Pollution
MARCH 26, 2018
1
ACKNOWLEDGEMENTS
Written by Eric Schaeffer and researched by Keene Kelderman of the Environmental Integrity Project.
THE ENVIRONMENTAL INTEGRITY PROJECT
The Environmental Integrity Project
(http://www.environmentalintegrity.org) is a nonpartisan,
nonprofit organization established in March of 2002 by
former EPA enforcement attorneys to advocate for effective
enforcement of environmental laws. EIP has three goals: 1)
to provide objective analyses of how the failure to enforce or
implement environmental laws increases pollution and
affects public health; 2) to hold federal and state agencies, as
well as individual corporations, accountable for failing to
enforce or comply with environmental laws; and 3) to help
local communities obtain the protection of environmental
laws.
CONTACTS:
For questions about this report, please contact:
Tom Pelton, Environmental Integrity Project, (202) 888-
2703 or [email protected]
PHOTO CREDITS: Cover photo from iStock.
1
EPA’s Newest Loophole: Higher Emissions
of Lead, Other Toxic Air Pollution
n January 25, 2018, President Trump’s Environmental Protection Agency unveiled
its latest reversal of Clean Air Act standards,1 making it easier for industrial plants
to increase their emissions of lead and other neurotoxins, benzene and other
carcinogens, and acid gases like hydrogen chloride. The new exemption allows major sources of these and other hazardous air pollutants to turn off emission control systems or
run them less frequently if they promise to emit less than 10 or more tons of any specific air toxin and less than 25 tons of all such pollutants combined. Until now, these sources have been required to minimize their emissions by operating these pollution control devices
around the clock.
For this report, the Environmental Integrity Project examined enforcement records and
emissions data for 12 chemical plants, iron and steel foundries, waste management operations and other industrial plants in the Midwest that release a combined total of
121,082 pounds of hazardous air pollution per year (based on the most recent company disclosures, see TABLE A). After EPA’s rollback, total emissions from these major sources could more than quadruple to a total of 540,000 pounds a year, because the new exemption
allows such facilities to save money by cutting back on their pollution controls. Emissions can drift upward – far above their current levels – so long as they stay below 10 tons for any
single pollutant or 25 tons combined (actual emissions and the amount by which they could increase can vary from one facility to the next).
The higher emission rates will increase health risks and reduce the quality of life for those living downwind, often in communities already exposed to too much pollution. Just over 60,000 people live within a mile of the twelve plants reviewed in this study, most in
neighborhoods with poverty rates that are at least twice the national average of 13 percent (see TABLE B).2
Much of that extra pollution will stay hidden. EPA’s new rollback assumes that polluters can accurately quantify their annual emissions to show they are low enough to qualify for
the exemption. But under the current rules, even the largest polluters seldom actually measure their hazardous emissions. Instead, the rules require major sources to monitor the operation of air pollution control devices – like baghouses and scrubbers -- that are supposed
to minimize releases. While these methods are far from perfect, EPA’s new policy requires even less monitoring from facilities that promise to reduce their pollution. That is like
allowing drivers to remove speedometers from their cars if they promise to obey the speed limit.
EPA investigations of Midwestern plants show that these controls are frequently not operational, which means that far more pollution is being released than companies report.
O

2
Given this monitoring mayhem, it is not surprising that companies report widely different amounts of the same pollutants to two different federal databases – the Toxics Release
Inventory (TRI) and the National Emissions Inventory (NEI), see TABLE C. EPA’s new loophole will make this problem even worse, by weakening the monitoring standards for
some plants and eliminating them altogether for others.
American manufacturers are critical to our economy and are valued as employers and
taxpayers by the communities that host them. But public health also matters and pollution costs money too, in the form of expenses for medical care, work days lost to illness, lives cut short from cancer and lung and heart disease, and declining property values in
neighborhoods overwhelmed by air pollution. EPA’s rollback invites companies to turn off pollution controls they have operated for years. That may increase short term profits for a
few, but at what price to those exposed to more lead and other dangerous pollutants?
Section 112 of the Clean Air Act requires the largest polluters to install and operate
“maximum achievable control technologies” – based on the cleanest sources within their industry sector – to minimize the release of hazardous air pollutants. The list of pollutants covered by these rules include lead and other neurotoxins, carcinogens like benzene and
butadiene, and acid gases like hydrogen chloride or sulfuric acid.3 These contaminants are dangerous to human health in minute quantities. For example, EPA has determined that
airborne lead concentrations are unsafe above 15 parts per billion, while lifetime cancer risk from butadiene are significant at exposures above 4 parts per billion. Increasing emissions of
these pollutants by several hundred more pounds – or even a few grams in case of particularly deadly contaminants like dioxin – can make the air unsafe to breathe. Communities next to major sources of pollution are usually exposed to more than one of
these contaminants, which can increase risks even further.
EPA’s New Exemption Invites Major Sources to Increase
Emissions
The standards apply to industrial plants with the potential to emit at least 10 tons of any
single pollutant or 25 tons of multiple contaminants. The rules require these major sources to select specific pollution control methods, e.g., using baghouses to capture and remove the
toxic metals that cling to particulates, wet scrubbers to remove metals or acid gases, or maintaining furnace temperatures high enough to destroy organic pollutants like benzene.
In many cases, these methods can dramatically reduce emissions. For example, a major
source that previously released more than ten tons of lead may emit less than one ton after installing a baghouse with filters that traps more than 90 percent of this pollutant before it
can be released to the air. Under the “once in, always in,” policy that EPA adopted in 1995,4 that plant would have to continue to run the baghouse that achieved those low
emission levels. The agency’s new policy allows the facility to save money by periodically shutting the baghouse down, so long as its lead emissions stayed below ten tons per year.

3
That would allow a major source that currently releases 2,000 pounds of lead a year to increase annual emissions by almost 18,000 pounds.
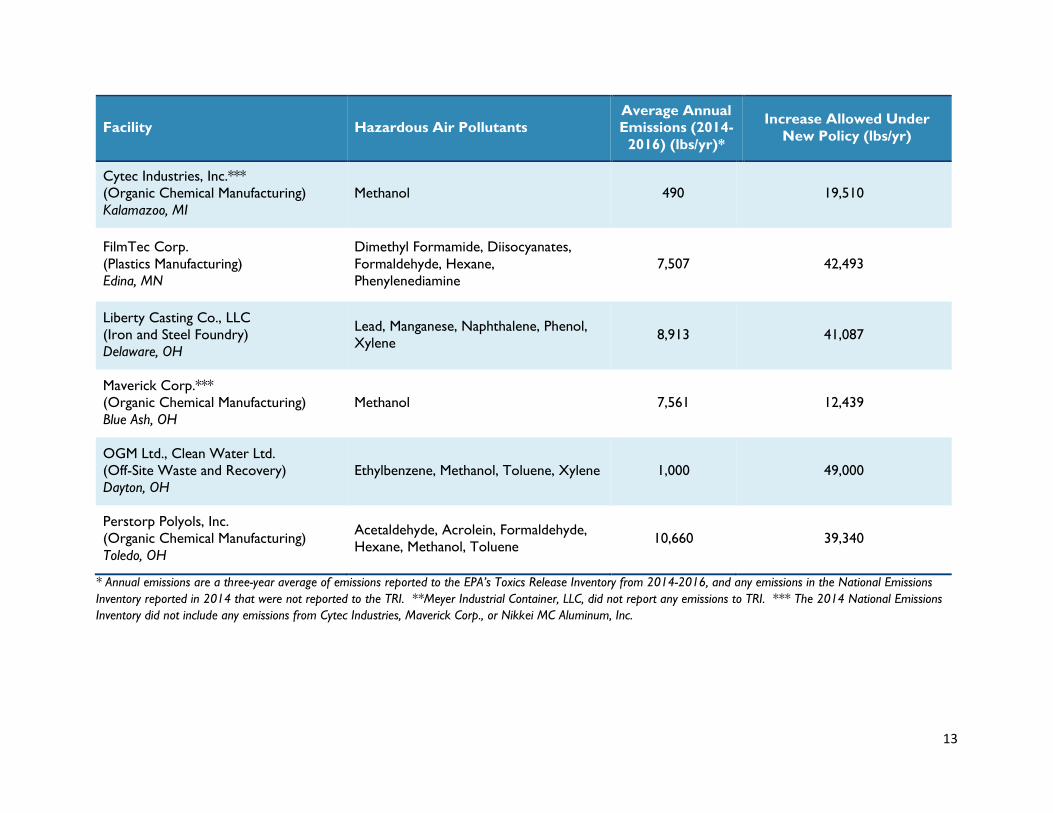
TABLE A compares the actual emissions from twelve major sources, based on the most recent data from the Toxics Release Inventory or the National Emissions Inventory, to the
amounts these same plants would be allowed to emit under the new loophole.5
The actual emissions from major sources may vary from one year to the next, depending on
production levels and how well they comply with the pollution control standards. As a matter of law, these performance based standards require major sources to cut their hazardous air pollution down to the levels achieved by the cleanest sources within their
industry. The Trump Administration turns that logic on its head by allowing the same companies to turn off their emission controls once their hazardous air pollution falls below
ten tons per year for a single pollutant (or twenty-five tons combined), even if they have already achieved lower emission levels in practice.
EPA claims its new policy will encourage the largest polluters to reduce their emissions. To illustrate, the agency assumes that a facility that is regulated as a major source today because it emits 12 tons of manganese a year would want to reduce that to less than ten tons
so it could escape the monitoring and pollution control requirements that apply to major sources. But under some circumstances, that facility could simultaneously increase its
emissions of other more harmful toxins without losing this new exemption.
For example, a baghouse installed to reduce emissions of toxic metals like manganese may
have also reduced releases of arsenic to less than one ton per year. A facility that reduces just enough manganese to escape regulation as a major source could limit operation of its baghouse, increasing emissions of arsenic by up to nine tons annually. This scenario is not
unrealistic, as the emissions of specific toxic metals like arsenic and manganese do not always rise and fall in tandem.
Also, all hazardous air pollutants are not created equal. A few pounds of mercury can
contaminate a large lake while increasing dioxin emissions by a few grams can elevate
cancer and other health risks. The largest mercury sources in the U.S. emit less than a ton of this pollutant in a year’s time, while the biggest dioxin emitters release less than an ounce to the atmosphere. Even small increases in emissions of these toxins can affect public health
or contaminate our waterways. EPA’s rollback rewards companies for reducing emissions of one hazardous chemical by allowing them to relax pollution controls that may help to
destroy others that are far more dangerous.
EPA says that major sources that qualify for this new exemption would still have to meet
standards that are supposed to limit emissions from smaller, so-called “area” sources. But with rare exceptions, the rules for these smaller emission sources allow higher emission levels, cover fewer hazardous air pollutants, and require much less in the way of emission
controls and monitoring (see discussion on page 7).
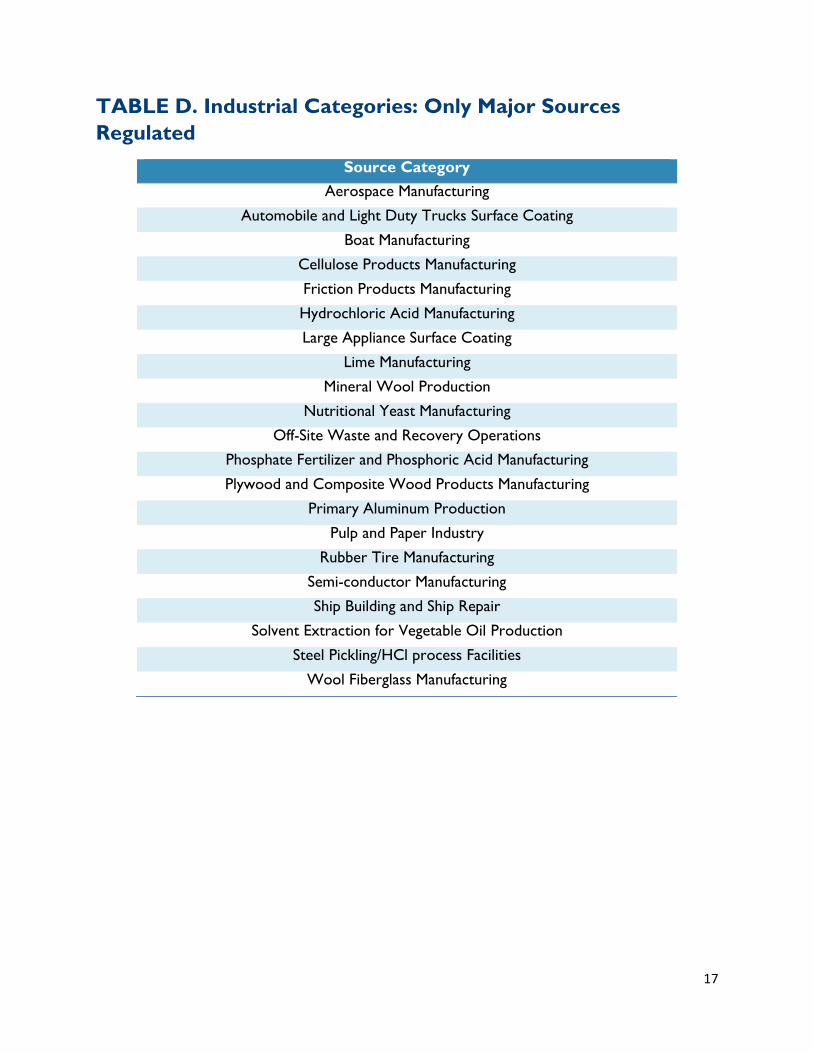
Also, for at least twenty-one industries, the Clean Air Act limits apply only to major sources
of air toxins – there are no requirements at all for plants that do not have the potential to

4
emit more than ten tons of any specific pollutant or twenty five tons total. For example, there are no “area source” standards at all for aerospace, phosphate fertilizer, plywood and
wood product and pulp and paper manufacturing. (See TABLE D for a complete list.) Any plant within these sectors that no longer has to comply with major source standards –
even when it increases emissions far above current levels –is home free and no longer has to comply with any federal limits on hazardous air pollution.
More Toxic Air Pollution: Who Pays?
Those most hurt by this gift to industry lobbyists are the neighborhoods immediately
downwind of plants that are now licensed to increase their emissions of lead, manganese, chlorine, hydrogen chloride and other dangerous contaminants. Many of these communities
have higher than average poverty rates, a high proportion of African American and Latino residents, and are home to thousands of young children and elderly citizens whose respiratory systems are most vulnerable to air pollution.
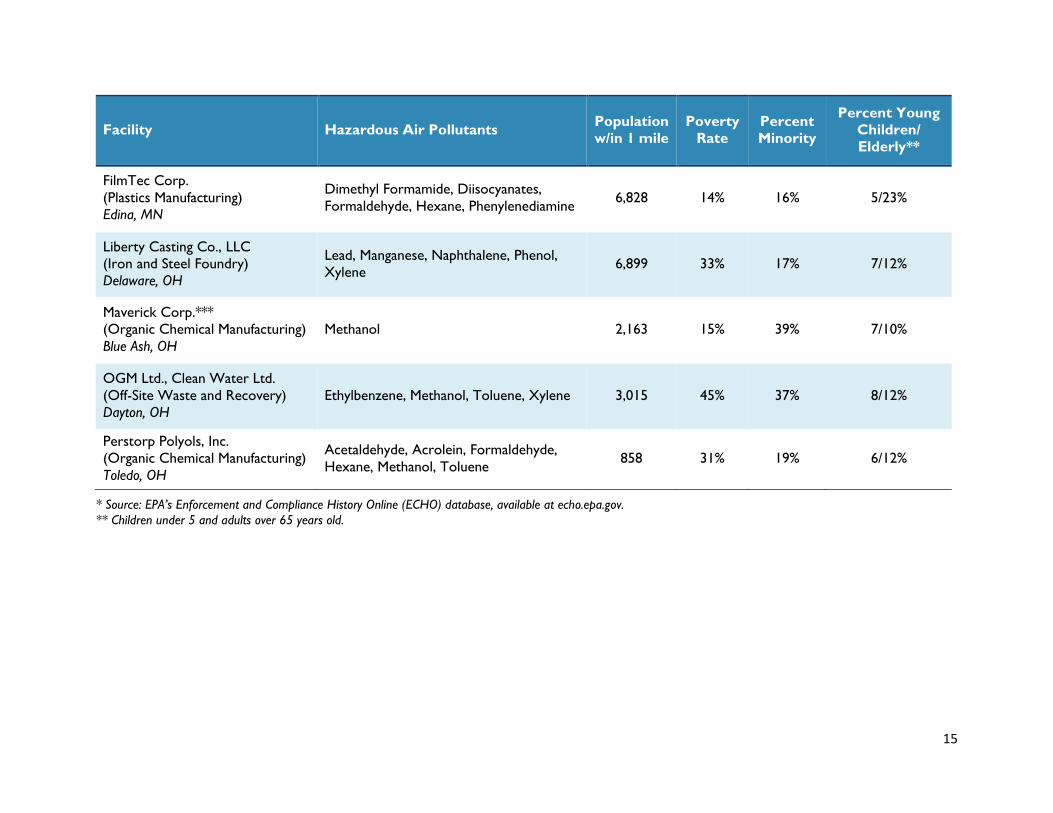
For example, just over sixty thousand people live within a mile of one of the twelve plants listed in TABLE B, including 3,981 children and 8,716 citizens sixty-five or older. The
poverty rates in neighborhoods near seven of these industrial sites are from two to more than four times the national average of 13%. The population within a mile of Meyer
Industrial Container, a Chicago facility that recycles drums that previously stored chemicals and factory wastes, is entirely African American or Latino. The lower income communities surrounding iron and steel foundries in Indiana and Ohio (Harrison Steel Castings and
Liberty Castings) are majority white. But regardless of race or income level, these neighborhoods are at risk of greater exposure to airborne contaminants, such as arsenic,
lead, and dioxin, if the plants next door decide to cash in on EPA’s rollback.
Of course, it is possible that some of these plants will decline to take advantage of the new
exemption, and will decide to keep their emissions at or below current levels just to be good neighbors. But the Trump Administration has made clear they are no longer obligated to do
so.
Exemption Eliminates Emissions Monitoring
As discussed above, many of the major sources qualifying for the new exemption would be able to emit air toxins in much higher amounts than they do today. But to make matters worse, EPA has not required industrial facilities to use monitoring methods accurate
enough to quantify the amount of each hazardous air pollutant released every year. EPA’s rollback depends on manufacturers promising to keep emissions of any single hazardous air
pollutant below 10 tons for any single pollutant and 25 tons for multiple contaminants. But with few exceptions, the agency will not be able to verify that these promises have been
kept.
5
Under the current rules, actual emissions of hazardous air pollutants are rarely tested and are not measured at all on a day to day basis. Instead, major sources monitor the
performance of the control devices that are supposed to capture or destroy these pollutants.
For example, the heaters and furnaces at iron and steel foundries emit a variety of
hazardous air pollutants that include metals like chromium, lead and manganese, and volatile organic toxins like benzene and triethylamines. The current regulations require
foundries that are major sources of these pollutants to limit particulate emissions to no more than 0.1 pounds per ton of metal charged in furnaces, as that will also reduce emissions of the toxic metals that cling to the particles that accumulate in the exhaust from these
furnaces. Certain process units must also comply with numerical emission limits for volatile organic compounds and trimethylamine.
Once every five years, these major sources sample the exhaust from their furnaces for three or four hours to make sure these limits are being met. These infrequent tests may not even
reflect emissions during “normal” operations as the facility has an opportunity to clean up any problems before testing. In between testing, they must monitor their pollution controls to make sure they keep working at least as well as they did during the previous emissions
test. For example, a foundry that uses a baghouse to control particulates must either install a system that sounds an alarm whenever these systems leak, or check pressure levels daily to
make sure they are high enough to draw particulates through the baghouse filters that trap and remove them. Likewise, furnace temperatures are monitored daily to make sure they
are hot enough to destroy toxic gases. For example, cupola metal melting furnaces must maintain temperatures at or above 1300 degrees Fahrenheit. These operating parameters can be adjusted based on periodic test results to make sure they accurately measure
pollution control performance.
The failure to meet these day to day operating conditions is considered a “deviation” that
must be reported and promptly corrected. These deviations – which reflect a breakdown in pollution controls – usually result in higher emission levels. But, there is no method for
quantifying emissions based on these deviations or how well these control methods work
from one day to the next. Instead, major sources estimate their annual releases of hazardous air pollutants based on methods that assume pollution controls work all the time,
and that ignore the effect that day to day variations in plant operating conditions have on emissions.
Not surprisingly, the same facility can often report very different emission levels of the same pollutant to two different federal databases. For example, the Spectro-Alloys Corporation
in Rosemont, Minnesota, reported emitting 121,042 pounds of hydrogen chloride in 2014 to the NEI, but only 15,830 pounds to TRI. Conversely, Harrison Steel Castings reported releasing 10,129 pounds of phenol to the air in 2014 to TRI, but only 4,640 pounds to the
NEI. For additional examples, see TABLE C.
6
EPA Methods for Estimating Plant Emissions Are
Inaccurate and Out of Date
Over the past four decades, EPA has attempted to develop “emission factors” to help estimate the amount of certain pollutants emitted from various industrial processes. These methods usually predict the quantity of pollution that will be released based on a unit’s heat
rate or output, e.g., as pounds of particulate matter per unit of heat input from a boiler, or per ton of metal that passes through an electric arc furnace. These calculations also take
into account assumptions about the effectiveness of air pollution control devices, e.g., the
emission factor may assume that a baghouse will reduce 99 percent of the particulates in the
exhaust from a boiler.
At best, these factors are based on the average of emission test results from multiple plants within an industry sector, many of which reflect emission rates much higher than the
average. There are no emission factors for some hazardous air pollutants, and EPA has warned that the data for others is extremely unreliable. Nevertheless, many plant managers
use industry-wide averages to quantify emissions from their own facilities and to demonstrate compliance with Clean Air Act permit limits. EPA has repeatedly warned that
such uses are inappropriate:
“Use of these factors as source specific permit limits and/or as emission regulation compliance determinations is not recommended by EPA…As such, a permit limit
using an AP-42 emission factor would result in half of the sources being in noncompliance.”6
Because they represent industry-wide averages, there is at least a 50 percent chance that a specific facility relying on EPA’s emission factors to claim that its hazardous air pollution is
low enough to qualify for the new exemption will be wrong. In practice, even more facilities are likely to under-estimate emissions for two reasons.
First, because emission factors are based on short-term testing conducted during a plant’s
“normal” operation, they do not account for the large amounts of pollution released when a process unit malfunctions or is shut down and restarted after maintenance. Many plants
often bypass their pollution controls during these episodes, venting dirty exhaust directly to the atmosphere. That can mean a substantial spike in pollution over a very short period of
time. For example, a boiler that vents dirty exhaust directly to the atmosphere will release one hundred times more particulate matter than a baghouse designed to remove 99 percent of this pollutant
Second, EPA has admitted that its data regarding emissions of specific hazardous air pollutants is so limited and of such poor quality that it cannot be used even to estimate
emissions based on industry-wide averages. For example, the Agency has posted estimates of lead emissions from various furnaces used by the iron and steel industry and other
sources, but warned the data is of poor quality and may not be based on a random sample or reflect the wide variation in emissions between sources. In many cases, the data is so limited that EPA cannot even rate its relative accuracy.

7
The agency proposed in 2007 to be more explicit about the wide range of uncertainty associated with emission factors but appears to have abandoned that effort.
No Backup Standards Once Major Sources Are Exempt
As explained above, while major sources must monitor the day to day performance of air pollution control devices, they are not required to measure actual emissions of lead, benzene, or other hazardous air pollutants for more than several hours once every few years.
Even then, testing often measures the concentration of particulate matter or other ‘surrogates,” and these short-term and infrequent test results seldom reliably predict the
amount of hazardous air pollutants released from one year to the next.
As imperfect as these methods are, they at least require polluters to make sure their emission
controls – baghouses, scrubbers, high temperature combustion – are working well enough to remove or destroy these toxins. But most of these requirements disappear for major sources that take advantage of EPA’s new exemption by agreeing to “limit” their emissions to no
more than ten tons of any one hazardous compound and twenty five tons for all such pollutants – even if their current emissions are far lower than these thresholds. These
facilities may be subject to so-called “area source” standards, but even where these standards for so-called “small” emitters do apply, they are far less stringent.7 For example,
the particulate matter emission rates for existing iron and steel foundries that qualify as area sources are eight times higher than the rates allowed for major sources. To illustrate, here are examples of some of the differences in the standards for existing foundries:
Major sources: Metal cupola melting furnaces can emit no more than 0.1 pounds of particulates per ton of metals charged in the furnace.
Area Sources: Can emit up to 0.8 pounds per ton.
Major sources: Electric induction melting furnaces and scrap preheaters sources
limited to .005 grains of particulate matter per dry standard cubic foot (dscf) of exhaust gas.
Area Sources: No emission limits for preheaters. Electric induction furnaces can emit up to 0.8 pounds per ton (equivalent to 0.04 grains/dscf).
Major sources: Metal cupola melting furnaces and sand mold systems must limit emissions of volatile organic hazardous air pollutants (VOHAP’s) to no more than 20 parts per million. Furnaces must maintain temperature at or above 1300 degrees
to destroy these pollutants. Emissions of trimethylamine (TEA) from cold box or core making lines limited to 1 part per million, or removal of 99 percent of pollutant.
Area sources: No emission limits for VOHAP’s or TEA.

8
Major Sources: Monitoring plan must establish operating limits to ensure control devices are effective. For example, if baghouses are used to control particulates, they
must have automated leak detection system with alarms. If wet scrubbers are the control method, facility must determine the flow rate and pressure level needed to
meet emission limits and monitor performance every three hours.
Area Sources: Baghouses inspected monthly for evidence of leaks. Scrubbers
inspected daily to verify the “presence” of water levels, but no monitoring of actual flow rate or pressure to determine whether scrubber functions well enough to meet
particulate emission limits.
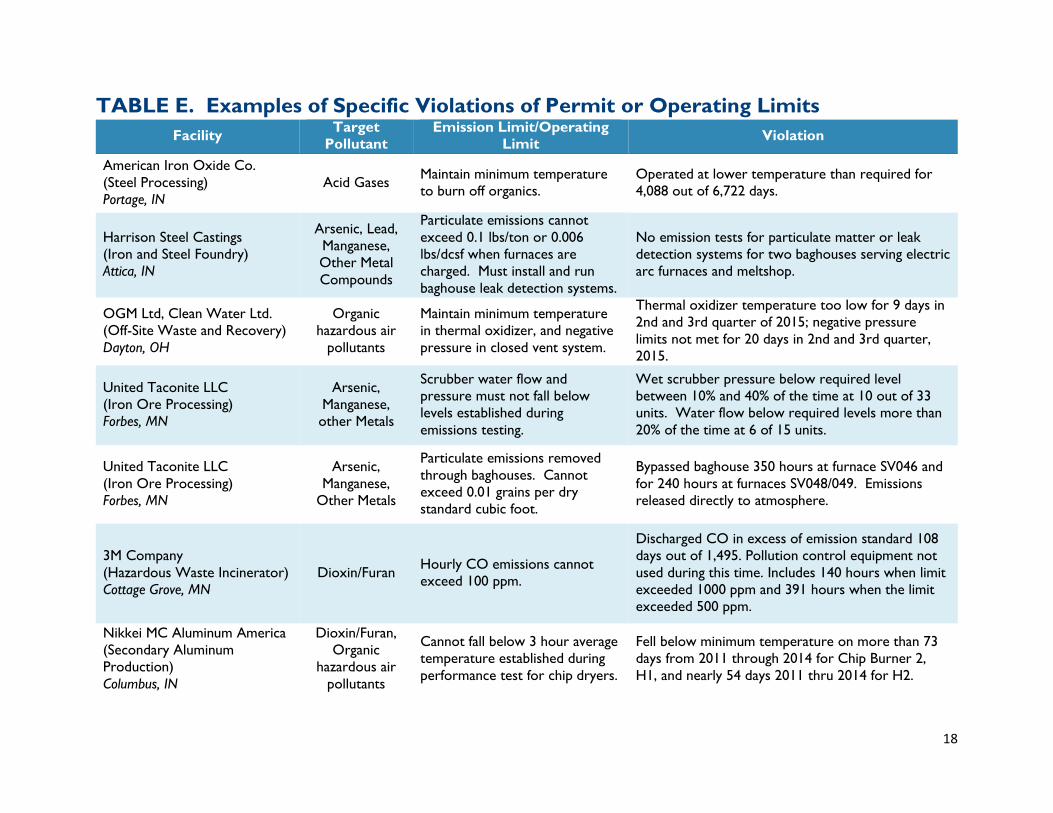
Repeated Violations Mean More Hazardous Air Pollution
– But How Much?
Enforcement of the rules that protect public health from neurotoxins like lead or carcinogens like dioxin is sporadic at best. But although the data is limited, investigators
working out of EPA’s Chicago office (Region V) found serious violations of those standards by incinerators, iron and steel foundries, chemical plants, lead smelters and other industrial
sites. EPA issued notices of violations based on investigation findings that included:
Bypassing pollution controls that are supposed to capture or destroy pollution. US
Taconite, an iron ore processing company in Forbes, Minnesota, bypassed baghouses designed to remove more than 90 percent of particulate matter and the metals that cling to them for more than 350 hours at one furnace and 240 hours at another from
August of 2012 through June of 2013, releasing all of the these contaminants directly to the atmosphere instead.
Failing to keep lead from leaking out of enclosures at secondary lead smelters. US
Gopher Resources, a lead smelting plant in Eagan, Minnesota, either did not
monitor or did not meet these standards at least 8.8 percent of the time in 2014 according to the results from one pressure gauge. At the other two monitoring
locations, Gopher installed wind shields making it harder to detect leaks. Minnesota determined in 2009 that lead levels in the neighborhoods downwind violated health based standards for this neurotoxins, based largely on emissions from the Gopher
plant.
Failing to meet limits on carbon monoxide pollution, which indicate poor
combustion efficiency and higher emissions of dioxin and furans. For example, the incinerator at 3M’s Cottage Grove large manufacturing site in Minnesota exceeded
these limits on at least 108 days between February of 2012 and March of 2016. Emission rates were at more than ten times higher than the limit of 100 parts per million for at least 140 hours and more than five times higher for 390 hours.

9
See TABLE E for more examples. EPA’s notices of violation make clear that these breakdowns resulted in higher levels of lead, dioxins, and other contaminants that pollution
control devices were supposed to remove or destroy. But the Agency has not quantified how much more pollution was released, in part because it is not easy to derive those
numbers from rules designed to measure the performance of baghouses, scrubbers, or furnaces. But if the Agency cannot determine the emissions impact of these system failures,
how will EPA or states be able to measure whether facilities are keeping their emissions low enough to qualify for the new exemptions that EPA is offering?
More Pollution, Less Accountability
While far from perfect, the Clean Air Act rules have helped to reduce emissions of toxic air contaminants like lead and dioxin by requiring major sources to install and operate devices
that capture or destroy those toxins. EPA’s new loophole would turn the clock back, by inviting major sources that report to turn off pollution controls that are already up and
running and to release far higher amounts of air toxins that they do today.
The facilities qualifying for the exemption “win,” by obtaining a new entitlement to release
as much as ten tons of any single pollutant or twenty five tons of any combination, without having to comply with the requirements that apply to major sources. The thousands of people living in neighborhoods clustered around these newly exempt industrial plants will
lose, as they will inevitably be exposed to higher levels of toxic air pollution.
The truth is that neither federal and state regulators nor the industries they regulate can say
they know with confidence how much hazardous air pollution is being released from specific industrial facilities. At best, the rules in place measure the performance of control
devices that are supposed to minimize emissions of toxins that are dangerous in very small quantities. As noted above, those imperfect standards have improved air quality and are certainly more protective than allowing plant operators to game the system by turning those
pollution controls off based on guesswork about how much hazardous air pollution they are releasing.
EPA Administrator Scott Pruitt has publicly declared that EPA will not “second-guess” the industries it regulates. In fact, that is exactly what the public expects EPA to do. Relying
on guesswork from regulated industries – whether self-interested or well-intentioned – is ill advised, an abdication of the government’s responsibility, and sometimes outright dangerous. EPA should close the loophole it has needlessly opened, continue to require
major sources to run the control systems they have already have in place, and work harder to find just how much toxic pollution is getting into the air we breathe.
10
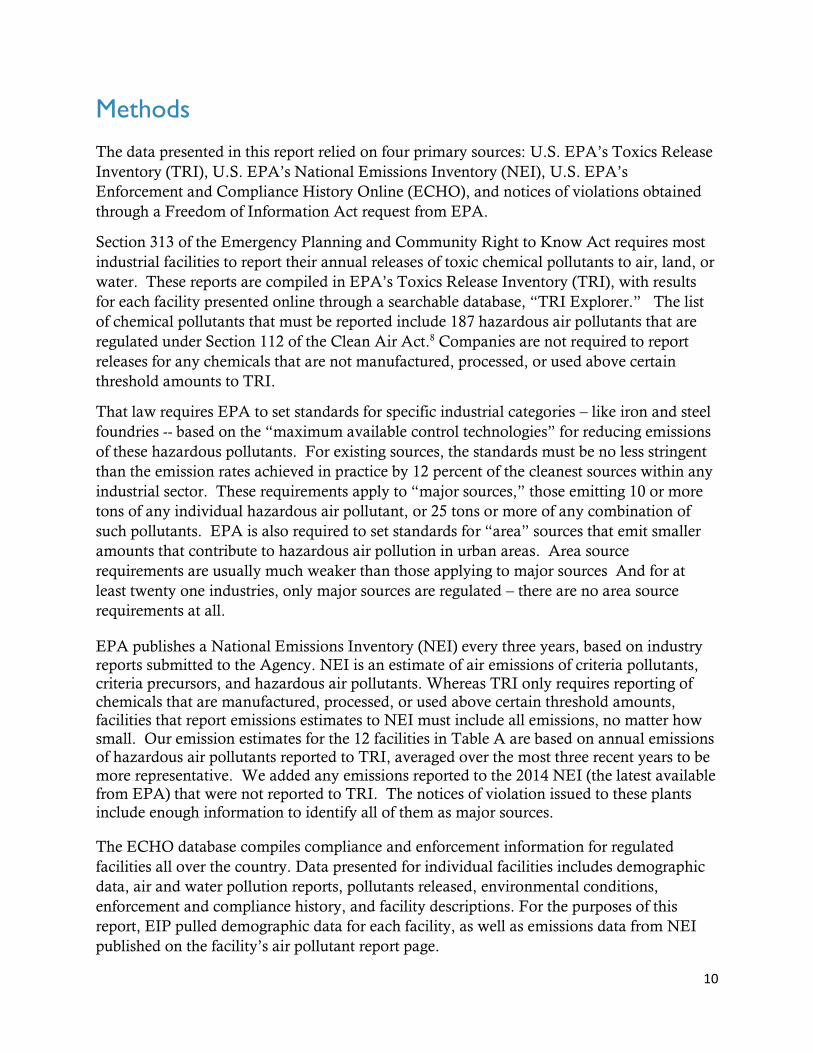
Methods
The data presented in this report relied on four primary sources: U.S. EPA’s Toxics Release
Inventory (TRI), U.S. EPA’s National Emissions Inventory (NEI), U.S. EPA’s
Enforcement and Compliance History Online (ECHO), and notices of violations obtained
through a Freedom of Information Act request from EPA.
Section 313 of the Emergency Planning and Community Right to Know Act requires most
industrial facilities to report their annual releases of toxic chemical pollutants to air, land, or
water. These reports are compiled in EPA’s Toxics Release Inventory (TRI), with results
for each facility presented online through a searchable database, “TRI Explorer.” The list
of chemical pollutants that must be reported include 187 hazardous air pollutants that are
regulated under Section 112 of the Clean Air Act.8 Companies are not required to report
releases for any chemicals that are not manufactured, processed, or used above certain
threshold amounts to TRI.
That law requires EPA to set standards for specific industrial categories – like iron and steel
foundries -- based on the “maximum available control technologies” for reducing emissions
of these hazardous pollutants. For existing sources, the standards must be no less stringent
than the emission rates achieved in practice by 12 percent of the cleanest sources within any
industrial sector. These requirements apply to “major sources,” those emitting 10 or more
tons of any individual hazardous air pollutant, or 25 tons or more of any combination of
such pollutants. EPA is also required to set standards for “area” sources that emit smaller
amounts that contribute to hazardous air pollution in urban areas. Area source
requirements are usually much weaker than those applying to major sources And for at
least twenty one industries, only major sources are regulated – there are no area source
requirements at all.
EPA publishes a National Emissions Inventory (NEI) every three years, based on industry
reports submitted to the Agency. NEI is an estimate of air emissions of criteria pollutants,
criteria precursors, and hazardous air pollutants. Whereas TRI only requires reporting of chemicals that are manufactured, processed, or used above certain threshold amounts, facilities that report emissions estimates to NEI must include all emissions, no matter how
small. Our emission estimates for the 12 facilities in Table A are based on annual emissions of hazardous air pollutants reported to TRI, averaged over the most three recent years to be
more representative. We added any emissions reported to the 2014 NEI (the latest available from EPA) that were not reported to TRI. The notices of violation issued to these plants
include enough information to identify all of them as major sources.
The ECHO database compiles compliance and enforcement information for regulated
facilities all over the country. Data presented for individual facilities includes demographic
data, air and water pollution reports, pollutants released, environmental conditions,
enforcement and compliance history, and facility descriptions. For the purposes of this
report, EIP pulled demographic data for each facility, as well as emissions data from NEI
published on the facility’s air pollutant report page.

11
The facilities highlighted in this report were picked from a list of notices of violations that
EPA sent to facilities between 2013 and the end of 2016, and were also chosen because the
facility was listed as a major source, but were reporting emissions below the major source
thresholds. These notices of violations were obtained by EIP through a Freedom of
Information Act Request.

12
TABLE A. Potential Emission Increases from 12 Midwestern Facilities
Facility Hazardous Air Pollutants
Average Annual
Emissions (2014-
2016) (lbs/yr)*
Increase Allowed Under
New Policy (lbs/yr)
Evonik Corp.
(Organic Chemical Manufacturing)
Mapleton, IL
Acetaldehyde, Acrolein, Acrylonitrile,
Benzene, Cadmium, Chloromethane,
Chromium, Formaldehyde, Hexane,
Methanol, Nickel, Toluene
17,663 32,337
Meyer Industrial Container, LLC**
(Industrial Drum Recycling)
Chicago, IL
Ethylbenzene, Formaldehyde, Glycol
Ethers, Hexane, Methanol, Methyl
Isobutyl Ketone, Phenol, Toluene,
Triethyleamine, Xylene
18,129 31,871
American Iron Oxide Co.
(Steel Pickling)
Portage, IN
Acrolein, Benzene, Cadmium, Chlorine,
Chromium, Formaldehyde, HCl, Hexane,
Lead, Manganese, Naphthalene, Nickel,
Toluene
27,547 22,453
Harrison Steel Castings Co.
(Iron and Steel Foundry)
Attica, IN
Chromium, Formaldehyde, Lead,
Manganese, Naphthalene, Phenol 9,974 40,026
Magnetics International
(Steel Pickling)
Burns Harbor, IN
Acrolein, Chlorine, Formaldehyde, HCl,
Hexane 11,625 38,375
Nikkei MC Aluminum, Inc.
(Secondary Aluminum Production)
Columbus, IN
Manganese, Nickel 13 49,987
13
Facility Hazardous Air Pollutants
Average Annual
Emissions (2014-
2016) (lbs/yr)*
Increase Allowed Under
New Policy (lbs/yr)
Cytec Industries, Inc.***
(Organic Chemical Manufacturing)
Kalamazoo, MI
Methanol 490 19,510
FilmTec Corp.
(Plastics Manufacturing)
Edina, MN
Dimethyl Formamide, Diisocyanates,
Formaldehyde, Hexane,
Phenylenediamine
7,507 42,493
Liberty Casting Co., LLC
(Iron and Steel Foundry)
Delaware, OH
Lead, Manganese, Naphthalene, Phenol,
Xylene 8,913 41,087
Maverick Corp.***
(Organic Chemical Manufacturing)
Blue Ash, OH
Methanol 7,561 12,439
OGM Ltd., Clean Water Ltd.
(Off-Site Waste and Recovery)
Dayton, OH
Ethylbenzene, Methanol, Toluene, Xylene 1,000 49,000
Perstorp Polyols, Inc.
(Organic Chemical Manufacturing)
Toledo, OH
Acetaldehyde, Acrolein, Formaldehyde,
Hexane, Methanol, Toluene 10,660 39,340
* Annual emissions are a three-year average of emissions reported to the EPA’s Toxics Release Inventory from 2014-2016, and any emissions in the National Emissions
Inventory reported in 2014 that were not reported to the TRI. **Meyer Industrial Container, LLC, did not report any emissions to TRI. *** The 2014 National Emissions
Inventory did not include any emissions from Cytec Industries, Maverick Corp., or Nikkei MC Aluminum, Inc.

14
TABLE B. Demographic Data near 12 Midwestern Facilities
Facility Hazardous Air Pollutants Population
w/in 1 mile
Poverty
Rate
Percent
Minority
Percent Young
Children/
Elderly**
Evonik Corp.
(Organic Chemical Manufacturing)
Mapleton, IL
Acetaldehyde, Acrolein, Acrylonitrile,
Benzene, Cadmium, Chloromethane,
Chromium, Formaldehyde, Hexane,
Methanol, Nickel, Toluene
290 22% 2% 6/10%
Meyer Industrial Container, LLC**
(Industrial Drum Recycling)
Chicago, IL
Ethylbenzene, Formaldehyde, Glycol
Ethers, Hexane, Methanol, Methyl Isobutyl
Ketone, Phenol, Toluene, Triethyleamine,
Xylene
32,568 58% 100% 7/15%
American Iron Oxide Co.
(Steel Processing)
Portage, IN
Acrolein, Benzene, Cadmium, Chlorine,
Chromium, Formaldehyde, HCl, Hexane,
Lead, Manganese, Naphthalene, Nickel,
Toluene
262 26% 9% 6/22%
Harrison Steel Castings Co.
(Iron and Steel Foundry)
Attica, IN
Chromium, Formaldehyde, Lead, Hexane,
Manganese, Naphthalene, Phenol 1,837 28% 5% 7/16%
Magnetics International
(Steel Processing)
Burns Harbor, IN
Acrolein, Chlorine, Formaldehyde, HCl,
Hexane 2,026 14% 16% 10/9%
Nikkei MC Aluminum, Inc.
(Secondary Aluminum Production)
Columbus, IN
Manganese, Nickel 104 22% 8% 4/14%
Cytec Industries, Inc.***
(Organic Chemical Manufacturing)
Kalamazoo, MI
Methanol 3,486 39% 30% 7/9%
15
Facility Hazardous Air Pollutants Population
w/in 1 mile
Poverty
Rate
Percent
Minority
Percent Young
Children/
Elderly**
FilmTec Corp.
(Plastics Manufacturing)
Edina, MN
Dimethyl Formamide, Diisocyanates,
Formaldehyde, Hexane, Phenylenediamine 6,828 14% 16% 5/23%
Liberty Casting Co., LLC
(Iron and Steel Foundry)
Delaware, OH
Lead, Manganese, Naphthalene, Phenol,
Xylene 6,899 33% 17% 7/12%
Maverick Corp.***
(Organic Chemical Manufacturing)
Blue Ash, OH
Methanol 2,163 15% 39% 7/10%
OGM Ltd., Clean Water Ltd.
(Off-Site Waste and Recovery)
Dayton, OH
Ethylbenzene, Methanol, Toluene, Xylene 3,015 45% 37% 8/12%
Perstorp Polyols, Inc.
(Organic Chemical Manufacturing)
Toledo, OH
Acetaldehyde, Acrolein, Formaldehyde,
Hexane, Methanol, Toluene 858 31% 19% 6/12%
* Source: EPA’s Enforcement and Compliance History Online (ECHO) database, available at echo.epa.gov.
** Children under 5 and adults over 65 years old.

16
TABLE C. Emissions Inventory vs. Toxics Release Inventory
Facility
Hazardous Air
Pollutant
Emitted
2014 TRI
Emissions (lbs/yr)
2014 NEI
Emissions (lbs/yr)
Evonik Corp.
(Organic Chemical Manufacturing)
Mapleton, IL
Chloromethane 1,503 6,317
Wood River Refinery
(Petroleum Refinery)
Roxana, IL
Butadiene 1,844 1
Cumene 1,162 9,986
Formaldehyde - 83,070
Hydrogen Sulfide 32,922 13,467
Naphthalene 2,863 10,441
American Iron Oxide Co.
(Steel Pickling)
Portage, IN
Chlorine 1,500 7,560
Hexane - 4,367
Harrison Steel Castings Co.
(Iron and Steel Foundry)
Attica, IN
Naphthalene 2,436 -
Phenol 10,129 4,640
Magnetics International
(Steel Pickling)
Burns Harbor, IN
HCl - 13,280
Kalsec, Inc.
(Organic Chemical Manufacturing)
Kalamazoo, MI
Hexane 56,172 102
Methanol 16,953 -
Spectro Alloys Corp.
(Secondary Aluminum Production)
Rosemont, MN
HCl 15,830 121,042
Perstorp Polyols, Inc.
(Organic Chemical Manufacturing)
Toledo, OH
Formaldehyde 6,100 33
* Source: Data from Toxics Release Inventory (TRI) and National Emissions Inventory (NEI), as displayed on USEPA website: “Enforcement and Compliance History
Online.”
17
TABLE D. Industrial Categories: Only Major Sources
Regulated
Source Category
Aerospace Manufacturing
Automobile and Light Duty Trucks Surface Coating
Boat Manufacturing
Cellulose Products Manufacturing
Friction Products Manufacturing
Hydrochloric Acid Manufacturing
Large Appliance Surface Coating
Lime Manufacturing
Mineral Wool Production
Nutritional Yeast Manufacturing
Off-Site Waste and Recovery Operations
Phosphate Fertilizer and Phosphoric Acid Manufacturing
Plywood and Composite Wood Products Manufacturing
Primary Aluminum Production
Pulp and Paper Industry
Rubber Tire Manufacturing
Semi-conductor Manufacturing
Ship Building and Ship Repair
Solvent Extraction for Vegetable Oil Production
Steel Pickling/HCl process Facilities
Wool Fiberglass Manufacturing
18
TABLE E. Examples of Specific Violations of Permit or Operating Limits
Facility Target
Pollutant
Emission Limit/Operating
Limit Violation
American Iron Oxide Co.
(Steel Processing)
Portage, IN
Acid Gases Maintain minimum temperature
to burn off organics.
Operated at lower temperature than required for
4,088 out of 6,722 days.
Harrison Steel Castings
(Iron and Steel Foundry)
Attica, IN
Arsenic, Lead,
Manganese,
Other Metal
Compounds
Particulate emissions cannot
exceed 0.1 lbs/ton or 0.006
lbs/dcsf when furnaces are
charged. Must install and run
baghouse leak detection systems.
No emission tests for particulate matter or leak
detection systems for two baghouses serving electric
arc furnaces and meltshop.
OGM Ltd, Clean Water Ltd.
(Off-Site Waste and Recovery)
Dayton, OH
Organic
hazardous air
pollutants
Maintain minimum temperature
in thermal oxidizer, and negative
pressure in closed vent system.
Thermal oxidizer temperature too low for 9 days in
2nd and 3rd quarter of 2015; negative pressure
limits not met for 20 days in 2nd and 3rd quarter,
2015.
United Taconite LLC
(Iron Ore Processing)
Forbes, MN
Arsenic,
Manganese,
other Metals
Scrubber water flow and
pressure must not fall below
levels established during
emissions testing.
Wet scrubber pressure below required level
between 10% and 40% of the time at 10 out of 33
units. Water flow below required levels more than
20% of the time at 6 of 15 units.
United Taconite LLC
(Iron Ore Processing)
Forbes, MN
Arsenic,
Manganese,
Other Metals
Particulate emissions removed
through baghouses. Cannot
exceed 0.01 grains per dry
standard cubic foot.
Bypassed baghouse 350 hours at furnace SV046 and
for 240 hours at furnaces SV048/049. Emissions
released directly to atmosphere.
3M Company
(Hazardous Waste Incinerator)
Cottage Grove, MN
Dioxin/Furan Hourly CO emissions cannot
exceed 100 ppm.
Discharged CO in excess of emission standard 108
days out of 1,495. Pollution control equipment not
used during this time. Includes 140 hours when limit
exceeded 1000 ppm and 391 hours when the limit
exceeded 500 ppm.
Nikkei MC Aluminum America
(Secondary Aluminum
Production)
Columbus, IN
Dioxin/Furan,
Organic
hazardous air
pollutants
Cannot fall below 3 hour average
temperature established during
performance test for chip dryers.
Fell below minimum temperature on more than 73
days from 2011 through 2014 for Chip Burner 2,
H1, and nearly 54 days 2011 thru 2014 for H2.

19
Facility Target
Pollutant
Emission Limit/Operating
Limit Violation
Gopher Resource, LLC
(Secondary Lead Smelting)
Eagan, MN
Lead
Operations must be enclosed and
meet numerical limits for
"negative pressure". Sample
volume must also be 70 dscf
when lead emissions tested (once
every five years).
Installed "windshields" at 2 of 3 monitors, which
blocked measurement of flow out of building; Failed
to record pressure level or violated pressure limits
8.8% of time in 2014. During tests, sample volume
was only 46.7 dcsf (less than 70% of required
volume).
Gopher Resource, LLC
(Secondary Lead Smelting)
Eagan, MN
Dioxin/Furan
Maintain minimum gas flow of
22,929 cubic feet per minute to
ensure temperatures high enough
to destroy dioxin/furan and meet
limits for those pollutants.
Gas flow was below required feedrate for 1044
hours (10.8% of the time) for East Reverbatory
Furnace between January 6, 2014, and March 8,
2015. No temperature limits established or
monitored at other furnaces.
* Source: Information pulled from notices of violations that EPA sent to the listed facilities between 2013 and the end of 2016. EIP obtained these notices of
violations through a Freedom of Information Act request.

20
NOTES:
1 “Reclassification of Major Sources as Area Sources Under Section 112 of the Clean Air Act,” Memorandum from William Wehrum, Assistant Administrator, Office of Air and Radiation, to Regional Administrators, US Environmental Protection Agency (January 28, 2018). https://www.epa.gov/stationary-sources-air-pollution/reclassification-major-sources-area-sources-under-section-112-clean. Accessed on 3/22/2018. 2 United States Census Bureau, “Income and Poverty in the United States: 2016,” Link: https://www.census.gov/library/publications/2017/demo/p60-259.html, Accessed 3/21/2018. 3 U.S. Environmental Protection Agency, “The Clean Air Act Amendments of 1990 List of Hazardous Air Pollutants,” Link: https://www3.epa.gov/airtoxics/orig189.html, Accessed 3/21/18 4 “Potential to Emit for MACT Standards – Guidance on Timing Issues,” from John Seitz, Director, Office of Air Quality Planning and Standards, to Linda Murphy, Region I, et. al., (May 16, 1995). https://www.epa.gov/sites/production/files/2015-08/documents/pteguid.pdf, Accessed 3/21/2018. 5 Most (though not all) industries are required to report their annual emissions and other releases to the Toxics Release Inventory every year. The chemicals that must be reported include hazardous air pollutants that are regulated under the Clean Air Act, as well as certain other toxic chemicals not regulated under that law. Companies are not required to report releases for any chemicals that are not manufactured, processed, or used above certain threshold amounts. EPA also publishes a National Emissions Inventory (NEI) every three years, based on industry reports submitted to the agency. Table A is based on the average annual emissions of releases reported to TRI between 2014 and 2016. We have added any emissions of hazardous air pollutants that are listed on the 2014 NEI (the latest version) that were not reported to TRI in that year to provide a more accurate estimate of average emissions from each plant. 6 U.S. Environmental Protection Agency, “AP-42: Compilation of Air Emission Factors,” Introduction (p. 2), Link: https://www3.epa.gov/ttn/chief/ap42/c00s00.pdf, Accessed 3/21/2018. 7 An “area source” is not a small business, but any industrial plant that claims its hazardous emissions fall below the 10 ton/25 ton threshold for major sources. 8 U.S. Environmental Protection Agency, “The Clean Air Act Amendments of 1990 List of Hazardous Air Pollutants,” Link: https://www3.epa.gov/airtoxics/orig189.html, Accessed 3/21/2018.


![GÖDEL’S LOOPHOLE F.E. GUERRA UJOL - WordPress.com · 08/11/2016 · GÖDEL’S LOOPHOLE F.E. GUERRA-PUJOL* Judge Phillip Forman: “[Germany] was under an evil dictatorship . .](https://static.fdocuments.us/doc/165x107/5ac41f237f8b9a220b8c92c0/gdels-loophole-fe-guerra-ujol-s-loophole-fe-guerra-pujol-judge-phillip.jpg)