Towers Watson Manager Research - gipsstandards.de...For Towers Watson and Towers Watson client use...
33
© 2012 Towers Watson. All rights reserved. Towers Watson Manager Research How we use fund performance data Harald Eggerstedt 13. März 2012
Transcript of Towers Watson Manager Research - gipsstandards.de...For Towers Watson and Towers Watson client use...

© 2012 Towers Watson. All rights reserved.
Towers Watson Manager ResearchHow we use fund performance data
Harald Eggerstedt
13. März 2012

towerswatson.com© 2012 Towers Watson. All rights reserved. Proprietary and Confidential. For Towers Watson and Towers Watson client use only.
Manager selection at Towers Watson
The goal is to find managers that exhibit a sustainable competitive advantage
We believe that successful managers exhibit certain repeating patterns or success factors
Qualitative manager research is key – there is a high luck to skill ratio in performance
Quantitative research helps to provide challenge
2
Our Philosophy

towerswatson.com© 2012 Towers Watson. All rights reserved. Proprietary and Confidential. For Towers Watson and Towers Watson client use only.
TW manager research: highly concentrated coverage
3
We carry out over 2,000 research meetings per yearand have met over 2,500 different managers
Managers
5,612
2,298
664
Products
24,218
7,681
2,340

towerswatson.com© 2012 Towers Watson. All rights reserved. Proprietary and Confidential. For Towers Watson and Towers Watson client use only.
‘Alignment’ supports long-term performance focus
Client interests
Asset managementcompany interests
Portfolio managerinterests
Alignment ofinterests
Co-investment
Employee ownership
Performance fees
What we look for:
4

towerswatson.com© 2012 Towers Watson. All rights reserved. Proprietary and Confidential. For Towers Watson and Towers Watson client use only.
Typical process for rating products
Head of stream signs off
Universe of managers
ASK signs off
Skill 1 considerations
Devil’s advocate
Engagement
Follow-up meetings
Follow-up desk-based research & conf calls
Initial research meetings
Desk-based research
Market knowledge, contacts, publications, databases
Experience/stability of team, fees, process/philosophy,quant analysis
Meet key people, detail on process, independent thoughts emails
Review manager’s research & quant output, further quant analysis
Sit in on internal meetings & investment discussions, meet more people
Fees, capacity framework, vehicles
One ASK member makes case against rating manager highly
Key points to cover before moving to a FREX 1 skill rating
ASK debates all key issues & decides whether to assign a FREX 1 skill rating
5
towerswatson.com© 2012 Towers Watson. All rights reserved. Proprietary and Confidential. For Towers Watson and Towers Watson client use only.
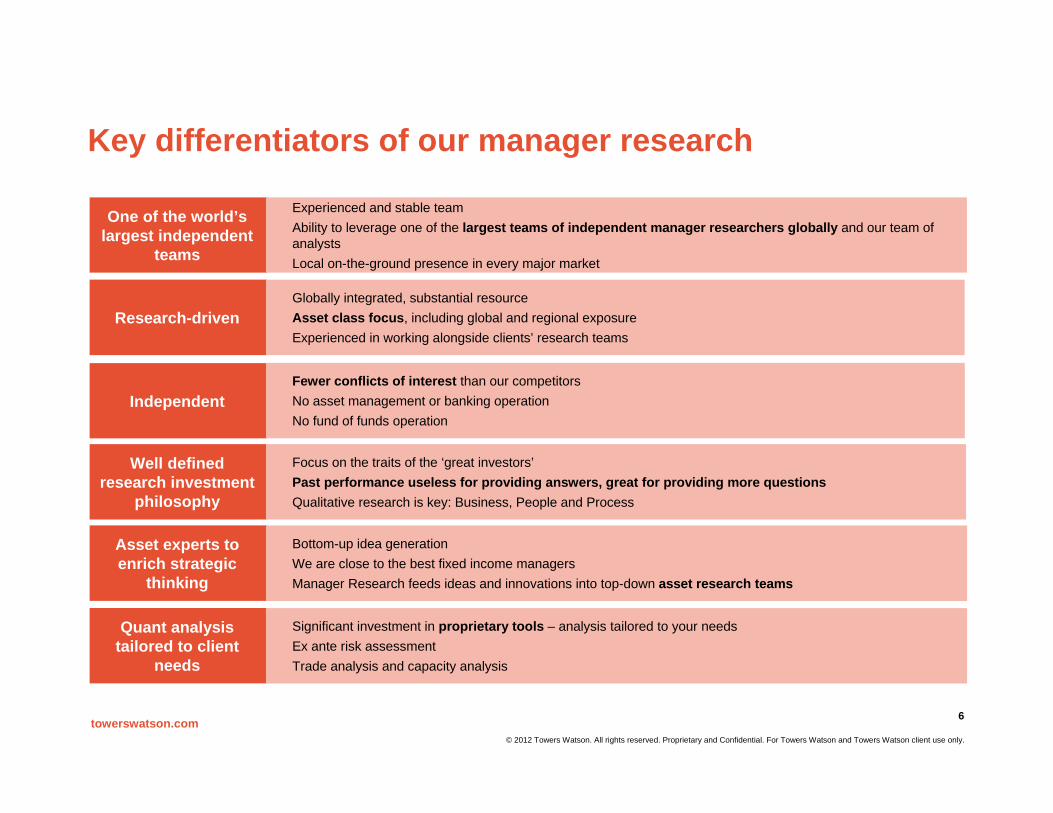
Independent
Well defined research investment
philosophy
Research-driven
Focus on the traits of the ‘great investors’Past performance useless for providing answers, great for providing more questionsQualitative research is key: Business, People and Process
Fewer conflicts of interest than our competitorsNo asset management or banking operationNo fund of funds operation
Globally integrated, substantial resource Asset class focus, including global and regional exposureExperienced in working alongside clients’ research teams
Asset experts to enrich strategic
thinking
Bottom-up idea generationWe are close to the best fixed income managersManager Research feeds ideas and innovations into top-down asset research teams
One of the world’s largest independent
teams
Experienced and stable teamAbility to leverage one of the largest teams of independent manager researchers globally and our team of analystsLocal on-the-ground presence in every major market
Quant analysis tailored to client
needs
Significant investment in proprietary tools – analysis tailored to your needsEx ante risk assessmentTrade analysis and capacity analysis
Key differentiators of our manager research
6
towerswatson.com© 2012 Towers Watson. All rights reserved. Proprietary and Confidential. For Towers Watson and Towers Watson client use only.
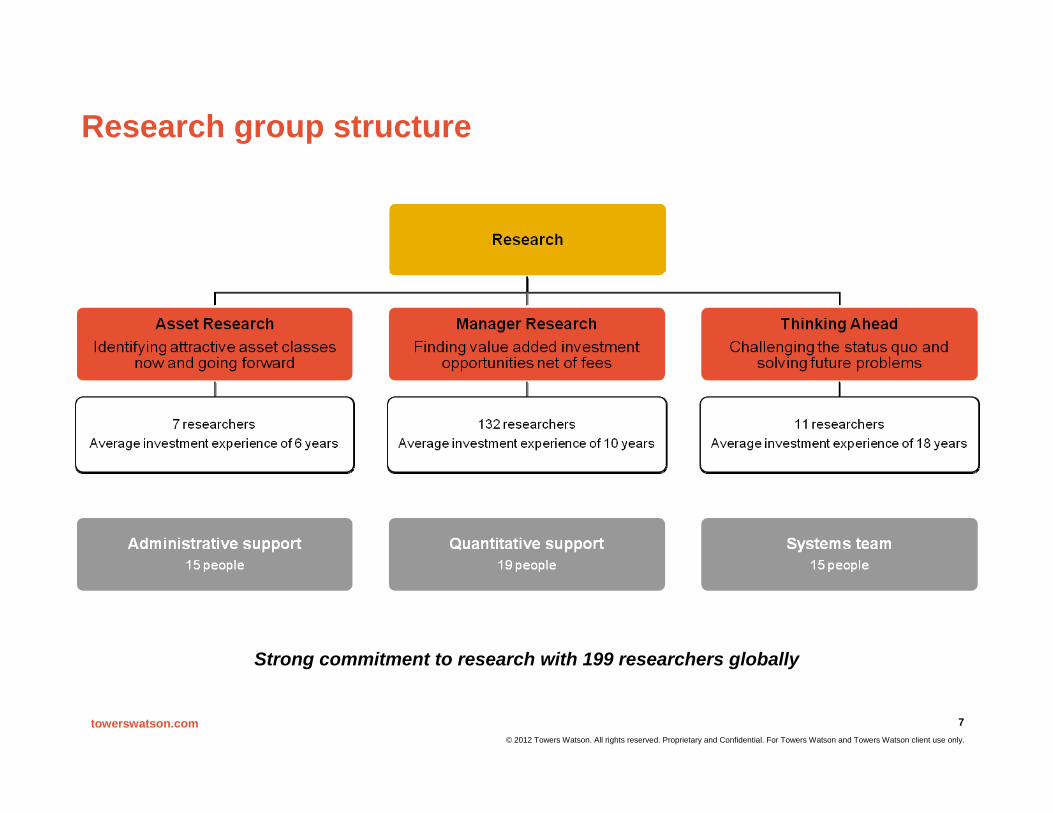
Research group structure
Strong commitment to research with 199 researchers globally
7

towerswatson.com© 2012 Towers Watson. All rights reserved. Proprietary and Confidential. For Towers Watson and Towers Watson client use only.
-
Manager research locations
8
Small decision making groups with an asset class focus - Area of Specialist Knowledge (‘ASK’) teams
European Research Team71 researchers
Asia Pacific Research Team30 researchers
Global Research Team132 researchers
(90 full-time equivalents)
Americas Research Team31 researchers

towerswatson.com© 2012 Towers Watson. All rights reserved. Proprietary and Confidential. For Towers Watson and Towers Watson client use only.
How does eVestment link to Dream?
TW and eVestment relationship
eVestment Alliance (eVestment) provides investment data and analytic technology to the institutional marketplace, and was founded in 2000 by former Watson Wyatt associates.
The Dream database is TW’s central repository for manager research. Prior to 2009, the database was maintained internally and focused on qualitative manager research. In January 2009, Towers Watson and eVestmentsigned a partnership agreement to jointly develop a global manager research platform. This agreement extended our long-standing relationship with eVestment in the US and Canada to a fully global relationship.
Under this agreement, eVestment serves as TW’s data collection engine for investment manager quantitative data. The information is captured through eVestment’sGlobal Database, which is an online questionnaire portal.
9
Investment Managers
DATA
DATA
Manager discovery &
due diligence
Manager selection exercises
Manager monitoring
reports
towerswatson.com© 2012 Towers Watson. All rights reserved. Proprietary and Confidential. For Towers Watson and Towers Watson client use only.
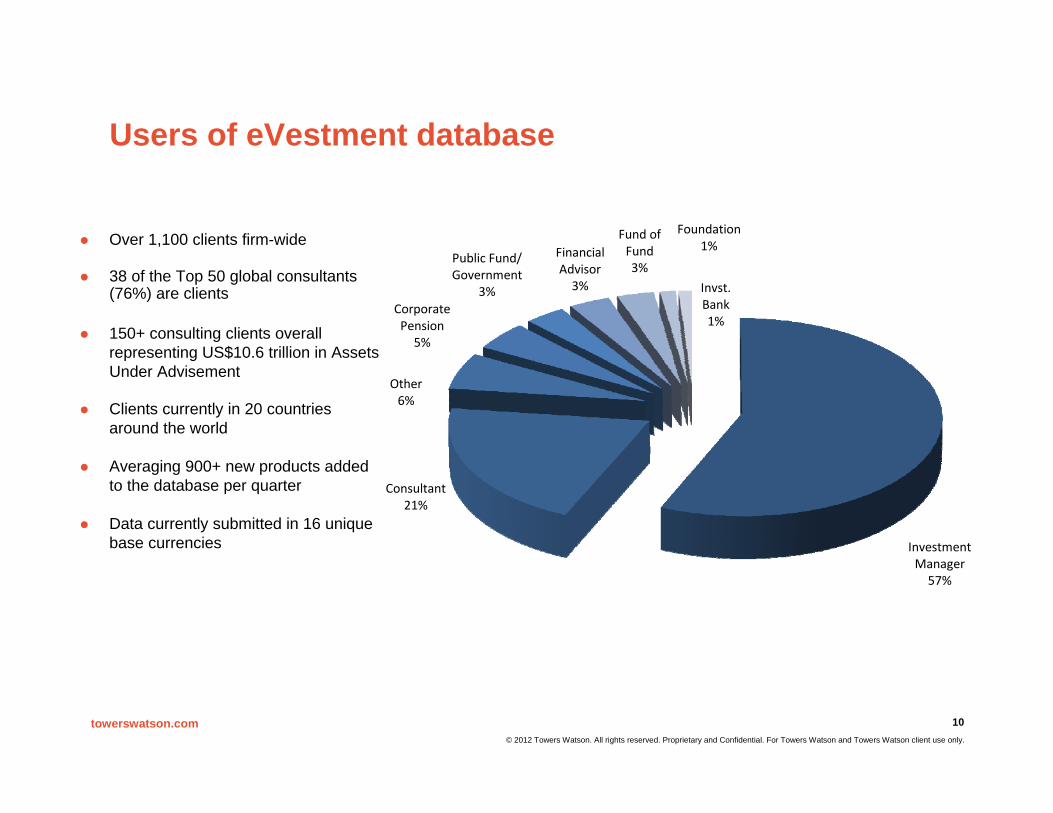
Over 1,100 clients firm-wide
38 of the Top 50 global consultants (76%) are clients
150+ consulting clients overall representing US$10.6 trillion in Assets Under Advisement
Clients currently in 20 countries around the world
Averaging 900+ new products added to the database per quarter
Data currently submitted in 16 unique base currencies Investment
Manager57%
Consultant21%
Other6%
Corporate Pension5%
Public Fund/Government
3%
Financial Advisor3%
Fund of Fund3%
Foundation1%
Invst. Bank1%
Users of eVestment database
10

towerswatson.com© 2012 Towers Watson. All rights reserved. Proprietary and Confidential. For Towers Watson and Towers Watson client use only.
… with overall database covering 95% of global institutional marketplace
eV: the largest institutional fund database
Dataset Equity Fixed Income BalancedAlts &
Hedge Funds Real Estate Total
United States 6,794 3,174 424 321 139 10,852
Canada 398 304 165 14 13 894
United Kingdom 182 200 3 5 35 425
Europe 479 253 8 54 41 835
Australia 267 96 6 5 12 386
Japan 226 7 0 11 1 245
Asia-Pacific ex-Japan 457 33 7 47 13 557
Global/EAFE/Emg Mkts 3,016 882 955 849 63 5,765
Totals 11,941 4,982 1,582 1,365 324 20,194
11
towerswatson.com© 2012 Towers Watson. All rights reserved. Proprietary and Confidential. For Towers Watson and Towers Watson client use only.
Introduction Towers Watson ‘Number Monkey’
12
The Number Monkey is a tool that analyses the performance of the manager and summarizes key statistics. In particular for active managers achieved alpha versus a target. The tool analyses the return series characteristics and estimates the possible performance attribution factors.
The tool allows us to graphically display, maximum drawdown, CUSUM analysis and various tests analysing the managers outperformance significance. The tool also evaluates several key statistics such as rolling IR's, tracking errors, Sharpe ratios, Value At Risk, market timing skills and other metrics that reveal more about the managers investment strategy.
Our long-term clients make us ponder the managers’ ability to add value over the entire market cycle. The Number Monkey allows us to view the managers’ performance under several economic environments and judge their ability to generate alpha over different macro and micro economic environments.

towerswatson.com© 2012 Towers Watson. All rights reserved. Proprietary and Confidential. For Towers Watson and Towers Watson client use only.
Relative return analysis (‘manager alpha’)
Things to look for
1. Any trends or cycles in the manager’s alpha over rolling 1, 3 and 5 year periods?
2. Did the manager’s ability to generate alpha differ depending on whether the market was in an up or a down cycle?
3. Does most of the alpha come from just a few months or is it fairly consistent over time?
13
towerswatson.com© 2012 Towers Watson. All rights reserved. Proprietary and Confidential. For Towers Watson and Towers Watson client use only.
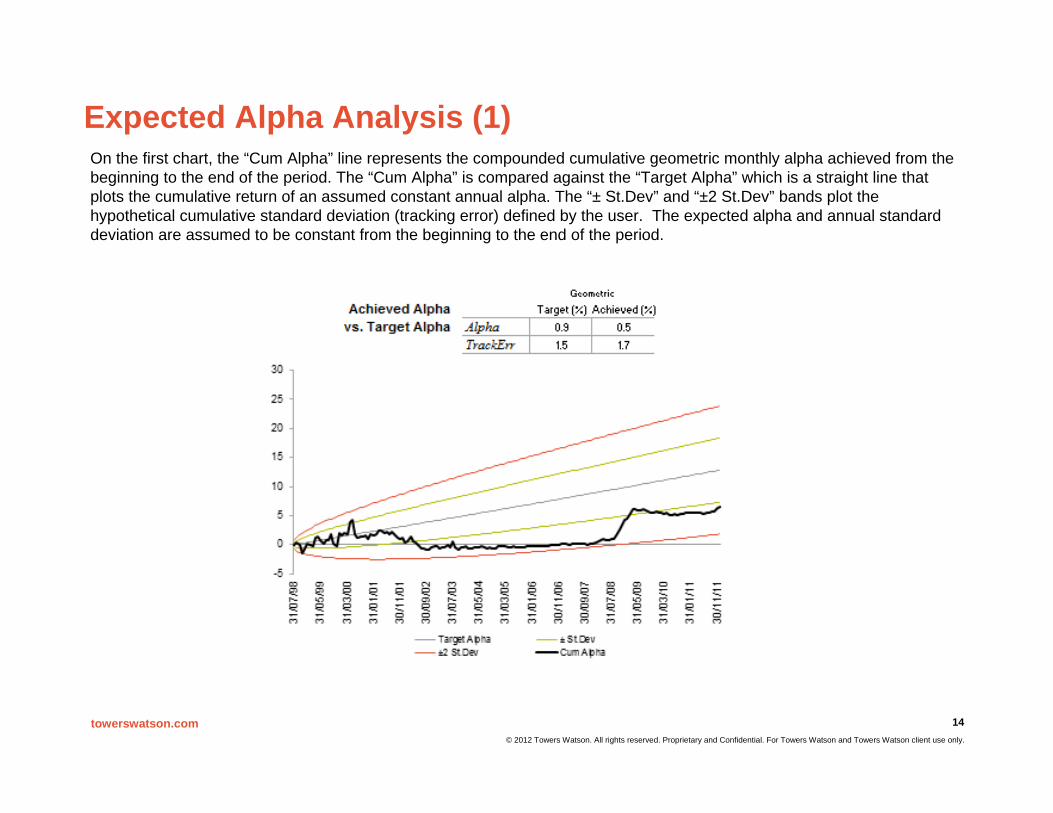
Expected Alpha Analysis (1)
14
On the first chart, the “Cum Alpha” line represents the compounded cumulative geometric monthly alpha achieved from the beginning to the end of the period. The “Cum Alpha” is compared against the “Target Alpha” which is a straight line that plots the cumulative return of an assumed constant annual alpha. The “± St.Dev” and “±2 St.Dev” bands plot the hypothetical cumulative standard deviation (tracking error) defined by the user. The expected alpha and annual standard deviation are assumed to be constant from the beginning to the end of the period.

towerswatson.com© 2012 Towers Watson. All rights reserved. Proprietary and Confidential. For Towers Watson and Towers Watson client use only.
Expected Alpha Analysis (2)
Things to look for
1. How does the realised performance compare to our prior expectations?
2. Is the performance outside our confidence bands, and should we be looking at changing our target risk and returns?
3. If the manager is currently below their target alpha, how extreme is the required return over the next year (in terms of number of std deviations) that will bring the manager’s performance back on track?
15
This chart shows the “simple” average alpha (i.e. no geometric compounding), as well as a 95% confidence interval that represents the area where the alpha is not statistically different from zero. The confidence intervals are calculated using the realised standard deviation up to the relevant date and the first 24 data points are ignored where standard error is very high. A positive alpha should be considered as an indication of the manager’s skills only if it statistically significant.

towerswatson.com© 2012 Towers Watson. All rights reserved. Proprietary and Confidential. For Towers Watson and Towers Watson client use only.
Summary Statistics
Things to look for
1. Any shifts relative to the longer term statistics?
2. How do these statistics compare with those of other funds?
3. What are the confidence intervals for the main statistics over the whole history?
16
The table summarises the values of various statistics over 1, 3, and 5 year periods as well as since inception (shown as Total). The statistics are: Relative return (Alpha pa) ; Tracking Error, (i.e. the standard deviation of the Alpha); IR (Information Ratio=Alpha/TE); Best monthly alpha during the period; Worst monthly alpha during the period; Regressed Alpha (value of the intercept calculated by regressing the manager’s performance against the benchmark); Regressed Beta (value of the slope calculated regressing the manager’s performance against the benchmark); Absolute return of the manager’s portfolio; Absolute Volatility (standard deviation of the absolute performance); Sharpe ratio = (Abs return - Risk free rate) / Abs volatility; Sortino ratio = (Abs return - Risk free rate) / Abs downside-semi-deviation). Numbers are all annualised with the exception of best and worst monthly returns.

towerswatson.com© 2012 Towers Watson. All rights reserved. Proprietary and Confidential. For Towers Watson and Towers Watson client use only.
Market Timing
Things to look for
1. Is manager able to assess the direction of the market and position the portfolio accordingly?
2. Did portfolio outperform the market when the index went up (down)? 17
Market timing analysis can help to understand better some characteristics of portfolio returns relative to benchmark and to provide different views on the embedded investment philosophy. An outstanding manager will demonstrate significant stock selection capabilities and successful market timing skills at all market phases.
The quadratic parameter (gamma) measures timing capabilities: a positive gamma will indicate that timing activities have added value to portfolio performance. Comparing the gammas of different funds will indicate the relative importance of timing activities in their investment policies. As usual, we have to be sure that the model we use fits our data. To trust any outcome of a regression model we have to justify that R-square is high.
The capture ratio is an indicator of portfolio performance relative to benchmark at different market phases. It measures compound return of a portfolio over compound return of its benchmark when the benchmark is up (upside capture ratio) or down (downside capture ratio). If the upside ratio is greater than 1 (downside ratio less than 1), this means that the portfoliobeat the benchmark in upmarket (downmarket).

towerswatson.com© 2012 Towers Watson. All rights reserved. Proprietary and Confidential. For Towers Watson and Towers Watson client use only.
Drawdown Analysis
Things to look for
1. How frequently does the manager produce negative returns?
2. How long does it take the manager to make back the money he lost?
3. When would have been the worst possible time for a new investor to invest in the fund and how much would he have lost?
18
The drawdown chart highlights periods when a manager produced negative returns, how big was the subsequent drop in performance, and how long did it take the manager to fully recover from this period of negative performance. This is particularly useful for accessing funds that claim to preserve capital or funds with high water marks in their fee structures.

towerswatson.com© 2012 Towers Watson. All rights reserved. Proprietary and Confidential. For Towers Watson and Towers Watson client use only.
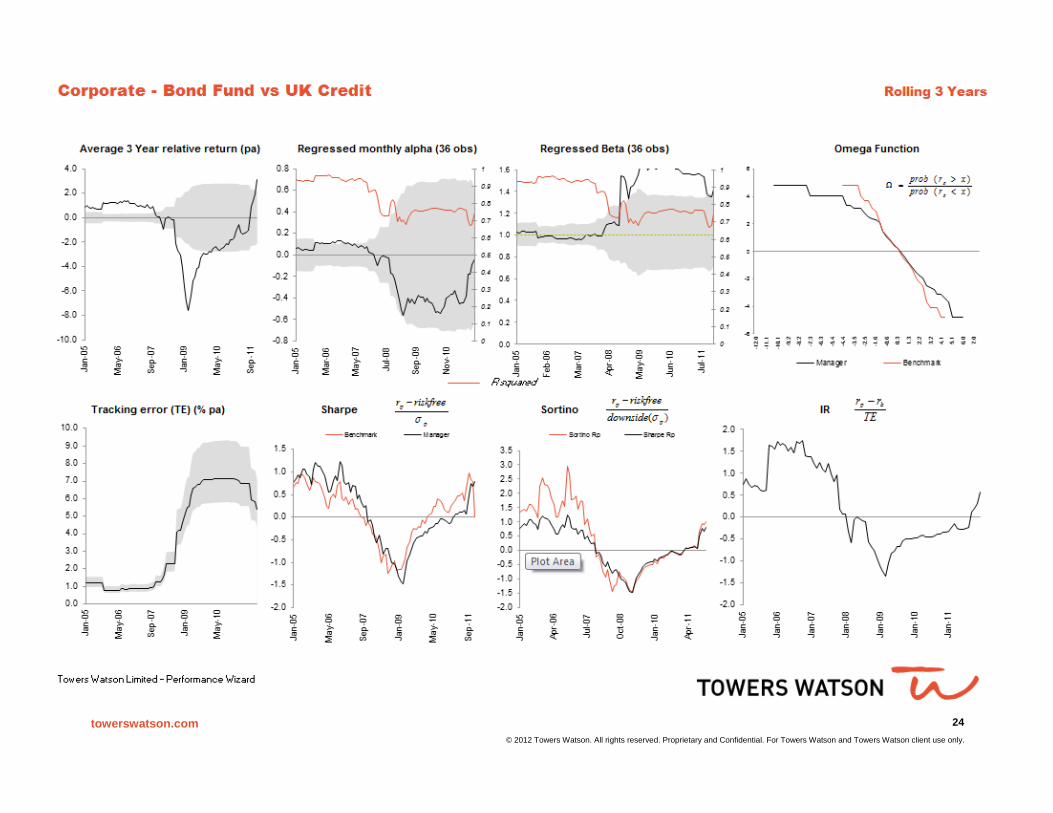
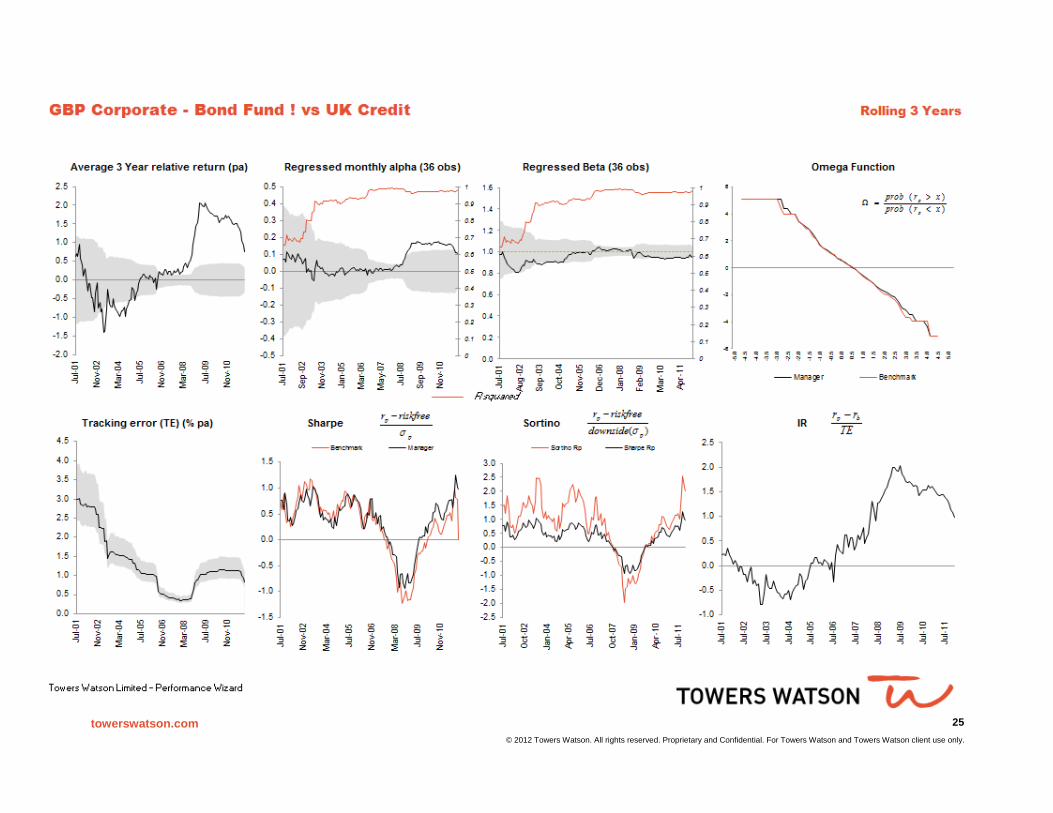
3 Year Rolling Analysis
Things to look for
1. Look for when relative returns, regressed alpha and beta became statistically significant, and if it was persistent or only temporary.
2. If the rolling 3 year statistics never fall outside the confidence bands, then the manager is statistically the same as the benchmark on that particular measure
19
Average 3 Year relative returns (pa) Chart The chart plots the rolling 3 years monthly Alpha (or relative return) with the 95% confidence intervals, which represent the area where the alpha is not statistically different from zero. If the alpha is outside the bands, then the manager’s performance is statistically different to the benchmark. Normality of returns is assumed to plot the confidence interval.
Ann Regressed alpha (36 obs) Chart The black line represents the value of the intercept calculated by regressing rolling 36 months of returns against the benchmark. As in the previous chart, the bands represent the interval where the alpha is not statistically significant. The light orange line is the R squared of the regression: the higher the R squared value the higher the reliability of the regression. Since this is a linear regression, the value of the R squared varies between 0 (the regression is not saying anything) and 1 (all the variance is explained by the model).
Regressed Beta (36 obs) Chart The calculations for this chart are the same as for the regressed alpha chart but the value of the slope (beta) is plotted instead of the intercept (alpha). If the black line is between the confidence intervals, then the beta of the manager is not statistically different from 1.

towerswatson.com© 2012 Towers Watson. All rights reserved. Proprietary and Confidential. For Towers Watson and Towers Watson client use only.
20
Corporate - Bond Fund vs UK Credit Since Inception till Dec-11
Relative return analysis Achieved Alpha Target (%) Achieved (%)vs. Target Alpha Alpha 0.9 -0.2
TrackErr 1.5 4.0
in rising market in falling market
Summary statistics
5Y 3Y 1YDescription
Conf IntervalRelative Return (%) -0.22 [-0.2, 1.2] -1.3 3.0 1.9Tracking error (%) 4.00 [3.6, 4.4] 5.6 5.4 1.0IR -0.06 -0.2 0.6 2.0Best monthly outp (%) 4.16 n/a 4.2 4.2 0.6Worst monthly outp (%) -5.93 n/a -5.9 -4.4 -0.3Regr Alpha (%) -0.14 [-0.2, 0.3] -0.2 0.0 0.2Regr Beta 1.30 [0.85, 1.16] 1.4 1.4 0.9Absolute Return (%) 5.22 [2.8, 5.6] 3.4 11.7 8.9Absolute volatility (%) 7.51 [6.7, 8.3] 9.8 9.6 4.5Sharpe ratio 0.16 -0.1 0.8 1.1Sortino ratio 0.18 -0.1 1.0 3.6
Towers Watson Limited - Performance Wizard
Monthly
Geometric
Market Timing
Beat the benchmark in upmarket
Total10Ys 0Ms
Downside Capture 1.28
Not beat the benchmark in downmarket
Quadratic parameter
0.00
Upside Capture 1.27
-20
-15
-10
-5
0
5
10
15
20
25
Jan-
02
Jul-0
2
Jan-
03
Jul-0
3
Jan-
04
Jul-0
4
Jan-
05
Jul-0
5
Jan-
06
Jul-0
6
Jan-
07
Jul-0
7
Jan-
08
Jul-0
8
Jan-
09
Jul-0
9
Jan-
10
Jul-1
0
Jan-
11
Jul-1
1
Roll 1Y %pa Roll 3Y %pa Roll 5Y %pa
-25
-20
-15
-10
-5
0
5
10
15
20
25
31/0
1/02
30/1
1/02
30/0
9/03
31/0
7/04
31/0
5/05
31/0
3/06
31/0
1/07
30/1
1/07
30/0
9/08
31/0
7/09
31/0
5/10
31/0
3/11
Target Alpha ± St.Dev±2 St.Dev Cum Alpha
y = -12.561x2 + 1.3809x + 0.0011R² = 0.7964
-12%
-10%
-8%
-6%
-4%
-2%
0%
2%
4%
6%
8%
-6% -4% -2% 0% 2% 4% 6%
Manager return
Benchmark return

towerswatson.com© 2012 Towers Watson. All rights reserved. Proprietary and Confidential. For Towers Watson and Towers Watson client use only.
21

towerswatson.com© 2012 Towers Watson. All rights reserved. Proprietary and Confidential. For Towers Watson and Towers Watson client use only.
22
Corporate - Bond Fund vs UK Credit Since Inception till Dec-11
DrawDown (absolute returns)
95% c.l. Fund BenchmarkVaR -3.2% -1.9%Modified VaR -3.7% -2.0%CVaR -6.0% -2.9%Active VaR -2.0%Modified Active VaR -2.2%Active CVaR -4.0%
Moments of the distributionMean Standard DeviationSkewnessKurtosis (excess)
Distribution does NOT look normalDistribution DOES exhibit serial correlation
CUSUM and Likelihood IR CUSUM Likelihood Alarm
8Y 0Qs
0.524345 1.46596611.027035 1.0005124
0.7747 0.7747-1.4457 -0.3372
0.065957 0.12926591.003272 0.89663934.203027 2.53942644.169984 3.2951314
0.094058 -1.086729
Towers Watson Limited - Performance Wizard
Relative Return Distribution Analysis
Average Relative Return Analysis (first 2Y ignored)
0.0%1.2%-1.48.9
0
10
20
30
40
50
60
-5.7
-4.5
-3.3
-2.1
-0.9 0.3
1.5
2.7
3.9
5.1-30
-25
-20
-15
-10
-5
0
Jan-
02
Jan-
03
Jan-
04
Jan-
05
Jan-
06
Jan-
07
Jan-
08
Jan-
09
Jan-
10
Jan-
11
-12
-10
-8
-6
-4
-2
0
2
4
60
5
10
15
20
25
30
35
Jan-
02
Aug-
02
Mar
-03
Oct
-03
May
-04
Dec
-04
Jul-0
5
Feb-
06
Sep-
06
Apr-
07
Nov
-07
Jun-
08
Jan-
09
Aug-
09
Mar
-10
Oct
-10
-0.4
-0.3
-0.2
-0.1
0
0.1
0.2
0.3
0.4
Jan-
04
Jan-
05
Jan-
06
Jan-
07
Jan-
08
Jan-
09
Jan-
10
Jan-
11

towerswatson.com© 2012 Towers Watson. All rights reserved. Proprietary and Confidential. For Towers Watson and Towers Watson client use only.
23
Since Inception till Dec-11
95% c.l. Fund BenchmarkVaR -1.8% -1.8%Modified VaR -1.8% -1.8%CVaR -2.6% -2.7%Active VaR -0.8%Modified Active VaR -0.7%Active CVaR -1.4%
Moments of the distributionMean Standard DeviationSkewnessKurtosis (excess)
Distribution does NOT look normalDistribution does not exhibit serial correlation
8Y 0Qs
0.094838 0.30575711.908117 0.2032056
2.165 0.1311-2.2179 -0.0875
0.043769 0.02346970.926853 1.02067676.045654 1.37921734.371293 3.6028612
1.019432 -3.609606
Relative Return Distribution Analysis
Average Relative Return Analysis (first 2Y ignored)
0.0%0.5%0.06.2
-10
0
10
20
30
40
50
60
70
80
-2.9
-2.3
-1.7
-1.1
-0.5 0.
20.8
1.4
2.0
2.6
-0.6
-0.4
-0.2
0
0.2
0.4
0.6Jul-00
Jul-01
Jul-02
Jul-03
Jul-04
Jul-05
Jul-06
Jul-07
Jul-08
Jul-09
Jul-10
Jul-11
GBP Corporate - Bond Fund ! vs UK Credit
DrawDown (absolute returns)
CUSUM and Likelihood IR CUSUM Likelihood Alarm
Towers Watson Limited - Performance Wizard
-7
-6
-5
-4
-3
-2
-1
0Jul-98
Jul-99
Jul-00
Jul-01
Jul-02
Jul-03
Jul-04
Jul-05
Jul-06
Jul-07
Jul-08
Jul-09
Jul-10
Jul-11
-3
-2
-1
0
1
2
3
4
50
5
10
15
20
25
30
Jul-98
Feb-99
Sep-99
Apr-00
Nov-00
Jun-01
Jan-02
Aug-02
Mar-03
Oct-03
May-04
Dec-04
Jul-05
Feb-06
Sep-06
Apr-07
Nov-07
Jun-08
Jan-09
Aug-09
Mar-10
Oct-10
towerswatson.com© 2012 Towers Watson. All rights reserved. Proprietary and Confidential. For Towers Watson and Towers Watson client use only.
24
towerswatson.com© 2012 Towers Watson. All rights reserved. Proprietary and Confidential. For Towers Watson and Towers Watson client use only.
25

towerswatson.com© 2012 Towers Watson. All rights reserved. Proprietary and Confidential. For Towers Watson and Towers Watson client use only.
Corporate - Bond Fund vs UK Credit
Market cycle analysisBenchmark Maturity spread: Long - Short Quality spread: BBB - AAA
Bull market Bear Market 15+ 0-5 BBB AAA
Pos 43 22 Pos 38 27 Pos 45 20
Neg 33 22 Neg 34 21 Neg 27 28
-40-30-20-10
01020304050
-40-30-20-10
01020304050
-40-30-20-10
01020304050
Maturity Factors: 3Y Rolling Performance Quality Factors: 3Y Rolling Performance
0
-5
0
5
0
5
Dez
04
Okt
05
Aug
06
Jun
07
Apr
08
Feb
09
Dez
09
Okt
10
Aug
11
Long Short 3 Year Relative Return
-10
-5
0
5
10
15
20
25D
ez 0
4
Okt
05
Aug
06
Jun
07
Apr 0
8
Feb
09
Dez
09
Okt
10
Aug
11
BBB AAA 3 Year Relative Return
26
towerswatson.com© 2012 Towers Watson. All rights reserved. Proprietary and Confidential. For Towers Watson and Towers Watson client use only.
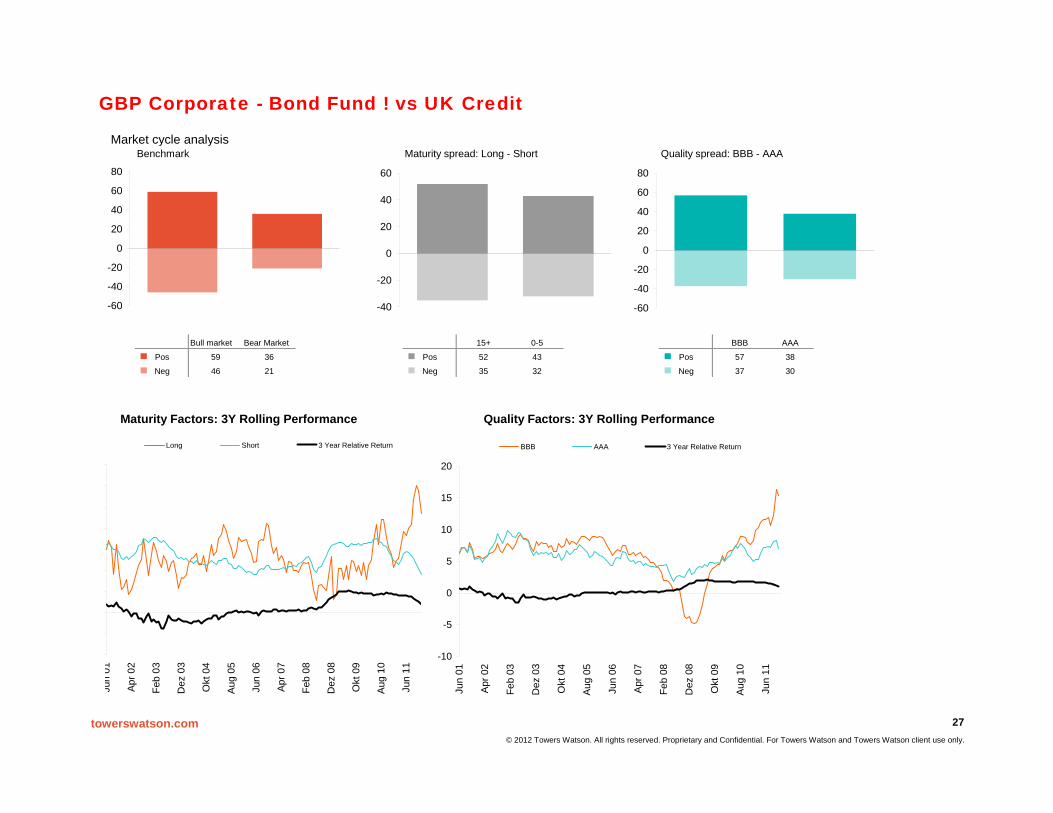
GBP Corporate - Bond Fund ! vs UK Credit
Market cycle analysisBenchmark Maturity spread: Long - Short Quality spread: BBB - AAA
Bull market Bear Market 15+ 0-5 BBB AAA
Pos 59 36 Pos 52 43 Pos 57 38
Neg 46 21 Neg 35 32 Neg 37 30
-60
-40
-20
0
20
40
60
80
-40
-20
0
20
40
60
-60
-40
-20
0
20
40
60
80
Maturity Factors: 3Y Rolling Performance Quality Factors: 3Y Rolling Performance
Jun
01
Apr 0
2
Feb
03
Dez
03
Okt
04
Aug
05
Jun
06
Apr 0
7
Feb
08
Dez
08
Okt
09
Aug
10
Jun
11
Long Short 3 Year Relative Return
-10
-5
0
5
10
15
20Ju
n 01
Apr 0
2
Feb
03
Dez
03
Okt
04
Aug
05
Jun
06
Apr 0
7
Feb
08
Dez
08
Okt
09
Aug
10
Jun
11
BBB AAA 3 Year Relative Return
27

towerswatson.com© 2012 Towers Watson. All rights reserved. Proprietary and Confidential. For Towers Watson and Towers Watson client use only.
Towers Watson Manager Research Model Portfolios
What else should I note?
What are they used for?
How are they run?
What are they?
Fee structures are becoming increasingly complex, hence some simplifying assumptions are necessary to allow us to proxy the exact fees on a quarterly basis
The transaction cost applied for transitioning between products is an approximation Model portfolios generally ignore practical implementation costs, which may be incurred outside of
the vehicle, such as tax, legal and custody The model portfolios may not be investible by a client at a point in time as some of the products
may currently be closed to new business Towers Watson never rely solely on performance when assessing managers. Clients, too, should
not just rely on the model performance numbers when assessing Towers Watson, but develop an understanding of the Towers Watson philosophy and process
Towers Watson believes that short-term performance contains very limited information on skill, hence the model portfolio track records are only displayed once they have at least a three-year track record and there is a preference to focus on since inception returns
Despite potentially having more than a ten-year track record, one model on its own does not demonstrate skill with much statistical significance
The models cannot fully replicate the complexities of the real world
The models aim to demonstrate Towers Watson’s skill in manager research, in particular the ability to select managers and structure portfolios
They replicate, as accurately as possible, how Towers Watson would run a similar client mandate The aim is to maximise the net information ratio whilst also delivering an attractive level of return
To demonstrate Towers Watson’s skill in manager research
Each model assumes an initial account size (typically £500m or £100m), benchmark, base currency and makes assumptions for transaction costs
The manager research team discusses changes to model portfolios and portfolio construction before officially proposing changes to be implemented from the start of the next quarter
Performance is sourced each quarter and a management fee for a typical Towers Watson client is removed to generate realistic net return numbers
Investment decisions are proposed and tracked on a quarterly basis
Model portfolios are run by the Towers Watson manager research team in the same way as if they were given delegate responsibility for client assets in a particular asset class
A theoretical multi-manager portfolio
28

towerswatson.com© 2012 Towers Watson. All rights reserved. Proprietary and Confidential. For Towers Watson and Towers Watson client use only.
‐2
‐1
0
1
2
3
4
5
6
7
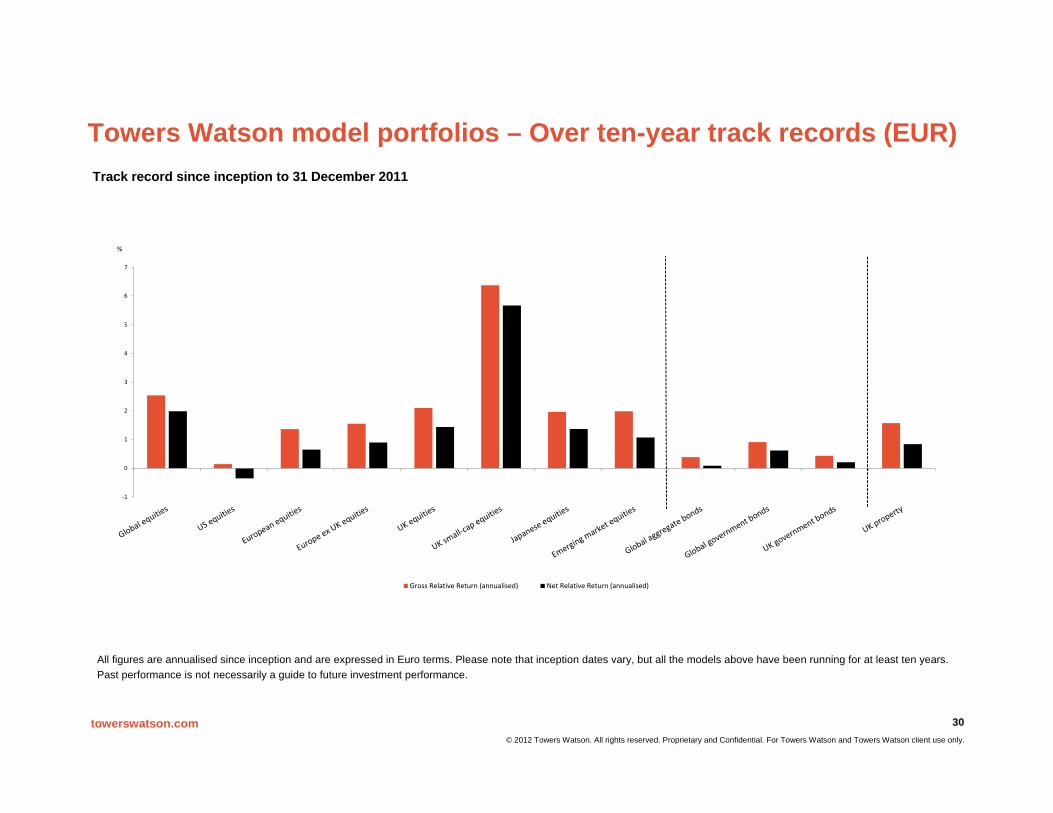
Gross Relative Return (annualised) Net Relative Return (annualised)
%
Towers Watson model portfolios – All (EUR)
29
Track record since inception to 31 December 2011
All figures are annualised since inception and are expressed in Euro terms. Please note that inception dates vary, but all the models above have been running for at least three years.Past performance is not necessarily a guide to future investment performance.
n/an/a n/an/a
towerswatson.com© 2012 Towers Watson. All rights reserved. Proprietary and Confidential. For Towers Watson and Towers Watson client use only.
‐1
0
1
2
3
4
5
6
7
Gross Relative Return (annualised) Net Relative Return (annualised)
%
Towers Watson model portfolios – Over ten-year track records (EUR)
30
Track record since inception to 31 December 2011
All figures are annualised since inception and are expressed in Euro terms. Please note that inception dates vary, but all the models above have been running for at least ten years.Past performance is not necessarily a guide to future investment performance.

towerswatson.com© 2012 Towers Watson. All rights reserved. Proprietary and Confidential. For Towers Watson and Towers Watson client use only.
Model inception dates and benchmarks
31
Model Inception Date BenchmarkGlobal equities 01/01/2000 MSCI World (ND)EAFE equities 01/01/2003 MSCI EAFE (ND)US equities 01/01/2000 S&P 5001
US small-cap equities 01/01/2006 Russell 2500European equities 01/01/2000 FTSE W EuropeEurope ex UK equities 01/01/2000 FTSE W Europe ex UKUK equities 01/01/2000 FTSE All-ShareUK small-cap equities 01/01/2000 FTSE Small-Cap ex ITAsia ex Japan equities 01/10/2002 MSCI AC Asia ex Japan (GD)2
Japanese equities 01/01/2000 TopixHong Kong equities 01/07/2005 FTSE MPF Hong Kong3
Australian equities 01/04/2003 ASX/S&P 300Emerging market equities 01/01/2000 MSCI EM (GD)Unconstrained equities 01/01/2005 MSCI World (ND) 4
Global aggregate bonds 01/10/2001 Composite of manager benchmarks5
Global government bonds 01/01/2000 Composite of manager benchmarks6
Global credit bonds 01/01/2004 Composite of manager benchmarks7
Global high yield bonds 01/07/2006 Composite of manager benchmarks8
US fixed income bonds 01/01/2003 Barclays US UniversalEuro aggregate bonds 01/10/2002 Composite of manager benchmarks9
Euro credit bonds 01/01/2007 Composite of manager benchmarks10
UK aggregate bonds 01/04/2002 Composite of manager benchmarks11
UK government bonds 01/01/2000 Composite of manager benchmarks12
UK credit bonds 01/01/2003 Composite of manager benchmarks13
Australian fixed income bonds 01/04/2003 UB SA CompositeEmerging market debt 01/04/2002 Composite of manager benchmarks14
Global listed property securities 01/01/2007 FTSE EPRA/NAREIT Global Developed UK property 01/01/2000 HSBC All Balanced Funds IndexLong-short equities 01/01/2005 HFRI Equity Hedge (Total) IndexBroad hedge funds 01/01/2008 HFRI Fund of Funds Composite IndexCore fund of hedge funds 01/04/2007 HFRI Fund of Funds Composite IndexNiche fund of hedge funds 01/04/2007 HFRI Fund of Funds Composite Index
Notes
1. Model portfolio was measured against the FTSE AW USA, until 31 March 2002, when the benchmark was changed to the S&P 500
2. MSCI Far East ex Japan since inception until 30/06/2006 when it changed to MSCI AC Asia ex Japan
3. 90% FTSE HK + 10% HSBC since inception until 30/09/2009 when it changed to FTSE MPF HK
4. Model was measured against MSCI World until 30 September 2011 after which the benchmark changed to MSCI AC World
5. Benchmark is a composite of the hedged and un-hedged Barclays Capital Global Aggregate Index
6. Benchmark is Citigroup WGBI or similar7. Benchmark is Barclays Global Aggregate – Credit or similar8. The Global High Yield model includes European, US and
Global high yield strategies all measured against the managers respective benchmarks
9. Composite of Barclays Capital Euro Aggregate and iBoxxEuro BIG Index
10. Composite of Barclays Capital Euro Aggregate Credit and Corporate and iBoxx Euro Corporates
11. Benchmark is Merill Lynch Sterling Broad or similar12. Benchmark is FTSE Gilts All Stocks or similar13. Benchmark is Merill Lynch Sterling Non-Gilts or similar14. Benchmark was JP EMBI+ since inception to 31/03/2006
when it changed to the JP EMBI Global Diversified, until 31/12/2006. Now measured against a Composite of the JPM EMBI Global Diversified and the JPM GBI-EM
towerswatson.com© 2012 Towers Watson. All rights reserved. Proprietary and Confidential. For Towers Watson and Towers Watson client use only.
Summary
TW has an extensive global research infrastructure designed to assist clients in their strategy formulation, risk management and manager selection needs
Our manager valuation is not ‚quant‘-driven, but based on a qualitative analysis (business, people, process). Performance data are used to check whether product strategies are implemented successfully and consistently over time.
We look for sustainable outperformance after fees over 3 or (better) 5 years
eVestment Alliance allows us easy access to performance data, however, we depend on the managers‘ willingness to feed high-quality data into the database
Our systems allow us to run detailed relative return analyses, which help us to assess a manager‘s style and his ability to adjust to changes in market conditions
Quantitative data play an important role in our ‚Manager Watch‘ process (for top-rated managers) and in fiduciary mandates
We run ‚model portfolios‘ across a wide range of products in order to monitor our own success in selecting ‚best in class‘ managers
32

towerswatson.com© 2012 Towers Watson. All rights reserved. Proprietary and Confidential. For Towers Watson and Towers Watson client use only.
Disclaimer
Towers Watson has prepared this document for marketing purposes only. No action should be taken based on this document as it does not include any detailed analysis into your own scheme specifics.
In preparing this document we have relied upon data supplied to us by third parties. Whilst reasonable care has been taken to gauge the reliability of this data, we provide no guarantee as to the accuracy or completeness of this data and Towers Watson cannot be held accountable for any errors or misrepresentations in the data made by any third party.
This document is provided to the recipients solely for their use, for the purpose indicated. This document is based on information available to Towers Watson at the date of the document and takes no account of subsequent developments after that date. It may not be modified or provided by the recipients to any other party without Towers Watson’s prior written permission, except as may be required by law. In the absence of our express written agreement to the contrary, Towers Watson and its directors, officers and employees accept no responsibility and will not be liable for any consequences howsoever arising from any third party's use of or reliance on this document or the opinions we have expressed.
The terms “Towers Watson”, “we”, “our” or “us” above mean Towers Watson Limited and Towers Watson Investment Services, Inc, both Towers Watson companies, as well as all other entities directly or indirectly owned or controlled by Towers Watson & Co. Towers Watson Limited is authorised and regulated by the Financial Services Authority. Towers Watson Investment Services, Inc., is a registered investment adviser with the Securities and Exchange Commission.
33